 Xin Shen1
 Jianlin Tang
- 1Measurement Center, Yunnan Power Grid Co., Ltd., Kunming, China
- 2Electric Power Research Institute of China Southern Power Grid (CSG), Guangzhou, China
- 3Guangdong Provincial Key Laboratory of Intelligent Measurement and Advanced Metering of Power Grid, Guangzhou, China
As global temperatures rise and climate change becomes more severely. People realize that air conditioning systems as a controllable resource and play an increasingly important role in reducing carbon emissions. In the past, the operation optimization of air conditioning systems was mainly oriented to user comfort and electricity costs ignoring the long-term impact on the environment. This article aims to establish a multi-objective model of air-conditioning load to ensure user temperature comfort performance and reduce the total cost (i.e., electricity cost and carbon emission cost) simultaneously. Multi Sand Cat Swarm Optimization (MSCSO) algorithm combined with gray target decision-making (GTD) is used to explore optimal solution. Meanwhile four competitive strategies are applied to validate the effectiveness of the proposed method, i.e., genetic algorithm (GA), MSCSO-comfort objective, MSCSO-total electricity cost objective and unoptimization. The simulation results show that the MSCSO-GTD based objective method can significantly reduce total costs while taking into account appropriate indoor temperature comfort.
1 Introduction
With increasing societal attention to energy sustainability (Wang et al., 2022) and global warming (Wiriyasart and Kaewluan, 2024), experts in the power systems field are continuously exploring new methods to reduce carbon emissions and steer the power systems towards a more sustainable direction (Hu and Yi, 2023). The building industry accounts for approximately 40% of the global electricity consumption with air conditioning constituting over 50% of the total energy consumption within buildings (Wijaya et al., 2022; Silva et al., 2023). According to statistics, there are currently 1.2 billion air conditioners in daily use globally and this number is expected to rise to 4.5 billion by 2050 (Fikiin, 2018). Against the backdrop of the carbon neutrality goals outlined in the Paris Agreement (Reyseliani et al., 2022). Meanwhile the government and related enterprise focusing on carbon emission reduction, and cost accounting for carbon emissions is the necessary premise of carbon reduction and objects which should further attention (Hu et al., 2022). Air conditioning systems as a significant burden on the power system, not only directly impact the stability and efficiency of the power system but also have profound implications for the environmental carbon emission levels (Yang ZX. et al., 2022).
Currently, research on carbon emissions in the power sector has become one of the hot topics in the field of power systems. Past studies primarily focused on assessing and reducing the carbon footprint of the overall power system (Shi et al., 2023). However, current optimization scheduling of air conditioning systems often emphasizes improving user comfort (Hernández et al., 2022) and reducing electricity costs with relatively less attention given to their contribution to carbon emission reduction as referenced (Jung and Jazizadeh, 2019; Huang et al., 2022). Air conditioning systems have significant potential to reduce the cost of carbon source energy and lower overall energy costs. Additionally the aggregation and coordinated control of air conditioning systems not only quickly alleviate peak load pressures on the power grid (Xie et al., 2022) but also provide various load transfer and adjustment assistance methods, contributing to the stable and efficient operation of the grid (Dong et al., 2023). Against the backdrop of the “dual carbon goals” aiming to reduce carbon emissions in the power system while ensuring its efficiency. It is necessary to reexamine the strategies for controlling the operation of air conditioning systems.
Li et al. (2021) proposed a single-objective optimization method during air conditioning usage, which combined weighted user comfort and energy consumption to minimize overall consumption. This approach provides a comprehensive assessment of air conditioning usage. In WuCao et al. (2023), a personal comfort model was established to optimize and control air conditioners. This model optimizes air conditioning operation based on electricity prices, outdoor temperatures, and user preferences, significantly reducing electricity costs while effectively maintaining user comfort. Satisfactory decision results are achieved using a multi-objective air conditioning optimization method based on user comfort and energy consumption. Bingham et al. (2017), Ohta and Sato (2018), Elnour et al. (202) employed a neural network-based model to control building air conditioning systems reducing energy consumption by up to 46% without compromising indoor comfort and air quality, providing valuable insights for reducing energy costs in air conditioning systems. Hu et al. (2019) explored air conditioning frequency control in response to smart grids building upon real-time dynamic electricity prices, endowing air conditioning with price responsiveness and grid interactivity. Lin et al. (2022) presented a multi-objective optimization model based on air conditioning energy consumption and thermal comfort, yielding well-balanced decision results.
Kuo et al. (2017) developed a low-carbon and economic dispatch planing for isolated power systems, which offers a significant tool for this field. Utilizing dynamic approaches for carbon assessment, the study captures the characteristics of the electricity grid’s generation mix (Khan et al., 2018). When air conditioner operates as a controllable load, a dual-layer economic scheduling model is introduced, emphasizing source-load coordination for carbon reduction (Zh et al., 2023). In the field of low-carbon behavior modeling, relevant theoretical models have been established. These models utilize generic algorithms such as GA and particle swarm optimization (PSO) to maximize profits for all stakeholders and minimize carbon emissions (Yang et al., 2023). Additionally, to optimize the parameters of low-carbon models, metaheuristic algorithms are employed including genetic algorithms, particle swarm optimization and so on. Ding (2023) exhibited a certain advantage in optimizing the parameters of low-carbon models during to the simplicity and lower computational costs of these methods.
This study aims to investigate an innovative operational control strategy for air conditioner focusing on the key performance indicator of minimizing carbon emission costs. The proposed approach introduces a multi-objective optimization scheduling method that relies on dynamic carbon emission factors while considering collaborative operations with air conditioning vendors. The primary contributions/nolvelties of this methodology are outlined as follows:
➢ Different to fixed carbon emission factor, the dynamic carbon emission factor is introducted to accurately and fairly evaluate the carbon emmission of air conditioners in hour-level. It offers an effective guidance for low-carbon and low-cost operation of air conditioner loads;
➢ Unique to single objective optimization, the total cost (including electric cost and carbon emission cost) and users’ comfort are intergrated as a multiple objectives to guide th optimal operations of air conditioners;
➢ The proposed MSCSO algorithm in combination with the Grey Target Decision, aims to obtain the optimal weighted balanced solution. By considering both indoor temperature comfort and the reduction of total electricity costs, it seeks to find a solution that achieves the best balance between these objectives, thereby maximizing overall efficiency and benefits.
The remaining sections of this paper are organized as follows: Section 2 presents the modelling of air conditioning operational characteristics and optimization objectives. Section 3 introduces the workflow of the MSCSO algorithm combined with the Grey Target Decision algorithm. Section 4 provides case simulations for the optimization of the operation of four air conditioners. Finally, Section 5 offers a summary of this paper.
2 Air conditioner operation characteristics and optimization objective modeling
2.1 Characteristics related to air conditioning operation
Yang et al. (2022b) shows that air conditioning operation is actually a dynamic process. If continuous operating characteristics cannot be maintained, it will affect the user’s comfort experience (Lu et al., 2023) and increase energy consumption costs (Yuan et al., 2023). During the air conditioning operation control process, the direct load of the air conditioner Direct Load Control (DLC) (Alrasheedi et al., 2024) is a strategy used to manage and balance loads in power systems. It involves adjusting the load of the power system by proactively intervening in the operation of air conditioning equipment to respond to changes in system demand or to optimize system operation.
In air-conditioning direct load control, it is achieved in the following two ways:
➢ Heating mode: When the indoor real-time temperature is lower than the lower limit temperature, the air conditioner turns on the heating mode. The indoor temperature gradually increases until it reaches the upper limit temperature and the air conditioner stops working; until the indoor temperature drops to the lower limit temperature again, the air conditioner turns on the heating mode again and then the cycle repeats.
➢ Cooling mode: When the indoor real-time temperature is higher than the upper limit temperature, the air conditioner turns on the cooling mode. The indoor temperature gradually decreases until it reaches the lower limit temperature and the air conditioner stops working; until the indoor temperature rises to the upper limit temperature again, the air conditioner turns on the cooling mode again. And then the cycle repeats.
In the paper, the background of the simulation of air conditioning load optimization operation is based on summer. So only the cooling mode needs to be considered, its working state is shown in Figure 1.
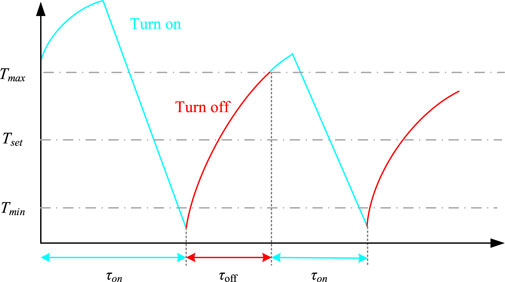
FIGURE 1. Direct load control of air conditioning in cooling mode.
2.2 Real-time calculation of indoor temperature
The operating status of the air conditioner can be adjusted through changes in indoor temperature in the process of direct load control of air conditioners. The real-time indoor temperature is mainly related to the outdoor temperature, room thermal parameters, air conditioning load operating status and rated power, which can be described by Eq. 1 as follows:
where
2.2.1 Determining the operating state of the air conditioning load
Although the operating status of the air conditioner and the start-stop status are not equivalent. The operating status of the air-conditioning load at the next moment can be determined through the indoor temperature and start-stop status at that moment. The determination method is described by Eq. 2 as follows:
where
According to the condition
where
2.2.2 Dynamic carbon emission factor
Currently in China, there are challenges associated with the average carbon emission factors for electricity including delayed data updates and difficulties in reflecting temporal and spatial variations, it has not been updated since 2012 and has lost its timeliness taking the example of the regional grid’s average carbon emission factor. Moreover, its broad coverage makes it challenging to adequately consider the development disparities and temporal characteristics of non-fossil energy generation especially new energy sources in different regions.
The existing values represent fixed annual figures lacking the capability to address dynamic issues. In this paper, we propose a dynamic carbon emission factor that utilizes a spatiotemporal data model for the power grid. This approach enables the coupling and correlation analysis of electricity and carbon emissions within the grid. By leveraging real-time grid dynamic flow data, the dynamic carbon emission factor can be calculated on an hourly and minute-by-minute basis allowing for dynamic assessments of carbon emissions across different time periods and regions. This methodology is more conducive to accurate carbon emission cost calculations and the equitable distribution of carbon emission responsibilities. The dynamic carbon emission factor can be predicted and released to users in advance. Users adjust their electricity consumption behavior on an hourly basis. After perceiving the differences in carbon emission factors for electricity consumption in different time periods in the future, users, within the range allowed by their own adjustment capabilities, respond with the goal of maximizing their carbon reduction, aiming to minimize their carbon footprint.
According to the principle of carbon emission flow transmission in the power grid, the schematic diagram is shown in Figure 2. For each node, according to the proportional sharing principle, considering the active power input externally, the average converted carbon emission intensity of the injected node is defined as the carbon emission factor intensity. The carbon emission intensity of node branch power and node access load (Si et al., 2023), which can be expressed by Eq. 4:
where
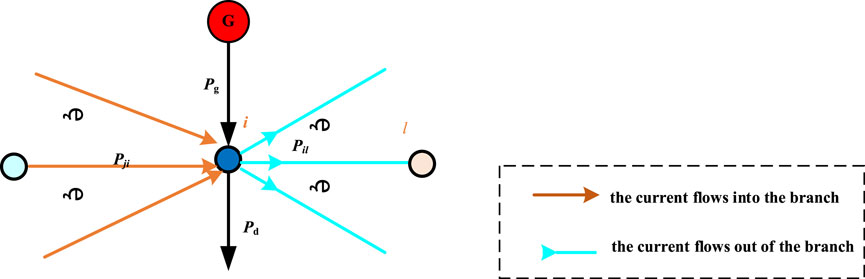
FIGURE 2. Grid carbon emission flow transmission schematic diagram.
2.3 Optimization target modeling
This section models the carbon emission flow calculation model as the foundation. Under the premise of satisfying constraints on user air conditioning cluster switch states and switch durations, economic costs for users are fully taken into account. At the same time, the section aims to maximize user comfort and minimize carbon emission costs. Therefore building upon the carbon emission flow, this section formulates a multi-objective model for low-carbon operation of air conditioning loads. The objective function of the model considering user comfort and reducing the overall electricity cost that including carbon emission costs is expressed by Eq. 5: where Eq. 6 represents the associated constraints of Eq. 5.
where
3 MSCSO algorithm combined with gray target decision-making algorithm
3.1 Basic principles of MSCSO algorithm
The MSCSO algorithm is an intelligent optimization algorithm that imitates the foraging behavior of sand cats in nature. This algorithm simulates the two stages of sand cat foraging behavior: searching for prey and attacking prey (Seyyedabbasi and Kiani, 2023).
3.1.1 Initialization
In a D-dimensional problem, a sand cat represents a
where
The fitness function of the sand cat population is
3.1.2 Searching for prey stage
In the stage of searching for prey, the sand cat’s hearing can explore the location of the prey by perceiving hearing within 2 kHz. In the mathematical model, According to the working principle of the algorithm the process of gradually decreasing linearly from 2 to 0 after iteration is simulated and represents this process using sensitive Factors
where
During the search process in order to ensure that the search space falls into a local optimum, this search process requires position updating based on random position changes during the search process. This behavior can be defined by the different sensitivity ranges of each sand cat using Eq. 10:
The parameter variable that realizes the transformation of searching for prey and attacking prey is expressed as
When searching for prey position in the algorithm, the sand cat can iterate its position based on the current position, sensitivity range and optimal solution which can be expressed by Eq. 12:
where
3.1.3 Attacking prey stage
During the process of attacking prey, the sand cat uses a 360-degree range around its current position as a rotation angle. This involves randomly selecting an angle for the attack, ensuring both the avoidance of getting stuck in local optima and a more accurate emulation of the sand cat’s hunting behavior by Eqs 13, 14.
where
3.1.4 Transformation into exploring and attacking prey stages
The parameter variables that realize the conversion of searching for prey and attacking prey are expressed as
3.2 Basic principles of gray target decision-making
By employing the MSCSO algorithm for two objectives and obtaining numerous solutions based on diverse requirements, this paper adopts an approach that combines Grey Target Decision to derive the optimal decision solution.
The Grey Target Decision method is primarily based on considering multiple scenarios and objectives. Essentially, the grey target represents the region of satisfactory outcomes, with a designated target center in a sequence set. The proximity to the target center reflects the superiority of the outcome, where closer distances indicate better performance. The core concept revolves around identifying data in a set of sequences that is closest to the target value, forming a reference sequence. Subsequently, a grey target is constructed using this reference sequence with the reference sequence as the target center. The distance between each data sequence in the information space and the target center is referred to as the target center distance and the solutions are ranked based on the magnitude of these distances.
3.2.1 Establishing sample matrix
For the MSCSO algorithm targeting two objectives from the set of numerous solutions obtained based on different requirements:
where
3.2.2 Determine the target center
Select the target value as a cost indicator, that is expressed by Eq. 18.
where
Based on this, the decision matrix is defined as
where
3.2.3 Find the best decision
The method of minimum center distance is used to determine the optimal solution of the target value (Liu et al., 2022) by Eq. 21.

FIGURE 3. MSCSO algorithm combined with gray target decision-making flow chart.
3.3 MSCSO algorithm combined with gray target decision-making flow chart
MSCSO algorithm
4 Case studies
During the simulation optimization process, the relevant parameters of the air conditioner are set as shown in Table 1. The hourly electricity price and carbon price are designed for 24 h a day as shown in Table 2, (Zhang et al., 2023). Dynamic carbon emission factor exhibit a trend of being low during the day and high during the night clean and renewable energies are considered such as solar power generation. During the day, the proportion of renewable energy generation is larger resulting in a small electric carbon factor. On the contrary when solar resources disappear at night, the system becomes more reliant on traditional power supply primarily provided by fossil fuel-based power generation equipment such as coal-fired power plants the proportion of renewable energy generation is relatively low at night and the carbon emission factor is large in Figure 4A.

TABLE 1. Air conditioning related parameters.
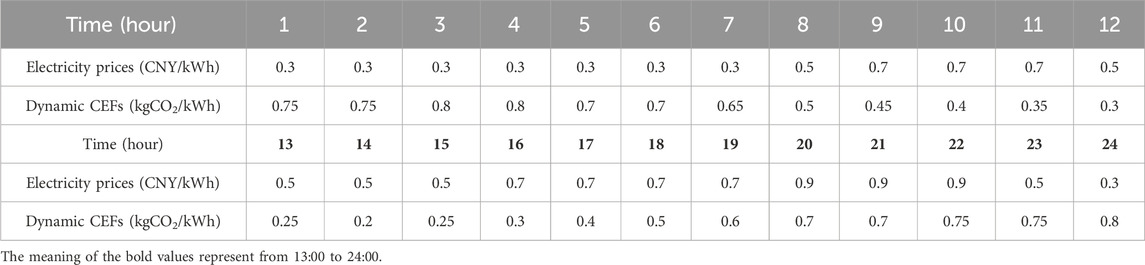
TABLE 2. Electricity prices and carbon prices at each moment within 24-h.
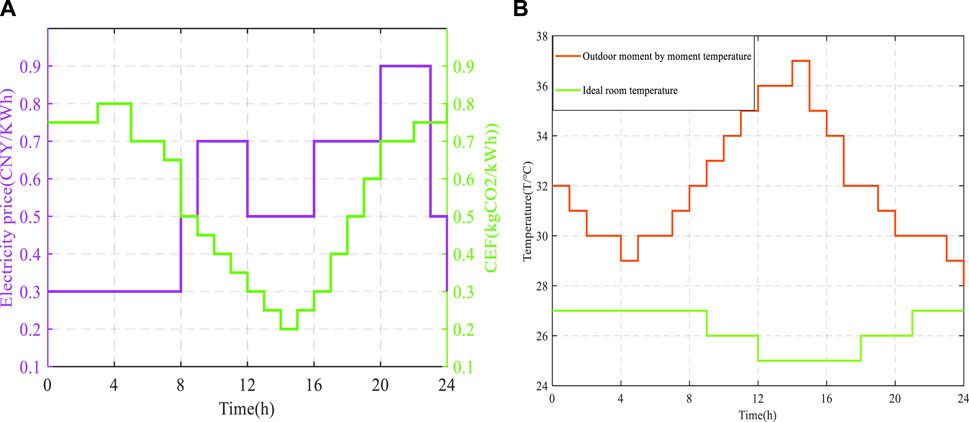
FIGURE 4. (A) Hourly electricity prices and carbon prices; (B) Hourly ideal indoor and outdoor temperature.
The ideal indoor temperature and actual outdoor temperature are also set as shown in Figure 4B. The maximum number of iterations and the number of populations of all algorithms are exactly the same, the maximum number of iterations K max = 500 and the number of populations Pop = 200. Figure 5A shows simulation of the air conditioner operating State. There are two dimensions in Pareto fronts in Figure 5B. It shows the MSCSO-GTD strategy’s trade-off ability in multi-objective solution sets.
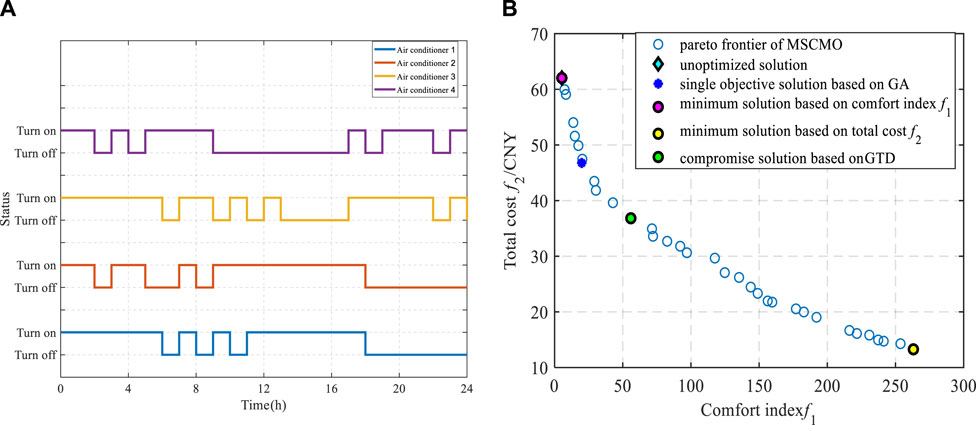
FIGURE 5. Optimization results: (A) Air conditioner operating states; (B) Optimization solutions different strategies.
Figure 5A shows simulation of the air conditioner operating State. There are two dimensions in Pareto fronts in Figure 5B. It shows the MSCSO-GTD strategy’s trade-off ability in multi-objective solution sets. In Figure 5B, the solutions obtained from MSCSO-
The indoor temperature variations of different air conditioners under different strategies are shown in Figure 6. For air conditioners 1 and 2 during the working hours from 9:00 to 18:00, MSCSO-GTD-
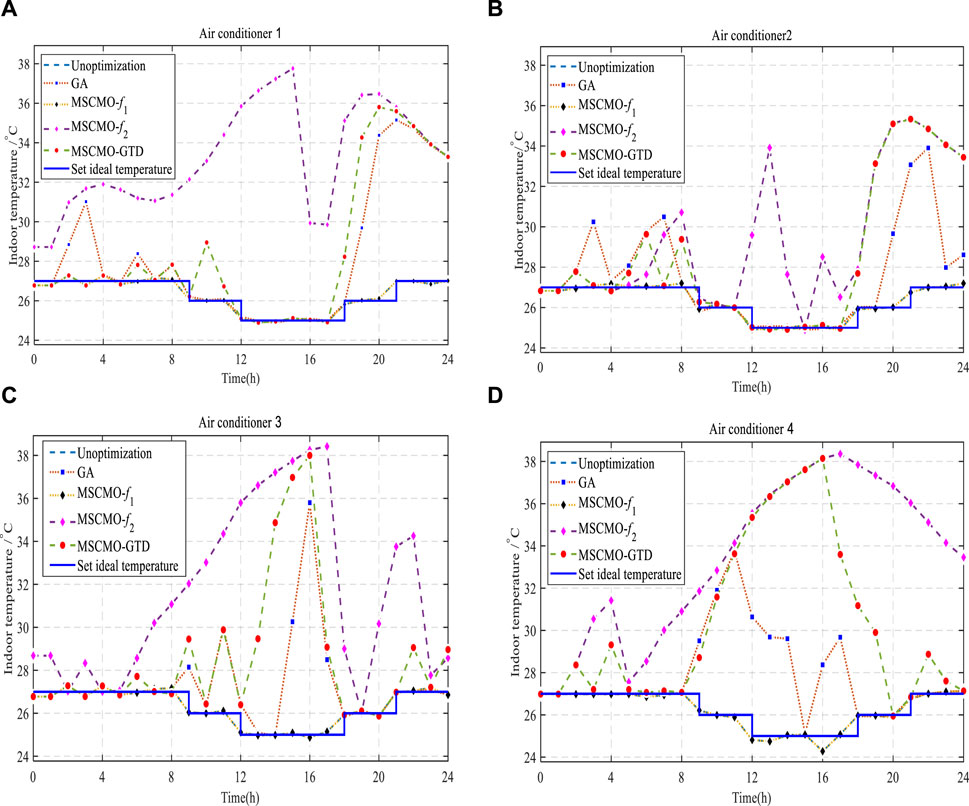
FIGURE 6. Indoor temperature changes of different air conditioners under different strategies. (A) air conditioner 1; (B) air conditioner 2; (C) air conditioner 3; (D) air conditioner 4.
As illustrated in Figure 7A showing the changes in comfort index for different air conditioners under different strategies. Figure 7B displays the variations in total power cost under different strategies, confirming that MSCSO-GTD-
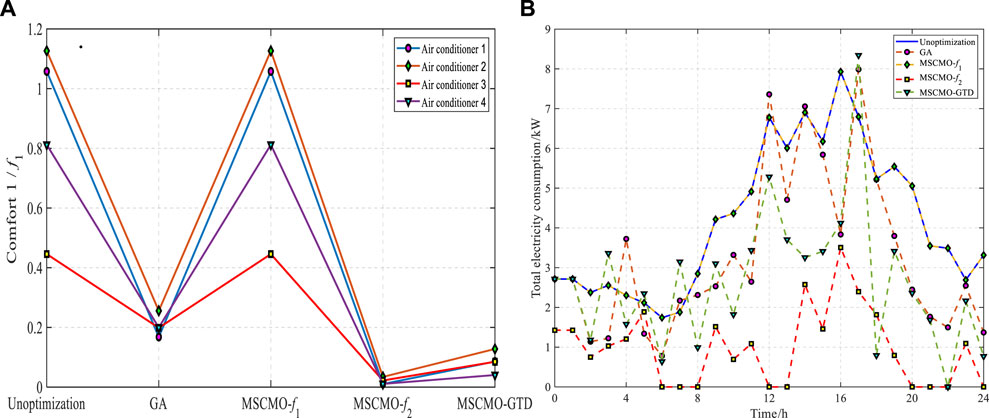
FIGURE 7. (A) Variation chart of different air conditioning comfort indexes under different strategies. (B) Change chart of total cost of electricity under different strategies.
Figure 8 depicts the cost and comfort index under different strategies. The trends exhibited by the four air conditioners under different strategy optimizations are generally similar. It can be observed that without optimization, both carbon emission costs and electricity costs are high which contradicts the low-carbon concept. MSCSO-
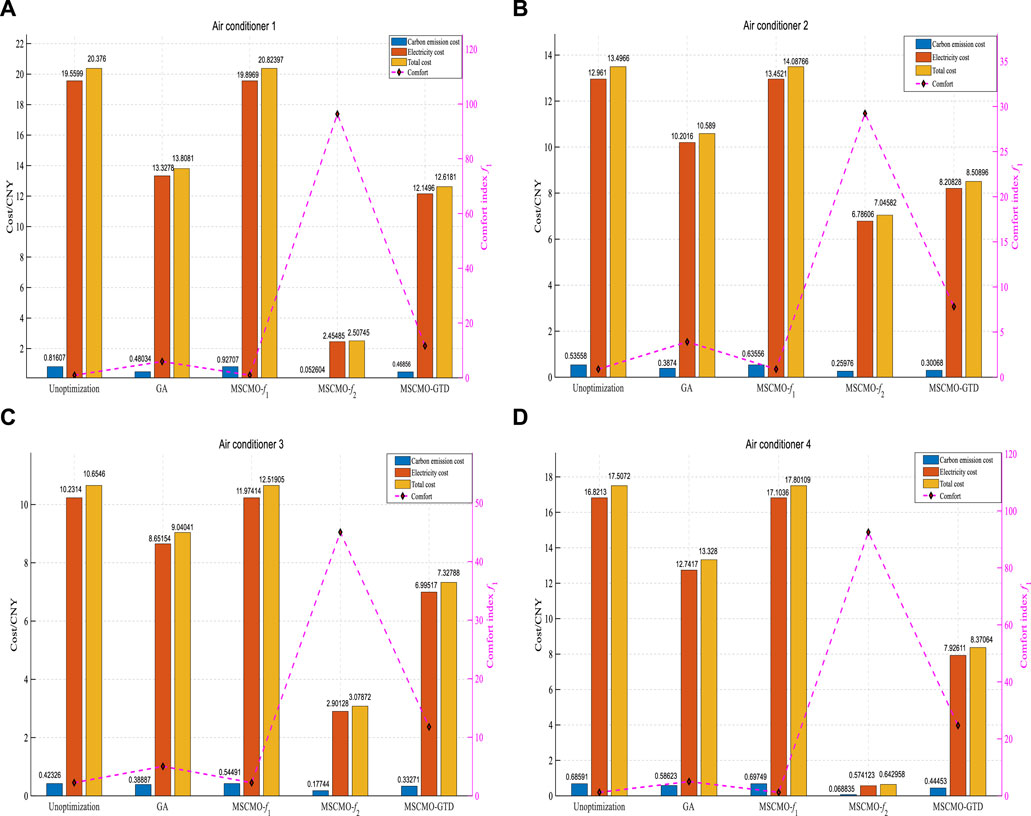
FIGURE 8. Cost and comfort indexes under different strategies. (A) air conditioner 1; (B) air conditioner 2; (C) air conditioner 3; (D) air conditioner 4.
5 Conclusion
This paper considers the multi-objective decision-making problem of low-carbon operation of air-conditioning load. How to better achieve the decision-making balance problem for the two goals of user comfort and total electricity cost on the basis of being as low -carbon as possible, using MSCSO-GTD and dynamic electric carbon The research method of combining factors explored the dual-objective balance problem of low-carbon cost measurement, user comfort and total electricity cost. Finally the following conclusions were obtained:
➢ The algorithm employed in this paper belongs to heuristic algorithms and has demonstrated excellent optimization results in the context of weak optimization problems presented in this paper. However, when dealing with the output optimization of devices such as generators in a distribution network, more complex constraints, such as start-stop constraints and ramping constraints, need to be considered. In such cases, the algorithm proposed in this paper may not be as applicable.
➢ Compared to the single-objective MSCSO, the proposed dual-objective MSCSO-GTD can overcome the limitations of overlooking other objectives in the single-objective research process. Most importantly, the method proposed for low-carbon cost control exhibits significant potential;
➢ Compared with the non-optimized and GA algorithm, more satisfactory optimization indicators were achieved in the test for the optimized operation of four air conditioners, especially in terms of low-carbon cost control. The respective comparisons were close to 20% and 13% reduction; in the total cost indicators, there are reductions of nearly 33% and 20%, respectively;
➢ Compared with the electricity price, the carbon unit price is lower; the electricity price plays a dominant role in the algorithmic equilibrium decision-making process in many cases, resulting in sometimes unsatisfactory optimization results guided by the carbon price. A higher carbon unit price may achieve a more effective low-carbon economy, carbon runs the guiding role. With the continuous increase in the proportion of new energy installations and the establishment of a more robust carbon trading market in the electricity system, enhanced price incentives, and more standardized carbon trading, the low points in both electricity user net loads and dynamic carbon emission factors may overlap in the future.
Data availability statement
The original contributions presented in the study are included in the article/supplementary material, further inquiries can be directed to the corresponding author.
Author contributions
XS: Writing–original draft, Writing–review and editing. JL: Writing–review and editing. YY: Writing–review and editing. JT: Writing–original draft. BQ: Writing–review and editing. XL: Writing–review and editing. ZW: Writing–review and editing.
Funding
The authors declare that no financial support was received for the research, authorship, and/or publication of this article.
Acknowledgments
The authors gratefully acknowledge the support of the China Southern Power Grid Technology Project (YNKJXM20222402).
Conflict of interest
Authors XS, JL, and YY were employed by Yunnan Power Grid Co., Ltd. Authors JT, BQ, XL, and ZW were employed by Electric Power Research Institute of CSG.
Publisher’s note
All claims expressed in this article are solely those of the authors and do not necessarily represent those of their affiliated organizations, or those of the publisher, the editors and the reviewers. Any product that may be evaluated in this article, or claim that may be made by its manufacturer, is not guaranteed or endorsed by the publisher.
References
Alrasheedi, A. F., Alnowibe, K. A., and Alshamrani, A. M. (2024). A smart predict-and-optimize framework for microgrid's bidding strategy in a day-ahead electricity market. Electr. Power Syst. Res. 228, 110016. doi:10.1016/j.epsr.2023.110016
Bingham, R., Agelin-Chaab, M., and Rosen M, A. (2017). “Multi-objective optimization of a residential building envelope in the Bahamas,” in 2017 IEEE International Conference on Smart Energy Grid Engineering (SEGE), Oshawa, ON, Canada, 14-17 August 2017, 294–301.
Ding, J. W. (2023). Design of a low carbon economy model by carbon cycle optimization in supply chain. Front. Ecol. Evol. 11, 11. doi:10.3389/fevo.2023.1122682
Dong, L. X., Wu, Q., Hong, J. H., Wang, Z. H., Fan, S., and He, G. Y. (2023). An adaptive decentralized regulation strategy for the cluster with massive inverter air conditionings. Appl. Energy 330, 120304. doi:10.1016/j.apenergy.2022.120304
Elnour, M., Himeur, Y., Fadli, F., Mohammedsherif, H., Meskin, N., Ahmad, A. M., et al. (2022). Neural network-based model predictive control system for optimizing building automation and management systems of sports facilities. Appl. Energy 318, 119153. doi:10.1016/j.apenergy.2022.119153
Fikiin, K. (2018). The future of cooling: opportunities for energy efficient air conditioning. Paris, France: International Energy Agency (IEA). doi:10.13140/RG.2.2.18958.43846
Hernández, F. F., José Miguel, P. S., Bandera Cantalejo, J. A., and González Muriano, M. C. (2022). Impact of zoning heating and air conditioning control systems in users comfort and energy efficiency in residential buildings. Energy Convers. Manag. 267, 115954. doi:10.1016/j.enconman.2022.115954
Hu, H. X., Zhang, Y. L., Yao, C., Guo, X., and Yang, Z. J. (2022). Research on cost accounting of enterprise carbon emission (in China). Math. Biosci. Eng. 19 (11), 11675–11692. doi:10.3934/mbe.2022543
Hu, M., Xiao, F., Jørgensen, J. B., and Wang, S. W. (2019). Frequency control of air conditioners in response to real-time dynamic electricity prices in smart grids. Appl. Energy 242, 92–106. doi:10.1016/j.apenergy.2019.03.127
Hu, Y. S., and Yi, M. (2023). Energy consumption and carbon emissions forecasting for industrial processes: status, challenges and perspectives. Renew. Sustain. Energy Rev. 182, 113405. doi:10.1016/j.rser.2023.113405
Huang, H., Wang, H., Hu, Y. J., Li, C., and Wang, X. (2022). Optimal plan for energy conservation and CO2 emissions reduction of public buildings considering users’ behavior: case of China. Energy 261, 125037. doi:10.1016/j.energy.2022.125037
Jung, W., and Jazizadeh, F. (2019). Human-in-the-loop HVAC operations: a quantitative review on occupancy, comfort, and energy-efficiency dimensions. Appl. Energy 239, 1471–1508. doi:10.1016/j.apenergy.2019.01.070
Khan, I., Jack, M., and Stephenson, J. (2018). Analysis of greenhouse gas emissions in electricity systems using time-varying carbon intensity. J. Clean. Prod. 184, 1091–1101. doi:10.1016/j.jclepro.2018.02.309
Kuo, M. T., Lu, S. D., and Tsou, M. C. (2017). Considering carbon emissions in economic dispatch planning for isolated power systems: a case study of the Taiwan power system. IEEE Trans. Industry Appl. 54 (2), 987–997. doi:10.1109/tia.2017.2771338
Li, Z. M., Xu, Y., Fang, S. D., Wang, Y., and Zheng, X. D. (2020). Multiobjective coordinated energy dispatch and voyage scheduling for a multienergy ship microgrid. IEEE Trans. Industry Appl. 56, 989–999. doi:10.1109/tia.2019.2956720
Li, Z. M., Xu, Y., Feng, X., and Wu, Q. W. (2021). Optimal stochastic deployment of heterogeneous energy storage in a residential multienergy microgrid with demand-side management. IEEE Trans. Industrial Inf. 17, 991–1004. doi:10.1109/tii.2020.2971227
Lin, C. J., Wang, K. J., Dagne, T. B., and Woldegiorgis, B. H. (2022). Balancing thermal comfort and energy conservation– A multi-objective optimization model for controlling air-condition and mechanical ventilation systems. Build. Environ. 219, 109237. doi:10.1016/j.buildenv.2022.109237
Liu, S., Yang, Y., and Forrest, J. Y. L. (2022). “Grey models for decision-making,” in Grey systems analysis. Series on grey system (Singapore: Springer).
Lu, J., Han, S., Ruan, S., and Wu, N. (2023). “Demand response capability analysis of central air conditioners based on group rotation control,” in 2023 International Conference on Smart Electrical Grid and Renewable Energy (SEGRE), Changsha, China, 16-19 June 2023, 367–372.
Ohta, Y., and Sato, H. (2018). Evolutionary multi-objective air-conditioning schedule optimization for office buildings. Proc. Genet. Evol. Comput. Conf. Companion GECCO ’18, 296–297. doi:10.1145/3205651.3205698
Reyseliani, N., Hidayatno, A., and Purwanto, W. W. (2022). Implication of the Paris agreement target on Indonesia electricity sector transition to 2050 using TIMES model. Energy Policy 169, 113184. doi:10.1016/j.enpol.2022.113184
Seyyedabbasi, A., and Kiani, F. (2023). Sand Cat swarm optimization: a nature-inspired algorithm to solve global optimization problems. Eng. Comput. 39, 2627–2651. doi:10.1007/s00366-022-01604-x
Shi, C. Q., Murshed, M., Alam, M. M., Ghardallou, W., Balsalobre-Lorente, D., and Khudoykulov, K. (2023). Can minimizing risk exposures help in inhibiting carbon footprints? The environmental repercussions of international trade and clean energy. J. Environ. Manag. 347, 119195. doi:10.1016/j.jenvman.2023.119195
Si, F. Y., Du, E. S., Zhang, N., Wang, Y., and Han, Y. H. (2023). China’s urban energy system transition towards carbon neutrality: challenges and experience of Beijing and Suzhou. Renew. Sustain. Energy Rev. 183, 113468. doi:10.1016/j.rser.2023.113468
Silva, H. C. N., Hornsby, E. M., Melo, F. M., Magnani, F. S., Carvalho, M., and Ochoa, A. A. V. (2023). Combined financial and environmental optimization of a trigeneration system. Therm. Sci. 27, 321–334. doi:10.2298/tsci220804167s
Wang, C., Wang, B., Cui, M., and Wei, F. (2022). Cooling seasonal performance of inverter air conditioner using model prediction control for demand response. Energy Build. 256, 111708. doi:10.1016/j.enbuild.2021.111708
Wijaya, T. K., Sholahudin, , Alhamid, M. I., Saito, K., and Nasruddin, N. (2022). Dynamic optimization of chilled water pump operation to reduce HVAC energy consumption. Therm. Sci. Eng. Prog. 36, 101512. doi:10.1016/j.tsep.2022.101512
Wiriyasart, S., and Kaewluan, S. (2024). Waste heat recovery of air conditioning on thermal efficiency enhancement of water heater. Therm. Sci. Eng. Prog. 47, 102296. doi:10.1016/j.tsep.2023.102296
WuCao, Y. Y. B., Hu, M. Z., Lv, G., Meng, J., and Zhang, H. (2023). Development of personal comfort model and its use in the control of air conditioner. Energy Build. 285, 112900. doi:10.1016/j.enbuild.2023.112900
Xie, K., Hui, H., Ding, Y., Song, Y., Ye, C., Zheng, W., et al. (2022). Modeling and control of central air conditionings for providing regulation services for power systems. Appl. Energy 315, 119035. doi:10.1016/j.apenergy.2022.119035
Yang, J., Wu, J. H., Xian, T., Zhan, H. Y., and Li, X. Y. (2022b). Research on energy-saving optimization of commercial central air-conditioning based on data mining algorithm. Energy Build. 272, 112326. doi:10.1016/j.enbuild.2022.112326
Yang, Y. S., Li, Z. M., Mandapaka, P. V., and Lo, E. Y. M. (2023). Risk-averse restoration of coupled power and water systems with small pumped-hydro storage and stochastic rooftop renewables. Appl. Energy 339, 120953. doi:10.1016/j.apenergy.2023.120953
Yang, Z. X., Zhang, Y. L., Xiao, H. S., Zhuang, R., Liang, X., Cui, M., et al. (2022a). Comprehensive test of ultra-efficient air conditioner with smart evaporative cooling ventilation and photovoltaic. Energy Convers. Manag. 254, 115267. doi:10.1016/j.enconman.2022.115267
Yuan, Y., Gao, L. Y., Zeng, K. J., and Chen, Y. X. (2023). Space-Level air conditioner electricity consumption and occupant behavior analysis on a university campus. Energy Build. 300, 113646. doi:10.1016/j.enbuild.2023.113646
Zhang, G., Wen, J., Xie, T., Zhang, K., and Jia, R. (2023). Bi-layer economic scheduling for integrated energy system based on source-load coordinated carbon reduction. Energy 280, 128236. doi:10.1016/j.energy.2023.128236
Keywords: low-carbon operation, economic scheduling, air conditioning system, multiobjective optimization, dynamic carbon emission factor
Citation: Shen X, Li J, Yin Y, Tang J, Qian B, Lin X and Wang Z (2024) Multi-objective optimal scheduling considering low-carbon operation of air conditioner load with dynamic carbon emission factors. Front. Energy Res. 12:1360573. doi: 10.3389/fenrg.2024.1360573
Received: 23 December 2023; Accepted: 08 January 2024;
Published: 22 January 2024.
Edited by:
Zhengmao Li, Aalto University, FinlandReviewed by:
Yitong Shang, Hong Kong University of Science and Technology, Hong Kong SAR, ChinaLinfei Yin, Guangxi University, China
Jiawen Li, Shanghai University of Electric Power, China
Copyright © 2024 Shen, Li, Yin, Tang, Qian, Lin and Wang. This is an open-access article distributed under the terms of the Creative Commons Attribution License (CC BY). The use, distribution or reproduction in other forums is permitted, provided the original author(s) and the copyright owner(s) are credited and that the original publication in this journal is cited, in accordance with accepted academic practice. No use, distribution or reproduction is permitted which does not comply with these terms.
*Correspondence: Jianlin Tang, dGFuZ2psMkBjc2cuY24=