 Tania Gupta
 Richa Bhatia
 Sachin Sharma3
 Ch. Rami Reddy
 Kareem M. AboRas
- 1Department of Electronics and Communication, NSUT East Campus (Affiliated to GGSIPU), Delhi, India
- 2Netaji Subhash University of Technology, Delhi, India
- 3Electrical Engineering Department, Graphic Era Deemed to be University, Dehradun, India
- 4Department of Electrical and Electronics Engineering, Joginpally B. R. Engineering College, Hyderabad, India
- 5Applied Science Research Center, Applied Science Private University, Amman, Jordan
- 6Department of Electrical Power and Machines, Faculty of Engineering, Alexandria University, Alexandria, Egypt
- 7College of Engineering, University of Business and Technology, Jeddah, Saudi Arabia
The major component of the smart grid (SG) is the advanced metering infrastructure (AMI), which monitors and controls the existing power system and provides interactive services for invoicing and electricity usage management with the utility. Including a cyber-layer in the metering system allows two-way communication but creates a new opportunity for energy theft, resulting in significant monetary loss. This article proposes an approach to detecting abnormal consumption patterns using energy metering data based on the ensemble technique AdaBoost, a boosting algorithm. Different statistical and descriptive features are retrieved from metering data samples, which account for extreme conditions. The model is trained for malicious and non-malicious data for five different attack scenarios, which are analyzed on the Irish Social Science Data Archive (ISSDA) smart meter dataset. In contrast to prior supervised techniques, it works well even with unbalanced data. The efficacy of the proposed theft detection method has been evaluated by comparing the accuracy, precision, recall, and F1 score with the other well-known approaches in the literature.
1 Introduction
The notable characteristics of the smart grid (SG) that increase the effectiveness of the current power system are indeed the two-way power and information exchange. Energy theft has been a severe challenge in the traditional power grid worldwide. Almost all utilities worldwide suffer significant financial losses due to energy theft, primarily in developing countries (Keping et al., 2015). Based on the most recent published research by Northeast Group, LLC, stealing energy costs the world $89.3 billion/year, among which the world’s top 50 emerging-market countries lose $58.7 billion/year (Xia et al., 2019). In contrast to the old grid, which manually collects customer billing information monthly, the new SG measures consumer energy consumption minute by minute for each device installed at user premises (Gupta and Bhatia, 2020). This aids the utility in managing loads, providing user billing information, and managing energy utilization (Yu et al., 2021). By providing monitoring capabilities through numerous sensors and accurate readings, the SG claims to lower the risk of energy theft by giving the power utility billing data and price information at a higher frequency, i.e., on an hour-to-hour basis (Zhang et al., 2017).
However, since the SG relies more extensively on information and communication technologies, there are more potential cyber-attack threats, which reduce the SG’s reliability and result in significant operational and monetary losses (Attia et al., 2018; Jiang and Li, 2022). There are two entities of electricity losses: technical losses (TLs) and non-technical losses (NTLs) in the SG system. TLs are power losses incurred during electricity generation and transmission. The NTL category includes energy theft, and it states that the most common causes of NTLs include conventional methods such as meter reading bypassing, communication network failures, meter spoofing, and tampering with meter readings using a magnet (Kong et al., 2023). However, due to the introduction of an intelligent digital metering system and the inclusion of an internet layer in the metering system, there are several new entrance points for energy theft in addition to the conventional methods (Sun et al., 2018; Zhang et al., 2021). As a result, it draws the attention of researchers to the SG’s cyber security (Jain et al., 2022). Mechanical meters in the old grid can only be adjusted physically. In contrast, advanced metering infrastructure (AMI) metering data open the door for both physical and remote adjustments (Song et al., 2022). Energy theft attacks against the SG could be initiated by malicious users who manipulate their smart meters to claim lower consumption readings to cut their energy bills illegally (Lin et al., 2022). Thus, the need to locate that malicious user and secure the system is of utmost importance (Mrabet et al., 2018; Pengwah et al., 2023).
Historically, to discover irregular energy usage, technicians must examine consumer monthly consumption data collected over an extended period, and after that, they must physically visit each resident community to confirm the condition and connection of each meter (Cheng et al., 2017; Zhang et al., 2023a). Due to research into machine learning (ML) techniques, power utilities now have a new opportunity to identify unusual electricity usage patterns from a variety of energy data (Zhang et al., 2023b; Tan et al., 2023). By identifying anomalous patterns, these techniques can reduce the workload for system operators and increase detection accuracy (Guarda et al., 2023). As per previously available architecture, systems for detecting energy theft are classified into three groups: state-based or power-based, game-based, and artificial intelligence (AI)-based approaches (Jokar et al., 2016), as depicted in Figure 1. In a state-based approach, specific instruments or metering devices were designed to combat energy theft. For instance, a hardware-based method was proposed for identifying fake users (Liu X. et al., 2023; Wang et al., 2024). Various sorts of sensors and radio frequency identification tags are used in this system to identify the malicious user. Additional metrics such as power, voltage, and current are used in the distribution network to detect electricity theft (Wang et al., 2021; Zhang et al., 2024). Despite being costly to install and operate, this system has a good detection rate. Extra devices entail additional expenditures, and such device types are challenging to deploy within the current distribution system (Xiao et al., 2013; Henriques et al., 2014). The game theory-based approach assumes a game between the service supplier and fraudulent users. This strategy was based on sound assumptions. Actual user consumption data are derived from the game equilibrium. This has been theoretically calculated (Amin et al., 2012). However, it must still be solved to articulate the utility function of all stakeholders, including attackers, authorities, suppliers, and alternative solutions (Amin, 2015; Wang et al., 2023).
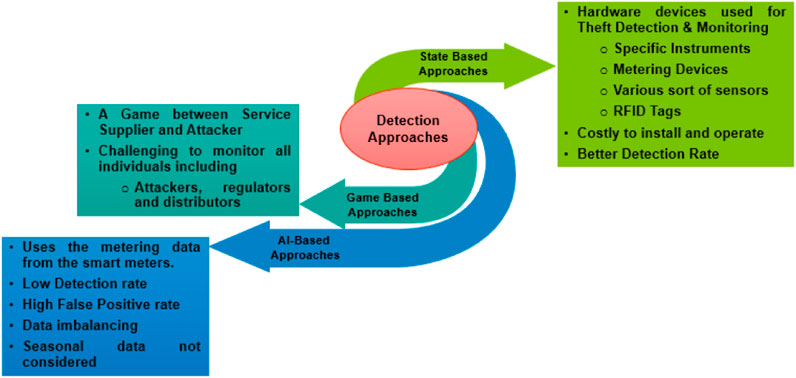
Figure 1. Existing energy theft detection approaches.
The third group includes AI-based methods: AMI uses ML algorithms to assess customers’ metering data and energy usage patterns to identify those who may be committing electricity theft (Gupta et al., 2022; Liu D. et al., 2023). In this, there are primarily two sorts of schemes: classification-based and clustering-based. Classification approaches often involve analyzing users’ past electricity consumption data with labels to identify odd trends and detect suspected electricity theft behaviors. It needs a dataset with labels (Jiang et al., 2021; Chen Y. et al., 2022). The metering data are utilized for training the classifier, which then identifies dishonest users. In contrast, clustering approaches rely on the information without labels; i.e., by studying the relationship between users, outliers are identified (Jokar et al., 2013; Yang et al., 2016; Sharma et al., 2023). Consumers often follow the same pattern under normal circumstances; hence, deviations from this pattern may indicate the presence of fraud. The classifier is trained using various ML techniques using a metering dataset available widely for research purposes and further used to detect unusual patterns, such as malicious users (Chen B. et al., 2022; Ma and Hu, 2022). The classifier’s primary flaw was its poor detection rate and high rate of false positives. Smart meter historical data are the foundation for the clustering models, subject to significant dataset fluctuations that provide a broad range of normal data and low detection rates (Guo and Hu, 2023; Zheng et al., 2023). This makes it very likely that the malicious data that the adversaries introduce will go undetected (Li and Li, 2023; Mo and Yang, 2023). Therefore, there is a requirement for a detection method that overcomes the abovementioned restrictions.
Unbalanced or abnormal data are one of the alarming issues with the current classifier. Real-time samples of normal data are easily available, but fetching theft samples is difficult. On the other hand, theft samples are rare or non-existent for a customer. In addition, algorithms based on classification are susceptible to attacks on the data values, and accepting faulty consumption values by adversaries can contaminate the dataset (Yang et al., 2016). If this factor is not considered properly, it results in a higher false-positive rate. According to what the author has revealed, a false positive will prove expensive because when a malicious user is recognized, a significant amount of procedure is required from the utility. In-person inspection is one of the steps that must be completed before an attack can be considered valid for final verification. Therefore, it is essential to create an adequate model of energy theft detection to overcome these limitations.
This research article introduces a robust energy theft detection system leveraging smart metering data using the AdaBoost ensemble method. The proposed approach addresses the evasion techniques observed in existing classification-based theft detection systems. A comprehensive threat model is presented, accounting for various false data injection (FDI) attack scenarios. The system acknowledges non-malicious elements influencing consumption patterns, including occupant changes, weather variations, and appliance modifications. By incorporating these factors, our method achieves a superior detection rate compared to other available schemes. Experimental assessments were conducted across diverse FDI attack scenarios, benchmarking against state-of-the-art methods such as SVM, LR, KNN, NB, and RFC. The comparative analysis encompassed various performance metrics, demonstrating the effectiveness of our proposed system in enhancing energy theft detection accuracy and resilience against deceptive strategies.
The remainder of this paper is structured as follows: in Section 2, the relevant work on FDI threats is discussed. The system model of an SG monitoring system is discussed in Section 3. The suggested attack detection mechanism is described in Section 4. The performance of the suggested approach is examined and compared to other available methods in Section 5. This paper concludes with Section 6.
2 Related work
This section discusses the studies conducted on the SG’s security. We are using smart meter consumption data to identify unethical users. In conventional power networks, analyzing consumer load profiles for indications of energy theft has drawn the interest of experts in the past (Cao et al., 2020; Yang et al., 2023). The majority of recently published works in the literature are devoted to the detection of fraud. AMI daily smart meter readings were used to estimate the consumption pattern of clients using support vector machines (SVMs). The classifier was trained with normal data and thieved sample data from the past. The load profiles of the smart meter malicious user were proposed in a classification-based energy theft detection system. The identifier was educated using historical data from theft and normal sample populations. New samples were categorized based on criteria and SVM outcomes. In a multiclass study, SVM was trained to distinguish between regular and malicious load profile samples. Creating a synthetic dataset addresses and resolves the issue of uneven training datasets (Jokar et al., 2016; Ahmad et al., 2018). It is among the most recent models for detecting power theft (Lyu et al., 2024). It creates a hyperplane to divide the various classes. The XGBoost-supervised technique was proposed to detect the non-malicious user (Buzau et al., 2019). The method based on this ML approach analyzes customer behavior patterns from past kWh consumption data and identifies anomalous activity. A back propagation neural network was constructed and used to analyze SG energy theft (Depuru et al., 2011). The SVM parameters were estimated via a neural network model to reduce the training time of the classifier. Additionally, a data encoding technique was suggested to increase the classifier’s effectiveness and speed. However, their system only works to identify energy theft attempts that provide zero-use reports. The metering data are encoded into binary values and transformed at one process phase. As a result, various attack types cannot be detected using the suggested categorization approach. To assess SG power theft, a broad and deep convolutional neural network model was created (Zheng et al., 2018). To investigate the attack path for false data injections against AC-based state estimation in power systems, we presented a new semidefinite programming-based convexification framework that detects globally optimal stealth attacks (Jin et al., 2019). In Alexopoulos et al. (2020), in the case of zero-injection buses, FDI attacks against a PMU linear state estimator based on Cartesian formulation were investigated with the presumption that the attacker would probably attempt to tamper with as few measurements as feasible. A novel hybrid attack (Pei et al., 2020) offered a low-cost attack mechanism that attackers could simply use to target buses with limited connectivity based on state estimation. To achieve observability for the entire system, this algorithm deployed extra-phase measurement units based on a greedy approach after prioritizing the protection of the most susceptible buses in the first phase. The new energy data sample is categorized using the K-means technique based on the similarity measure. It is one of the simplest methods available (Aziz et al., 2020).
However, many AI-based approaches need more precision for specific reasons. Due to the difficulties in obtaining labeling datasets of electrical thefts, i.e., proper preset thresholds and some external knowledge, the application of classification algorithms is restricted. It makes it harder to achieve in real-time situations, compromising detection accuracy. Unsupervised clustering cannot detect tampered load profiles with standard forms, resulting in low detection precision. Neural networks, for instance, are susceptible to overfitting since they learn the training examples exceptionally well but fail to generalize to new samples. Consequently, an effective system for detecting energy theft is essential to overcome these restrictions. Intending to develop a solution with low computing costs, better accuracy, and fewer false detections, we use the AdaBoost method to detect a stealthy attack on smart meter readings in this study. By creating a synthetic attack dataset and assuming that stealing trends are foreseeable, we can solve the issue of unbalanced data. The use of the AdaBoost algorithm is motivated by the reasons listed below.
1. Compared to most learning algorithms, the AdaBoost algorithm is less prone to overfitting and corrects misclassifications generated by poor classifiers. The classifiers based on this model have positive performance for anomaly detection problems.
2. Finding relationships between features in large datasets is challenging due to the various feature types. By integrating the weak learners for statistical attributes and descriptive attributes into a strong classifier, the links between these two different types of attributes are managed organically, regardless of any forced conversions between statistical and descriptive features of the dataset.
3. The AdaBoost technique is extremely quick when using straightforward, weak classifiers. Considering all the points listed above, we select the ensemble technique. In the proposed design, we put much effort into creating a reliable system that can be installed in the control center and use the data from the smart meter to detect suspicious energy readings and demand data that have been tampered with.
The proposed algorithm is created for various FDI attack scenarios to lessen the chance of the power system experiencing financial loss. The suggested approach was created to effectively anticipate various cyberattacks.
3 System model
This section discusses the AMI network and attack models used in this article.
3.1 Network model
One crucial component of the SG is AMI, which is a network of information and communication, smart meters, and meter data management systems. The home area network (HAN), neighborhood area network (NAN), wide area network (WAN), and utility systems make up the majority of the three significant components that make up the AMI’s communication network, as illustrated in Figure 2. Smart meters connected to houses via the HAN are the basis of the AMI. These meters collect current and voltage usage data in real-time and send it across the NAN to a data concentrator. These data are used by the utility for forecasting, demand response (DR), and power billing. WAN links the data concentrator and control center, and smart meters facilitate smooth energy generation and consumption balance. This integration allows for efficient defect detection, real-time customer research, and improved smart grid tracking. Overall, smart meters in AMI improve energy management, billing accuracy, and grid responsiveness.
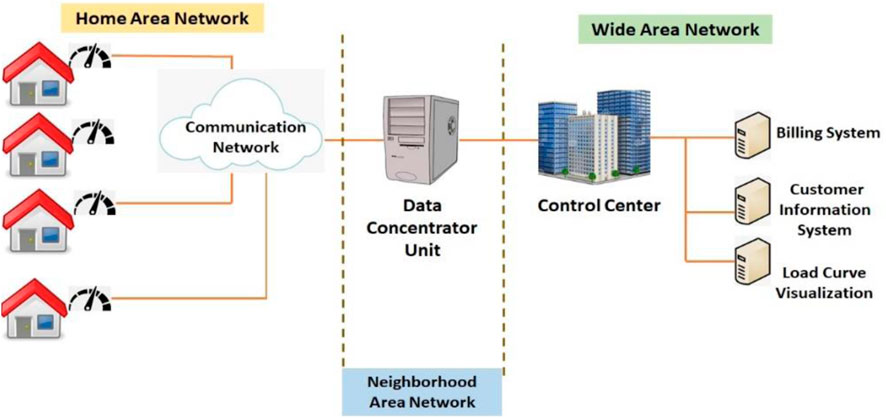
Figure 2. Network architecture of the advanced metering infrastructure.
3.2 Attack model
The attacker’s approach to attempting an attack is proposed here. The control center gathers information to analyze the consumption patterns of consumers and detect faults. An attacker uses this fine-grained consumption reading and can send false information to utilities to reduce their bill illegally. The primary goal of a consumer stealing electricity is to obtain the expended energy for less money than it is worth. Illegally reporting false bills creates a financial loss to the utility and a disturbance to energy management. A list of the many possible energy attacks against the AMI systems is illustrated in Table 1.
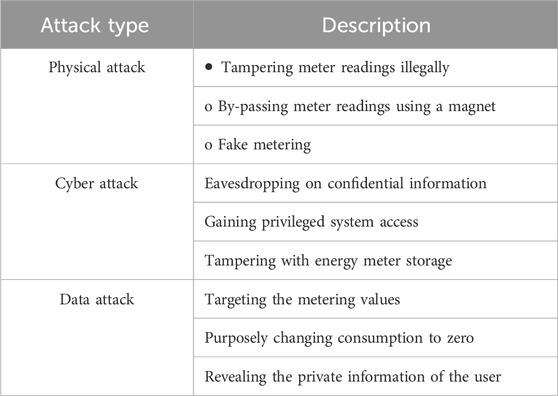
Table 1. Summary of energy theft attack targeted at AMI systems.
In the proposed threat model, fraudulent data have been introduced into the system at the consumer’s location primarily for financial advantage. The paper analyzes the two classes of FDI attacks, as listed in Tables 2, 3, where
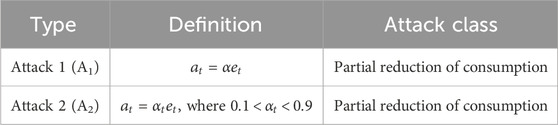
Table 2. Mathematical expression of partial reduction-based FDI attack class.

Table 3. Mathematical expression of price control-based FDI attack class.
3.2.1 Partial reduction-based FDI attack class
The primary goal of the user in this kind of FDI attack is to lower the amount of energy used to benefit financially. The attacker can inject the reduced consumption as compared to the actual value for that purpose. The mathematical representation of partial reduction-based FDI attacks is listed in Table 2. The target of each attack is to decrease energy usage by the factor
3.2.2 Price control-based FDI attack class
In this, the attacker aims to cause financial loss to the utility by changing the energy meter data so that total power consumption will not change but attack the effect financially. These attacks happen when the DR is used, and the price varies throughout the day. The mathematical expressions for the price control attacks A3, A4, and A5 are listed in Table 3. Reversing the day’s consumption order is done in A3. In A4, the malicious reading of energy consumption
Figure 3 is the graphical representation of FDI attacks (A1–A5) and no attack scenario for 1 day. Consumption includes all five types of attacks and consumption by the user without attack with respect to the time of 1 day, i.e., 24 hr.

Figure 3. An illustration of malicious and non-malicious user’s consumption patterns for a day for different attack scenarios.
Algorithm 1.Algorithm of the proposed theft detection system, TDS.
Input: Energy consumption data of N days, with each day having i energy measurement time slots;
Output: The measurement value
1 for
2 If
3
4 End
5 End
6 p ← p + 1
7 Generation of synthetic attack pattern
8 for b = 1 to 5 do
9 Generation of a synthetic attack pattern for each value of b
10 Merging
11 Select the combined meter measurement value
12 Adaptive Boost Ensemble Method (training dataset)
13 Given:
14 //Initialization
15 for (
16 Train weak learners with the
17 get weak hypothesis
18 Aim: Select
19
20 Choose
21 Update, for l = 1 to
22
23 end
24 End
25 for
26 if
27 false class (malicious consumer)
28 else
29
30 end
31 End
32 End
4 Proposed energy theft detection model under varying attack scenarios
Our proposed model framework comprises four modules: proposed ensemble modeling technique, data preprocessing, training phase, and testing phase. The first subsection of this section presents a description of the proposed methodology, an ensemble modeling-based AdaBoost technique. Then, the subsequent parts cover the remaining three modules of the theft detection approach, which we use to foil attempts on the integrity of our energy meter data. The steps of our proposed approach’s framework for detecting electricity theft are presented in Algorithm 1.
4.1 Proposed ensemble modeling technique
AdaBoost is a supervised ML-based boosting algorithm to help classification models perform better. AdaBoost sequentially creates several learning models. The first model is created by conventionally fitting the classifier to the given dataset. The second model is then created by training a second instance of the classifier using the same set of data, with an emphasis on the samples that the previous model incorrectly identified. The third model then uses the weak classifiers from the prior model to train the classifier. By integrating misfit samples of the classifier into a robust classifier or merging weak learners’ decision trees from learning models, very accurate predictions may be made to improve the final predictive performance of the system.
Let
• Set weights
• Consider Eq. (1) condition for
• Update the weights according to Eq. (2) for
where
• Choose the generated weak classifier that minimizes the sum of weighted classification errors.
• The classifier’s weight is adjusted after each iteration to make it focus on sample points that are challenging to categorize correctly. After an iteration, this is accomplished by updating misclassified sample points with higher weights. In the following iteration, our learning system would pay more attention to these sample points by assigning them increased weights. In contrast, classifiers would assign less weight to the well-categorized sample points and give less attention in the next iteration. The final prediction is then calculated by summing the weighted predictions from all classifiers.
• It has been demonstrated that using the AdaBoost method, if the misclassification rates of the weak classifiers are less than 50%, then the weighted classification error rate of the strong classifier will converge to zero as the number of iterations increases, i.e., when
• The basis of Eq. (3) is that misclassification rates for the weak classifiers are less than 50%.
• By merging the decision trees for the descriptive and statistical aspects of the smart meter into a robust classifier, the linkages between these features are naturally handled. This is the primary reason why our AdaBoost-based algorithm achieves good attack detection results.
The decision trees reduce the total of the incorrect classification outputs for true (faulty) and false (non-faulty) samples. The misclassification rates for the selected weak learners are guaranteed to be lower than fifty percent, assuring the algorithm’s convergence.
4.2 Data pre-processing
The first step toward training the detection model is data pre-processing, which includes cleaning the raw data, filling in the missing values, and removing extreme values. Our power theft detection model uses energy consumption measurements from a real smart meter dataset of 5,000 customers for training and evaluation purposes (ISSDA, 2020). This dataset comprises energy consumption readings from residential and business users from 2009 to 2010, spanning 533 days. To enhance the financial analysis for a statewide deployment, the main purpose of this study is to assess the impact of user power to find energy theft. Six data sample files containing records of 533 days in each file made up the raw dataset. Each file has three columns: the smart meter identifier, the encoded date and time, and the amount of energy used in kWh. Every document includes 533 days’ worth of metering information for every client, captured every half hour, i.e., each user’s daily consumption data presented by 48 vector components. All of the consumers’ consumption is included in the raw data collection. To prepare the data for our experiment, we divided the raw files by meter ID into many consumption datasets.
Assume
Missing values are those in which the smart meter cannot record the meter readings for reasons such as an error in transmission, a component break, and a bad connection. When missing values are incorrectly handled, a biased ML model is created, producing unreliable results. The most repeated value imputation method is used to fill in the missing value in the proposed method. The mathematical representation is as follows:
where mode
4.2.1 Feature extraction
In the second phase of the cleaning process crucial for time-series classification, extreme values are eliminated from the raw dataset. This step is pivotal for accurate classification results. Effective feature extraction is vital for enhanced accuracy and interpretability. The dynamic nature of an individual user’s daily consumption pattern necessitates stable features reflecting daily and weekly load patterns. To achieve this, descriptive and statistical features, detailed in Table 4, are extracted monthly for each time slot reading across the entire period. Extreme values, indicative of unusual activities such as vacations or changes in appliances or residences, are removed to ensure data integrity. This refined dataset forms the basis for robust time-series classification.
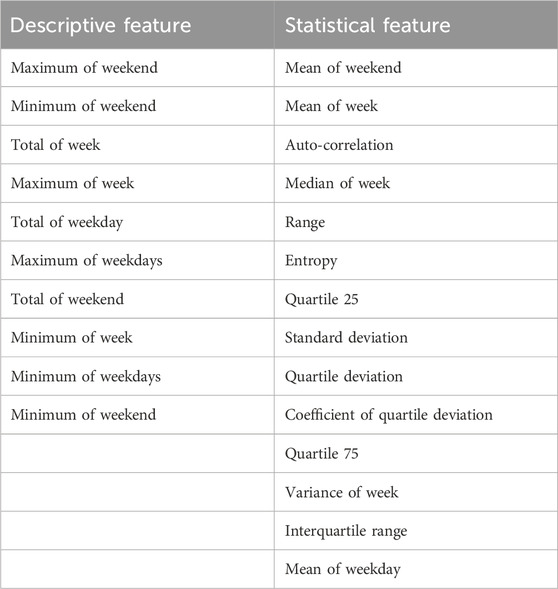
Table 4. List of features extracted.
4.3 Training phase
The next module is used to train a model with the energy meter data readings for the detection of energy theft. For that purpose, we need both benign data and malicious data; otherwise, the classifier will face the problem of data balancing and make the efficiency of the theft detection system low. As the malicious data are not available and it is difficult to gather faulty readings, we propose synthetically generating the malicious dataset for different types of five FDI attack scenarios to address this issue. The attacks in Table 2 are based upon the partial reduction of A1 and A2 attacks, and in Table 3, price-based attacks A3, A4, and A5. Energy theft aims to record less usage than the user uses or shift high usage to low-tariff times. Therefore, it is easy to produce malicious samples using benign samples. The suggested ensemble approach is used to detect intruders using meter reading data once the data have been properly formatted. We randomly choose 50% of the data for each user to create five synthetic attack patterns. After generating attack patterns
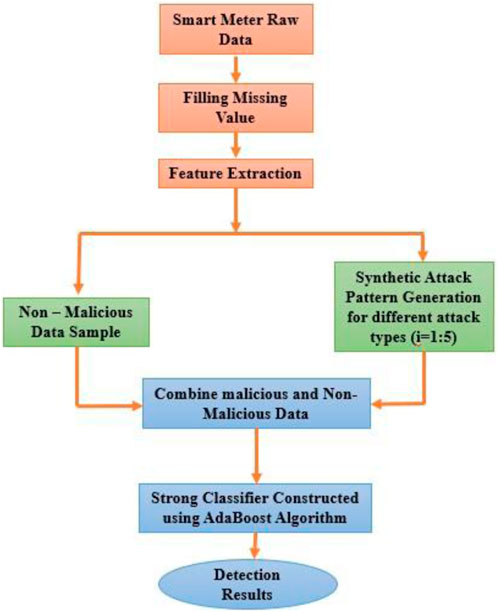
Figure 4. Framework of the proposed algorithm.
4.4 Testing phase
Following the training set, pre-processing and format conversion are performed on each new smart meter reading. Determining whether data are genuine or false, i.e., if testing data belong to the non-malicious or malicious type, enables us to make detection decisions for false data. After introducing a synthetic attack, the AdaBoost ensemble technique is applied to a fresh meter reading to assess whether it belongs to the faulty or non-faulty class. The newly created sample is uploaded to the genuine dataset, and the appropriate attack patterns are created and added to the attack dataset. When the fresh sample presented to the classifier identified an assault, the smart meter’s suspicious behavior was notified. After that, more data samples of the same meter ID were tested, and suspicious behavior was reported
5 Results and discussions
To verify the efficacy of the proposed approach, various supervised algorithms are applied to the data sample described in Section 4. The performance of our scheme was assessed using the metrics accuracy (
where
The model performance is better when
5.1 Experiment no. 1
In the first experiment, different existing AI techniques are applied to the smart meter data for A1. In our experiment, we assume the
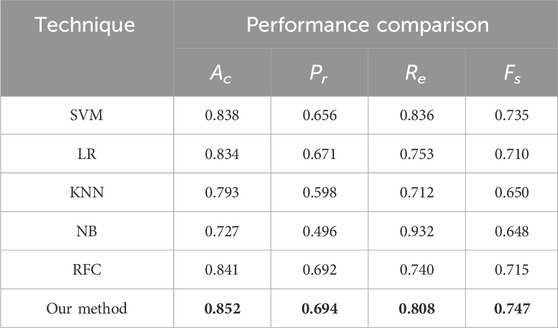
Table 5. Performance parameter comparison for A1.
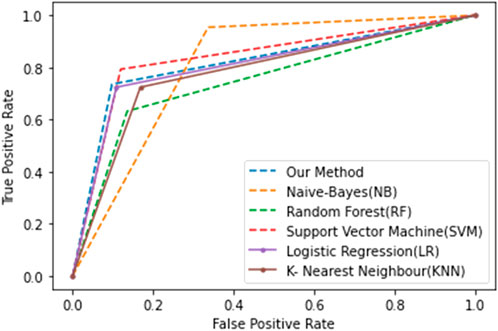
Figure 5. Comparison of the ROC curve of the proposed method with existing methods for A1.
5.2 Experiment no. 2
This experiment is conducted for A2 belonging to the partial reduction FDI attack class, in which a synthetic attack pattern is generated using the definition mentioned in Table 2 and merged with the normal smart meter data. In this, the malicious value

Table 6. Performance parameter comparison for A2.
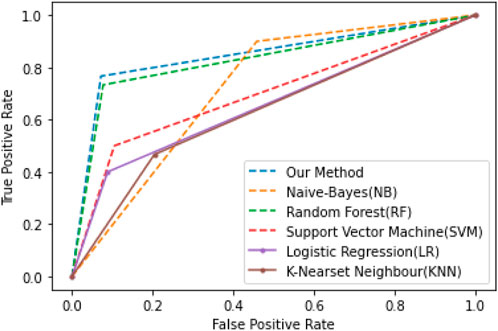
Figure 6. Comparison of the ROC curve of the proposed method with existing methods for A2.
5.3 Experiment no. 3
The price control-based FDI attack A3 was the focus of experiment 3, in which the altered meter reading
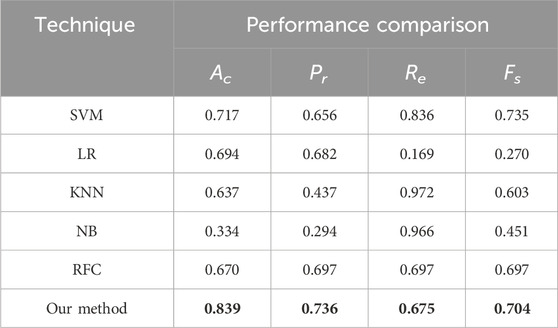
Table 7. Performance parameter comparison for A3.
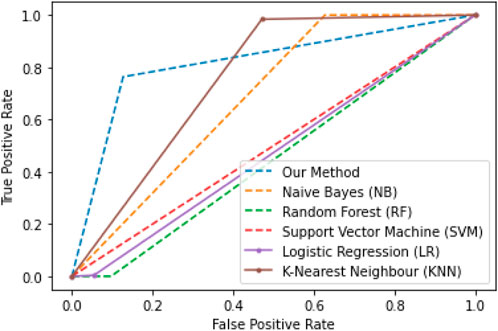
Figure 7. Comparison of the ROC curve of the proposed method with existing methods for A3.
5.4 Experiment no. 4
Experiment 4 is conducted for A4 of the price control FDI class, similar to A3, where fraudulent customers attempt with the same motive. A faulty meter malicious reading is generated by multiplying the mean of the whole day consumption by the random number

Table 8. Performance parameter comparison for A4.
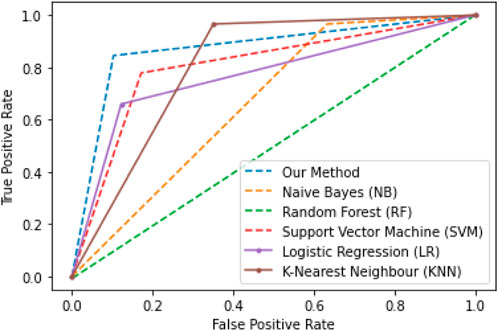
Figure 8. Comparison of the ROC curve of the proposed method with existing methods for A4.
5.5 Experiment no. 5
A synthetic attack pattern was generated for A5 in this test. Malicious reading is obtained by multiplying the real meter reading value with a random value

Table 9. Performance parameter comparison for A5.
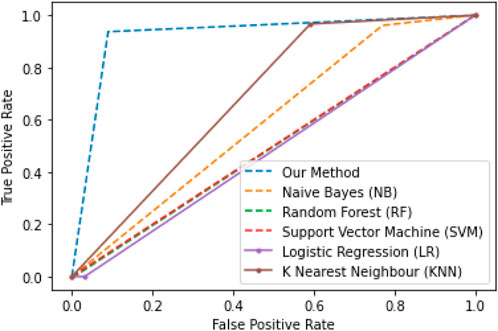
Figure 9. Comparison of the ROC curve of the proposed method with existing methods for A5.
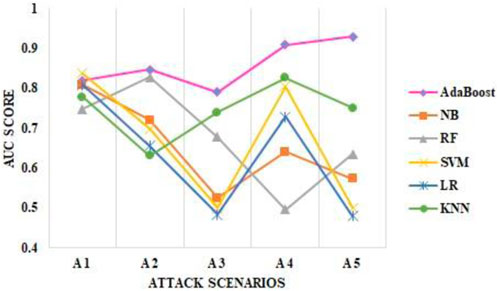
Figure 10. Comparison of the AUC score of different attack scenarios (A1–A5) for the proposed method with other state-of-the-art methods.
6 Conclusion
In this study, we provide an ensemble AdaBoost approach for depicting the relationship between false-positive and true-positive rates. It serves as a comprehensive measure of classification performance. By leveraging these established metrics, we ensure a thorough demonstration of the proposed scheme’s robustness and suitability for handling unbalanced datasets in classification scenarios or identifying fraudulent users of the SG framework. Numerous models are combined sequentially using the ensemble approach to enhance the ultimate prediction performance. The approach involves providing high weightage to the misclassified user’s data samples and iterating again to give better predictions while reducing the false positive rate
Data availability statement
The original contributions presented in the study are included in the article/Supplementary Material; further inquiries can be directed to the corresponding authors.
Author contributions
TG: conceptualization, data curation, methodology resources, software, writing–original draft, and writing–review and editing. RB: data curation, methodology, supervision, validation, project administration, and writing–review and editing. SS: conceptualization, data curation, investigation, methodology, project administration, software, supervision, and writing–original draft. CR: investigation, methodology, writing–original draft, and writing–review and editing. KA: conceptualization, investigation, software, and writing–review and editing. WM: data curation, methodology, and writing–review and editing.
Funding
The author(s) declare that no financial support was received for the research, authorship, and/or publication of this article.
Conflict of interest
The authors declare that the research was conducted in the absence of any commercial or financial relationships that could be construed as a potential conflict of interest.
Publisher’s note
All claims expressed in this article are solely those of the authors and do not necessarily represent those of their affiliated organizations, or those of the publisher, the editors, and the reviewers. Any product that may be evaluated in this article, or claim that may be made by its manufacturer, is not guaranteed or endorsed by the publisher.
References
Ahmad, T., Chen, H., Wang, J., and Guo, Y. (2018). Review of various modeling techniques for the detection of electricity theft in smart grid environment. Renew. Sustain Energy Rev. 82, 2916–2933. doi:10.1016/j.rser.2017.10.040
Alexopoulos, T. A., Korres, G. N., and Manousakis, N. M. (2020). Complementarity reformulations for false data injection attacks on PMU-only state estimation. Electr. Power Syst. Res. 189, 106796. doi:10.1016/j.epsr.2020.106796
Amin, S. (2015). Game-theoretic models of electricity theft detection in smart utility networks: providing new capabilities with advanced metering infrastructure. IEEE Control Syst. 35, 66–81. doi:10.1109/MCS.2014.2364711
Amin, S., Schwartz, G. A., and Tembine, H. (2012). Incentives and security in electricity distribution networks, 264–280. doi:10.1007/978-3-642-34266-0_16
Attia, M., Senouci, S. M., Sedjelmaci, H., Aglzim, E.-H., and Chrenko, D. (2018). An efficient Intrusion Detection System against cyber-physical attacks in the smart grid. Comput. Electr. Eng. 68, 499–512. doi:10.1016/j.compeleceng.2018.05.006
Aziz, S., Hassan Naqvi, S. Z., Khan, M. U., and Aslam, T. (2020). “Electricity theft detection using empirical mode decomposition and K-nearest neighbors,” in 2020 Int. Conf. Emerg. Trends Smart Technol., IEEE, Karachi, Pakistan, 26-27 March 2020, 1–5. doi:10.1109/ICETST49965.2020.9080727
Buzau, M. M., Tejedor-Aguilera, J., Cruz-Romero, P., and Gomez-Exposito, A. (2019). Detection of non-technical losses using smart meter data and supervised learning. IEEE Trans. Smart Grid 10, 2661–2670. doi:10.1109/TSG.2018.2807925
Cao, B., Zhao, J., Gu, Y., Fan, S., and Yang, P. (2020). Security-aware industrial wireless sensor network deployment optimization. IEEE Trans. Ind. Inf. 16, 5309–5316. doi:10.1109/TII.2019.2961340
Chen, B., Hu, J., Zhao, Y., and Ghosh, B. K. (2022b). Finite-time velocity-free rendezvous control of multiple AUV systems with intermittent communication. IEEE Trans. Syst. Man. Cybern. Syst. 52, 6618–6629. doi:10.1109/TSMC.2022.3148295
Chen, Y., Zhu, L., Hu, Z., Chen, S., and Zheng, X. (2022a). Risk propagation in multilayer heterogeneous network of coupled system of large engineering Project. J. Manag. Eng. 38. doi:10.1061/(ASCE)ME.1943-5479.0001022
Cheng, B., Wang, M., Zhao, S., Zhai, Z., Zhu, D., and Chen, J. (2017). Situation-aware dynamic service coordination in an IoT environment. IEEE/ACM Trans. Netw. 25, 2082–2095. doi:10.1109/TNET.2017.2705239
Depuru, SSSR, Wang, L., Devabhaktuni, V., and Nelapati, P. (2011). “A hybrid neural network model and encoding technique for enhanced classification of energy consumption data,” in 2011 IEEE Power Energy Soc. Gen. Meet., IEEE, Detroit, Michigan, USA, 24-29 July 2011, 1–8. doi:10.1109/PES.2011.6039050
Guarda, F., Hammerschmitt, B., Capeletti, M., Neto, N., dos Santos, L., Prade, L., et al. (2023). Non-hardware-based non-technical losses detection methods: a review. Energies 16, 2054. doi:10.3390/en16042054
Guo, C., and Hu, J. (2023). Time base generator-based practical predefined-time stabilization of high-order systems with unknown disturbance. IEEE Trans. Circuits Syst. II Express Briefs 70, 2670–2674. doi:10.1109/TCSII.2023.3242856
Gupta, T., and Bhatia, R. (2020). “Communication technologies in smart grid at different network layers: an overview,” in 2020 Int. Conf. Intell. Eng. Manag., IEEE, Singapore, December 14-17, 2020, 177–182. doi:10.1109/ICIEM48762.2020.9160099
Gupta, T., Bhatia, R., and Sharma, R. (2022). False data injection attack detection using machine learning in smart grid: approaches, datasets, and comparative study. Datasets, Comp. Study, 1081–1090. doi:10.1007/978-981-19-4364-5_76
Henriques, H. O., Barbero, A. P. L., Ribeiro, R. M., Fortes, M. Z., Zanco, W., Xavier, O. S., et al. (2014). Development of adapted ammeter for fraud detection in low-voltage installations. Measurement 56, 1–7. doi:10.1016/j.measurement.2014.06.015
ISSDA (2020). Irish social science data archive. Available at: https://www.ucd.ie/issda/ (Accessed June 24, 2020).
Jain, H., Kumar, M., and Joshi, A. M. (2022). Intelligent energy cyber physical systems (iECPS) for reliable smart grid against energy theft and false data injection. Electr. Eng. 104 (4), 331–346. doi:10.1007/s00202-021-01380-9
Jiang, H., Wang, M., Zhao, P., Xiao, Z., and Dustdar, S. (2021). A utility-aware general framework with quantifiable privacy preservation for destination prediction in LBSs. IEEE/ACM Trans. Netw. 29, 2228–2241. doi:10.1109/TNET.2021.3084251
Jiang, Y., and Li, X. (2022). Broadband cancellation method in an adaptive co-site interference cancellation system. Int. J. Electron 109, 854–874. doi:10.1080/00207217.2021.1941295
Jin, M., Lavaei, J., and Johansson, K. H. (2019). Power grid AC-based state estimation: vulnerability analysis against cyber attacks. IEEE Trans. Autom. Contr 64, 1784–1799. doi:10.1109/TAC.2018.2852774
Jokar, P., Arianpoo, N., and Leung, V. C. M. (2013). “Intrusion detection in advanced metering infrastructure based on consumption pattern,” in 2013 IEEE Int. Conf. Commun., IEEE, Budapest, Hungary, 13 June 2013, 4472–4476. doi:10.1109/ICC.2013.6655271
Jokar, P., Arianpoo, N., and Leung, V. C. M. (2016). Electricity theft detection in AMI using customers’ consumption patterns. IEEE Trans. Smart Grid 7, 216–226. doi:10.1109/TSG.2015.2425222
Keping, Yu, Arifuzzaman, M., Zheng, W., Zhang, Di, and Sato, T. (2015). A key management scheme for secure communications of information centric advanced metering infrastructure in smart grid. IEEE Trans. Instrum. Meas. 64, 2072–2085. doi:10.1109/TIM.2015.2444238
Kong, J., Jiang, W., Tian, Q., Jiang, M., and Liu, T. (2023). Anomaly detection based on joint spatio-temporal learning for building electricity consumption. Appl. Energy 334, 120635. doi:10.1016/j.apenergy.2022.120635
Li, T., and Li, Y. (2023). Artificial intelligence for reducing the carbon emissions of 5G networks in China. Nat. Sustain 6, 1522–1523. doi:10.1038/s41893-023-01208-3
Lin, X., Liu, Y., Yu, J., Yu, R., Zhang, J., and Wen, H. (2022). Stability analysis of Three-phase Grid-Connected inverter under the weak grids with asymmetrical grid impedance by LTP theory in time domain. Int. J. Electr. Power Energy Syst. 142, 108244. doi:10.1016/j.ijepes.2022.108244
Liu, D., Cao, Z., Jiang, H., Zhou, S., Xiao, Z., and Zeng, F. (2023b). Concurrent low-power listening: a new design paradigm for duty-cycling communication. ACM Trans. Sens. Netw. 19, 1–24. doi:10.1145/3517013
Liu, X., Lou, S., and Dai, W. (2023a). Further results on “System identification of nonlinear state-space models.”. Automatica 148, 110760. doi:10.1016/j.automatica.2022.110760
Lyu, T., Xu, H., Zhang, L., and Han, Z. (2024). Source selection and resource allocation in wireless-powered relay networks: an adaptive dynamic programming-based approach. IEEE Internet Things J. 11, 8973–8988. doi:10.1109/JIOT.2023.3321673
Ma, J., and Hu, J. (2022). Safe consensus control of cooperative-competitive multi-agent systems via differential privacy. Kybernetika, 426–439. doi:10.14736/kyb-2022-3-0426
Mo, J., and Yang, H. (2023). Sampled value attack detection for busbar differential protection based on a negative selection immune system. J. Mod. Power Syst. Clean. Energy 11, 421–433. doi:10.35833/MPCE.2021.000318
Mrabet, Z. El, Kaabouch, N., El, G. H., and El, G. H. (2018). Cyber-security in smart grid: survey and challenges. Comput. Electr. Eng. 67, 469–482. doi:10.1016/j.compeleceng.2018.01.015
Pei, C., Xiao, Y., Liang, W., and Han, X. (2020). PMU placement protection against coordinated false data injection attacks in smart grid. IEEE Trans. Ind. Appl., 1. doi:10.1109/TIA.2020.2979793
Pengwah, A. B., Razzaghi, R., and Andrew, L. L. H. (2023). Model-less non-technical loss detection using smart meter data. IEEE Trans. Power Deliv. 38, 3469–3479. doi:10.1109/TPWRD.2023.3280551
Sharma, R., Joshi, A. M., Sahu, C., and Nanda, S. J. (2023). Detection of false data injection in smart grid using PCA based unsupervised learning. Electr. Eng. 105, 2383–2396. doi:10.1007/s00202-023-01809-3
Song, J., Mingotti, A., Zhang, J., Peretto, L., and Wen, H. (2022). Accurate damping factor and frequency estimation for damped real-valued sinusoidal signals. IEEE Trans. Instrum. Meas. 71, 1–4. doi:10.1109/TIM.2022.3220300
Sun, G., Liao, D., Zhao, D., Xu, Z., and Yu, H. (2018). Live migration for multiple correlated virtual machines in cloud-based data centers. IEEE Trans. Serv. Comput. 11, 279–291. doi:10.1109/TSC.2015.2477825
Tan, J., Jin, H., Hu, H., Hu, R., Zhang, H., and Zhang, H. (2023). WF-MTD: evolutionary decision method for moving target defense based on wright-Fisher process. IEEE Trans. Dependable Secur Comput. 20, 4719–4732. doi:10.1109/TDSC.2022.3232537
Wang, Q., Dai, W., Zhang, C., Zhu, J., and Ma, X. (2024). A compact constraint incremental method for random weight networks and its application. IEEE Trans. Neural Netw. Learn Syst., 1–9. doi:10.1109/TNNLS.2023.3289798
Wang, Y., Jiang, X., Xie, X., Yang, X., and Xiao, X. (2021). Identifying sources of subsynchronous resonance using wide-area phasor measurements. IEEE Trans. Power Deliv. 36, 3242–3254. doi:10.1109/TPWRD.2020.3037289
Wang, Y., Yang, H., Xie, X., Yang, X., and Chen, G. (2023). Real-time subsynchronous control interaction monitoring using improved intrinsic time-scale decomposition. J. Mod. Power Syst. Clean. Energy 11, 816–826. doi:10.35833/MPCE.2021.000464
Xia, X., Xiao, Y., and Liang, W. (2019). ABSI: an adaptive binary splitting algorithm for malicious meter inspection in smart grid. IEEE Trans. Inf. Forensics Secur 14, 445–458. doi:10.1109/TIFS.2018.2854703
Xiao, Z., Yang, X., and Du, D. H.-C. (2013). Non-repudiation in neighborhood area networks for smart grid. IEEE Commun. Mag. 51, 18–26. doi:10.1109/MCOM.2013.6400434
Yang, M., Wang, Y., Xiao, X., and Li, Y. (2023). A robust damping control for virtual synchronous generators based on energy reshaping. IEEE Trans. Energy Convers. 38, 2146–2159. doi:10.1109/TEC.2023.3260244
Yang, X., Zhang, X., Lin, J., Yu, W., and Zhao, P. (2016). “A Gaussian-mixture model based detection scheme against data integrity attacks in the smart grid,” in 2016 25th Int. Conf. Comput. Commun. Networks, IEEE, Waikoloa, Hawaii, USA, 1-4 August 2016, 1–9. doi:10.1109/ICCCN.2016.7568478
Yu, J., Lu, L., Chen, Y., Zhu, Y., and Kong, L. (2021). An indirect eavesdropping attack of keystrokes on touch screen through acoustic sensing. IEEE Trans. Mob. Comput. 20, 337–351. doi:10.1109/TMC.2019.2947468
Zhang, H., Li, Y., Gao, D. W., and Zhou, J. (2017). Distributed optimal energy management for energy internet. IEEE Trans. Ind. Inf. 13, 3081–3097. doi:10.1109/TII.2017.2714199
Zhang, H., Mi, Y., Fu, Y., Liu, X., Zhang, Y., Wang, J., et al. (2023a). Security defense decision method based on potential differential game for complex networks. Comput. Secur 129, 103187. doi:10.1016/j.cose.2023.103187
Zhang, H., Mi, Y., Liu, X., Zhang, Y., Wang, J., and Tan, J. (2023b). A differential game approach for real-time security defense decision in scale-free networks. Comput. Netw. 224, 109635. doi:10.1016/j.comnet.2023.109635
Zhang, R., Li, L., Zhang, Q., Zhang, J., Xu, L., Zhang, B., et al. (2024). Differential feature awareness network within antagonistic learning for infrared-visible object detection. IEEE Trans. Circuits Syst. Video Technol., 1. doi:10.1109/TCSVT.2023.3289142
Zhang, X., Wang, Y., Yang, M., and Geng, G. (2021). Toward concurrent video multicast orchestration for caching-assisted mobile networks. IEEE Trans. Veh. Technol. 70, 13205–13220. doi:10.1109/TVT.2021.3119429
Zheng, W., Deng, P., Gui, K., and Wu, X. (2023). An Abstract Syntax Tree based static fuzzing mutation for vulnerability evolution analysis. Inf. Softw. Technol. 158, 107194. doi:10.1016/j.infsof.2023.107194
Keywords: advanced metering infrastructure, cyber security, false data injection attacks, feature extraction, machine learning, smart meter
Citation: Gupta T, Bhatia R, Sharma S, Reddy CR, AboRas KM and Mobarak W (2024) A data-driven ensemble technique for the detection of false data injection attacks in the smart grid framework. Front. Energy Res. 12:1366465. doi: 10.3389/fenrg.2024.1366465
Received: 06 January 2024; Accepted: 01 April 2024;
Published: 26 April 2024.
Edited by:
Flah Aymen, École Nationale d'Ingénieurs de Gabès, TunisiaReviewed by:
Uchenna Diala, University of Derby, United KingdomNikolaos Manousakis, University of West Attica, Greece
Copyright © 2024 Gupta, Bhatia, Sharma, Reddy, AboRas and Mobarak. This is an open-access article distributed under the terms of the Creative Commons Attribution License (CC BY). The use, distribution or reproduction in other forums is permitted, provided the original author(s) and the copyright owner(s) are credited and that the original publication in this journal is cited, in accordance with accepted academic practice. No use, distribution or reproduction is permitted which does not comply with these terms.
*Correspondence: Tania Gupta, dGFuaWFndXB0YTI0MDlAZ21haWwuY29t; Ch. Rami Reddy, Y3JyZWRkeTIyOUBnbWFpbC5jb20=; Wael Mobarak, dy5mYXd6eUB1YnQuZWR1LnNh