- College of Electrical Engineering, Shanghai University of Electric Power, Shanghai, China
Fault diagnosis of wind turbine gearbox is essential to ensure operational efficiency and prevent costly downtime. However, conventional deep learning models often struggle with domain shift, where the distribution of testing data differs from that of training data. This issue is more pronounced with out-of-distribution inputs—data outside the conditions the model was trained on. These challenges can lead to unreliable diagnostic results and potentially hazardous situations. To address this, we introduce Spectral Normalization and Gaussian Process methods into Res2Net framework to enhance its ability to detect out-of-distribution data. Spectral Normalization and Gaussian Process improve the model’s ability to assess the distance between test and training data. This model can handle out-of-distribution data due to both epistemic and aleatory uncertainty. The experiment collected raw vibration signals from gearbox under varied conditions. Unknown faults simulated epistemic uncertainty, while noisy samples resulted in aleatory uncertainty. These signals were converted into images using the Gramian Angular Difference Field transformation. The resulting images were then fed into the Res2Net model, enhanced with Spectral Normalization and Gaussian Process. The model outputs include classification results and corresponding uncertainty values based on distance awareness. With quantified uncertainty values, the model can reflect the trustworthiness of the diagnostic results. By comparing these uncertainty values with predefined thresholds, it is possible to distinguish whether the data are out-of-distribution or not. Experiments have proven the superiority of the Distance-Aware Res2Net in out-of-distribution detection and fault diagnosis.
1 Introduction
It is important to develop fault diagnosis and health management techniques to monitor machine health in real time. In the past, traditional machine learning theories were popular in intelligent fault diagnosis, such as artificial neural networks (Ben Ali et al., 2015; Behim et al., 2024), k-nearest neighbors (Liu et al., 2021; Zhenya and Xueliang, 2022) and support vector machines (Jiang et al., 2021; Wang et al., 2024). Among these methods, fault features are manually extracted from the collected data. Sensitive features are then selected to train the diagnostic model for automatic diagnosis of machine health conditions. Traditional machine learning methods rely heavily on human labor for feature extraction. They are unable to keep up with the growing volume of data. This leads to less accurate diagnosis. Moreover, these methods are limited to extracting superficial features and lack the capability to uncover deep-seated fault information.
Deep learning approaches like Stacked Auto-encoders (Chen et al., 2023; Zhao et al., 2024), Deep Belief Networks (Tang et al., 2024; Lu et al., 2021), and Convolutional Neural Networks (CNN) (Chen et al., 2019; Zhou et al., 2023) including Residual Neural Networks (ResNet) (He et al., 2016), have facilitated the development of intelligent fault diagnosis. These methods rely less on expert knowledge and have achieved remarkable results in various applications. According to the input dimension, fault diagnosis methods using CNN can be divided into two categories. The first category uses one-dimensional signals as CNN input. For example, Zhao et al. (2023) added an adaptive activation function to a 1-D convolutional neural network for fault diagnosis of the planetary gearbox. Zhang et al. (2019) proposed an algorithm based on one-dimensional ResNet for vibration signals, which showed better performance than the 1D-CNN in bearing fault diagnosis. Some researchers argue that, with advancements in artificial intelligence, image classification methods offer greater advantages over raw signal analysis. This is mainly because most well-known CNN models require two-dimensional images as input to fully leverage the networkperformance (Sun and Wang, 2024). Many methods for converting one-dimensional data into two-dimensional images have been applied in intelligent fault diagnosis. For example, the spectrum based on Fourier transform (Yi et al., 2023), the scalogram based on wavelet transform (Li et al., 2024), the Gramian angular field (Gu et al., 2023), and the Markov transition field (Yan et al., 2022), and so on. The converted images provide greater convenience for data mining and classification tasks. Deep learning automatically learns high-level representations in images. This approach adaptively mines essential features that reflect the health status of rotating machinery. Unlike traditional intelligent fault diagnosis, it does not rely on expert experience or manual feature extraction.
The effectiveness of deep learning models relies on the assumption that the training and test data distributions are the same. However, this condition is rarely met in real-world scenarios (Han and Li, 2022). Wind turbines are subject to variable environmental conditions and complex operating states, causing their fault modes to be varied and difficult to predict. These factors affect the distribution of fault data, leading to differences from the training set. Consequently, the diagnostic effectiveness of the model is impacted. The discrepancy between ideal assumption and real-world conditions raises a key challenge: The model fails to adapt to new fault patterns and changes in environmental noise, resulting in outputs that lack utility in real-world applications. Furthermore, when faced with unknown situations, the model may display overconfidence and fail to recognize its own limitations. This can lead to the spread of incorrect information and inappropriate decision-making. To address this issue, domain adaptation has been proposed (Wan et al., 2022; Tang et al., 2021; Zhang et al., 2024). However, domain adaptation still requires some knowledge of the target domain data. This is because one of the main challenges of domain adaptation is narrowing the distributional differences between the source domain (training data) and the target domain (where the model will be applied). Explicitly identifying these differences is essential for designing an effective adaptive strategy. Arbitrary unknown faults may occur in real applications, and domain adaptation is not always the best solution.
Therefore, when confronted with unknown fault types, methods for uncertainty quantification (UQ) need to be introduced. A significant benefit of UQ is that it enables end users to assess when the model’s predictions are reliable and when they should exercise additional caution in making decisions based on those predictions. Consequently, UQ can provide valuable information about the limitations of diagnostic coverage, leading to more informed decisions in operation and maintenance.
The mainstream UQ methods include Bayesian neural network, neural network ensemble, etc. These methods have been applied in the fields of autonomous driving, medical health, speech recognition, image processing, and more (Abdar et al., 2021). However, they have not received much attention from researchers in fault diagnosis. Han and Li (2022) integrated several deep neural networks to create a diagnostic system called “deep ensembles.” This system enables credible analysis to identify out-of-distribution samples and provides alerts for potentially unreliable diagnoses. Zhou et al. (2022) proposed a method for UQ of fault diagnosis results in a probabilistic Bayesian deep learning framework, which utilizes the uncertainty information to differentiate unknown domains, thus enabling trustworthy machine fault diagnosis. However, their practicality in real-time and industrial-scale applications is limited by memory and inference costs. Bayesian neural networks quantify uncertainty by inferring the probability distribution of weights, a process that is computationally intensive. This leads to slow inference speeds. It is not suitable for applications that need real-time responses. Deep ensembles estimate uncertainty by training multiple independent models and combining their predictions. This means that the required computing resources, memory, and training time increase significantly with each additional model, making it difficult to deploy in resource-constrained environments. Therefore, it becomes particularly important to have UQ methods that are both effective and have low inference costs for application in fault diagnosis. The main contributions of this paper are as follows:
1. An experiment was designed in the laboratory to simulate the power generation process of wind turbines, aimed at extracting vibration signals corresponding to different health conditions of the turbines. The collected vibration signals were transformed into two-dimensional images using the Gramian Angular Difference Field (GADF). This data transformation facilitates the extraction of informative features from raw data, thereby enhancing the performance of classifiers.
2. Spectral Normalization (SN) and Gaussian Process (GP) were integrated within the Res2Net architecture to improve the model’s ability to handle unknown out-of-distribution data. By assessing the distance between training and testing data, an uncertainty estimate is obtained. In this way, the model provides classification results. It also informs maintenance personnel when the diagnostic results are trustworthy and when human expert intervention is required.
3. To validate the performance of the proposed model, its classification and out-of-distribution detection (OOD) capabilities were tested under various unknown fault conditions and noise levels. The proposed model consistently achieves complete detection in out-of-distribution scenarios while maintaining high accuracy in in-domain (ID) distribution fault detection and classification. The experiments demonstrate the necessity and effectiveness of the proposed model in practical applications.
The rest of the paper is organized as follows. Section 2 introduces the theoretical background of the proposed fault diagnosis method. In Section 3, the proposed Distance-Aware Res2Net architecture and the detailed diagnostic process are described. Section 4 compares the performance of the Distance-Aware Res2Net model with traditional models and demonstrates the necessity of out-of-distribution detection research. It also analyzes the effectiveness of the model in handling different types of out-of-distribution data. Finally, Section 5 provides the conclusions.
2 Preliminaries
2.1 Gramian angular difference field
The GADF is used to encode time series data into a two-dimensional image while preserving the temporal dependencies and patterns present in the original signal (Wang and Oates, 2015). The process involves three main steps: normalization, polar coordinate transformation, and Gramian matrix computation.
Firstly, the time series
where
Secondly, the normalized time series is transformed into polar coordinates. Each value
where
Finally, the Gramian Angular Difference Field is computed as the difference between the cosines of the pairwise angles, as illustrated in Equation 3:
Through the above transformation, the original one-dimensional time series is mapped into a two-dimensional matrix, where each element of the matrix corresponds to a
Figure 1 illustrates the entire process of converting a time series vibration signal into a GADF image. The GADF transformation offers a robust method for converting time series data into images, which can subsequently be used as input for deep learning. This transformation preserves the temporal dependencies of the original signal. This makes it suitable for fault diagnosis tasks where these dependencies are crucial. Unlike spectrum based on Fourier transform and Scalogram based on wavelet transform, GADF does not rely on expert experience, making it a more accessible and automated approach for data transformation.
2.2 Res2Net module
The Res2Net module represents a significant advancement in convolutional neural network architectures (Gao et al., 2021). It is specifically designed to enhance the model’s capability to process information at multiple scales simultaneously. The main innovation of Res2Net is its new way of processing feature maps. This approach allows for richer feature interactions and more complex representations. These qualities are important for tasks that need to identify fine-grained details.
Figure 2 compares the traditional bottleneck block and the Res2Net module. The bottleneck block (a) typically consists of a sequence of 1 × 1, 3 × 3, and another 1 × 1 convolution, simplifying the feature processing. In contrast, the Res2Net module (b) introduces a substantial modification by splitting the input feature map into multiple slices (x1, x2, x3, x4), each processed by its convolutional path (K2, K3, K4) and then hierarchically integrating them. This hierarchical integration lets each layer process its specific slice of features. At the same time, it accumulates and refines outputs from the previous slices. As a result, the network’s ability to capture diverse features at different scales is enhanced. By allowing each branch to learn at a different scale and then hierarchically integrating these multi-scale features, Res2Net can adaptively learn the features most relevant to the task at hand. This is particularly beneficial for analyzing images with varying object sizes and complexities.
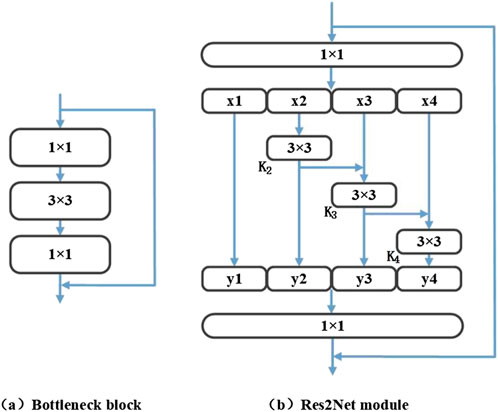
Figure 2. Comparison between the bottleneck block and the Res2Net module. (A) Bottleneck block (B) Res2Net module.
2.3 Spectral Normalization
Spectral Normalization is employed to stabilize the training of the discriminator in generative adversarial networks (Miyato et al., 2018). The distance between data in the input space and the hidden space can be preserved by adding Spectral Normalization to the learned latent representations of a neural network (Liu et al., 2022).
To control the Lipschitz constant of the discriminator function
which is equivalent to the largest singular value of the matrix
By normalizing the weight matrix
which guarantees that
In neural networks, the bi-Lipschitz condition requires that the hidden mapping
where
2.4 Gaussian Process
The GP model with radial basis function kernel is distance-aware (Liu et al., 2022). Its predictive distribution
where
and
Specifically, given input samples
where
where
To simplify computation and make inference easier, two approximation methods are applied to the output layer of the GP: (1) the GP model is extended into the random Fourier feature space, transforming it into a simpler Bayesian linear model (Rahimi and Recht, 2007); (2) the posterior distribution is approximated using Laplace approximation (Liu et al., 2018).
3 Methodology
3.1 Distance-Aware Res2Net
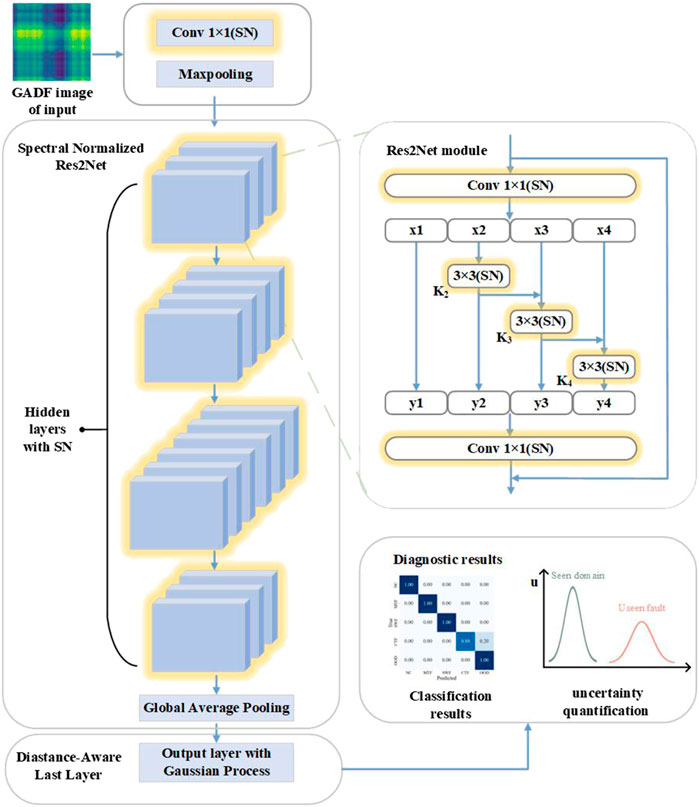
The structure of Distance-Aware Res2Net is illustrated in Figure 3. This network architecture takes advantage of the properties of Res2Net, characterized by its multi-scale feature extraction capability, allowing the network to capture more detailed and comprehensive information from the image, thus improving the overall classification accuracy. The network begins with input GADF images. These images first pass through a spectral normalized 1 × 1 convolutional layer. Then comes the Maximum Pooling layer, which reduces the size of the feature map while preserving important features. Next comes the main part of the network, consisting of four stages, each with 3, 4, 6, and 3 spectral normalized Res2Net modules, each containing four parallel convolutional branches inside. The right side of the figure provides a detailed view of the internal structure of the Res2Net module. This hierarchical structure allows the network to progressively transition from simple to complex features, effectively improving learning ability and diversity of feature representation. Each convolutional layer in the network is applies SN (highlighted in yellow) to ensure that the hidden mappings are distance preserving. This means that the distance
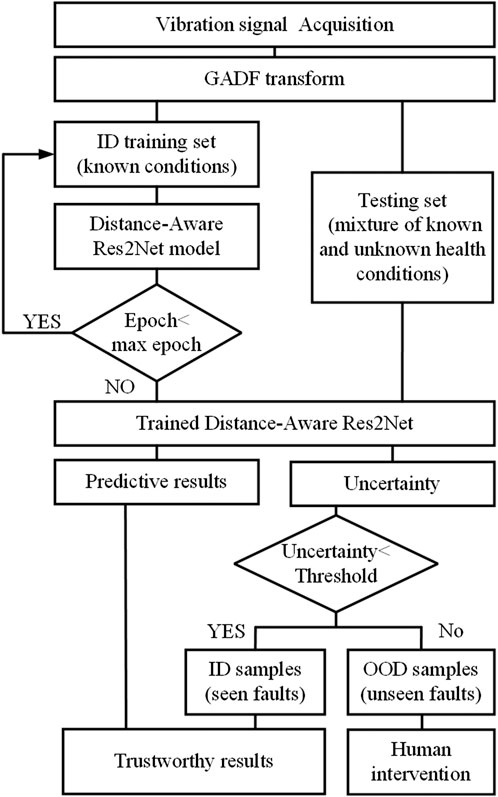
Figure 4 shows the diagnostic process for wind turbine gearbox based on the Distance-Aware Res2Net model. The process starts with data collection, which gathers vibration data from the wind turbine in different health conditions. These signals are transformed into two-dimensional images using the GADF, making the data more suitable for deep learning model inputs. The transformed data is divided into two sets: the ID training set, which contains data from known conditions, and the test set, which includes a mixture of known and unknown health conditions. The Distance-Aware Res2Net model is trained using the ID training set, and the training process continues until the maximum number of epochs is reached. Once training is completed, the trained Distance-Aware Res2Net model is used to predict the test set, generating predictive results and quantifying the uncertainty of each prediction. The uncertainty of the predictions is compared to a predefined threshold. If the uncertainty is below the threshold, the prediction is deemed trustworthy and classified as an ID sample (known fault), resulting in a trustworthy diagnostic result; if the uncertainty exceeds the threshold, further human intervention is required, classifying it as an OOD sample (unknown fault) and indicating the need for human judgment. With the UQ, the process enhances the reliability of the diagnostic results, thus improving the accuracy of the diagnosis and effectively identifying unknown faults to ensure the safe operation of the wind turbine.
3.2 Uncertainty threshold
Uncertainty plays a critical role in assessing the reliability of diagnostic results. Lower uncertainty indicates higher confidence in model predictions, and higher uncertainty signals potential unknowns. To effectively identify out-of-distribution (OOD) samples, it is essential to establish an appropriate uncertainty threshold—one that is greater than the uncertainties of most in-distribution (ID) samples but less than those of OOD samples. Given that OOD samples are unforeseen during training, the threshold must be derived from the ID test set. The interquartile range (IQR) method, a statistical tool commonly used for detecting outliers, serves as the basis for establishing this threshold. The IQR is calculated by first sorting the ID uncertainty values in ascending order and then determining the first quartile and the third quartile, which respectively separate the lowest 25% and the highest 75% of the data. The IQR is defined as shown in Equation 12:
The uncertainty threshold, referred to as the upper limit for outliers, is determined using Equation 13 (Tukey, 1977):
where
4 Experiments
Before conducting the experiments, it is necessary to introduce two key concepts of uncertainty: aleatory uncertainty and epistemic uncertainty. According to Kiureghian and Ditlevsen (2009), uncertainty can be classified into aleatory and epistemic types. In the field of machine learning, the inherent randomness (or noise) within raw data typically leads to aleatory uncertainty, which cannot be fully eliminated by increasing training data. In contrast, epistemic uncertainty arises from a lack of information that the model has under specific conditions and can theoretically be reduced by incorporating additional data (Huellermeier and Waegeman, 2021; Nemani et al., 2023). For example, unknown types of test data result in high epistemic uncertainty, as the model lacks relevant training data for these new fault types.
In wind turbine fault diagnosis, these two types of uncertainty have a direct impact on the model’s ability to identify different health conditions and its reliability in real-world applications. Aleatory uncertainty, such as noise in vibration signals, reduces the clarity of signal features, increasing uncertainty during signal recognition and classification. On the other hand, wind turbines may exhibit various unknown fault types with characteristics significantly different from known faults, presenting a challenge to the model’s generalization capability. Through uncertainty quantification, the model can provide maintenance personnel with risk assessments that support more reliable judgments in fault diagnosis. Additionally, implementing out-of-distribution (OOD) detection enhances the model’s robustness, enabling it to identify anomalies that were not present in the training set, which increases its reliability in practical applications.
To address the challenges posed by these two types of uncertainty in fault diagnosis, this study designs three experimental groups to evaluate the performance of the Distance-Aware Res2Net model in handling aleatory and epistemic uncertainty. By introducing these different types of uncertainty scenarios, we aim to comprehensively assess the model’s performance in real-world applications and verify its diagnostic reliability under various uncertainty conditions.
4.1 Experimental Setup
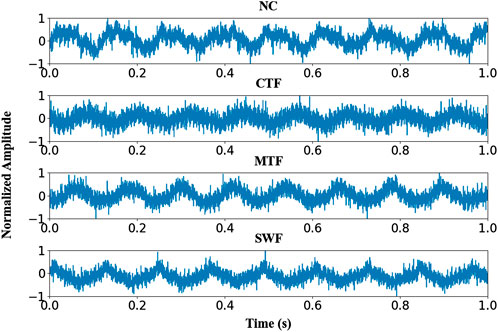
Figure 5 shows the wind turbine fault diagnosis test bench and the planetary gearbox used in this study. The test bench consists of a motor that simulates the rotation of wind turbine blades, a parallel gearbox, a planetary gearbox, and a doubly-fed induction generator. The gear exhibits four states: normal condition (NC), chipped tooth fault (CTF), missing tooth fault (MTF), and surface wear fault (SWF). A defective planetary gear was replaced with a normal planetary gear in the gearbox to collect data. We installed a displacement sensor on the drive shaft to capture the vibration signals. The motor was kept running at 1,500 rpm and the sensor sampling rate was 48 kHz. Under four different healthy conditions, four types of signals were collected, with the normalized signals displayed in Figure 6. In this section, we set up three groups of experiments to test the performance of Distance-Aware Res2Net. In all experiments, 80% of the ID samples were used for training and 20% of the ID samples were used for testing. In addition, there were additional OOD samples involved in the test set to test the OOD detection ability of the model. The ID dataset contains 4,096 data points per sample, with 240 samples for each condition, totaling 960 samples. In addition, we also collected three OOD fault data, including bearing fault, stator winding fault, and stator winding and bearing compound fault. Each sample of the OOD dataset still contains 4,096 data points, with each condition having 48 samples, and a total of 144 samples. The OOD dataset is only used for testing and not for model training.
4.2 Limitations of traditional models and the necessity of OOD detection
In Experiment 1, we set up two scenarios: Scenario 1 contains only ID data (NC, CTF, SWF, MTF), that is, all test data and training data belong to the same distribution; Scenario 2 introduces unknown health conditions (stator winding fault) as OOD data. Table 1 shows the basic information of the two diagnostic scenarios: health conditions and sample size.
A confusion matrix is a tool used to evaluate the performance of a classification model by comparing its predictions with the true labels. It displays the relationship between true and predicted classes, with diagonal elements representing correctly classified samples and off-diagonal elements indicating misclassifications. Analyzing the confusion matrix provides an intuitive understanding of the model’s classification performance and possible sources of error. Figures 7, 8 show the confusion matrix for diagnosis of four models (GoogleNet, ResNet, Res2Net, and Distance-Aware Res2Net) when processing ID data and mixed ID and OOD data. In the simple diagnosis of ID data, each model shows high diagnostic performance, and classification errors occur only in a very small number of samples. However, the Distance-Aware Res2Net model still achieves the best performance in classification. This is due to the optimization of Distance-Aware Res2Net network structure and the Spectral Normalization of the neural network layer weights, which makes the model more stable during training.
In Scenario 2, after the introduction of OOD samples, traditional models without OOD detection capability incorrectly diagnose all unknown faults as known fault types. This misdiagnosis not only reduces the overall accuracy of the model, but it may also lead to misjudgment and potential dangers in actual operation. Specifically, traditional models such as GoogleNet, ResNet, and Res2Net cannot effectively distinguish these new types from known fault types (NC, CTF, SWF, MTF) when faced with unknown fault types (stator winding fault). Due to the lack of detection ability for OOD data, these models tend to misclassify new fault types as a certain type of faults already present in the training data. This phenomenon is referred to as overconfidence. Overconfidence in traditional deep learning models occurs when they incorrectly classify OOD samples as known categories, often assigning high confidence to these erroneous predictions. Confidence is derived from the model’s predicted probability of classification, typically calculated using functions like softmax, but it does not guarantee the accuracy of those predictions (Abdar et al., 2021).
In contrast, uncertainty measures the reliability of that confidence, indicating how trustworthy the model’s predictions may be. The Distance-Aware Res2Net model shows significant advantages in handling unknown faults by incorporating SN and GP layers. These experimental findings highlight the limitations of traditional deep learning models when dealing with OOD data. There is a pronounced need for robust OOD detection mechanisms in fault diagnosis systems, particularly in complex industrial applications. The Distance-Aware Res2Net model, which incorporates SN and GP, offers substantial improvements in uncertainty estimation for diagnostic results through its deep network’s distance-aware technique.
4.3 Simulating unknown faults: addressing epistemic uncertainty in diagnosis
The setting of Experiment 2 includes three groups of experiments, each testing the diagnostic performance of the Distance-Aware Res2Net model under known health conditions (NC, CTF, SWF, MTF) and unknown health conditions (bearing fault, stator winding fault, and compound fault of stator winding and bearing fault). Table 2 presents the basic information for Experiment 2. To better demonstrate the performance of the model in OOD detection, we used accuracy, false alarm rate (FAR), and missing alarm rate (MAR). These indicators comprehensively evaluate the model’s diagnostic ability regarding OOD data.
The false alarm rate, also known as false positive rate, is defined as the ratio of negatives incorrectly classified to the total negatives. In OOD detection, false alarm rate is defined as the proportion of ID samples incorrectly identified as OOD samples, as shown in Equation 14 (Tharwat, 2021):
where,
The MAR is the proportion of OOD samples that are incorrectly classified as ID samples, as shown in Equation 15 (Tharwat, 2021):
where,
From the experimental results in Table 3, it is evident that the Distance-Aware Res2Net model demonstrates strong diagnostic accuracy across all three scenarios, achieving an accuracy of 96.67% in each case. This indicates that the model is effective in accurately identifying known health conditions. Furthermore, the model fully detects the three types of OOD samples, misclassifying only 3.65% of the ID samples as OOD, which demonstrates its capability to avoid misclassifying normal conditions as faulty. Notably, the MAR is 0, indicating that no unknown fault conditions are misidentified as ID.
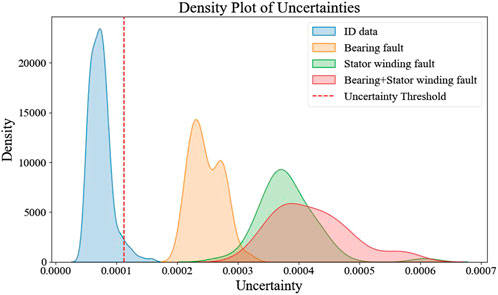
Figure 9 presents the density plots of uncertainty when dealing with mixed data, including ID and OOD samples. The uncertainty associated with ID data is significantly lower than that of other OOD conditions, which helps the model accurately identify normal conditions. For unknown health conditions, such as stator winding and bearing compound fault, higher uncertainty may prompt the model to adopt a more cautious diagnosis approach when dealing with complex or unknown faults.
Interestingly, the accuracy, false alarm rate (FAR), and missing alarm rate (MAR) results are identical for the three types of OOD samples. As shown in Figure 9, while the uncertainty distributions of these OOD faults differ, they share an important characteristic: their uncertainty values do not overlap with those of the in-distribution faults and are all above the set uncertainty threshold. This commonality leads to the same FAR values across the three OOD fault types. Furthermore, because the in-domain training and testing sets are the same for all three OOD faults, their MAR values also turn out to be identical.
In summary, the Distance-Aware Res2Net model exhibits high accuracy in diagnosing known health conditions, effectively reducing false alarm rate and avoiding missing alarm rate, thereby ensuring the reliability and safety of the system.
4.4 Simulating nosied samples: addressing aleatory uncertainty in diagnosis
This section aims to explore the OOD detection performance of the Distance-Aware Res2Net model under different noise levels. Noise is an inevitable factor in the actual wind turbine operating environment and has a significant impact on the performance of the diagnostic system. In the presence of abnormal noise interference, the model’s diagnostic results should convey the level of uncertainty, allowing human experts to intervene and make informed decisions. To simulate this effect, we introduced Gaussian white noise of different intensities into the ID data to generate OOD data that the model has not seen during the training phase. These noise levels are regarded as separate OOD scenarios and do not participate in model training. Each noise level contains 48 images. The experiment includes five different noise levels: 10 dB, 5 dB, 0 dB, -5 dB and −10 dB. Signal-to-noise ratio (SNR) is an important indicator to measure the signal strength relative to the background noise, usually expressed in decibels (dB). The SNR is calculated using the following formula Equation 16:
where
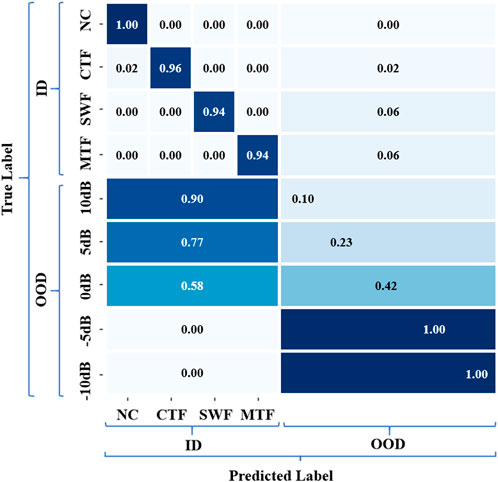
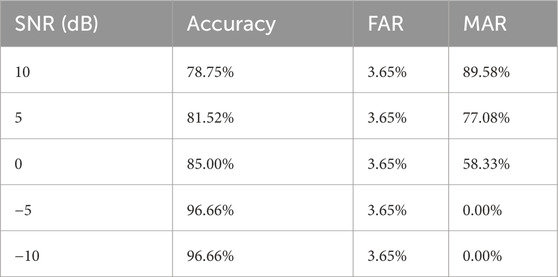
In this experiment, all noisy samples are considered OOD regardless of the noise level. The confusion matrix depicted in Figure 10 illustrates the performance of a fault classification model under different noise conditions. The matrix is divided into sections representing the true labels (ID and OOD) on the y-axis, and the predicted labels (NC, CTF, SWF, MTF, OOD) on the x-axis. For ID data, the classification accuracy of the model reaches 95.83%. For OOD data under noise, the number of OOD samples that the model can detect increases with the increase of noise, while the MAR decreases with the increase of noise. When the noise is −5 and −10 decibels, the experimental results show that the model can fully detect OOD samples. Table 4 lists the evaluation metrics. Since the threshold is only related to the ID data, the FAR remains at a low value of 3.65% when the ID data does not change. As the SNR decreases, the MAR drops significantly, reaching 0 at SNRs of −5 dB and −10 dB. This indicates that the model’s performance in distinguishing ID from OOD samples improves with increasing noise levels. The experimental results are consistent with our usual understanding. When the noise is weak, the distribution deviation of the noisy signal from the original signal is small; when the noise is very strong, the distribution deviation is large.
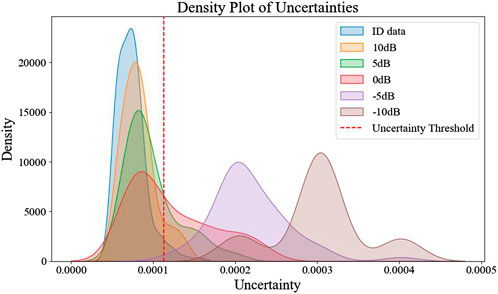
Figure 11 shows the uncertainty kernel density plot for ID data and OOD data at different noise levels. The figure indicates that ID data generally exhibits low uncertainty and is densely distributed below the threshold. As the noise intensity increases, the uncertainty of the OOD data also increases, and the uncertainty values are spread in a wider range. Particularly at higher noise levels (-5 dB and −10 dB), the uncertainty values of the OOD data shift significantly to the right, crossing the threshold more and correctly triggering the OOD classification. This indicates that the model perceives a decrease in its diagnostic reliability when faced with noisy conditions. This demonstrates the model’s ability to detect and handle uncertain diagnostic results under noisy conditions, ensuring reliable fault detection in real-world scenarios. When −10 dB noise is added, the uncertainty value distribution of the noisy samples is almost completely separated from the ID samples. This means that when the noise power is 10 times the signal power, the signal is overwhelmed by the noise, allowing the model to detect all out-of-distribution noise samples.
The Distance-Aware Res2Net model effectively handles noise interference and keeps synchronous changes in uncertainty values under varying noise conditions. This enables reliable fault diagnosis and effective OOD detection.
5 Conclusion
This study presents the Distance-Aware Res2Net model, designed to improve wind turbine gearbox fault diagnosis by integrating Spectral Normalization and Gaussian Processes for better out-of-distribution detection. Our findings show that the model accurately classifies known faults and effectively identifies out-of-distribution faults caused by epistemic and aleatory uncertainty through uncertainty quantification.
The model quantifies uncertainty to reduce overconfidence. It makes more conservative decisions for high-uncertainty samples, leading to fewer misclassifications and more reliable fault detection.
1. The model helps manage epistemic uncertainty and improves detection of unknown faults in wind turbine. Unknown faults may arise from faults in other parts of the wind turbine or compound faults. These faults may not be in the training data, leading to increased epistemic uncertainty. By quantifying uncertainty, the model assesses the trustworthiness of its predictions when data deviates from known conditions. This reduces the risk of overconfidence in unknown faults.
2. The model helps manage aleatory uncertainty in fault diagnosis. Noise can distort fault signals, making it harder for the model to recognize fault characteristics. If noise levels in the training data differ from real-world conditions, performance may suffer. However, uncertainty quantification allows the model to assess its limitations in noisy environments. The uncertainty value is positively correlated with the level of noise, which helps reduce misclassification risk and maintain effective fault detection.
In summary, the Distance-Aware Res2Net model represents a meaningful progress in fault diagnosis for wind turbine gearbox. The current model shows promising results, further research is necessary to refine its structure and optimize performance across a broader range of unknown faults. Future work will also focus on selecting appropriate uncertainty threshold to balance false alarm rate and miss alarm rate. This will help make the model more reliable and contribute to safer industrial operations.
Data availability statement
The raw data supporting the conclusions of this article will be made available by the authors, without undue reservation.
Author contributions
JZ: Data curation, Validation, Writing–original draft. YZ: Funding acquisition, Methodology, Writing–review and editing.
Funding
The author(s) declare that financial support was received for the research, authorship, and/or publication of this article. This work was supported in part by the Natural Science Foundation of China (52377111), Science and Technology Plan Projects of Tibet Autonomous Region (XZ202401ZY0037), The Chunhui Program by the Ministry of Education of China (HZKY20220084).
Conflict of interest
The authors declare that the research was conducted in the absence of any commercial or financial relationships that could be construed as a potential conflict of interest.
Publisher’s note
All claims expressed in this article are solely those of the authors and do not necessarily represent those of their affiliated organizations, or those of the publisher, the editors and the reviewers. Any product that may be evaluated in this article, or claim that may be made by its manufacturer, is not guaranteed or endorsed by the publisher.
References
Abdar, M., Pourpanah, F., Hussain, S., Rezazadegan, D., Liu, L., Ghavamzadeh, M., et al. (2021). A review of uncertainty quantification in deep learning: techniques, applications and challenges. Inf. FUSION 76, 243–297. doi:10.1016/j.inffus.2021.05.008
Behim, M., Merabet, L., and Salah, S. (2024). Neural network and l-kurtosis for diagnosing rolling element bearing faults. J. Electr. Eng. and Technol. 19, 2597–2606. doi:10.1007/s42835-023-01719-1
Behrmann, J., Grathwohl, W., Chen, R. T., Duvenaud, D., and Jacobsen, J.-H. (2019). “Invertible residual networks,” in International conference on machine learning (PMLR), 573–582.
Ben Ali, J., Fnaiech, N., Saidi, L., Chebel-Morello, B., and Fnaiech, F. (2015). Application of empirical mode decomposition and artificial neural network for automatic bearing fault diagnosis based on vibration signals. Appl. Acoust. 89, 16–27. doi:10.1016/j.apacoust.2014.08.016
Chen, L., Ma, Y., Hu, H., and Khan, U. S. (2023). An effective fault diagnosis approach for bearing using stacked de-noising auto-encoder with structure adaptive adjustment. Measurement 214, 112774. doi:10.1016/j.measurement.2023.112774
Chen, Z., Gryllias, K., and Li, W. (2019). Mechanical fault diagnosis using convolutional neural networks and extreme learning machine. Mech. Syst. Signal Process. 133, 106272. doi:10.1016/j.ymssp.2019.106272
Gao, S.-H., Cheng, M.-M., Zhao, K., Zhang, X.-Y., Yang, M.-H., and Torr, P. (2021). Res2net: a new multi-scale backbone architecture. IEEE Trans. Pattern Analysis Mach. Intell. 43, 652–662. doi:10.1109/TPAMI.2019.2938758
Gu, Y., Chen, R., Huang, P., Chen, J., and Qiu, G. (2023). A lightweight bearing compound fault diagnosis method with gram angle field and ghost-resnet model. IEEE Trans. Reliab., 1–14doi. doi:10.1109/TR.2023.3332223
Han, T., and Li, Y.-F. (2022). Out-of-distribution detection-assisted trustworthy machinery fault diagnosis approach with uncertainty-aware deep ensembles. Reliab. Eng. and Syst. Saf. 226, 108648. doi:10.1016/j.ress.2022.108648
He, K., Zhang, X., Ren, S., and Sun, J. (2016). “Deep residual learning for image recognition,” in 2016 ieee conference on computer vision and pattern recognition (CVPR) (IEEE comp soc; comp vis fdn), IEEE conference on computer vision and pattern recognition, 770–778. doi:10.1109/CVPR.2016.90
Huellermeier, E., and Waegeman, W. (2021). Aleatoric and epistemic uncertainty in machine learning: an introduction to concepts and methods. Mach. Learn. 110, 457–506. doi:10.1007/s10994-021-05946-3
Jiang, Q., Chang, F., and Liu, C. (2021). A spectrogram based local fluctuation feature for fault diagnosis with application to rotating machines. J. Electr. Eng. Technol. 16, 2167–2181. doi:10.1007/s42835-021-00704-w
Kiureghian, A. D., and Ditlevsen, O. (2009). Aleatory or epistemic? does it matter? Struct. Saf. 31, 105–112. doi:10.1016/j.strusafe.2008.06.020
Li, H., Yu, J., Xiang, D., Han, J., and Wu, Q. (2024). A hybrid physics-based and data-driven approach for monitoring of inverter-fed machine stator insulation degradations using switching oscillations. IEEE Trans. Industrial Inf. 20, 9527–9538. doi:10.1109/TII.2024.3383524
Liu, J. Z., Padhy, S., Ren, J., Lin, Z., Wen, Y., Jerfel, G., et al. (2022). A simple approach to improve single-model deep uncertainty via distance-awareness. J. Mach. Learn. Res. 23.
Liu, M., Chowdhary, G., Da Silva, B. C., Liu, S.-Y., and How, J. P. (2018). Gaussian processes for learning and control: a tutorial with examples. IEEE Control Syst. Mag. 38, 53–86. doi:10.1109/MCS.2018.2851010
Liu, Y., Cheng, Y., Zhang, Z., and Wu, J. (2021). Multi-information fusion fault diagnosis based on knn and improved evidence theory. J. Vib. Eng. and Technol. 10, 841–852. doi:10.1007/s42417-021-00413-8
Liu, Z.-Y., Li, S.-Y., Chen, S., Hu, Y., and Huang, S.-J. (2020). Uncertainty aware graph Gaussian process for semi-supervised learning. Proc. AAAI Conf. Artif. Intell. 34, 4957–4964. doi:10.1609/aaai.v34i04.5934
Lu, L., He, Y., Ruan, Y., and Yuan, W. (2021). Wind turbine planetary gearbox condition monitoring method based on wireless sensor and deep learning approach. IEEE Trans. Instrum. Meas. 70, 1–16. doi:10.1109/TIM.2020.3028402
Miyato, T., Kataoka, T., Koyama, M., and Yoshida, Y. (2018). Spectral normalization for generative adversarial networks. arXiv Prepr. arXiv:1802.05957.
Nemani, V., Biggio, L., Huan, X., Hu, Z., Fink, O., Tran, A., et al. (2023). Uncertainty quantification in machine learning for engineering design and health prognostics: a tutorial. Mech. Syst. Signal Process. 205, 110796. doi:10.1016/j.ymssp.2023.110796
Rahimi, A., and Recht, B. (2007). Random features for large-scale kernel machines. Adv. neural Inf. Process. Syst. 20.
Sun, Y., and Wang, W. (2024). Role of image feature enhancement in intelligent fault diagnosis for mechanical equipment: a review. Eng. Fail. Anal. 156, 107815. doi:10.1016/j.engfailanal.2023.107815
Tang, H., Liao, Z., Chen, P., Zuo, D., and Yi, S. (2021). A novel convolutional neural network for low-speed structural fault diagnosis under different operating condition and its understanding via visualization. IEEE Trans. Instrum. Meas. 70, 1–11. doi:10.1109/TIM.2020.3016752
Tang, H.-H., Zhang, K., Wang, B., Zu, X.-j., Li, Y.-Y., Feng, W.-W., et al. (2024). Early bearing fault diagnosis for imbalanced data in offshore wind turbine using improved deep learning based on scaled minimum unscented kalman filter. Ocean. Eng. 300, 117392. doi:10.1016/j.oceaneng.2024.117392
Tharwat, A. (2021). Classification assessment methods. Appl. Comput. Inf. 17, 168–192. doi:10.1016/j.aci.2018.08.003
Wan, L., Li, Y., Chen, K., Gong, K., and Li, C. (2022). A novel deep convolution multi-adversarial domain adaptation model for rolling bearing fault diagnosis. Measurement 191, 110752. doi:10.1016/j.measurement.2022.110752
Wang, B., Li, H., Hu, X., and Wang, W. (2024). Rolling bearing fault diagnosis based on multi-domain features and whale optimized support vector machine. J. Vib. Control 30, 1234–1245. doi:10.1177/10775463241231344
Wang, Z., and Oates, T. (2015). Imaging time-series to improve classification and imputation. AAAI Press.
Williams, C. K., and Rasmussen, C. E. (2006) Gaussian processes for machine learning, 2. Cambridge, MA: MIT press.
Yan, J., Kan, J., and Luo, H. (2022). Rolling bearing fault diagnosis based on markov transition field and residual network. SENSORS 22, 3936. doi:10.3390/s22103936
Yi, C., Wang, H., Zhou, Q., Hu, Q., Zhou, P., and Lin, J. (2023). An adaptive harmonic product spectrum for rotating machinery fault diagnosis. IEEE Trans. Instrum. Meas. 72, 1–12. doi:10.1109/TIM.2022.3230462
Zhang, W., Li, X., and Ding, Q. (2019). Deep residual learning-based fault diagnosis method for rotating machinery. ISA Trans. 95, 295–305. doi:10.1016/j.isatra.2018.12.025
Zhang, Y., Zhang, S., Zhu, Y., and Ke, W. (2024). Cross-domain bearing fault diagnosis using dual-path convolutional neural networks and multi-parallel graph convolutional networks. ISA Trans. 152, 129–142. doi:10.1016/j.isatra.2024.06.009
Zhao, X., Yao, J., Deng, W., Ding, P., Ding, Y., Jia, M., et al. (2023). Intelligent fault diagnosis of gearbox under variable working conditions with adaptive intraclass and interclass convolutional neural network. IEEE Trans. Neural Netw. Learn. Syst. 34, 6339–6353. doi:10.1109/TNNLS.2021.3135877
Zhao, Y., Song, Z., Li, D., Qian, R., and Lin, S. (2024). Wind turbine gearbox fault diagnosis based on multi-sensor signals fusion. Prot. Control Mod. Power Syst. 9, 96–109. doi:10.23919/PCMP.2023.000241
Zhenya, Q., and Xueliang, Z. (2022). Rolling bearing fault diagnosis based on cs-optimized multiscale dispersion entropy and ml-knn. J. Braz. Soc. Mech. Sci. Eng. 44, 430. doi:10.1007/s40430-022-03643-3
Zhou, T., Han, T., and Droguett, E. L. (2022). Towards trustworthy machine fault diagnosis: a probabilistic bayesian deep learning framework. Reliab. Eng. and Syst. Saf. 224, 108525. doi:10.1016/j.ress.2022.108525
Keywords: fault diagnosis, wind turbine gearbox, out-of-distribution detection, uncertainty quantification, spectral normalization, Gaussian process, Res2Net
Citation: Zhou J and Zhao Y (2024) A distance-aware approach for reliable out-of-distribution detection of wind turbine gearbox fault diagnosis. Front. Energy Res. 12:1496130. doi: 10.3389/fenrg.2024.1496130
Received: 13 September 2024; Accepted: 18 November 2024;
Published: 28 November 2024.
Edited by:
Lei Kou, Qilu University of Technology (Shandong Academy of Sciences), ChinaReviewed by:
Xiang Wang, Nanjing Institute of Technology Nanjing, China, ChinaLiang Xuan, Jianghan University, China
Copyright © 2024 Zhou and Zhao. This is an open-access article distributed under the terms of the Creative Commons Attribution License (CC BY). The use, distribution or reproduction in other forums is permitted, provided the original author(s) and the copyright owner(s) are credited and that the original publication in this journal is cited, in accordance with accepted academic practice. No use, distribution or reproduction is permitted which does not comply with these terms.
*Correspondence: Yao Zhao , emhhb3lhb0BzaGllcC5lZHUuY24=
 Jingxin Zhou
 Yao Zhao*
