 Jiaxing Ye
- Jiangsu Frontier Electric Power Technology Co., Ltd., Nanjing, China
An intelligent power transducer plays an important role in the acquisition, monitoring, and control of data in power systems. A power transducer faces challenges of reduced measurement accuracy and calibration difficulties because of the surrounding field environment and the uncertainty of wind and photovoltaic power output. In this study, a digital scenario generation and harmonic signal tracing approach is proposed for the calibration of an intelligent power transducer. The intelligent power transducer calibration model integrates digital scenario construction. Then, based on the statistical relationship between historical meteorological data and generated power, raw data on wind and photovoltaic systems are clustered to construct digital calibration scenarios. Kernel density estimation and Copula functions are employed, and the generated scenario is reduced based on Kantorovich distance synchronous back-substitution. Finally, after considering harmonic factors in the reduced calibration scenario, a tracing method for calibration signal with harmonics is proposed for transducer calibration in complex test conditions. The study results demonstrate that the proposed method can efficiently provide a reference signal for the measurement and calibration of intelligent power transducers in a novel energy scenario and complex harmonic environments.
1 Introduction
The electric power industry occupies an important position in the national economy. To ensure stable operations of generators, power transducers are widely used to monitor the electrical energy data and convert them into digital signals for the analysis or control system; this helps users understand the operating conditions and adjust or optimize the performance of the power system as required (Bucci et al., 2015). According to the international standard IEC 60688 (2021), the stability of a power transducer is considered after three times the supplier-provided time constant, but this requirement does not always satisfy the need for rapid response to system failures in certain cases (IEC-60688, 2021). Compared with the traditional power transducer, an intelligent power transducer not only enhances the response speed in the face of faults but also plays a key role in data acquisition, remote monitoring, fault diagnosis, and remote communication, thereby integrating with other intelligent systems to realize advanced energy management and control. However, factors like wind power variability, device aging, inrush currents, and other uncertainties can pose challenges such as reduced measurement accuracy, output distortion, and protection malfunctions in response to sudden power changes to intelligent power transducers (Davoudkhani et al., 2023; Malinowski et al., 2015). Therefore, enhancing the safety management of grid-related equipment and operations becomes important, and regular testing and calibration should be done in intelligent power transducers.
To address the abovementioned challenges, some researchers performed power transducer testing and calibration. Poynting Vector Probe was used to develop a power transducer (Fam, 1996) and determine the active and reactive power of high-voltage lines instead of the traditional transformer with an iron core. For data acquisition (Ward et al., 2021), a particle filter methodology was presented for continuous calibration of the physics-based model element of a digital twin. This model is applied to a synthetic problem with known calibration parameter values before use in conjunction with monitored data (Yang et al., 2023). Furthermore, in another study a wind speed power transfer fluctuation partitioning (PTFP) algorithm was constructed, which fully considers the wind speed variation and power transfer characteristics, and boosts prediction accuracy on all time scales (Zhang et al., 2022). It aims to address the problems of heavy workload and low efficiency in the manual on-site verification of gateway electric energy metering devices, and analyze a method for developing a multi-channel analog collector for remote verification of gateway electric energy metering devices. This approach effectively ensured the safety of operators and improved the level of gateway operation management, though it failed to realize the automatic generation of verification scenarios (Huang et al., 2022). Zhang et al. proposed a method that can realize efficient typical scene generation considering the stochastic fluctuation in renewable energy output and load demand (Zhang et al., 2021). In addition, probability prediction, kernel density estimation, and deep learning models were constructed with an attention mechanism to measure uncertainty and proposed stochastic simulation based on probabilistic forecasting to generate simulation scenarios (Hu et al., 2017). In another research, a kernel density estimation (KDE) method estimated the parameters of models with historical data (Wen, 2015). It used a real-time digital simulator (RTDS) to perform digital modeling tests of the power transducer, simulate the operation of the system, and evaluate the impact of grid-side faults on the power transducer. However, this method has some limitations as it considers fewer scenarios and does not involve the impact of the current large-scale integration of new energy sources into the grid. There is a need to further improve the accuracy and applicability of power transducer measurement and calibration in the complex background of new energy with nonlinear output and harmonic disturbance (Zhang et al., 2024; Aggarwal and Singh, 2020). In another study (Nosratabadi et al., 2019), uncertainties of electricity consumption and wind/solar generation were considered. Probability density functions (PDFs) of output random variables were determined by choosing the optimal bandwidth of the adaptive kernel density estimator (Sanjari and Gooi, 2017). In addition, a 15-minute ahead PDF of the PV output power was forecasted through the Gaussian mixture method by combining several distribution functions and employing the coefficients defined based on the parameters of the HMC-based model (Yu et al., 2020). In another study, the current tracing principle was used to establish a harmonic responsibility apportion model that represents the influence degree of harmonic sources, to precisely acquire data in harmonic environments (Zhang et al., 1999). A method for correcting the fast Fourier algorithm using a windowed interpolation algorithm or its improved algorithm was proposed, which could mitigate leakage and effectively suppress interference between harmonics and noise interference, thereby facilitating more precise measurement of the amplitude and phase of each harmonic voltage and current (Xi and Chicharo, 1996). In another study, a method was proposed for correcting the ideal sampling frequency, which can correct each sampling point to obtain the sampling value at the ideal sampling frequency. This method has low computational complexity, and its real-time performance is better than that of the previous method and is suitable for online measurement, but it can only reduce leakage by 50%.
However, still numerous issues plague the power transducer calibration in the complex scenario of large-scale new energy grid connection.
Thus, this paper proposes a digital scenario generation and harmonic signal tracing method for the calibration of an intelligent power transducer. First, an intelligent power transducer calibration model based on digital scenario construction and integration is proposed. Then, the wind and photovoltaic raw data are clustered by the statistical relationship between historical meteorological data and power generation, and the wind and photovoltaic digital scenarios based on kernel density estimation and Copula function are constructed, and also the generated scenario is reduced based on Kantorovich distance synchronous back-substitution. Finally, a harmonic signal tracing method is proposed to realize the tracing of the complex transducer calibration signal, considering the harmonic factors of the actual calibration scenario. The scenario generation and harmonic signal tracing method could provide reference data effectively for intelligent power transducer testing and calibration to ensure the safe and stable operation of the power system.
2 Intelligent power transducer calibration model based on digital scenario construction and integration
Figure 1 depicts a modeling framework of the intelligent power transducer calibration model based on the construction and integration of digital scenarios. This model primarily contains the transducer calibration platform, programmable standard power source, and the measured intelligent power transducer. The calibration platform and the standard power source are connected to the measured intelligent power transducer.
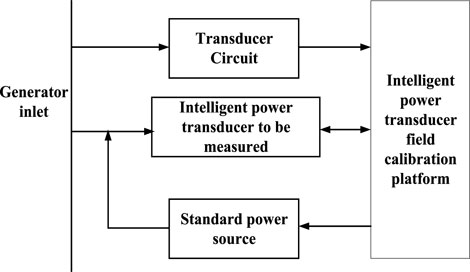
Figure 1. Modeling framework for calibration of an intelligent power transducer.
The intelligent power transducer calibration platform includes a scenario set, scenario generation system, data analysis system, visualization system, and other parts. The scenario set simulates different working conditions such as inrush current, electromagnetic interference, and lightning strikes; considering the large-scale integration of renewable power, the data of the local wind, photoelectricity historical power and meteorological data, a targeted set of complex scenarios is generated based on wind and photovoltaic digital scenario generation technology by using kernel density estimation and Copula function (Majdara and Nooshabadi, 2020). During verification, power staff can generate random scenarios or specify harmonic voltage, current, and other specific values with one click. Thereafter, the intelligent power transducer performs data collection and analysis on both the standard power source and the power transducer, calculating the error of the tested instrument. Finally, this platform makes a reliability assessment of the tested instrument, and when the error value exceeds the standard range, a safety warning is given to notify the relevant staff for maintenance and calibration, thereby providing a visual representation of the results.
3 Digital scenario generation for wind and photovoltaic power considering meteorological factors
3.1 Relevance analysis of meteorological factor
Renewable energy output has randomness, but its power waveform has similar characteristics under similar weather. Taking photovoltaic power generation as an example, the power output is high and regular on sunny days, with small prediction errors, while the power output is low and highly variable on overcast and rainy days, with large prediction errors. Therefore, constructing a set of typical output scenarios of renewable energy is necessary under different weather conditions.
The current study used the Pearson correlation coefficient (Shi et al., 2024) to analyze the correlation between wind and photovoltaic power generation and meteorological factors as Equation 1:
where rxy denotes the Pearson correlation coefficient between meteorological factors and power generation, Xi is the meteorological factors, Yi is the power generation,
Based on the statistical relationship between the historical meteorological factors and power generation, the Wilks criterion statistic is introduced to cluster the samples as shown in Equation 2:
where E and H are the within-group and between-group sums of squares and cross-product matrices, respectively, as shown in Equations 3, 4:
Meteorological factors Xi and generation power Yi are each taken in samples, and each of the two sets of samples can be expressed, respectively, as shown in Equations 5, 6:
where p is the dimension of Xi and Yi. According to the F-approximation theory, the statistics A of the Wilks criterion can be transformed into statistics F as Equation 7.
where F is the statistical relationship between the meteorological factor and power generation. The meteorological factor clustering criterion is converted into an F-test to assess the differences in clustered samples and the segmentation and merging of all scenarios are accomplished.
3.2 Marginal distribution based on kernel density estimation
This study employed the Copula function to generate wind and photovoltaic power output scenarios, and the marginal distribution of wind and photovoltaic power needs to be fitted first. The nonparametric kernel density estimation method is applied to fit a large number of samples, obtain the kernel density estimation expression for wind and photoelectric power, and determine the marginal distribution of wind and photoelectric power.
The kernel density estimation formula is provided in Equation 8:
where N is the sample length, h is the sliding window length, and h > 0; random variable A is the single wind and photovoltaic power output, the sample point is (a1, a2, … an), K (·) is Epanechnikov kernel function, mainly for the wind and photovoltaic power marginal distribution fitting.
The kernel density estimation method does not require prior assumptions about the distributions met by the sample data and is utilized to directly perform nonparametric estimation of the wind power and photovoltaic power to obtain the respective probability density functions. In addition to the kernel function that affects the results of kernel density estimation, the parameter of sliding window length h is also optimized.
where E is the weight matrix. The overall kernel estimate can be obtained by substituting h, which is derived from minimizing the integral mean square error between the estimated and actual values, into Equation 9.
3.3 Generation of wind and photovoltaic scenarios based on Copula function
The Frank–Copula method is generally selected for wind and photovoltaic scenario generation, and the main steps are as follows:
Step 1: Generate random numbers b1, b2, … bn in the interval [0, 1].
Step 2: Make the first random variable marginal distribution function value u1 = b1. Frank-Copula function C (·) is used to determine the second random variable marginal distribution function value u2, which is to find the solution of Equation 10.
Step 3: Determine the marginal distribution function value un of the nth random variable, that is, to find the solution of Equation 11.
Step 4: Repeat the above steps k times to obtain marginal distribution function values for k sets of n random variables.
Step 5: Using the inverse function operation ci = Fi−1 (ui), convert (u1j, u2j, … unj) to the joint distribution function scenario, where j = 1, 2, … , T, and T is the total number of days.
When analyzing the wind and photovoltaic power output, in step 5, the marginal distribution function of the two is derived based on the Copula joint probability density, and then the inverse function operation is performed separately. In this way, the generated scenario fully takes into account the correlation between wind and photovoltaic power generation.
3.4 Generated scenario reduction based on Kantorovich distance synchronous back-substitution
Based on the Kantorovich distance (Kini et al., 2022), the original wind and photovoltaic scenarios are reduced, which can better preserve the distribution characteristics of the original scenarios. The Kantorovich distance can be determined as below:
where Ci is the set of original scenarios; Ci′ denotes the set of deleted scenarios; sv and sv′ are scenarios in Ci and Ci′, respectively; Psv and Psv′ are the probability of sv and sv′ in the scenario sets Ci and Ci′, respectively; Psv and Psv′ are the probabilities of sv and sv′ in the set of scenarios; d (sv, sv′) is the Euclidean distance of sv and sv′; and d (sv, sv′) is the product of the probabilities of sv and sv′. The calculation process using the Kantorovich distance is as follows:
Step 1: Use the original scenario set Ci to represent the set of Ni retained scenarios, and Ci′ to represent the set of Ni deleted scenes. Determine the initial probability Psv of the retained scenarios in Ci as 1/Ni, and the initial probability Psv′ of the deleted scenarios in Ci′ as 1/Ni.
Step 2: Remove one scenario sv′ satisfying Equation 12 each time and put it into the set Ci′ of deleted scenarios as Equation 13.
Step 3: Change the number of original scenarios Ni = Ni − 1 and the number of deleted scenarios Ni′ = Ni′ + 1, and pick the scenario sv that is closest to scenario sv′ as Equation 14.
Step 4: Modify the probability of the closest scenario sv to the removed scenario sv′ as Psv = Psv + Psv′ to ensure that the sum of probabilities of all the scenarios in Ci is 1. Then, update the probability of each scenario in the set of deleted scenarios to 1/Ni.
Step 5: Go to step 2 and repeat the iteration until the number of scenarios in Ci meets the set number Nsv, taking Nsv = 1.
4 Harmonic signal tracing method
New power generation is affected by the environment because the latter generates a large number of harmonic currents, with reference to the statistical results of wind power historical data. This paper sets the corresponding harmonic data according to different scenarios, traces back the voltage and current fundamental components information, and provides calibration data for the intelligent power transducer. Thereafter, Set the kth harmonic voltage content as mk, the kth harmonic current content as nk, and the phase difference of the kth harmonic as θ.
After generating wind and photovoltaic digital scenarios considering meteorological factors, the active power P and reactive power Q of the scenarios at each moment can be obtained as Equations 15–17.
where
The RMS value of the grid-connected voltage between the photovoltaic power station and the wind farm is U, which can be obtained using Equation 18:
The RMS value of the voltage fundamental component is Ui as Equation 19:
In Equation 17, the first term represents the power component generated by the same harmonic as Equation 20:
where
The average over a cycle is shown in Equation 21:
In Equation 17, the second term is the power component generated by different harmonics, which has an average value of 0 in one cycle.
According to the average instantaneous power theory, the total active power of the load in a harmonic environment can be calculated as Equation 22:
Thus, the total reactive power of the load in a harmonic environment is as Equation 23:
By solving Equation 24, the phase difference θi between the voltage and current fundamental components can be obtained, as well as the RMS value II of the current fundamental component:
5 Simulation results and analysis
5.1 Results of correlation analysis of meteorological factors
The Pearson correlation coefficient proposed in the current study is used to analyze the correlation between wind and photovoltaic power and meteorological factors, combined with the historical power generation data and measured meteorological data of photovoltaic power stations and wind farms in a certain area. The Pearson correlation coefficient value range is [−1, 1], when the correlation coefficient is greater than 0, the two variables are positive correlation; when it is less than 0, the two variables are in a negative correlation. Furthermore, the larger the absolute value of the Pearson correlation coefficient, the stronger the correlation between the two variables.
Solar irradiance and photovoltaic power generation are highly correlated, temperature and humidity have a strong correlation with photovoltaic power, while wind speed, rate of change of wind direction, and air pressure show a weak correlation with photovoltaic power. Photovoltaic power increases with increasing solar irradiance and temperature, which is positively correlated; increasing humidity leads to decreasing power, which is negatively correlated. Wind speed is highly correlated with wind power. Air pressure and rate of change of wind direction are also correlated with wind power, and solar irradiance and humidity are weakly correlated. Wind power increases with increasing wind speed; increasing air pressure decreases wind speed, which leads to a decrease in power, which shows a negative correlation. When the wind direction is stable, the efficiency of a wind turbine is higher, and frequent adjustment of the angle will affect the efficiency and amount of power generation.
5.2 Generation and reduction of calibration scenarios in wind and photovoltaic power generation
Combining meteorological and environmental factors, the kernel density estimation and Copula function are used to generate wind and photovoltaic digital scenarios, the number of scenarios is set to be 300, using a synchronous back-substitution scenario reduction algorithm based on Kantorovich distance, and the typical wind and solar power scenarios are clustered according to weather conditions and reduced to 4 scenarios. The wind power scenario generation and the Photovoltaic power scenario generation are shown in Figure 2.
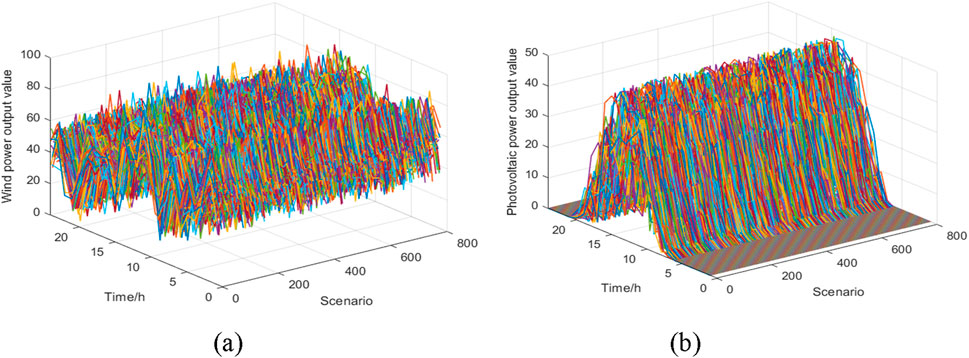
Figure 2. Wind and photovoltaic power generation scenarios. (A) Wind power generation scenarios. (B) Photovoltaic power generation scenarios.
Rainy, overcast, sunny, and cloudy days are selected as four typical weather scenarios, as shown in Figure 3.
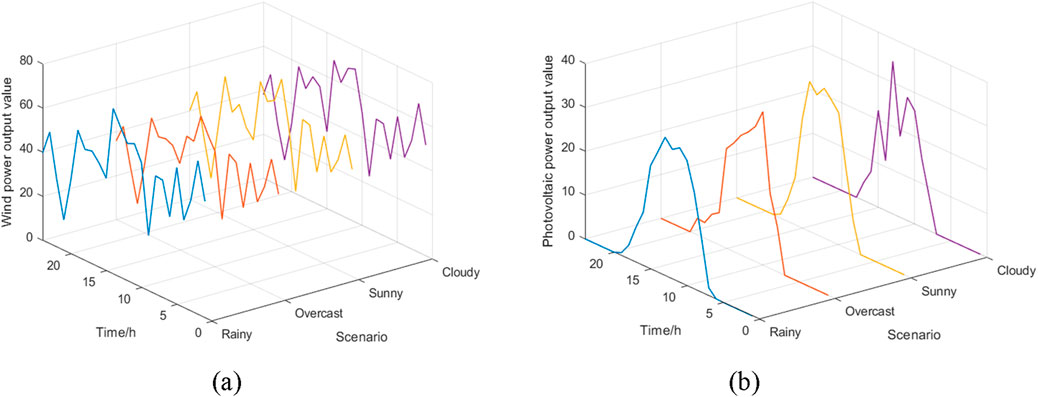
Figure 3. Typical wind and photovoltaic power scenarios by scenario reduction. (A) Wind power scenarios. (B) Photovoltaic power scenarios.
For photovoltaic power generation, the power curve is larger on sunny days compared to rainy and overcast days, and the curve is more undulating on cloudy days. For wind power generation, rainy days have relatively lower air pressure and higher wind speed, and the wind power output is higher than that of other weather. Under the sunlight, the surface is prone to temperature difference, which leads to the generation and movement of airflow. During the afternoon, the air temperature near the ground is the highest, and the exchange between the upper and lower air is the most intense, so the wind speed is the largest in the late afternoon, and the wind power output is the largest, which is consistent with the meteorological factors.
5.3 Harmonic signal tracing
Take the wind power scenario on a sunny day in spring as an example, take the power data from 8:00 to 12:00, and consider the influence of the third and fifth harmonics, set the harmonic parameter as shown in Table 1, and take the rated voltage of the wind farm as 220 kV, and the tracing results of the harmonic signal are shown in Table 2:
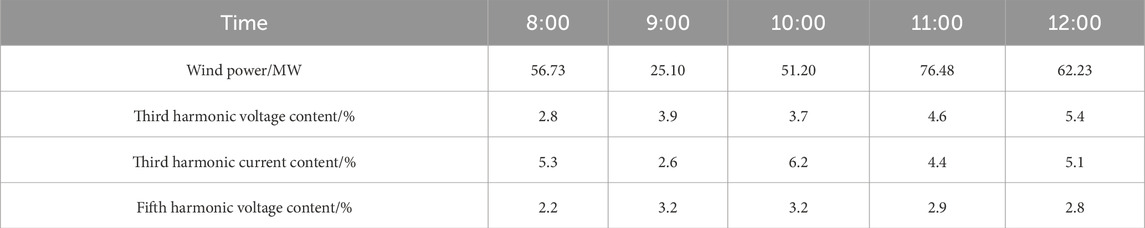
Table 1. Harmonic parameter settings in the calibration scenario.
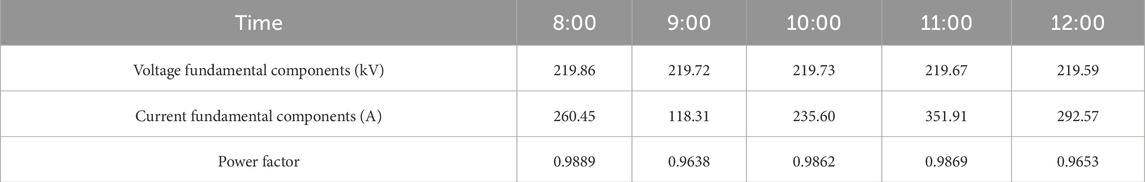
Table 2. Tracing results of calibration signals.
Taking the scenario of wind power at 8:00 as an example, the tracing results of the voltage fundamental and harmonic components calibration signal are shown in Figure 4:
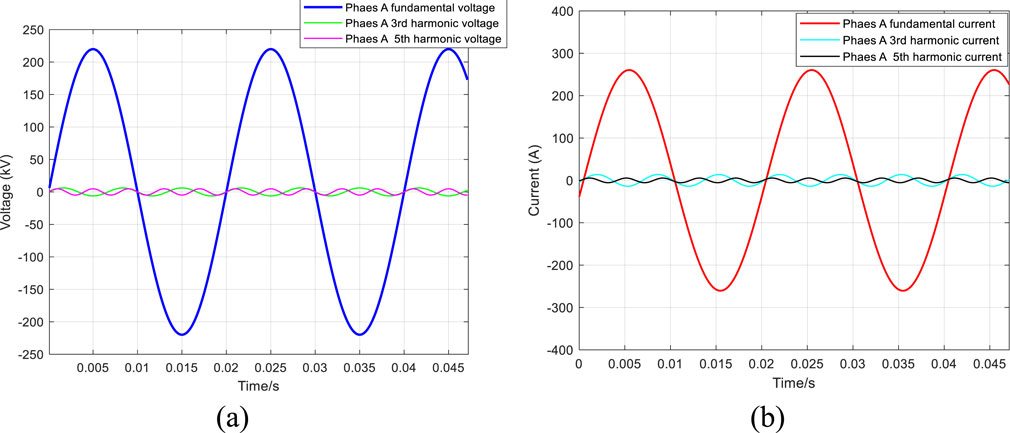
Figure 4. Tracing results of verification signals in harmonic environments. (A) Tracing results of voltage verification. (B) Tracing results of current verification.
After inspection, the power value of the verification signal obtained by tracing is significantly consistent with the original power value of the wind and light scenes, verifying the accuracy of the tracing result. In this process, by extracting and converting the fundamental voltage and current, the correlation coefficient method is used to accurately transform them, thereby generating secondary signals that can be used for detection and verification of the intelligent power transmitter. These secondary signals can meet the requirements of high-precision measurement while ensuring the dynamic response characteristics in wind and light scenes.
In order to further improve the reliability of the verification system, the characteristics of power fluctuations in wind and light scenes are combined to construct a highly targeted tracing model. The model not only accurately describes the power characteristics but also adjusts the key parameters (such as fundamental amplitude, and phase deviation) in the tracing process in real-time by introducing optimization algorithms to reduce the verification error. Finally, the verification system showed excellent stability and accuracy in both laboratory and field tests and can offer reliable technical support for the application of intelligent power transmitters.
6 Conclusion
This study aimed to address the problems of reduced measurement accuracy and difficult calibration of intelligent power transducers affected by the uncertainty of wind and photovoltaic power output, complex field environment, and other factors. Overall, it proposes a calibration technology based on scenario generation and harmonic tracing for intelligent power transducer. The main conclusions are drawn as follows:
A scenario set is established based on the digital scenario generation and integration of intelligent power transducer calibration, and the calibration signals with the measured transducer are carried out to realize intelligent error calibration and warning.
Typical wind and photovoltaic scenarios are obtained using scenario generation by kernel density estimation and Copula function and scenario reduction by Kantorovich distance synchronous back-substitution. The generated typical scenarios reflect the actual output of new energy more effectively, thereby providing a more realistic environment for transducer calibration.
Through harmonic signal tracing, the calibration signal parameters can be extracted in harmonic environments under wind and photovoltaic power, which ensures reliable calibration of intelligent power transducer in the complex scenario of large-scale new energy grid connection.
Since the current study only considers the effect of new energy output with harmonic on power transducer calibration, more consideration is needed for different transient conditions such as excitation inrush current, electromagnetic interference, and lightning strike to improve the scenario set.
Data availability statement
The raw data supporting the conclusions of this article will be made available by the authors, without undue reservation.
Author contributions
JY: conceptualization, data curation, formal analysis, funding acquisition, investigation, methodology, project administration, resources, software, supervision, validation, visualization, writing–original draft, and writing–review and editing.
Funding
The author(s) declare that financial support was received for the research, authorship, and/or publication of this article. This research was funded by Science and Technology Project of Jiangsu Frontier Electric Power Technology Co., Ltd. (OFW-23737-JS). The funder was not involved in the study design, collection, analysis, interpretation of data, the writing of this article, or the decision to submit it for publication.
Conflict of interest
Author JY was employed by Jiangsu Frontier Electric Power Technology Co., Ltd.
Generative AI statement
The author(s) declare that no Generative AI was used in the creation of this manuscript.
Publisher’s note
All claims expressed in this article are solely those of the authors and do not necessarily represent those of their affiliated organizations, or those of the publisher, the editors and the reviewers. Any product that may be evaluated in this article, or claim that may be made by its manufacturer, is not guaranteed or endorsed by the publisher.
Supplementary material
The Supplementary Material for this article can be found online at: https://www.frontiersin.org/articles/10.3389/fenrg.2025.1526796/full#supplementary-material
References
Aggarwal, S., and Singh, A. K. (2020). “Power quality concerns with integration of RESs into the smart power grid and associated mitigation techniques,” in 2020 IEEE 9th power India international conference (PIICON), Sonepat, India, 28 February–1 March 2020. doi:10.1109/PIICON49524.2020.9113008
Bucci, G., Ciancetta, F., Dolce, S., Fiorucci, E., and D'Innocenzo, F. (2015). “A low-cost power transducer for transient currents,” in IEEE international instrumentation and measurement technology conference (I2MTC), Pisa, Italy, 11–14 May 2015. doi:10.1109/I2MTC.2015.7151455
Davoudkhani, I. F., Zishan, F., Mansouri, S., Abdollahpour, F., Grisales-Noreña, L. F., and Montoya, O. D. (2023). Allocation of renewable energy resources in distribution systems while considering the uncertainty of wind and solar resources via the multi-objective salp swarm algorithm. Energies 16, 474. doi:10.3390/en16010474
Fam, W. Z. (1996). A novel transducer to replace current and voltage transformers in high-voltage measurements. IEEE Trans. Instrum. Meas. 45, 190–194. doi:10.1109/19.481333
Hu, B., Li, Y., Yang, H., and Wang, H. (2017). Wind speed model based on kernel density estimation and its application in reliability assessment of generating systems. J. Mod. Power Syst. Clean. Energy. 5, 220–227. doi:10.1007/s40565-015-0172-5
Huang, H., Xu, D., Cheng, Q., Yang, C., Lin, X., and Tang, J. (2022). “Latin hypercube sampling and spectral clustering based typical scenes generation and analysis for effective reserve dispatch,” in 2022 4th international conference on power and energy technology (ICPET), Beijing, China, May 12–14 2022. doi:10.1109/ICPET55165.2022.9918267
IEC-60688 (2021). Electrical measuring transducers for converting A.C. Electrical quantities to analogue or digital signals. Geneva, Switzerland.
Kini, K. R., Bapat, M., and Madakyaru, M. (2022). Kantorovich distance based fault detection scheme for non-linear processes. IEEE Access, 10:1051–1067. doi:10.1109/ACCESS.2021.3138696
Majdara, A., and Nooshabadi, S. (2020). Nonparametric density estimation using Copula transform, Bayesian sequential partitioning, and diffusion-based kernel estimator. IEEE Trans. Knowl. Data Eng. 32, 821–826. doi:10.1109/TKDE.2019.2930052
Malinowski, M., Milczarek, A., Kot, R., Goryca, Z., and Szuster, J. T. (2015). Optimized energy-conversion systems for small wind turbines: renewable energy sources in modern distributed power generation systems. IEEE Power Electron. Mag., 2:16–30. doi:10.1109/MPEL.2015.2447631
Nosratabadi, H., Mohammadi, M., and Kargarian, A. (2019). Nonparametric probabilistic unbalanced power flow with adaptive kernel density estimator. IEEE Trans. Smart Grid. 10, 3292–3300. doi:10.1109/TSG.2018.2823058
Sanjari, M. J., and Gooi, H. B. (2017). Probabilistic forecast of PV power generation based on higher order Markov chain. IEEE Trans. Power Syst. 32, 2942–2952. doi:10.1109/TPWRS.2016.2616902
Shi, Z., Xiao, J., Jiang, J., Zhang, Y., and Zhou, Y. (2024). Identifying reliability high-correlated gates of logic circuits with pearson correlation coefficient. IEEE Trans. Circuits Syst. II. 71:2319–2323. doi:10.1109/TCSII.2023.3334390
Ward, R., Choudhary, R., Gregory, A., Jans-Singh, M., and Girolami, M. (2021). Continuous calibration of a digital twin: comparison of particle filter and Bayesian calibration approaches. Data-Cent. Eng. 2, e15. doi:10.1017/dce.2021.12
Wen, Y. (2015). Wave recording performance test of power transducer in generator based on RTDS. Sichuan Electr. Power Technol. 38, 88–90. doi:10.16527/j.cnki.cn51-1315/tm.2015.06.021
Xi, J., and Chicharo, J. F. (1996). A new algorithm for improving the accuracy of periodic signal analysis. IEEE Trans. Instrum. Meas. 45, 827–831. doi:10.1109/19.517004
Yang, M., Wang, D., Xu, C., Dai, B., Ma, M., and Su, X. (2023). Power transfer characteristics in fluctuation partition algorithm for wind speed and its application to wind power forecasting. Renew. Energy. 211, 582–594. doi:10.1016/j.renene.2023.05.004
Yu, H., Zhang, J., Sun, W., Zhang, D., Li, L., He, Y., et al. (2020). “A quantification method of harmonic responsibilities based on current tracing principle,” in 2020 7th international conference on information science and control engineering (ICISCE), Changsha, China, 18–20 December 2020. doi:10.1109/ICISCE50968.2020.00319
Zhang, D., Yang, L., Song, Q., Meng, Q., and Pan, F. (2022). Development of a multi-channel analog collector for remote calibration of gateway electric energy metering device. Electr. Meas. Instrum. 59, 181–187. doi:10.19753/j.issn1001-1390.2022.09.025
Zhang, F., Geng, Z., and Ge, Y. (1999). FFT algorithm with high accuracy for harmonic analysis in power system. Proc. CSEE 19, 64–67.
Zhang, Y., Lin, S., Yang, Y., Liu, Q., and Liu, M. (2024). Static voltage stability margin calculation of AC/DC hybrid power grid considering high-order uncertainty of new energy. High. Volt. Eng. 50, 1631–1644. doi:10.13336/j.1003-6520.hve.20231978
Keywords: digital scenario generation, harmonic signal tracing, intelligent power transducer, calibration, kernel density estimation
Citation: Ye J (2025) Digital scenario generation and harmonic signal tracing for calibration of intelligent power transducer. Front. Energy Res. 13:1526796. doi: 10.3389/fenrg.2025.1526796
Received: 12 November 2024; Accepted: 11 February 2025;
Published: 14 March 2025.
Edited by:
Wei Qiu, Hunan University, ChinaReviewed by:
Yonghui Sun, Hohai University, ChinaZhenkun Li, Shanghai University of Electric Power, China
Fan Weihua, Nanjing University of Science and Technology, China
Copyright © 2025 Ye. This is an open-access article distributed under the terms of the Creative Commons Attribution License (CC BY). The use, distribution or reproduction in other forums is permitted, provided the original author(s) and the copyright owner(s) are credited and that the original publication in this journal is cited, in accordance with accepted academic practice. No use, distribution or reproduction is permitted which does not comply with these terms.
*Correspondence: Jiaxing Ye, MTA3MDM5NDU3NUBxcS5jb20=