 Carlos Armenta-Deu
- Facultad de Ciencias Físicas, Universidad Complutense de Madrid, Madrid, Spain
This paper focuses on determining the state of charge (SOC) of lithium-ion batteries when they are in operation and the influence that the state of health (SOH) has on SOC determination. The paper studies the effects of the discharge rate on battery performance and evaluation of the SOC. The paper also analyzes the influence of battery aging on the determination of SOC. The online determination of SOC in lithium-ion batteries uses the linear behavior of battery discharge and the influence of the discharge rate on the battery voltage slope. The paper describes a simple algorithm that relates the SOC of the battery with online battery voltage. The proposed measurement method uses a very short controlled discharge at a specific rate that avoids unexpected interferences with the current operation of the battery during states of charge or discharge. We conducted a simulation process to evaluate the evolution of the SOC in Li-ion batteries for different operating stages. Experimental tests validate the proposed methodology, showing a close agreement between theoretical values and experimental results with 98% accuracy. The paper also deals with determining the aging factor in lithium batteries as a critical parameter to calculate the SOC. The method determines the aging factor using a specific simulation for calculating the SOC. The paper compares the results with the values obtained in an experimental test showing high agreement (>93%). The proposed model applies to all lithium-ion batteries and validates for a wide range of battery state-of-health, up to 50%, and with accurate prediction, higher than 90%.
1 Introduction
Lithium-ion batteries are widely used as electric storage systems in modern applications, mobile or stationary (Korthauer, 2018; Jiang and Zhang, 2015; Choi and Wang, 2018); electronics and microelectronics (Megahed and Ebner, 1995; Wang et al., 2015; Pistoia, 2013); UPS and data centers (Stan et al., 2014; Kok and Setyadi, 2023; Horiba, 2014); or in the industry (Lavoie et al., 2017). Lithium-ion batteries have been implemented in many areas of the modern society (Zubi et al., 2018) and show promising expectations for the future (Zubi et al., 2018; Scrosati et al., 2011). Among the many advantages that lithium-ion batteries have compared to other batteries such as nickel or lead, the specific power is one of the most interesting since it reduces the size and weight of the battery to supply the required energy (Linden and Reddy, 2002; Yoshio and Ralph, 2009). High specific power results in more available energy and autonomy for the defined battery size. The operational time of a battery depends on its capacity and discharge rate. The dependence of a lithium-ion battery capacity on the discharge rate is low, although the capacity reduces with the increase in the discharge rate (Armenta-Déu et al., 2019).
The state of charge (SOC) of a battery is a critical point in managing the operational time; indeed, the autonomy of a battery for a specific capacity depends on the remaining SOC. In many applications, the accuracy in determining the SOC conditions the operation of the external load, such as in electric vehicles, where an inaccurate calculation of the SOC can cause the battery power to deplete earlier than expected, with highly negative consequences; therefore, an accurate determination of the SOC is essential (Yang R. et al., 2017; Adaikkappan and Sathiyamoorthy, 2022).
The determination of the SOC of lithium-ion batteries is the goal of many studies; some studies base the SOC calculation on thermodynamic considerations (Li et al., 2017), while others have used adaptive methods and neural networks to evaluate the SOC (Zhang et al., 2015; Li et al., 2019; Wang et al., 2014). Modeling is also a practical tool in determining the lithium-ion batteries’ SOC, especially when using simulation techniques (Zhang et al., 2012; Xiong et al., 2017; Yang et al., 2016).
The open circuit voltage (OCV) of lithium batteries is the key parameter in calculating the SOC (Xiong et al., 2017; He et al., 2012; Ren et al., 2021; Chen et al., 2019; Lee et al., 2008; Zheng et al., 2016; Xing et al., 2014) since it determines the starting point of the discharge curve for any current rate. The OCV is a characteristic parameter of any battery and represents the electromotive force, which depends on the structure and configuration of the electrochemical cell. It is near a constant value, although it is affected by temperature changes and aging processes (Zhang et al., 2018; Farmann and Sauer, 2017).
Many methods proposed to determine the SOC of lithium-ion batteries use the OCV as a reference (Xiong et al., 2017; He et al., 2012; Ren et al., 2021; Chen et al., 2019; Lee et al., 2008; Zheng et al., 2016; Xing et al., 2014; Zhang et al., 2016). This value, however, depends on the battery capacity itself (Pattipati et al., 2014), the aging processes (Lavigne et al., 2016), and the discharge path (Petzl and Danzer, 2013); therefore, the determination of the OCV requires a modeling process that considers all the factors mentioned above (Zhang et al., 2016; Birkl et al., 2015; Yu et al., 2018; Weng et al., 2014; Weng et al., 2013; Yu et al., 2021).
Since the OCV must be measured offline, determining the SOC of a lithium battery based on the OCV requires a disconnection of the battery during operation. This process is not time-consuming and barely interferes with the current battery discharge. Nevertheless, online determination of the battery OCV results is more effective and practical. Some works in the past have studied and analyzed the online determination of OCV to resolve the existing gap between online and offline operational conditions, leading to inaccuracies in OCV calculation and SOC determination (He et al., 2012; Chiang et al., 2011).
Recent research bases the lithium batteries’ SOC determination on thermodynamic analysis (t-SOC) and engineering approach (e-SOC) (Li et al., 2017), electrochemical modeling (Wang et al., 2023), adaptive methods (Yang et al., 2021), or recurrent neural networks (Li et al., 2021). Other recently published works deal with SOC stacked encoder–decoder techniques (Terala et al., 2022) or Kalman filter algorithms (Xie et al., 2023).
The determination of the SOC in lithium batteries based on the OCV, however, is not the only method for calculation; alternative solutions arise from the analysis of the evolution of the battery voltage during the discharge, especially if we consider the influence of the discharge rate on the performance of the battery. This paper proposes a new technique to characterize the SOC in lithium-ion batteries during operation with minimum interference in the current operation.
2 State of the art
Previous works have analyzed the various methodologies developed for determining a battery’s SOC (Piller et al., 2001). In this work, the authors analyze the existing methods for all types of batteries, such as lead-acid and lithium. Because we are dealing with lithium batteries, we include only the methodologies related to this type of batteries.
• Discharge test
• Ampere hour counting (including loss calculation)
• Linear model
• Artificial neural network
• Impedance spectroscopy
• Kalman filters
Since a detailed description of every method is arduous, we summarize the main characteristics in Table 1, showing the advantages and drawbacks of all the methods.
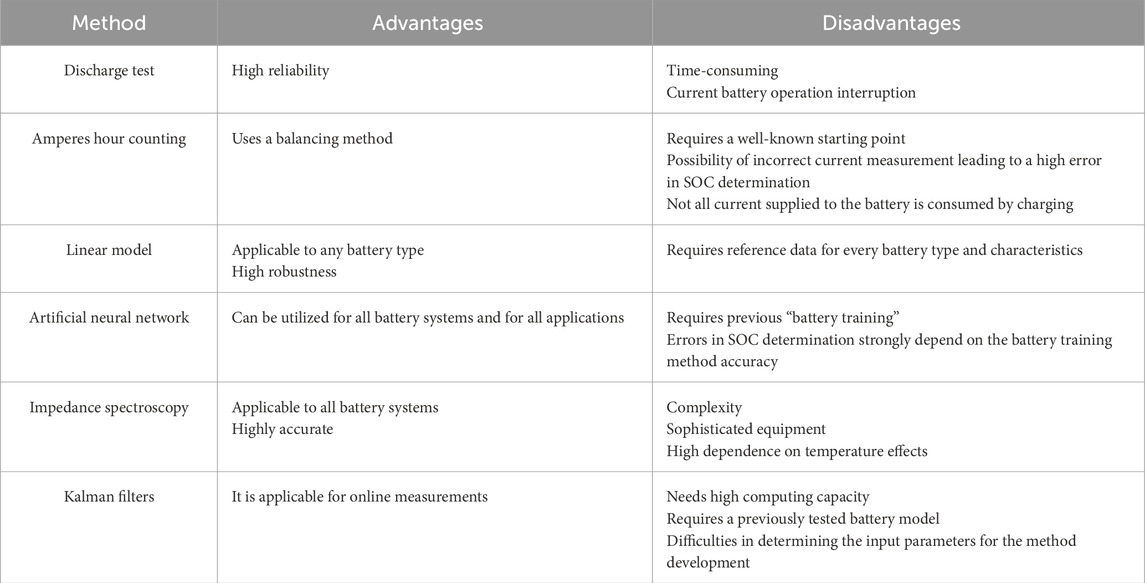
Table 1. Advantages and disadvantages of the used methodologies for determining the state of charge in lithium batteries.
We notice that the proposed method avoids many of the drawbacks shown in Table 1, while sharing some advantages, and provides a reliable, confident, and accurate methodology valid for all kinds of lithium batteries.
3 Materials and methods
3.1 Theoretical basis
The SOC of a battery defines the remaining available charge in the battery pack; mathematically:
In terms of discharge time:
Q represents the extracted charge from the battery during a specific time t. Sub-indexes m and D account for intermediate and complete discharge, respectively.
Since the voltage evolution of a lithium battery during the discharge process is linear, we can relate discharge time and battery voltage for an intermediate point as follows:
Vm and Vo are the battery voltages at the intermediate and full charge state, respectively, and m is the discharge curve slope.
The time for a complete discharge depends on the battery capacity, Cr, and on the discharge current, ID:
Battery capacity depends on the discharge rate according to the following expression (Armenta-Déu et al., 2019):
fC is the capacity correction factor, and Cn is the nominal capacity of the battery.
The capacity correction factor is a parameter that depends on the discharge rate X as follows:
Parameters a and b are empiric. Equation 7 provides the values for lithium-ion batteries (Armenta-Déu et al., 2019):
Combining Equations 2–6:
This equation provides a practical algorithm to determine the lithium battery’s SOC by only measuring the voltage at an intermediate point and the discharge current.
Equation 8, however, is only valid for non-aged batteries, which is not the current situation; aging causes a reduction in the capacity of delivering charge (Broussely et al., 2005; Yang X. G. et al., 2017; Keil et al., 2016; Petzl et al., 2015) due to degradation of the active matter of the battery, an increase in internal resistance, secondary electrochemical reactions at the electrode interphase, etc. (Zeng and Liu, 2023; Xiong et al., 2020).
If the reduction in battery capacity is due to the depletion of active matter, the discharge curve maintains the slope but reduces the time to reach the collapse point (Zhang et al., 2000); if the increase in the internal resistance is the cause of battery capacity reduction, the discharge curve slope increases, and the time before reaching the collapse time is decreased (Mandli et al., 2019). In the case of the combined effects of active matter depletion and internal resistance increase, the battery performance is similar to the case of internal resistance increase only.
Considering the battery performance, we can represent the aging effects as a linear evolution of the battery voltage. The aged battery has a higher slope in the voltage drop and reduced discharge time. Figure 1 shows the simulation.
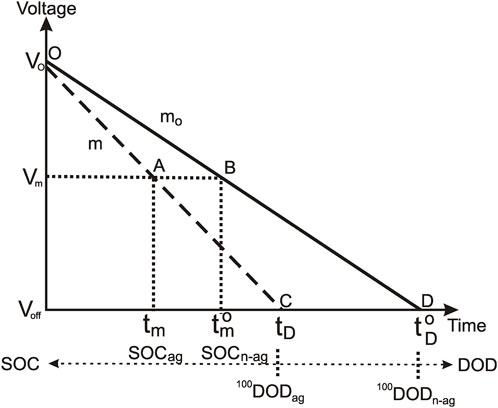
Figure 1. Schematic representation of the comparative performance of lithium battery discharge curve for aged and non-aged cases.
Figure 1 represents the comparative evolution of the lithium-ion battery voltage during a complete discharge for aged and non-aged batteries. The solid line corresponds to a completely new battery, and the dashed line corresponds to the aged one.
3.2 Simulation process
To analyze the battery aging influence on SOC determination, we consider two identical batteries of nominal capacity Cn submitted to a discharge rate X, where one is completely new (SOH = 100) and the other one with some previous cycling (SOH<100).
Although it is not critical, the simulation applies to a complete discharge process until reaching the collapse point to facilitate the comprehension of how aging modifies SOC determination; nevertheless, we can develop the simulation to a partial discharge as well.
Let us suppose we measure a battery voltage, Vm, during operation that corresponds to an intermediate point of the discharge process, and thus to a partial discharge of the battery. At this point, the battery shows a specific SOC, which is different for the aged and non-aged batteries. We identify these two points as A and B in Figure 1 and the corresponding SOC as SOCag and SOCn-ag, respectively.
In current conditions, the control system that evaluates the battery SOC provides SOCn-ag as the estimated value since it considers the battery as new; however, if the battery is aged, the value is SOCag, as shown in Figure 1. The difference between the two values represents a loss of delivered charge that we must compute to correct the estimated value of the SOC and convert it into the true one.
The SOC of the battery, point B, is calculated using Equation 2, which is as follows for the two batteries (Equation 9):
Operating in Equation 9, we have:
Using Equation 3:
Combining Equations 10 and 11:
The expression for the discharge curve slope is as follows:
Replacing Equation 13 in Equation 12:
Applying Equation 4 to Equation 14:
Using Equations 5 and 6, and replacing in Equations 15:
Replacing X in Equation 16 in terms of intensity and capacity, and using Equation 13:
Here, the aging factor, fag, represents the nominal capacity ratio of aged to non-aged batteries.
The battery manufacturer provides the voltages for the charged and discharged batteries, Vo and Voff, respectively. The control circuit voltmeter measures the operational voltage at the control point, Vm (Figure 2).
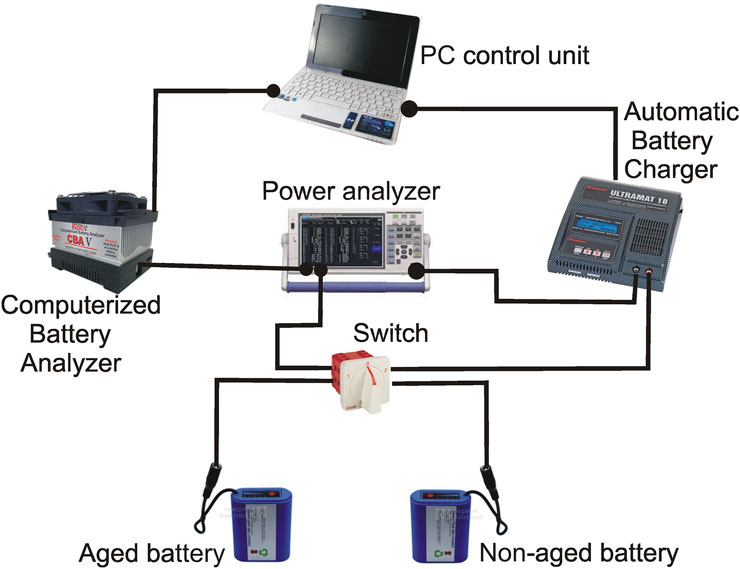
Figure 2. Layout of the testing system.
To calculate the discharge curve slope, we measure the battery voltage at the initial and final points of a time interval and determine it using Equation 11, where tm and tom are the time intervals for every battery, aged and non-aged. We make this operation during the battery discharge process; the control unit regulates the current extracted from the battery during the measurement to avoid changes in the intensity.
The proposed methodology complements other existing techniques based on thermodynamic analysis (Li et al., 2017), neural networks and adaptive methods (Zhang et al., 2015; Li et al., 2019; Wang et al., 2014), or modeling (Zhang et al., 2012; Xiong et al., 2017; Yang et al., 2016), enriching the current state of the art regarding SOC determination of lithium-ion batteries.
Temperature effects are considered for more accurate determination of the battery SOC. Previous studies used a joint estimation method for lithium-ion battery SOC and temperature based on ultrasonic reflection waves (Zhang et al., 2023). If the battery operates in climates with a wide temperature variation, it is suitable to apply a method to correct the battery’s SOC as the temperature changes.
3.3 Aging factor
We need to know how many agents intervene in the degradation of the battery, their action time, and the activity depth of each agent to determine the aging factor. Since this requires a deep knowledge of the battery history such as the cycling, the working temperature, the discharge rate, and the depth of discharge, it is difficult to determine the aging factor accurately. Nevertheless, we can estimate the aging factor considering that the battery’s current capacity represents the state of health (SOH); therefore, we assume that an aged battery has a lower capacity than a non-aged one.
Based on the previous statement, we evaluate the aging factor by comparing the discharge curve slope of an aged battery and a non-aged one. According to Figure 1, an aged battery discharges quicker for the same discharge rate; therefore, if we submit the battery to a controlled discharge of known intensity, we can calculate the discharge curve slope by applying Equation 11. This equation is valid for batteries that were initially charged, which requires starting the controlled discharge process with a charged battery.
To avoid altering the SOC of the battery, the controlled discharge is kept short in time; however, the intensity is high enough to generate a measurable voltage drop with high accuracy. After the test run, we process the information, adapting Equation 13 to calculate the slope for every battery in the following form:
By extrapolating the voltage evolution of the test until reaching the cut-off point where the battery collapses is given by Equation 19:
Since the intensity is the same for the two batteries, we obtain the aging factor from the ratio of the aged to non-aged battery capacity as follows:
Or
Equation 21 shows how to determine the aging factor with only the knowledge of the two discharge curve slopes.
Since the battery SOH depends on micro-health changes that occur in short and fast battery discharges, it is critical to evaluate these micro-changes to improve the test efficiency. For this goal, the proposed methodology can be applied to short and fast discharges, analyzing the discharge curve slope differential for any process. Considering that global health loss is the addition of micro-health losses, we determine the battery SOH by computing the sum of all micro-health losses and encompassing the process set in a single one.
4 Results
4.1 Experimental tests
4.1.1 Aging factor
To run the tests, we designed and built a control circuit consisting of a double-battery block, one aged and one non-aged, connected to a computerized battery analyzer (CBA), a model CBA V from West Mountain Radio manufacturer (Computerized Battery Analyzer (CBA V), 2025), for automatic battery discharge. To charge the battery, we use a Robbe Modellsport automatic control charger, a model Ultramat 18 from Graupner (Graupner Ultramat 18, 2025). The electric circuit uses a power analyzer PCE model PA6000 (PCE INSTRUMENTS, 2025) to measure the battery voltage and the working electric current. We use a PC to control the CBA and Ultramat devices; therefore, we regulate the intensity during the charge or discharge of the battery. The CBA and Ultramat software permit continuous registering of the voltage and intensity values. We record the values in the PC hard disk for later analysis. Figure 2 shows the layout of the testing system.
The test runs at 5 A intensity at 1-s intervals, lasting for 15 s, which means a discharge of 0.02 Ah, which is less than 1% of the non-aged battery’s capacity. The corresponding voltage drop was 0.037 V, which matches the expected theoretical value with 95% accuracy.
We calculate the theoretical value of the voltage drop during the test from Equation 22:
For the discharge time, toD:
Applying values to Equation 23, we obtain the discharge time, (Equation 24), and test voltage drop (Equation 25):
Since the power analyzer has a voltage accuracy of 0.1 mV, the voltage drop at the test run has a precision of 97.3%, which is high enough to validate the test.
Repeating the test for the aged battery, we obtained a voltage drop of 0.045 V; therefore, on applying the developed equations for the aging factor, it results in the following:
Combining Equations 18, 26:
Applying values to Equation 27, we have:
We ran a complete discharge test for the aged battery to validate the calculation, obtaining a capacity of 1.978 Ah, which means a deviation of 2% referred to the tested value in Equation 28.
Now, applying Equation 21, we obtain the aging factor in Equation 29:
We checked the different parameters using the tests and the complete discharge values to validate the method. We show the results of the comparative analysis in Table 2.
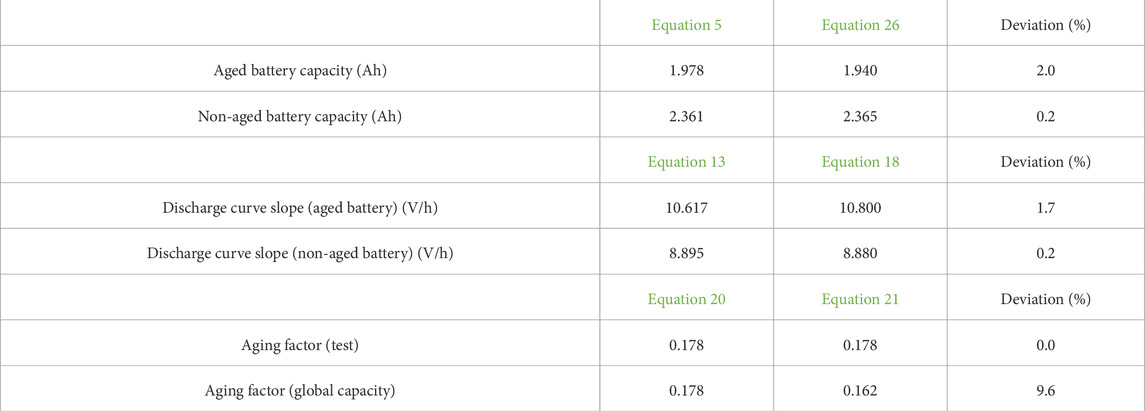
Table 2. Parameter values for the test and complete discharge process.
We notice high matching in the determination of the battery capacity using any of the two methods, the one derived from the application of a previous work (Armenta-Déu et al., 2019) or the alternative proposed in this paper, with an accuracy higher than 98% for the aged battery and almost 100% for the non-aged one.
We obtain a similar result from the analysis of the determination of the discharge curve slope, with almost identical values in the accuracy for the aged battery and the same value for the non-aged one.
Finally, the analysis of the aging factor, which is the goal of the testing method, results in a perfect matching when using the values from the specific discharge test for charged batteries, but it differs by nearly 10% if we use the global discharge process. This deviation shows that the performance does not remain uniform during the entire discharge compared to the initial test, probably due to the non-homogeneous behavior of aged batteries. The result is, however, acceptable, and the influence on the determination of the battery SOC is limited.
Further tests show that the deviation reduces if the initial test lasts longer (Figure 3); however, the extracted current during the test increases, resulting in higher interference in the battery performance. Figure 4 shows the evolution of the battery depth of discharge (DOD) associated with the initial test. If the initial interval is higher than 15 s, the DOD exceeds 1%; therefore, we consider this value as the threshold beyond which the initial discharge is not acceptable. Consequently, we estimate the aging factor with a minimum accuracy of 9.6%.
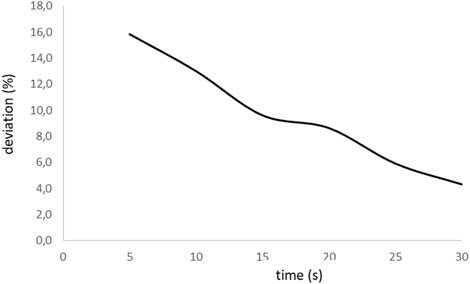
Figure 3. Evolution of deviation in aging factor determination with time of the initial test.
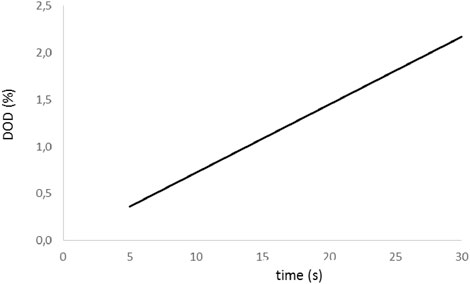
Figure 4. Evolution of the battery DOD with the interval time of the initial test.
The evolution of the deviation with the aging factor adjusts to a right line within 98% accuracy; the corresponding linear regression is of the following type:
Equation 30 allows us to set up the minimum required time for the aging determination test as a function of the DOD caused by the test. Indeed, since we should know the discharge intensity at which the aging test is running, Itest, and if we set up a maximum value of the DOD for the test, (DOD)set, we have
Equation 31 permits regulating the aging test discharge intensity for the maximum setup value of DOD and aging factor deviation, δ.
We obtain moderate values of the initial test intensity if the allowed DOD is low; however, the intensity increases rapidly for intermediate and high values of the DOD.
We can express the maximum test duration as follows:
The DOD related to the aging test refers to the corrected battery capacity due to the discharge rate.
Figure 5 shows the evolution of the test intensity for the different values of DOD and aging factor deviation.
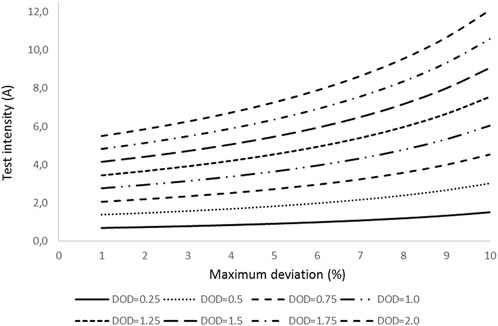
Figure 5. Evolution of the aging test intensity with the allowed maximum values of DOD and δ
If, for instance, for a battery of 2.5 Ah capacity, we set up a maximum DOD of 1% and a maximum deviation of the aging factor of 5%, checking Figure 5, we obtain a test intensity of 3.64 A; therefore, applying Equation 32, we have
Equation 33 provides the duration of the test for determining the aging factor.
4.1.2 State of charge
Once the aging factor is determined, we run a group of tests to validate the SOC determination method, which consists of a controlled discharge process at a constant intensity from 1 A to 5 A in 1 A interval. We apply the two discharge groups to aged and non-aged batteries. For the aged batteries, we use three different batteries with an aging factor of 0.178, 0.335, and 0.486; therefore, we can analyze the influence of the aging factor on the determination of the SOC.
To determine the SOC, we use two different methods. In the first one, we apply the simulation developed in the present work (Equation 11) based on the battery voltage measurement during discharge at regular intervals of 5 min; in the second one, we evaluate the charge extracted from the battery at the experimental test by applying Equation 1. Since we operate at a constant intensity, we calculate the extracted charge, Qout, using the following expression:
Here, top is the operating time, and ID is the discharge intensity.
The term QD in Equation 1 computes for the global discharge time, tD; therefore, we obtain the experimental value of the SOC from Equation 35:
tm represents the time at which we measure the battery voltage.
We present the results of the SOC in two paired graphs (Figures 6–9): one shows the evolution of the SOC during discharge for the different discharge intensities, and the other shows the ratio of the experimental to theoretical value, which indicates the accuracy in determining the SOC using the proposed methodology. The solid line in the SOC evolution figure corresponds to the theoretical calculation using the algorithm of Equation 11, while the dashed line accounts for the experimental values.
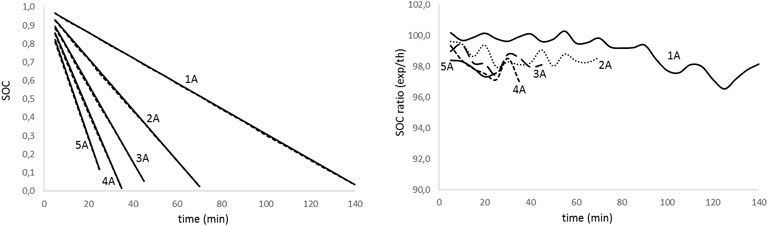
Figure 6. State of charge evolution for non-aged battery with discharge time for different discharge intensities (left); theoretical to experimental ratio of the state of charge for the discharge test for different discharge intensities (right).
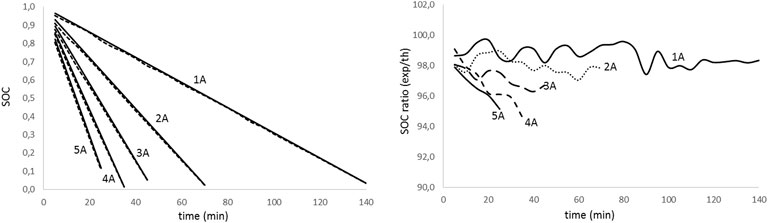
Figure 7. State of charge evolution for aged battery (fag= 0.178) with discharge time for different discharge intensities (left); theoretical to experimental ratio of the state of charge for the discharge test for different discharge intensities (right).

Figure 8. State of charge evolution for aged battery (fag= 0.335) with discharge time for different discharge intensities (left); theoretical to experimental ratio of the state of charge for the discharge test for different discharge intensities (right).
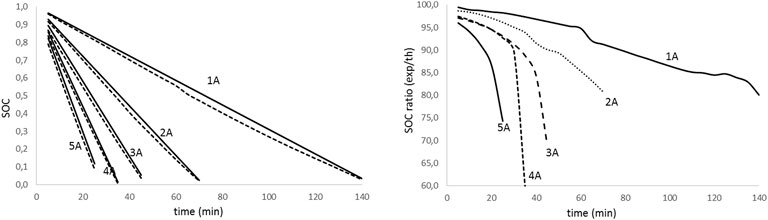
Figure 9. State of charge evolution for aged battery (fag= 0.486) with discharge time for different discharge intensities (left); theoretical to experimental ratio of the state of charge for the discharge test for different discharge intensities (right).
Applying Equation 17 and using data from the developed study, we obtain the estimated error in the SOC determination, resulting in a value lower than 0.42% and 0.51% for the theoretical prediction and experimental results, respectively.
Analyzing figures from different tests, we realize that there is a high agreement between theoretical values and experimental results (graphics on the left) for all the discharge intensities and the aged and non-aged batteries. On the other hand, looking at the graphs on the right, we notice that the accuracy in predicting the SOC decreases with the increase in intensity and the DOD. The effect is more evident as the battery ages. Table 3 summarizes the average accuracy for every discharge rate and battery.
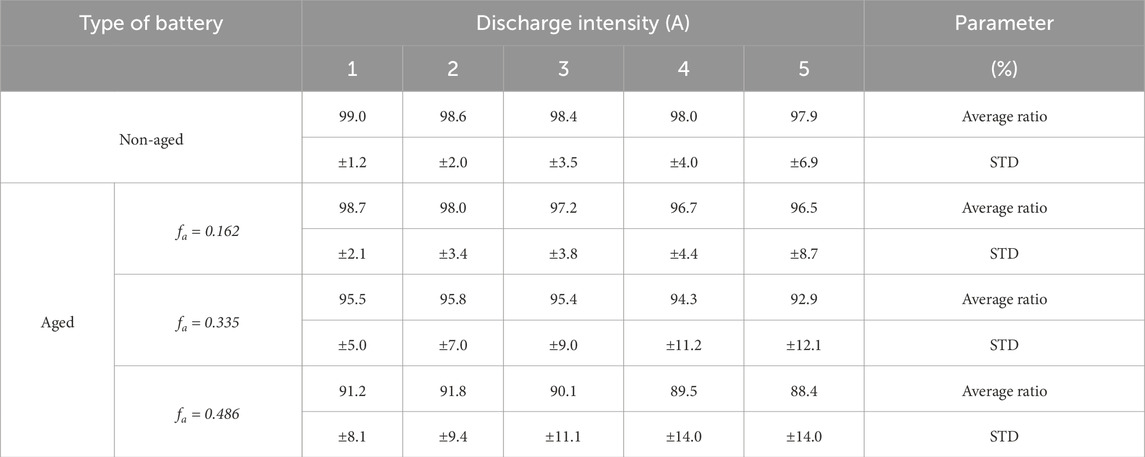
Table 3. Theoretical to experimental ratio of the state of charge for aged and non-aged lithium batteries.
The analysis of results in Table 3 confirms that the lithium batteries’ SOC determination diminishes in accuracy as the discharge rate and aging increase. Nevertheless, the obtained results are promising since we predict the SOC on the average value of 98.4% for non-aged batteries and 97.4%, 94.8%, and 90.2% for low, medium, and deep aged batteries, respectively.
Statistical analysis of data from Table 3 shows a dispersion factor that increases with aging and discharge rate, similar to the accuracy average value in battery SOC determination. We realize that for all the cases, the standard deviation (STD) increases along with the discharge rate and aging factor.
5 Conclusions
A new method to determine the SOC in lithium-ion batteries is proposed and developed. This method resides in the linear evolution of the battery voltage with discharge time.
A capacity correction factor, which depends on the discharge rate, applies to determining the battery current capacity. This correction is critical to enhance the accuracy of SOC prediction.
The proposed model considers the battery aging to determine the current SOC. These effects relate to an aging factor, which modifies the battery’s SOC. We propose a method to estimate the aging factor. This method runs on a simulation process, which determines the battery aging with enough accuracy.
We determined the aging factor of the tested batteries with 90.4% accuracy for a testing process of 15 s; this value improves if the test interval increases up to 30 s, where the precision in the determination of the aging factor is approximately 96%. Longer testing time, however, presents the inconvenience of discharging more than 1% of the battery’s total capacity, which represents a significant energy loss.
The developed simulation for the aging factor determination permits the user to calculate the duration of the test, provided that we set up the maximum value of the battery DOD associated with the test and the accuracy in determining the aging factor.
The proposed method determines, with high accuracy, the lithium battery’s SOC, depending on the discharge rate and the battery aging. For non-aged batteries, the methodology determines the SOC with an average precision higher than 98%; if we used aged batteries, the accuracy depends on the battery age; for a slightly aged battery, with an aging factor of 17.8%, the average accuracy in determining the battery SOC is 97.4%. However, if the battery ages up to an aging factor of 0.486, the average SOC accuracy reduces to 90.2%.
The discharge rate also influences the SOC determination accuracy; indeed, for low rate discharges such as 0.4 C, the average value, considering aged and non-aged batteries, is 96.1%, while for medium to high discharge rates of 2 C and over, the accuracy in determining the SOC is 93.9%. The high precision in determining the SOC in lithium-ion batteries allows the user to predict the remaining charge, and thus, the autonomy of the operating system.
We also developed a statistical analysis on the results of the battery SOC determination to evaluate their spreading; a high dispersion represents a drawback because of the uncertainty in the current SOC and, consequently, in the battery autonomy.
The statistical analysis results show that for non-aged batteries, the average standard deviation is only σ = 3.52, representing a low value below an acceptable threshold of σ = 5. Low-degraded batteries with an aging factor below 0.2 show a similar behavior with an average standard deviation below the threshold (σ = 4.48).
The standard deviation for aged batteries exceeds the setup threshold, with average characteristic values of σ = 8.88 and σ = 11.32 for the intermediate- (fag = 0.335) and high (fag = 0.485)-degraded batteries, respectively. These results indicate that the SOC estimation for medium- and high-degraded lithium batteries suffers from uncertainty.
The proposed method can be integrated into a battery management system (BMS) by simply collecting the relevant parameter data in SOC and SOH calculation. The computer unit that manages the battery operation calculates the voltage slope using the current and stored data and determines the battery’s SOH.
Data availability statement
The original contributions presented in the study are included in the article/supplementary material, further inquiries can be directed to the corresponding author.
Author contributions
CA-D: conceptualization, data curation, formal analysis, investigation, methodology, supervision, validation, visualization, writing – original draft, and writing – review and editing.
Funding
The author(s) declare that no financial support was received for the research and/or publication of this article.
Conflict of interest
The author declares that the research was conducted in the absence of any commercial or financial relationships that could be construed as a potential conflict of interest.
Generative AI statement
The author(s) declare that no Generative AI was used in the creation of this manuscript.
Publisher’s note
All claims expressed in this article are solely those of the authors and do not necessarily represent those of their affiliated organizations, or those of the publisher, the editors and the reviewers. Any product that may be evaluated in this article, or claim that may be made by its manufacturer, is not guaranteed or endorsed by the publisher.
References
Adaikkappan, M., and Sathiyamoorthy, N. (2022). Modeling, state of charge estimation, and charging of lithium-ion battery in electric vehicle: a review. Int. J. Energy Res. 46 (3), 2141–2165. doi:10.1002/er.7339
Armenta-Déu, C., Carriquiry, J. P., and Guzmán, S. (2019). Capacity correction factor for Li-ion batteries: influence of the discharge rate. J. Energy Storage 25, 100839. doi:10.1016/j.est.2019.100839
Birkl, C. R., McTurk, E., Roberts, M. R., Bruce, P. G., and Howey, D. A. (2015). A parametric open circuit voltage model for lithium ion batteries. J. Electrochem. Soc. 162 (12), A2271–A2280. doi:10.1149/2.0331512jes
Broussely, M., Biensan, P., Bonhomme, F., Blanchard, P., Herreyre, S., Nechev, K., et al. (2005). Main aging mechanisms in Li ion batteries. J. power sources 146 (1-2), 90–96. doi:10.1016/j.jpowsour.2005.03.172
Chen, X., Lei, H., Xiong, R., Shen, W., and Yang, R. (2019). A novel approach to reconstruct open circuit voltage for state of charge estimation of lithium ion batteries in electric vehicles. Appl. Energy 255, 113758. doi:10.1016/j.apenergy.2019.113758
Chiang, Y. H., Sean, W. Y., and Ke, J. C. (2011). Online estimation of internal resistance and open-circuit voltage of lithium-ion batteries in electric vehicles. J. Power Sources 196 (8), 3921–3932. doi:10.1016/j.jpowsour.2011.01.005
Choi, S., and Wang, G. (2018). Advanced lithium-ion batteries for practical applications: technology, development, and future perspectives. Adv. Mater. Technol. 3 (9), 1700376. doi:10.1002/admt.201700376
Computerized Battery Analyzer (CBA V) (2025). West Mountain Radio, 1020 spring city drive. Available online at: https://www.westmountainradio.com/cba.php.
Farmann, A., and Sauer, D. U. (2017). A study on the dependency of the open-circuit voltage on temperature and actual aging state of lithium-ion batteries. J. Power Sources 347, 1–13. doi:10.1016/j.jpowsour.2017.01.098
Graupner Ultramat 18 (2025). Graupner, Robbe Modellsport, Industriestraβe 10, 4565 Inzersdorf im Krestal. Available online at: https://www.robbe.com/en/BATTERIES/CHARGERS-POWER-SUPPLIES/Chargers/Chargers-AC-DC-12-240V/GRAUPNER-ULTRAMAT-18-12-230V-CHARGER/6470.
He, H., Zhang, X., Xiong, R., Xu, Y., and Guo, H. (2012). Online model-based estimation of state-of-charge and open-circuit voltage of lithium-ion batteries in electric vehicles. Energy 39 (1), 310–318. doi:10.1016/j.energy.2012.01.009
Horiba, T. (2014). Lithium-ion battery systems. Proc. IEEE 102 (6), 939–950. doi:10.1109/jproc.2014.2319832
Jiang, J., and Zhang, C. (2015). Fundamentals and applications of lithium-ion batteries in electric drive vehicles. John Wiley and Sons.
Keil, P., Schuster, S. F., Wilhelm, J., Travi, J., Hauser, A., Karl, R. C., et al. (2016). Calendar aging of lithium-ion batteries. J. Electrochem. Soc. 163 (9), A1872–A1880. doi:10.1149/2.0411609jes
Kok, C. L., and Setyadi, Y. (2023). “Li-Ion-Based DC UPS for remote application,” in The internet of medical things (IoMT) and telemedicine frameworks and applications (New York, NY: IGI Global), 276–289.
Lavigne, L., Sabatier, J., Francisco, J. M., Guillemard, F., and Noury, A. (2016). Lithium-ion Open Circuit Voltage (OCV) curve modelling and its ageing adjustment. J. Power Sources 324, 694–703. doi:10.1016/j.jpowsour.2016.05.121
Lavoie, Y., Danet, F., and Lombard, B. (2017). “Lithium-ion batteries for industrial applications,” in 2017 Petroleum and Chemical Industry Technical Conference (PCIC) (IEEE), 283–290.
Lee, S., Kim, J., Lee, J., and Cho, B. H. (2008). State-of-charge and capacity estimation of lithium-ion battery using a new open-circuit voltage versus state-of-charge. J. power sources 185 (2), 1367–1373. doi:10.1016/j.jpowsour.2008.08.103
Li, S., Ju, C., Li, J., Fang, R., Tao, Z., Li, B., et al. (2021). State-of-charge estimation of lithium-ion batteries in the battery degradation process based on recurrent neural network. Energies 14 (2), 306. doi:10.3390/en14020306
Li, X., Wang, Z., and Zhang, L. (2019). Co-estimation of capacity and state-of-charge for lithium-ion batteries in electric vehicles. Energy 174, 33–44. doi:10.1016/j.energy.2019.02.147
Li, Z., Huang, J., Liaw, B. Y., and Zhang, J. (2017). On state-of-charge determination for lithium-ion batteries. J. Power Sources 348, 281–301. doi:10.1016/j.jpowsour.2017.03.001
Mandli, A. R., Kaushik, A., Patil, R. S., Naha, A., Hariharan, K. S., Kolake, S. M., et al. (2019). Analysis of the effect of resistance increase on the capacity fade of lithium ion batteries. Int. J. Energy Res. 43 (6), 2044–2056. doi:10.1002/er.4397
Megahed, S., and Ebner, W. (1995). Lithium-ion battery for electronic applications. J. Power Sources 54 (1), 155–162. doi:10.1016/0378-7753(94)02059-c
Pattipati, B., Balasingam, B., Avvari, G. V., Pattipati, K. R., and Bar-Shalom, Y. (2014). Open circuit voltage characterization of lithium-ion batteries. J. Power Sources 269, 317–333. doi:10.1016/j.jpowsour.2014.06.152
PCE INSTRUMENTS (2025). Analizador de potencia PCE-PA6000. Available online at: https://www.pce-instruments.com/espanol/instrumento-medida/medidor/analizador-de-potencia-pce-instruments-analizador-de-potencia-pce-pa6000-ica-incl.-certificado-de-calibraci_n-iso-det_5890716.htm?_list=qr.art&_listpos=23.
Petzl, M., and Danzer, M. A. (2013). Advancements in OCV measurement and analysis for lithium-ion batteries. IEEE Trans. energy Convers. 28 (3), 675–681. doi:10.1109/tec.2013.2259490
Petzl, M., Kasper, M., and Danzer, M. A. (2015). Lithium plating in a commercial lithium-ion battery–A low-temperature aging study. J. power sources 275, 799–807. doi:10.1016/j.jpowsour.2014.11.065
Piller, S., Perrin, M., and Jossen, A. (2001). Methods for state-of-charge determination and their applications. J. power sources 96 (1), 113–120. doi:10.1016/s0378-7753(01)00560-2
Ren, Z., Du, C., Wu, Z., Shao, J., and Deng, W. (2021). A comparative study of the influence of different open circuit voltage tests on model-based state of charge estimation for lithium-ion batteries. Int. J. Energy Res. 45 (9), 13692–13711. doi:10.1002/er.6700
Scrosati, B., Hassoun, J., and Sun, Y. K. (2011). Lithium-ion batteries. A look into the future. Energy and Environ. Sci. 4 (9), 3287–3295. doi:10.1039/c1ee01388b
Stan, A. I., Swierczynski, M., Stroe, D. I., Teodorescu, R., Andreasen, S. J., and Moth, K. (2014). “A comparative study of lithium ion to lead acid batteries for use in UPS applications,” in 2014 IEEE 36th international telecommunications energy conference (INTELEC) (IEEE), 1–8.
Terala, P. K., Ogundana, A. S., Foo, S. Y., Amarasinghe, M. Y., and Zang, H. (2022). State of charge estimation of lithium-ion batteries using stacked encoder–decoder bi-directional LSTM for EV and HEV applications. Micromachines 13 (9), 1397. doi:10.3390/mi13091397
Wang, J., Meng, J., Peng, Q., Liu, T., Zeng, X., Chen, G., et al. (2023). Lithium-ion battery state-of-charge estimation using electrochemical model with sensitive parameters adjustment. Batteries 9 (3), 180. doi:10.3390/batteries9030180
Wang, Y., Fang, H., Sahinoglu, Z., Wada, T., and Hara, S. (2014). Adaptive estimation of the state of charge for lithium-ion batteries: nonlinear geometric observer approach. IEEE Trans. Control Syst. Technol. 23 (3), 948–962. doi:10.1109/tcst.2014.2356503
Wang, Y., Liu, B., Li, Q., Cartmell, S., Ferrara, S., Deng, Z. D., et al. (2015). Lithium and lithium ion batteries for applications in microelectronic devices: a review. J. Power Sources 286, 330–345. doi:10.1016/j.jpowsour.2015.03.164
Weng, C., Sun, J., and Peng, H. (2013). “An open-circuit-voltage model of lithium-ion batteries for effective incremental capacity analysis,” in Dynamic systems and control conference (American Society of Mechanical Engineers). doi:10.1115/dscc2013-397956123
Weng, C., Sun, J., and Peng, H. (2014). A unified open-circuit-voltage model of lithium-ion batteries for state-of-charge estimation and state-of-health monitoring. J. power Sources 258, 228–237. doi:10.1016/j.jpowsour.2014.02.026
Xie, J., Wei, X., Bo, X., Zhang, P., Chen, P., Hao, W., et al. (2023). State of charge estimation of lithium-ion battery based on extended Kalman filter algorithm. Front. Energy Res. 11, 1180881. doi:10.3389/fenrg.2023.1180881
Xing, Y., He, W., Pecht, M., and Tsui, K. L. (2014). State of charge estimation of lithium-ion batteries using the open-circuit voltage at various ambient temperatures. Appl. Energy 113, 106–115. doi:10.1016/j.apenergy.2013.07.008
Xiong, R., Pan, Y., Shen, W., Li, H., and Sun, F. (2020). Lithium-ion battery aging mechanisms and diagnosis method for automotive applications: recent advances and perspectives. Renew. Sustain. Energy Rev. 131, 110048. doi:10.1016/j.rser.2020.110048
Xiong, R., Yu, Q., and Lin, C. (2017). A novel method to obtain the open circuit voltage for the state of charge of lithium ion batteries in electric vehicles by using H infinity filter. Appl. energy 207, 346–353. doi:10.1016/j.apenergy.2017.05.136
Yang, F., Xing, Y., Wang, D., and Tsui, K. L. (2016). A comparative study of three model-based algorithms for estimating state-of-charge of lithium-ion batteries under a new combined dynamic loading profile. Appl. energy 164, 387–399. doi:10.1016/j.apenergy.2015.11.072
Yang, R., Xiong, R., He, H., Mu, H., and Wang, C. (2017). A novel method on estimating the degradation and state of charge of lithium-ion batteries used for electrical vehicles. Appl. Energy 207, 336–345. doi:10.1016/j.apenergy.2017.05.183
Yang, S., Zhou, S., Hua, Y., Zhou, X., Liu, X., Pan, Y., et al. (2021). A parameter adaptive method for state of charge estimation of lithium-ion batteries with an improved extended Kalman filter. Sci. Rep. 11 (1), 5805. doi:10.1038/s41598-021-84729-1
Yang, X. G., Leng, Y., Zhang, G., Ge, S., and Wang, C. Y. (2017). Modeling of lithium plating induced aging of lithium-ion batteries: transition from linear to nonlinear aging. J. Power Sources 360, 28–40. doi:10.1016/j.jpowsour.2017.05.110
Yoshio, M., and Ralph, J. (2009). Brodd, lithium-ion batteries: science and technology. Springer Verlag.
Yu, Q., Wan, C., Li, J., Zhang, X., Huang, Y., Liu, T., et al. (2021). An open circuit voltage model fusion method for state of charge estimation of lithium-ion batteries. Energies 14 (7), 1797. doi:10.3390/en14071797
Yu, Q. Q., Xiong, R., Wang, L. Y., and Lin, C. (2018). A comparative study on open circuit voltage models for lithium-ion batteries. Chin. J. Mech. Eng. 31 (1), 65–68. doi:10.1186/s10033-018-0268-8
Zeng, J., and Liu, S. (2023). Research on aging mechanism and state of health prediction in lithium batteries. J. Energy Storage 72, 108274. doi:10.1016/j.est.2023.108274
Zhang, C., Jiang, J., Zhang, L., Liu, S., Wang, L., and Loh, P. C. (2016). A generalized SOC-OCV model for lithium-ion batteries and the SOC estimation for LNMCO battery. Energies 9 (11), 900. doi:10.3390/en9110900
Zhang, C., Jiang, J., Zhang, W., and Sharkh, S. M. (2012). Estimation of state of charge of lithium-ion batteries used in HEV using robust extended Kalman filtering. Energies 5 (4), 1098–1115. doi:10.3390/en5041098
Zhang, C., Li, X., Chen, W., Yin, G. G., and Jiang, J. (2015). Robust and adaptive estimation of state of charge for lithium-ion batteries. IEEE Trans. Industrial Electron. 62 (8), 4948–4957. doi:10.1109/tie.2015.2403796
Zhang, D., Haran, B. S., Durairajan, A., White, R. E., Podrazhansky, Y., and Popov, B. N. (2000). Studies on capacity fade of lithium-ion batteries. J. Power Sources 91 (2), 122–129. doi:10.1016/s0378-7753(00)00469-9
Zhang, R., Li, X., Sun, C., Yang, S., Tian, Y., and Tian, J. (2023). State of charge and temperature joint estimation based on ultrasonic reflection waves for lithium-ion battery applications. Batteries 9 (6), 335. doi:10.3390/batteries9060335
Zhang, R., Xia, B., Li, B., Cao, L., Lai, Y., Zheng, W., et al. (2018). A study on the open circuit voltage and state of charge characterization of high capacity lithium-ion battery under different temperature. Energies 11 (9), 2408. doi:10.3390/en11092408
Zheng, F., Xing, Y., Jiang, J., Sun, B., Kim, J., and Pecht, M. (2016). Influence of different open circuit voltage tests on state of charge online estimation for lithium-ion batteries. Appl. energy 183, 513–525. doi:10.1016/j.apenergy.2016.09.010
Keywords: lithium-ion batteries, state of charge, state of health, aging effects, simulation process, online determination, operating stage, online battery voltage
Citation: Armenta-Deu C (2025) Online determination of state of charge in lithium-ion batteries: influence of the state of health. Front. Energy Res. 13:1573972. doi: 10.3389/fenrg.2025.1573972
Received: 13 February 2025; Accepted: 15 May 2025;
Published: 18 June 2025.
Edited by:
Kaiwen Chen, Hong Kong Polytechnic University, Hong Kong SAR, ChinaReviewed by:
Rasu Muruganantham, Chung Yuan Christian University, TaiwanChuanyu Sun, University of Padua, Italy
Copyright © 2025 Armenta-Deu. This is an open-access article distributed under the terms of the Creative Commons Attribution License (CC BY). The use, distribution or reproduction in other forums is permitted, provided the original author(s) and the copyright owner(s) are credited and that the original publication in this journal is cited, in accordance with accepted academic practice. No use, distribution or reproduction is permitted which does not comply with these terms.
*Correspondence: Carlos Armenta-Deu, Y2FyZGV1QGZpcy51Y20uZXM=