 Hadis Ghaedrahmati1
 Saeed Talebi1
 Amirmohammad Moradi2Aref Eskandari3Parviz Parvin1
 Mohammadreza Aghaei4,5*
- 1Department of Physics and Energy Engineering, Amirkabir University of Technology (Tehran Polytechnic), Tehran, Iran
- 2Department of Electrical and Computer Engineering, Concordia University, Montreal, QC, Canada
- 3Department of Electrical Engineering, Iran University of Science and Technology, Tehran, Iran
- 4Department of Ocean Operations and Civil Engineering, Norwegian University of Science and Technology (NTNU), Ålesund, Norway
- 5Department of Sustainable Systems Engineering (INATECH), Albert Ludwigs University of Freiburg, Freiburg, Germany
Photovoltaic (PV) systems have seen significant global growth due to their economic and environmental benefits. However, the output of PV systems is subject to uncertainties arising from factors like unpredictable weather conditions. Given the considerable uncertainty in meteorological data, Geographic Information Systems (GIS) have emerged as effective tools for analyzing such data. This study presents a novel method based on satellite-based remote sensing and artificial intelligence techniques to assess the potential of PV power plants and predict energy generation in different locations. We utilize GIS and the Analytic Hierarchy Process (AHP) in ArcGIS software to evaluate suitable sites for PV systems. Satellite data from global sources is used to analyze PV energy production based on specific geographic coordinates. Several machine learning algorithms, including Random Forest (RF), Support Vector Regression (SVR), Decision Tree (DT), and XGBoost, are applied to predict PV energy production from meteorological variables. The evaluation, using various statistical metrics, shows that the XGBoost algorithm outperforms others, achieving up to 91% accuracy in predicting energy production from PV systems.
1 Introduction
Today, energy is one of the fundamental needs of human life and a necessity for the continuation of economic development, provisioning, and ensuring the welfare and comfort of human life. On the other hand, one-third of the world’s consumed energy is still supplied by oil, to the extent that global energy consumption is projected to increase by 30 percent by the year 2040 (Beard, 2016). The 2015 United Nations Climate Change Conference (COP21), now known as the Paris Agreement, became a turning point in the fight against global warming. The 196 countries that signed this document agreed to make efforts to limit global warming to approximately 1.5°C above pre-industrial levels, which means that greenhouse gas emissions from human activities should be reduced to zero. To achieve these goals, among many other actions, the agreement emphasizes the necessity of generating energy from renewable sources and incentivizing research on how to manage and integrate these variables into production systems (Antonanzas et al., 2016). In line with this, the United Nations Climate Change Conference, COP28, which recently took place in Dubai in November 2023, had one of its objectives to evaluate previous agreements aimed at controlling the increase in Earth’s temperature. On the other hand, the current average natural gas storage worldwide is 53 years, and the capacity of coal reserves worldwide is 15,980 billion tons, which could be extracted for approximately 200 years (). For many years, most industries worldwide have re-lied on fossil fuels (coal, oil, and natural gas). Fossil fuels are non-renewable resources, meaning their formation requires thousands of years. Therefore, these fuels cannot sustain all human needs indefinitely and will eventually be depleted. Hence, it is im-perative to find suitable alternatives to these fuels. The two major challenges of fossil fuels, namely, their non-renewable nature and the environmental pollution resulting from their consumption (Broesamle et al., 2001), have led to global attention being focused on the use of renewable energy (Kahraman and Kaya, 2010). In this regard, solar energy has emerged as one of the safest, most effective, and economically viable energy sources, with the potential to become the primary energy source in the near future (Dincer, 2000). The United Nations Sustainable Development Goals (SDGs) emphasize global access to clean energy (SDG-7) and action to combat climate change (SDG-13). Therefore, they provide strong motivation for enhancing international cooperation in harnessing renewable energy resources (Nations, 2015). Apart from the significant greenhouse gas emissions, heat-based energy production systems relying on fossil fuels face other limitations in terms of transmission and distribution (Rathore et al., 2019). Several developing countries still have very low electricity coverage and distribution. For instance, about 630 million people in Africa and approximately 244 million people in India lack access to electricity (Bertheau et al., 2017). In vast countries with underdeveloped interior regions, extending the thermal electricity grid to remote areas is practically challenging. On the other hand, solar energy can be generated through the installation of decentralized small solar panels on rooftops for household and community use (Rathore et al., 2019). The abundance of sunny days (around 300 days per year) in most tropical countries in Africa and Asia provides another incentive for harnessing the potential of solar energy (Muneer et al., 2005). Therefore, solar energy has the potential to address several concerns of the global community in their efforts to create a clean and economical energy source to meet the increasing energy demand (Obama, 1979). However, before investing on a large scale in photo-voltaic solar energy development systems, policymakers should assess the sensitivity of solar energy potential considering climate change (Feron et al., 2020), which is a major concern. The amount of solar radiation, affected by absorption and scattering through clouds and aerosol concentration, is a direct measure of photovoltaic potential (Li et al., 2017). Factors like precipitation, air temperature, and wind speed also affect the potential of photo-voltaic systems (Adeh et al., 2019). All these weather factors are subject to fluctuations with changes in weather and extreme climates, such as hot and cloudy days, and so on. Therefore, identifying the variables affecting solar energy and evaluating suitable geographical locations to achieve the desired potential is crucial. The amount of solar energy received varies in different locations based on differences in geographical latitude, altitude, weather phenomena, and so forth. Thus, to obtain information on radiation and other influential meteorological variables, various meteorological stations need to be established for the desired location. Due to the limited distribution of weather stations, determining these variables at all locations is always challenging and may not have an acceptable level of accuracy. The use of remote sensing data in extracting climatic in-formation is an area that has recently gained attention among researchers. Data obtained from satellite images, considering their spatial coverage at different geographic scales, addresses the lack of spatial information and accuracy in estimating weather data. Satellite images have the advantage of covering extensive and wide areas where spatial changes in phenomena can be examined. Due to the dependence of PV energy output on accurate and extensive weather data, in this study, weather data obtained from satellite images is used for evaluating optimal geographical locations as well as assessing and predicting photovoltaic energy production worldwide.
The main achievements, including contributions to the field can be summarized as follows.
1- Optimal Location Selection: The best locations for installing PV systems were determined based on the influence of factors affecting output power, using meteorological data obtained from satellite images and applying MCDM methods.
2- Power Output Prediction: The output power of PV systems is predicted using the most effective machine learning algorithms.
3- Algorithm Evaluation: After evaluating the machine learning algorithms, the most accurate algorithm was identified for predicting the output of PV systems.
The rest of this study is summarized as follows:
Section 2 reviews related previous research. Section 3, which covers data and methodology, describes the data collection methods, analyzes the data, and examines the impact and relationship of each data point with the problem’s output, presenting the results in various charts. After thoroughly analyzing the data, the methodology section details the site selection process using GIS and MCDM approaches. Addition-ally, machine learning algorithms have been introduced for predicting the output power of PV systems. The final part of Section 3 is dedicated to introducing the study areas considered in this research. Section 4 presents the results of the site selection and prediction for each algorithm in tables and charts. Finally, Section 5 provides a summary and introduces the optimal algorithm. Figure 1 shows the framework of this research.
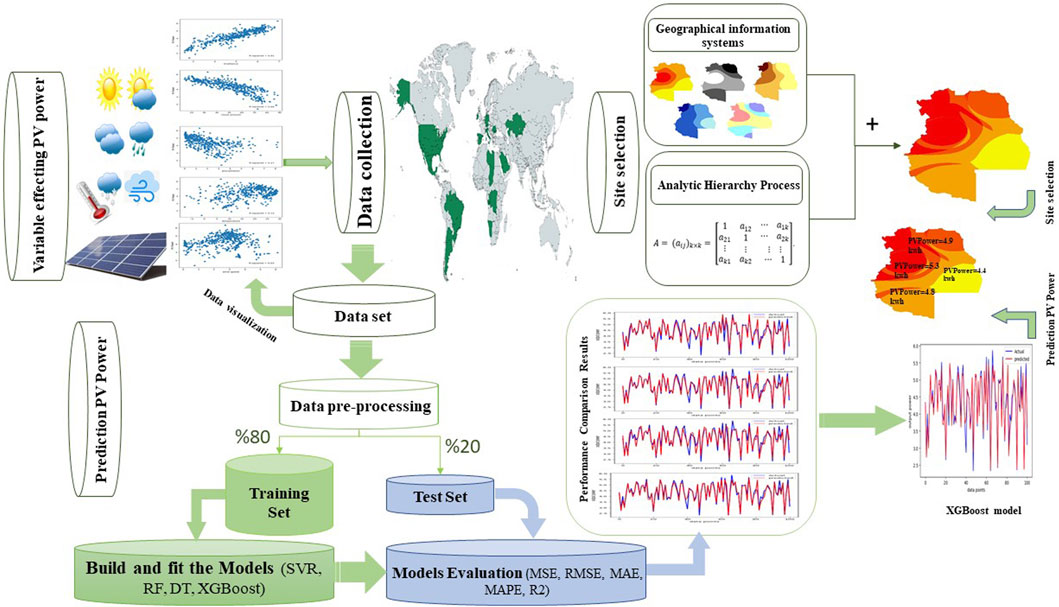
Figure 1. The research framework.
2 Related work
The first step in developing solar energy is to identify regions where solar energy is sufficient and other necessary conditions for power plant construction are met. Much research has been conducted on evaluating suitable locations for photovoltaic system deployment through examining climatic variables. In China, a study by Xiao et al. (2013) focused on selecting optimal locations for photovoltaic power plants in de-sert areas. Western China, with its Gobi desert and grasslands, is among the most vulnerable environmental regions due to desertification, dust storms, high temperatures, and strong winds. These environmental factors significantly impact the performance of photovoltaic power plants. This study analyzes the influential factors in selecting and establishing desert photovoltaic power plants, successfully demonstrating the optimal location through the integration of the AHP and GIS methods, considering variables such as solar radiation, air temperature, dust storms, sandstorms, proximity to highways, and others (Xiao et al., 2013). Doljack and Stanovitch (2017) demonstrated, by employing the integration of GIS and the MCDM approach, the selection of optimal locations for developing photovoltaic power plants in Serbia, focusing on climatic criteria (solar radiation, mean air temperature, relative humidity, sunshine hours without clouds). Utilizing the AHP method, their study showed that the northern region possesses the highest potential for photovoltaic project development (Doljak and Stanojević, 2017). Achayi and Atak (2018) selected the best locations for developing photovoltaic systems in Turkey by comparing the geographical positions of the cities Konya, Karaman, Burdur, Antalya, Mersin, and Van, which have good solar radiation. They utilized a combined AHP and TOPSIS method to weigh layers of variables such as radiation, precipitation, cloudiness, etc. Ultimately, Mersin was chosen as the best region in terms of having suitable conditions for power plant construction (Akçay and Atak, 2018). Rovis et al. (2020) focused on research conducted in West Kalimantan Province on the island of Borneo in Indonesia. In this study, satellite data on the required climatic variables was collected from NASA’s website, averaged monthly over an 11-year period. Utilizing the AHP method for weighting and lay-er overlap in GIS, optimal locations were ultimately identified (Ruiz et al., 2020). Mian et al. (2023) combined various MCDM methods in a research study to leverage the strengths of each method over the weaknesses of others. Through this analysis, it was inferred that the most crucial factors in selecting locations for photovoltaic power plants are solar radiation and cloudiness. Furthermore, by analyzing a number of variables including topography, air temperature, dust, solar radiation, etc., it was concluded that among the cities under investigation, Tabuk is the optimal location for photovoltaic power plant construction due to its high Global Horizontal Irradiance (GHI) value (Mian et al., 2023).
In recent years, PV technology has rapidly advanced and is currently one of the most promising technologies for solar energy generation. The increasing efficiency and cost-effectiveness of photovoltaic panels has led to a rapid growth in installed capacity worldwide. To enhance the efficiency and optimal performance of PV systems in terms of technical, economic, and environmental aspects, there is a need for predicting the performance of PV systems. According to research conducted in this area, methods for predicting solar energy can be divided into two groups: indirect and direct.
Indirect methods first predict solar radiation and then convert this prediction into energy production based on the characteristics of photovoltaic power plants and other relevant knowledge. Technologies such as Numerical Weather Prediction (NWP) and satellite image processing are used together to analyze complex meteorological data such as cloud cover movement and changes in solar angle to predict solar radiation and ultimately energy production (Miller et al., 2018). The accuracy of indirect models largely de-pends on the accuracy of individual components and the availability of ancillary in-formation. Ancillary information complicates the process and heavily relies on do-main-specific engineering knowledge, limiting the application of indirect methods.
In contrast, direct methods predict the energy production of PV systems directly without the need for initial solar radiation prediction. The primary data source is past PV energy production data, readily available, with additional data sources including past weather data, which is less complex and more easily accessible compared to the information required by indirect methods for PV plant location. In fact, additional da-ta sources can be used to improve accuracy compared to using past PV energy data alone, but they are no longer necessary. This allows for a wider application of direct approaches compared to indirect ones. Direct approaches can be further divided into two groups: statistical and machine learning (ML) methods. Below are examples of re-search conducted in this area.
Li et al. (2014) proposes an extended model, ARMAX, to improve the ARIMA model for predicting energy production from PV. The ARMAX model incorporates exogenous inputs to facilitate the prediction of energy production. The exogenous inputs of the model include variables such as average temperature, precipitation, radiation, and humidity. It was ultimately demonstrated that the ARMAX model significantly improves the accuracy of energy production prediction compared to the ARIMA mod-el (Li et al., 2014). Chiteka and Enweremadu (Chiteka and Enweremadu, 2016) developed an integrated artificial neural net-work (ANN) model to predict global horizontal irradiance (GHI) for key locations in Zimbabwe, covering major cities and towns. The prediction of GHI was performed us-ing geographical data of latitude and longitude, as well as climatic data including humidity, pressure, transparency index, and mean air temperature. This ANN model with seven inputs achieved R^2 = %99, MAE = %17, and MAPE = %26, indicating good predictive performance of the model. Antonanzas et al. (Antonanzas et al., 2017) conducted a study com-paring two widely used statistical methods, Support Vector Regression (SVR) and Random Forest (RF), as well as two machine learning methods, Deep Neural Network (DNN) and Extreme Gradient Boosting (XGB). In this regard, they used influential factors affecting PV energy generation such as radiation, temperature, relative humidity, and wind speed as input data for model training. The best results were achieved with the SVR method, with a performance evaluation metric of normalized root mean square error (nRMSE) showing a value of 22.49% for this algorithm. Fan et al. (Fan et al., 2018) focused on predicting solar radiation in a region of China characterized by warm and humid weather. They utilized climate data such as temperature, precipitation, and radiation from the years 1966–2000, employing machine learning (ML) methods for prediction. They suggested the use of Support Vector Machine (SVM) and XGBoost algorithms. To evaluate the performance of the proposed ML models, they compared them with four empirical models, and the evaluation results using RMSE showed that SVM and XGBoost models outperformed the selected empirical models. Considering prediction accuracy, model stability, and computational efficiency, the XGBoost model demonstrated excellent performance in humid subtropical weather conditions and is highly recommended. Alskaf and colleagues (AlSkaif et al., 2020) presented a coherent approach to analyzing various climate variables, including temperature, dew point temperature, relative humidity, air pressure, wind speed, cloud cover, and precipitation, to evaluate their impact on energy production from PV systems. In this study, 3 years of input climate data and PV energy production data were utilized for two case studies, one in the United States and the other in the Netherlands. Initially, correlation and mutual dependency analysis among climate variables were covered. Then, using machine learning-based regression methods such as Linear Regression (LR), Random Forest (RF), and Support Vector Regression (SVR), the initial climate variables were evaluated for estimating PV energy production. Finally, the study concludes that the most important common influential climate variables are radiation, temperature, humidity, precipitation, and cloud cover. Banik and Biswas (Banik and Biswas, 2023) presented an efficient model for predicting solar radiation and PV energy production, specifically designed for the city of Agartala in Tripura, India. In this study, they analyzed RF, XGBoost, CatBoost, and Light GBM models using 10 years of solar data and other relevant climatic variables from the National Aeronautics and Space Administration (NASA). The developed models were utilized for long-term predictions and assessing the PV energy production potential in Agartala, the capital of Tripura, India. The results demonstrated the effectiveness of RF and CatBoost with an accuracy score of 86%. Furthermore, in terms of RMSE and MAE, the superior performance of the model was indicated by lower values, confirming the suitability and effectiveness of the proposed model for long-term pre-dictions of solar radiation and PV energy.
Table 1 shows a summary of related work that has been done before.
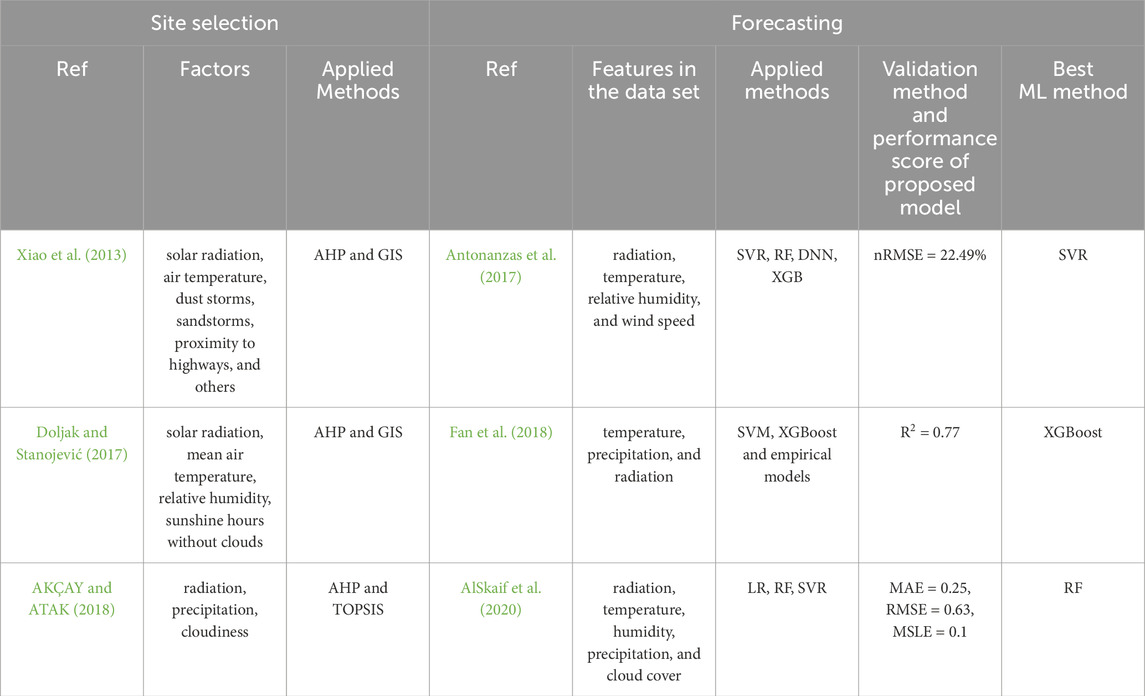
Table 1. Review of related works.
3 Materials and methods
3.1 Data collection
High-quality energy systems information is a critical input for energy systems re-search, modeling, and decision-making. Remote sensing data (RSD) (e.g., satellite images and aerial photographs) have emerged as a rich source of information on potential energy systems (National Research Council, 2001). which may help close the energy information gap. Remote sensing data is increasingly cheap, abundant, and accessible in any geographic location. Re-mote sensing technology deals with measuring and determining the properties of objects from a distance. In reference (nasa, 2023), efforts were made to enhance existing renewable energy datasets and develop new ones through the utilization of advanced satellite systems. The inception of the POWER project in 2003 by NASA facilitated the acquisition of this vital information to access these datasets. Various satellites are employed for this purpose, including CERES, MERRA-2, and MODIS. Rodriguez and Braga (2021) conducted a study to assess the data from source (nasa, 2023), which includes temperature, radiation, relative humidity, and wind speed, comparing it with data collected from 14 meteorological stations across the entire Alentejo region in southern Portugal, characterized by a warm Mediterranean summer climate. The findings revealed a significant concordance between the data from source (nasa, 2023) and the observed data (Rodrigues and Braga, 2021). Additionally, the Global Solar Atlas (GSA), discussed in (Globalsolaratlas, 2023), serves as an online, map-based platform offering comprehensive information on solar resources and PV energy potential worldwide. This source has repeatedly been acknowledged as the premier database (Copper and Bruce, 2018). Photovoltaic energy production mainly depends on the amount of solar radiation. In addition, other climate variables, such as ambient temperature, cloud cover, wind speed and precipitation are considered as potential variables for estimating photovoltaic production energy. Meteorological variables change with location and weather conditions. Therefore, their effects on photovoltaic production energy are different in different geographical locations. Despite this fact, the performance of a forecasting model depends on the correlation between the input variables and the output values of the model. Correlation between meteorological variables, such as ambient temperature, solar radiation, wind speed, cloudiness, precipitation and production energy should be taken into account, for this purpose, the correlation of meteorological variables with production energy has been investigated in Figures 1–5. To analyze the correlation between meteorological factors and PV output power, the correlation coefficient (R-squared) is utilized. Specifically, the critical R-squared standard is a very strong correlation between 0.8 and 1.0, a very weak correlation, or no correlation of 0. The higher the number of variables used as input vectors, the high-er the accuracy of the prediction model, but the higher the complexity and computational cost of the model. To achieve high accuracy and minimum computational cost, the optimal number of input vectors should be found based on correlation. Components that are considered as outliers lead to high prediction errors. In addition, the loss of input data points caused by measurement errors or other errors also increases the prediction errors of the model. Therefore, there is a need to pre-process the input data. The problems of inappropriate model training and computational costs can be significantly reduced by pre-processing the input data, and the accuracy of the prediction models can be improved.
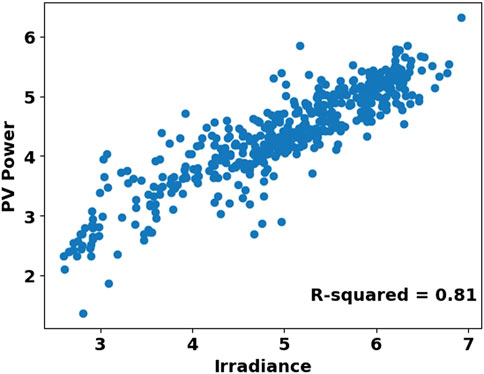
Figure 2. Scatter diagram of PV power and global horizontal irradiance.
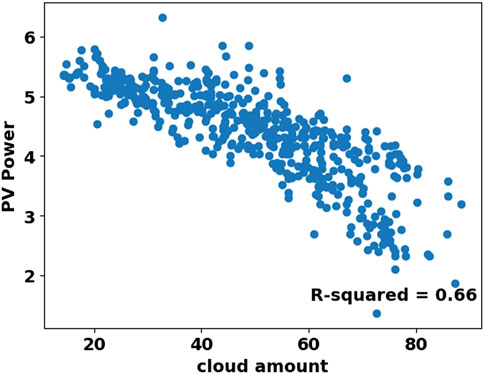
Figure 3. Scatter diagram of PV power and cloud amount.
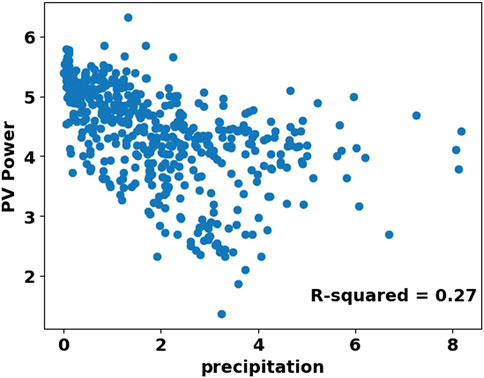
Figure 4. Scatter diagram of PV power and precipitation.
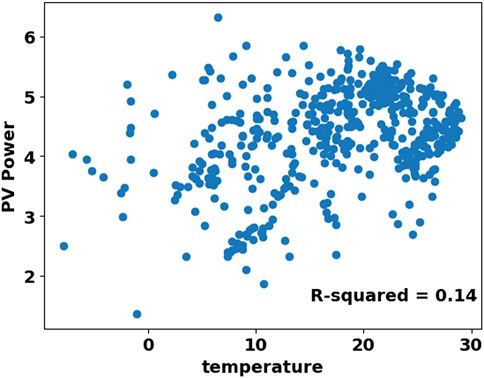
Figure 5. Scatter diagram of PV power and temperature.
3.1.1 Global horizontal irradiance (GHI)
GHI stands for Global Horizontal Radiance, which indicates the total amount of shortwave radiation received from above by a horizontal surface (parallel) to the ground. GHI is the most important component for calculating photovoltaic energy efficiency which can be measured in space or at the Earth’s surface after passing through the atmosphere. The amount of solar radiation depends on the distance from the sun and the solar cycle. The most important weather factor in relation to the use of solar energy is the amount of solar radiation, the amount of which varies in different regions according to the latitude, unevenness, distance and proximity to the sea and other factors. Figure 2 shows the scatter plot of PV power and global horizontal radiation, which shows that PV power is strongly correlated with global horizontal radiation.
3.1.2 Cloud amount
Cloudiness at different levels has a very close relationship with the amount of radiant energy received. So that the clearer the surface of the sky, the more this energy is, and the more cloudy it is, this situation becomes reversed. Clouds reflect an average of 21% of the sun’s short-wave energy. Figure 3 shows scatter diagram of PV power and cloud amount which shows PV power is strongly correlated with cloud amount. Therefore, cloud amount is used as the second input factor in the prediction method.
3.1.3 Precipitation
Precipitation can be considered the most important factor that is directly involved in the climate cycle. Precipitation refers to all atmospheric precipitation that enters the earth’s surface. Therefore, areas with high precipitation throughout the year on the one hand indicate high humidity in the area, which the most important factor in absorbing short-wave radiation, and on the other hand, it indicates the presence of high sus-pended particles in the atmosphere of that place, which is also plays a role in absorption and reflection of short-wave radiation, and both of these factors indicate the high number of cloudy days in the region. Figure 4 shows scatter diagram of precipitation and PV output, which shows PV output is moderately correlated with precipitation. Therefore, precipitation is used as the third input factor.
3.1.4 Temperature
One of the components of photovoltaic systems is an energy converter. In order for this system to provide the required power and energy, it must have a suitable efficiency, the efficiency of the converter depends on its temperature, which is influenced by the ambient temperature. The energy produced by photovoltaic systems has an in-verse relationship with the ambient temperature. Figure 5 shows scatter diagram of PV power and temperature, which shows PV power is weakly correlated with temperature. Therefore, temperature is used as the fourth input variable.
3.1.5 Wind speed
Another variable that has a positive correlation with the output of photovoltaic systems is wind speed, in the sense that the systems perform better with increasing wind speed. Figure 6 shows scatter diagram of PV power and wind speed, which shows PV power is weak correlated with wind speed. Therefore, wind speed is used as the final input parameter.

Figure 6. Scatter diagram of PV power and wind speed.
It can be seen that the meteorological variables of global horizontal radiation, number of clouds, precipitation, temperature and wind speed have a strong to weak effect on the performance of the PV power plant. Therefore, these variables are select-ed as the main meteorological input parameters affecting PV power generation.
3.2 Methods
To achieve the research goals of evaluating criteria for locating photovoltaic systems and forecasting PV energy production, a comprehensive assessment of PV production energy criteria was conducted, including the weighting and ranking of indicators. In the next step, the data is prepared in the GIS environment. In this step, the data is transferred to the GIS environment and converted into raster format. Weighting of criteria was done using AHP method. At the end, the analysis of the pre-pared data was done in order to achieve the main goal of this study, which is to pro-duce a classified map to identify the desired areas from the point of view of high PV potential. Then, after integrating all the data from different regions, SVR, RF, DT and XGBoost algorithms were used for predicting photovoltaic energy production.
3.2.1 Integration of GIS and MCDM
The development of new technologies and methods for spatial data gathering has resulted in large amounts of data that are difficult to process, store, and man-age. Therefore, as a result of the need for cost-effective, efficient, and accurate spatial data management methods, GIS was developed (Sawadogo et al., 2020). The use of Geographic Information Systems (GIS) facilitates quicker and simpler manipulation of spatial data. However, their most notable advantage lies in their capability to conduct spatial, at-tribute, and multi-criteria analyses. The effective utilization of solar energy and the construction of power plants relies on various spatial and other parameters. Therefore, thorough research into these parameters is essential before selecting the ideal construction site. Therefore, there is a need for the creation of spatial planning based on geographic information systems that will take into account all the essential parameters for the solar power plant construction. Numerous authors use GIS tools to define solar energy potential but at the same time use different parameters and their values. In the context of multi-criteria decision making (MCDM), the decision-making problem is most often seen as a problem in which the decision maker must decide on one of the alternatives that are known or need to be generated, taking into account all relevant factors or criteria, Among the MCDM can be mentioned, TOPSIS, AHP, and FUZZY methods.
Kumar et al. (Adeh et al., 2019) presented an analysis of the most frequently used multi-criteria decision-making methods and their application, and concluded that the weighted sum model and the Analytic Hierarchy Process (AHP) are most commonly used for energy planning. Ramanathan and Ganesh (UNEP. Information Unit for Conventions) and Ishizaka and Labib (National Research Council, 2001) stated the benefits of AHP for energy planning, such as simple application, flexibility, intuition, and ability to qualitatively and quantitatively address the criteria. Since this research encompasses a number of parameters all used for determination of optimal solar power plant locations, the AHP method has been applied.
In the AHP method, after selecting the effective criteria in the potential of PV power generation, the pairwise comparison matrix is used to find the priorities using the relative importance scale as described in Table 2 (Xiao et al., 2013).
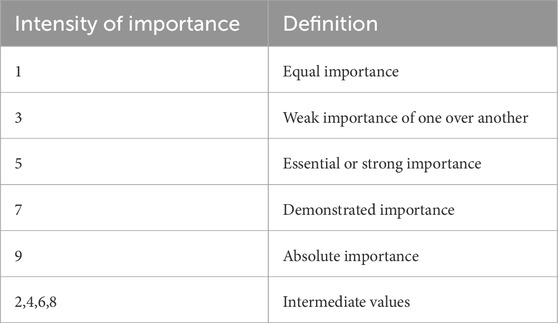
Table 2. Scale of relative importance.
After that Develop pairwise comparison matrices. In the pairwise comparison matrix, the importance of the criteria and sub-criteria is scored by experts. The k-by-k matrix includes k rows and k columns. The aij element denotes the importance of the row i index compared to the column j index (Equation 1).
Consistency in factor comparisons is measured. AHP is consistent in itself. However, the accuracy of the results depends on the consistency in the decision-maker’s comparison between the factors. In order to measure the consistency in these comparisons, CR value which is called accuracy rate is calculated, and the consistency of the weight matrix can be tested. Therefore, the consistency of the model is checked by comparisons between factors. The calculation of the CR value is based on comparing the number of factors with a coefficient called the base value (λ). When calculating the λ value, the D column vector is obtained from the comparison matrix A and the weight matrix of W. The basis value (E) for each evaluation factor is obtained from the section of the mutual elements of the weight column D and the weight matrix of W. (Equation 2). The arithmetic mean of these values gives the basic value (λ) for comparison (Equation 3).
After calculating the basic value λ, the consistency indicator (CI) is calculated with Equation 4.
The value of “n” in the equations is the number of factors. Finally, the CI value is divided by the standard correction value which is called the random indicator (RI), shown in Table 4, and the CR value that is called consistency ratio is obtained (Equation 6). The RI value to be used in a 5-factor comparison will be 1.12. For the comparisons made by the decision-maker to be consistent, the calculated CR value with Equation 5 must be less than 0.10. If the CR value is higher than 0.10, there is either a calculation error in AHP or it is inconsistent in the decisionmaker comparison.
To determine the relative importance of the selected criteria in evaluating photovoltaic (PV) energy potential, a pairwise comparison matrix was constructed based on the Analytic Hierarchy Process (AHP) methodology, using the Saaty scale of relative importance. Expert judgment was employed to score the importance of each criterion relative to the others. The resulting pairwise comparison matrix is presented in Table 3.
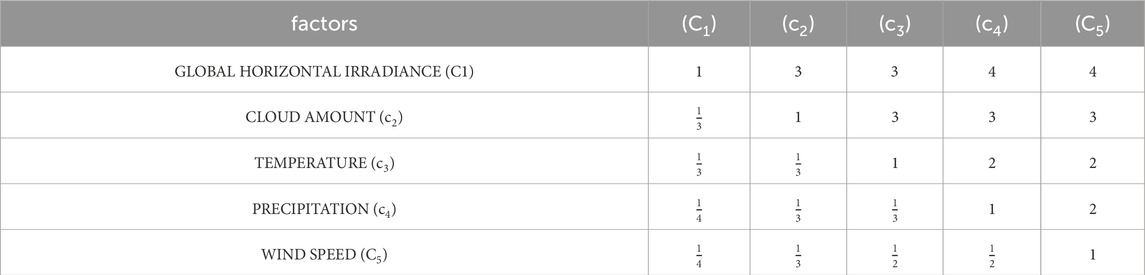
Table 3. Binary comparisons of factors.
Subsequently, the matrix was normalized by dividing each element by the sum of its respective column. The priority vector was then derived by averaging the values in each row of the normalized matrix. These priority values represent the relative weights of the criteria. The final weights calculated in this study are presented in Table 4.

Table 4. The obtained weights for each variable in the AHP method.
To evaluate the internal consistency of the judgments, the maximum eigenvalue (λ), the Consistency Index (CI), and the Consistency Ratio (CR) were calculated. In this study, λ was found to be 5.21, resulting in a CI of 0.05. Given the Random Index (RI) of 1.12 for a 5 × 5 matrix, the Consistency Ratio (CR) was calculated as 0.048, which is less than the acceptable threshold of 0.10. Therefore, the pairwise comparisons can be considered consistent and reliable.
In order to perform any analysis in geographic systems, it is necessary to introduce information into the system in the form of information layers, so first, to implement the methods mentioned in this research, the effective variables become information layers. In order to use the maps and their final integration in the GIS environment, points such as entering the information layers with the appropriate format and model into the GIS environment, referencing all the layers with each other must be observed. All information was converted into raster layers and the coordinate system of all layers was adapted to the coordinate system of the studied area. To create a layer, the method (IDW) was used to interpolate information in the area. Finally, the desired layer was classified into four classes based on the values, the above steps were repeated for each variable, resulting in the acquisition of five layers for the variables of temperature, radiation, precipitation, wind speed, and cloudiness in each region. In Figure 7, the classified layers of each variable for the Mendoza region, which is one of the regions of Argentina, are provided as an example. The classification of radiation and wind speed layers, which have a positive effect on photovoltaic energy, is such that higher values for these variables are classified as very good, while lower values are classified as weak. On the other hand, for cloud layers, temperature, and precipitation, which have a negative effect on photovoltaic energy, higher values are classified as weak, and lower values as very good. Now, by using the weights obtained in the AHP method, we cover the classified layers. Finally, Figure 8 illustrates the suitable locations in terms of favorable conditions for photovoltaic potential.
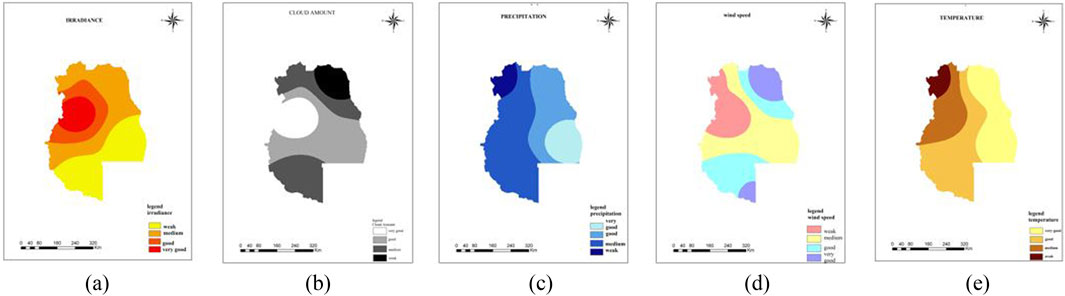
Figure 7. Classified information layers in GIS environment for Mendoza region, (a): Classified information layers of irradiance, (b): Classified information layers of cloud amount, (c): Classified information layers of precipitation, (d): Classified information layers of wind speed, (e): Classified information layers of temperature.
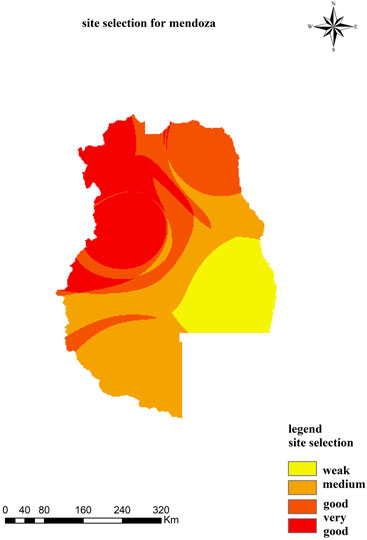
Figure 8. Site selection for Mendoza.
3.2.2 Power generation forecasting for solar PV system
After determining the optimal region, we employ ML-based methods such as SVR, RF, DT, and XGBoost to predict the amount of energy obtained in that area. The following section will explain these methods.
3.2.2.1 Data integration and pre-processing
ML methods are highly dependent on data. That’s why the data collected from 500 selected points from all over the world, which includes the variables of radiation, temperature, precipitation, cloudiness, wind speed with specific longitude and latitude, are integrated. and prepared as a file for the next steps. Due to the varying ranges of the variables relative to each other, they need to being equalized as a pre-processing of the input data to produce forecasting models of photovoltaic production energy. For this purpose, the normalization operation It has been used according to Equation 6, which is a common method in this field. This method usually reduces a wide range of input data values to a smaller range to reduce regression errors and improve accuracy. Using Equation 6, the data was limited to be between 0 and 1.
where
3.2.3 Choosing a forecasting method
According to the graphs drawn in the previous part (Figures 1–5) which show the type of relationship between the input variable and the output of the problem, it was found that the problem is of the regression type. Irradiance and cloudiness variables have the highest correlation with photovoltaic production energy. Other variables also had moderate correlation. Based on this and also based on the previous research in this field, SVR, RF, DT and XGBoost algorithms that can perform better to achieve the research goals have been selected.
3.2.4 Support vector regression (SVR)
This model is in the category of supervised learning methods, which was first introduced by Vapnik and Lerner in (1963) (Vapnik, 1999) and developed by Kurtz and Vapnik (1995) for use in classification problems. given. This model is based on the principle of structural risk minimization. This principle works by minimizing the upper limit of the expected risk. Therefore, the SVM model minimizes the errors in the input training data. Vapnik developed the SVM model to tackle classification tasks, but this model has recently been modified to solve regression problems, known as support vector regression (SVR). Photovoltaic energy forecasting is a common problem that can be implemented with SVR (Hu et al., 2014). The SVR algorithm works by mapping input data (non-linear) in a space with higher dimensions through non-linear mapping before performing linear regression in the new space. Assuming that we have a set of training data such as {(x1, y1),., (xk, yk)} in this set
where
In this relation, the cost function
where
3.2.5 Decision tree (DT)
A decision tree is a simple but powerful supervised learning method that uses a tree-like model of decisions and their possible consequences. They are used in both classification and regression problems. Unlike SVM, which has many dimensions and it is impossible to imagine how the hyperplane is built in the human brain, decision trees provide a very good visualization of the decision-making stages and the relative importance of features. Decision tree regression was developed based on the CART algorithm proposed by Berryman et al., in 1984 (Breiman et al., 2017). The two main components discussed in this method are node structure and node division. The node structure is such that each node stores attributes that define the tree structure and help to navigate the tree during prediction. Node Split finds the attribute and threshold values to split a node. CART calculates the cost function for different features and threshold values, then splits the node for the feature and threshold value that minimizes the cost function. In fact, the decision tree algorithm starts from the root node, which contains the complete data set of the problem. Using the feature selection algorithm (ASM), the best feature in the data set is selected. Then, by dividing the root node into subsets that contain appropriate and possible values for the best features, it produces a decision tree node with the best features, using the subsets created from the data set in the third step of this approach, new decision trees recursively are created This process continues until the nodes cannot be further classified and the final node is obtained as a leaf or terminal node. In this method, the cost function tries to find homogeneous branches or branches with groups of characteristics with similar results. The relation of cost function for regression problems is obtained as relation Equation 11 (Breiman et al., 2017).
3.2.6 Random forest (RF)
Random forest is an ensemble algorithm that uses an aggregated result of multiple decision trees to determine the outcome. The data is recursively split to classify the target data when given a set of predictor data. The size of the random forests can be optimised for the dataset which ranges from one leaf per tree to 50, and between 30 trees and 50 for each algorithm. Gini impurity (Equation 12) is used to decide whether to continue spilitting the data.
It can be defined as the deduction of squared probabilities of each class from one, where ‘Pi’ is the probability of an element being classified for in a certain class. Once the Gini impurity reaches the minimum value, it can be considered a ‘pure’ split, meaning it no longer must be split. This means that the tree cannot split the data to a better degree and the algorithm has finished training. The data splits and values of the target variables are remembered, and once new data is added, the target variables can be calculated by splitting the data like they did during training.
3.2.7 Extreme Gradient Boosting (XGBoost)
This algorithm is based on a decision tree that uses the reinforcement method and was proposed by Tianchi Chen in 2016 (Xiao et al., 2013). A simple model such as a decision tree can help train the model on our dataset. The act of “reinforcement” trains models one after the other. Boosting is a method to improve prediction accuracy by training a sequence of weak tree models, each of which compensates for the residuals of the previous tree model. Each new model is trained with the aim of correcting the errors caused by previous models. Models are added sequentially until no further progress is possible. The advantage of this iterative method is that the added models try to correct the mistakes made by other models. XGBoost algorithm has recently started to be applied in different fields, in the field of production energy prediction, we can refer to the source (Madrid and Antonio, 2021). The predicted value of the XGBoost regressor is calculated with the relation Equation 13 as follows (XGBoost Documentation).
In this relation,
Finally, each of these algorithms aims to provide strong prediction models with the least possible error. Each algorithm has objective and cost functions based on which they try to optimize predictions and increase accuracy.
3.2.7.1 Model training
In order to learn and train the models, the data set is divided into two parts, in such a way that 80% of the data for training and 20% of the data for evaluating the model are separated from each other. After separating the data, the model starts learning with the help of training data, finally the model is evaluated by test data.
3.2.7.2 Model evaluation
After training the model with the training data, which constituted 80% of the en-tire dataset, the performance of the models was evaluated using the test data, com-prising 20% of the total data. Evaluation criteria include MSE (Mellit et al., 2020), RMSE, nRMSE (Yang et al., 2015), MAE (Pedro and Coimbra, 2012), MAPE, and R2 (Rana et al., 2015), as expressed in Equations 14–19 respectively, were employed for assessment.
In these equations,
3.2.8 Case study
In this section, the proposed integrated model is used to optimize the location of solar power plants and predict the energy generated from PV systems in various regions of selected countries based on latitude and considering the specific climate type of each region in different parts of the world. For this purpose, regions in different countries were selected, such as Utah from the United States, Coahuila from Mexico, Mendoza from Argentina, Mato Grosso from Brazil, Kunene from Namibia, Katanga from Congo, Awbari from Libya, Tabuk from Saudi Arabia, Karaganda from Kazakh-stan and Berlin from Germany, as shown in Figure 9, which displays a map of these areas along with the respective flags and names of the countries.
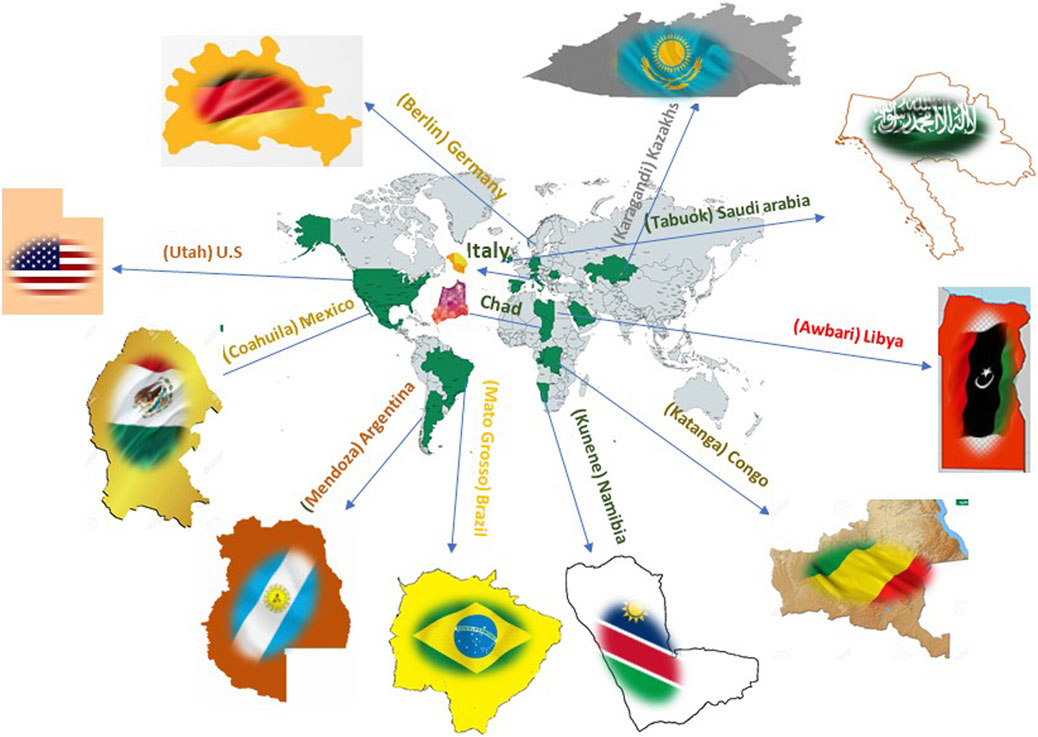
Figure 9. The research Case study.
4 Results and discussion
The purpose of this study was to provide guidelines for finding suitable locations for installing PV power plants and predicting the energy output from that system in that region around the world. Therefore, by collecting the data described in the previous sections, several areas have been examined in order to locate and predict the energy produced by the PV system, the results of which are given below.
The world has a different climate in each region, the factors affecting the world’s climate in addition to latitude, factors such as the angle of the sun, distance and proximity to the oceans and seas and ocean and sea currents, height above the earth’s surface, air pressure and wind flow affect the climate of a region. Among the climatic variables that influence the evaluation of the potential of photovoltaic systems in a region are the amount of radiation depending on the latitude, temperature, precipitation, cloudiness and wind speed, which are dependent on the distance and proximity to the oceans and seas and oceanic and marine currents. In this section, an analysis of the climatic conditions of the world based on the climatic desirability for the purpose of photovoltaic energy that may be obtained in it with a certain color spectrum (from blue color: unfavorable to red color: favorable) has been prepared in ArcGIS software, which is introduced in Figure 10 they become Areas close to the Arctic region, including Scotland and the parts of Russia that were studied, are unfavorable for PV energy potential. While areas close to the southern temperate zone such as Namibia have favorable conditions in terms of photovoltaic energy potential.
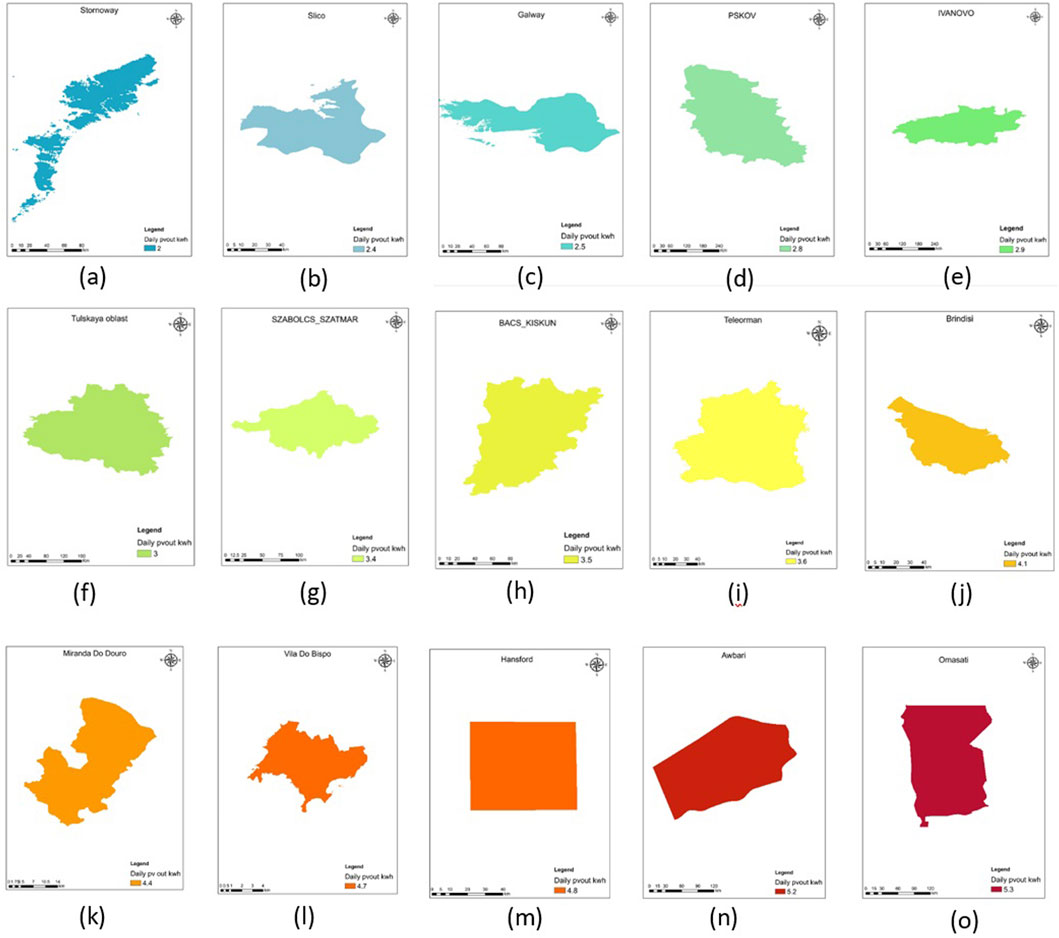
Figure 10. Estimated amount of photovoltaic energy in: (a): Stornoway from Scotland, (b): Sligo from Ireland, (c): Galway from Ireland, (d): Pskov from Russia, (e): Ivanov from Russia, (f): Tula from Russia, (g): Nyiregyhaza from Hungary, (h): Bacs kisk, (i): Teleorman, (j): Brindisi, (k): Miranda Do Douro, (l): Vila Do Bispo, (m): Hansford, (n): Awbari, (o): Omasati.
4.1 Site selection
In order to determine the optimal location for the construction of a photovoltaic power plant according to the instructions that are fully explained in Section 3.2.1 and mentioned as a step-by-step example for the Mendoza region of Argentina, the layers of each variable were prepared for each region and then the layers are superimposed with the mentioned method, the final map is obtained for the desired area and the degree of desirability of the areas by several classes with specific color spectrum that were introduced in the previous section, which is the amount of energy produced by PV that can be used in that area earned it shows Figure 11 shows the site selection results of different regions.
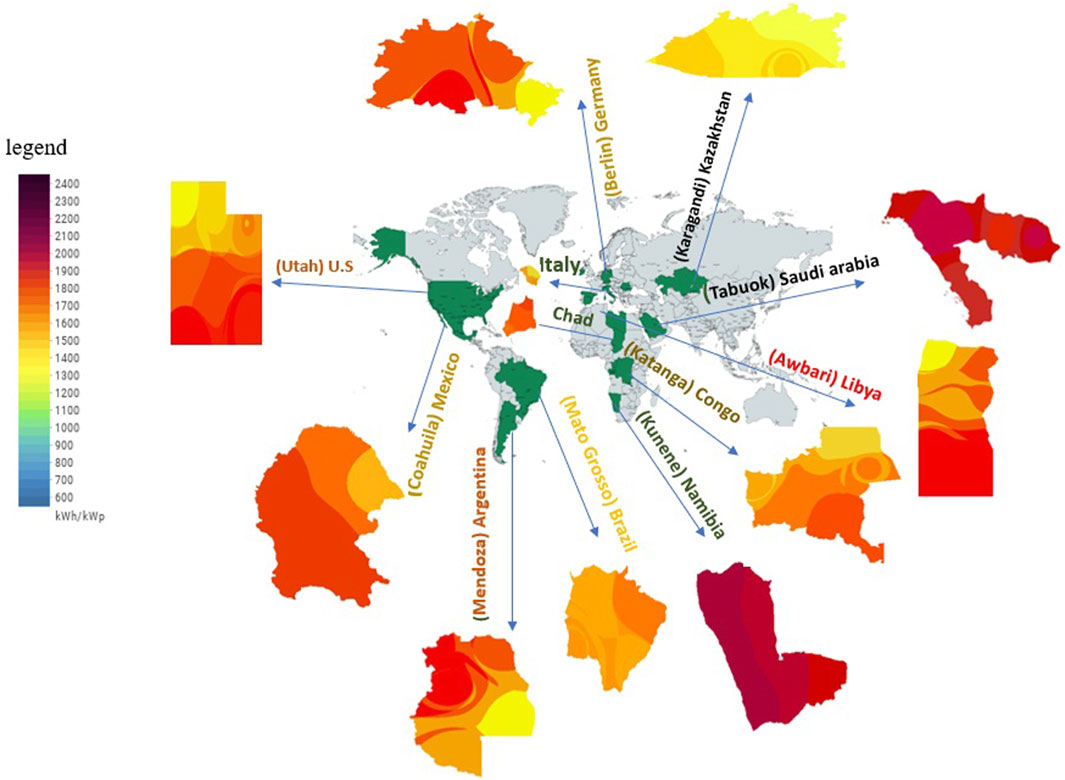
Figure 11. Site selection results.
4.2 PV power prediction
After determining the optimal area from the point of view of the usefulness of photovoltaic energy potential in that area, in order to predict the amount of photovol-taic energy using effective climate variables and geographical coordinates, SVR, RF, DT and XGBoost algorithms have been used. In order to check the performance of these algorithms, the results of the trained model have been evaluated. Table 5 shows a general comparison between the indicators introduced in the previous section as a tool for determining the accuracy of the model and evaluating the model. Figure 12 shows the results of each model graphically, which shows the prediction accuracy of each model. As it is clear from the table and figures, according to the statistical indicators used for evaluation, the XGBoost method performs better than other methods.
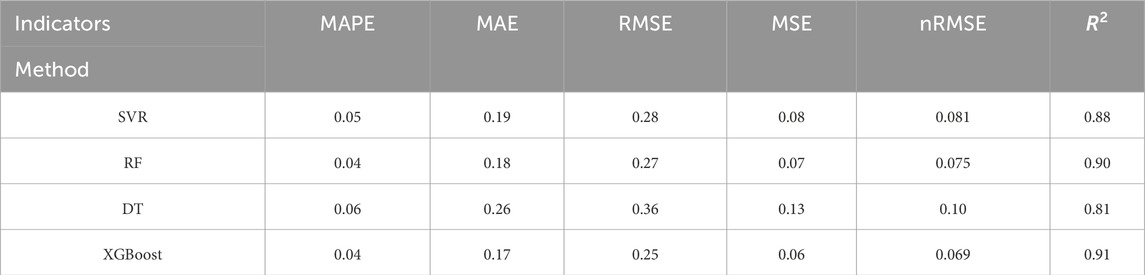
Table 5. Evaluation results of prediction models.
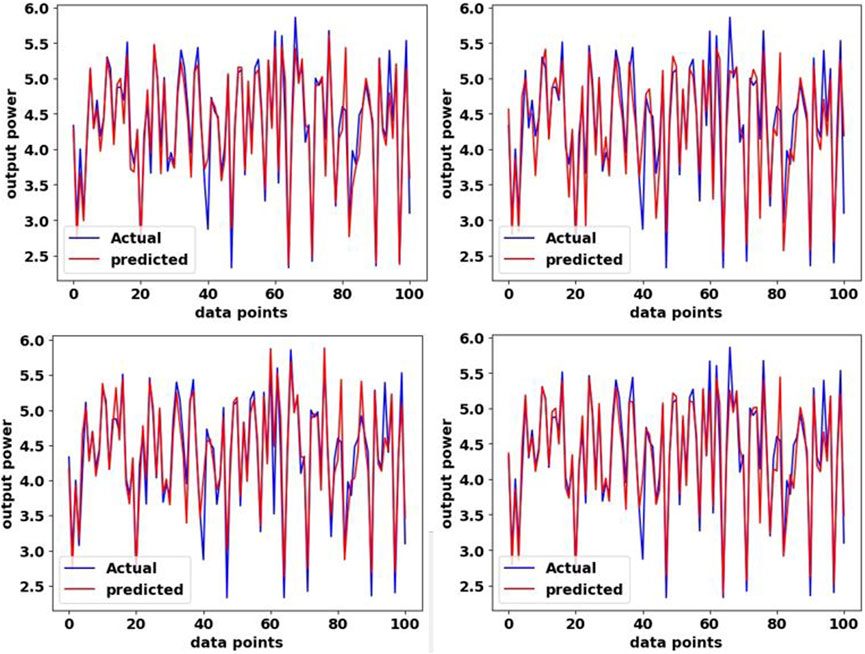
Figure 12. Comparison of actual values with predicted values in each model. (a) Actual data and predicted in SVR model. (b) Actual data and predicted in DT model. (c) Actual data and predicted in RF model. (d) Actual data and predicted in XGBoost model.
In Table 6, a comparison has been made between the best results of previous works and this research. In (Fan et al., 2018), using the variables temperature, humidity and radiation and using the XGBoost algorithm, the prediction was made. The result of the R2 statistical index for this study was R2 = 0.77, while in the current study, using the variables temperature, radiation, humidity, cloud amount and wind speed and using the same XGBoost algorithm, we achieved a better result of R2 = 0.91 and a better prediction was made.
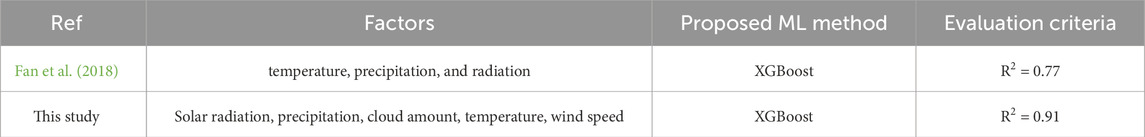
Table 6. Comparison of results between this research and previous work.
5 Conclusion
In recent years, the challenges of global warming, the crisis of limited non-renewable resources, and the issues surrounding energy supply and transportation worldwide, such as resource transmission incidents, disruptions in fossil fuel supply, and resource wastage along the transmission path, have led the world’s attention towards replacing renewable sources with fossil fuels. According to forecasts, solar energy, particularly photovoltaic solar energy, is increasingly gaining attention in the coming years. Understanding the spatial and temporal variability of solar energy as a long-term energy source is fundamental for energy policy decisions, optimal design of solar energy conversion systems, transmission network planning, integration of power generation systems, market operations, and reducing uncertainty in investments. Estimating the energy of photovoltaic systems requires multiple studies, and accurate information about the energy potential in a region is among the top priorities in energy application designs.
The use of satellite imagery and remote sensing technology as primary data sources has expanded in recent decades. Alongside this, Geographic Information Systems (GIS) have always been of interest to researchers for their unparalleled spatial and locational analysis capabilities. Machine learning (ML) methods have emerged as effective tools for prediction tasks with good performance and high accuracy, as also utilized in this study.
Despite previous research, a study addressing the evaluation of photovoltaic energy production in terms of optimal location determination and energy production prediction within the same region has not yet been conducted. Furthermore, the un-precedented breadth of data examined globally necessitated the collection of data for 500 specific geographic coordinates for this study. This research demonstrates that using GIS and the MCDM approach facilitates ease, precision, and speed in the evalua-tion process.
In this study, efforts were made to identify suitable areas and predict photovoltaic energy production by relying on climatic variables (solar irradiance, precipitation, temperature, cloud cover, wind speed) and geographical characteristics (latitude and longitude). It was evident in the location determination and prediction sections that higher radiation levels in an area correspond to greater photovoltaic energy production. Conversely, cloud cover, temperature, and precipitation negatively affect photo-voltaic energy output, indicating that areas with higher values of these variables are less desirable. Similarly, wind speed, like solar irradiance, positively impacts the amount of photovoltaic energy produced. Mapping was conducted to locate several potential areas, and the results were classified into multiple classes. These classes are represented by a color spectrum indicating specific energy production levels.
The repetition of this approach in various regions and the evaluation of results demonstrate its suitability for the research problem and objectives. Following the de-termination of the optimal region in terms of energy production desirability, predictive models utilizing influential climatic variables and machine learning-based methods were employed. These models were trained and evaluated using data collected from 500 different points worldwide, with the XGBoost model emerging as the best method for predicting photovoltaic energy with lower error rates and higher correlations, as presented in Table 3.
5.1 Limitations
Despite the promising results obtained from the integration of Geographic Information Systems (GIS), Analytic Hierarchy Process (AHP), and machine learning models in this study, there are some limitations to be considered.
1. Generalizability Issues: The data used in this study was collected from 500 specific geographic locations worldwide. While the results are promising, there may be challenges in generalizing these findings to other regions, especially those with significantly different climatic conditions or solar radiation levels. Further research could explore the applicability of this approach in other geographic regions to validate its broader applicability.
2. Temporal Limitations: The data used in this study was collected over a certain period. Seasonal variations and long-term changes in climatic conditions could affect the long-term performance of photovoltaic systems. Future studies could consider incorporating time-series data and exploring how the prediction models perform over different seasons or longer timeframes.
3. Data Quality and Availability: While satellite imagery and meteorological data are powerful tools, they can sometimes be affected by issues such as cloud cover, data resolution, and temporal gaps. These factors can introduce uncertainty into the analysis and should be considered when interpreting the results.
Data availability statement
The datasets presented in this article are not readily available because The data might be separately published. Requests to access the datasets should be directed to bW9oYW1tYWRyZXphLmFnaGFlaUBudG51Lm5v.
Author contributions
HG: Conceptualization, Data curation, Formal Analysis, Investigation, Methodology, Software, Visualization, Writing – original draft. ST: Funding acquisition, Investigation, Project administration, Resources, Supervision, Validation, Writing – review and editing. AM: Conceptualization, Investigation, Supervision, Validation, Writing – review and editing. AE: Investigation, Validation, Writing – review and editing. PP: Investigation, Project administration, Resources, Supervision, Writing – review and editing. MA: Conceptualization, Data curation, Formal Analysis, Funding acquisition, Investigation, Methodology, Project administration, Resources, Software, Supervision, Validation, Visualization, Writing – original draft, Writing – review and editing.
Funding
The author(s) declare that financial support was received for the research and/or publication of this article. This research did not receive any specific grants from funding agencies in the public, commercial, or not-for-profit sectors.
Conflict of interest
The authors declare that the research was conducted in the absence of any commercial or financial relationships that could be construed as a potential conflict of interest.
The author(s) declared that they were an editorial board member of Frontiers, at the time of submission. This had no impact on the peer review process and the final decision.
Generative AI statement
The author(s) declare that no Generative AI was used in the creation of this manuscript.
Publisher’s note
All claims expressed in this article are solely those of the authors and do not necessarily represent those of their affiliated organizations, or those of the publisher, the editors and the reviewers. Any product that may be evaluated in this article, or claim that may be made by its manufacturer, is not guaranteed or endorsed by the publisher.
Abbreviations
PV, Photovoltaics; AI, Artificial Intelligence; AHP, Analytic Hierarchy Process; COP28, UN Climate Change Conference; DT, Decision Tree; GIS, Geographic Information System; IDW, Inverse distance weighting; MAE, Mean Absolute Error; MAPE, Mean Absolute Percentage Error; MCDM, Multi-Criteria Decision-Making; MSE, Mean Squared Error; ML, Machine learning; nRMSE, Normalized Root Mean Squared Error; PV, Photovoltaic; RF, Random Forest; RSD, Remote Sensing Data; SDG, Sustainable Development Goals; SVR, Support Vector Regression; XGBoost, Extreme Gradient Boosting.
References
Adeh, E. H., Good, S. P., Calaf, M., and Higgins, C. W. (2019). Solar PV power potential is greatest over croplands. Sci. Rep. 9 (1), 11442. doi:10.1038/s41598-019-47803-3
Akçay, M., and Atak, M. (2018). Optimal site selection for a solar power plant in Turkey using a hybrid AHP-TOPSIS method. Celal Bayar Üniversitesi Fen Bilim. Derg. 14 (4), 413–420. doi:10.18466/cbayarfbe.432432
AlHakeem, D., Mandal, P., Haque, A. U., Yona, A., Senjyu, T., and Tseng, T.-L. (2015). “A new strategy to quantify uncertainties of wavelet-GRNN-PSO based solar PV power forecasts using bootstrap confidence intervals,” in 2015 IEEE power and energy society general meeting (IEEE), 1–5. doi:10.1109/PESGM.2015.7286233
AlSkaif, T., Dev, S., Visser, L., Hossari, M., and van Sark, W. (2020). A systematic analysis of meteorological variables for PV output power estimation. Renew. Energy 153, 12–22. doi:10.1016/j.renene.2020.01.150
Antonanzas, J., Osorio, N., Escobar, R., Urraca, R., Martinez-de-Pison, F. J., and Antonanzas-Torres, F. (2016). Review of photovoltaic power forecasting. Sol. Energy 136, 78–111. doi:10.1016/j.solener.2016.06.069
Antonanzas, J., Urraca, R., Pernía-Espinoza, A., Aldama, A., Fernández-Jiménez, L. A., and Martínez-de-Pisón, F. J. (2017). Single and blended models for day-ahead photovoltaic power forecasting. Cham: Springer, 427–434. doi:10.1007/978-3-319-59650-1_36
Banik, R., and Biswas, A. (2023). Improving solar PV prediction performance with RF-CatBoost ensemble: a robust and complementary approach. Renew. Energy Focus 46, 207–221. doi:10.1016/j.ref.2023.06.009
Beard, C. (2016). “An economic interpretation of the Constitution,” in The case against the Constitution.
Bertheau, P., Oyewo, A., Cader, C., Breyer, C., and Blechinger, P. (2017). Visualizing national electrification scenarios for sub-saharan african countries. Energies (Basel) 10 (11), 1899. doi:10.3390/en10111899
Breiman, L., Friedman, J., Olshen, R. A., and Stone, C. J. (1984). (New York: Classification and Regression Trees (1st ed.). Chapman and Hall/CRC). doi:10.1201/9781315139470
Broesamle, H., Mannstein, H., Schillings, C., and Trieb, F. (2001). Assessment of solar electricity potentials in North Africa based on satellite data and a geographic information system. Sol. Energy 70 (1), 1–12. doi:10.1016/S0038-092X(00)00126-2
Chiteka, K., and Enweremadu, C. C. (2016). Prediction of global horizontal solar irradiance in Zimbabwe using artificial neural networks. J. Clean. Prod. 135, 701–711. doi:10.1016/j.jclepro.2016.06.128
Copper, J. K., and Bruce, A. G. (2018). Comparison of annual global horizontal irradiation maps for Australia. Available online at: https://www.apvi.org.au/solar-research-conference/wp-content/uploads/2018/11/09_DI_Copper_J_2018_PAPER.
Dincer, I. (2000). Renewable energy and sustainable development: a crucial review. Renew. Sustain. Energy Rev. 4 (2), 157–175. doi:10.1016/S1364-0321(99)00011-8
Doljak, D., and Stanojević, G. (2017). Evaluation of natural conditions for site selection of ground-mounted photovoltaic power plants in Serbia. Energy 127, 291–300. doi:10.1016/j.energy.2017.03.140
Fan, J., Wang, X., Wu, L., Zhou, H., Zhang, F., Yu, X., et al. (2018). Comparison of Support Vector Machine and Extreme Gradient Boosting for predicting daily global solar radiation using temperature and precipitation in humid subtropical climates: a case study in China. Energy Convers. Manag. 164, 102–111. doi:10.1016/j.enconman.2018.02.087
Feron, S., Cordero, R. R., Damiani, A., and Jackson, R. B. (2020). Climate change extremes and photovoltaic power output. Nat. Sustain 4 (3), 270–276. doi:10.1038/s41893-020-00643-w
Globalsolaratlas (2023). Available online at: https://globalsolaratlas.info/map.
Hu, J., Gao, P., Yao, Y., and Xie, X. (2014). “Traffic flow forecasting with particle swarm optimization and support vector regression,” in 17th international IEEE conference on intelligent transportation systems (ITSC) (IEEE), 2267–2268. doi:10.1109/ITSC.2014.6958049
IRENA. RENEWABLE CAPACITY STATISTICS 2018[EB/OL] (2012). Available online at: http://www.irena.org/publications/2018/Mar/Renewable-Capacity-Statistics-2018 (accessed on 18 July 2018).
Kahraman, C., and Kaya, İ. (2010). A fuzzy multicriteria methodology for selection among energy alternatives. Expert Syst. Appl. 37 (9), 6270–6281. doi:10.1016/j.eswa.2010.02.095
Li, X., Wagner, F., Peng, W., Yang, J., and Mauzerall, D. L. (2017). Reduction of solar photovoltaic resources due to air pollution in China. Proc. Natl. Acad. Sci. 114 (45), 11867–11872. doi:10.1073/pnas.1711462114
Li, Y., Su, Y., and Shu, L. (2014). An ARMAX model for forecasting the power output of a grid connected photovoltaic system. Renew. Energy 66, 78–89. doi:10.1016/j.renene.2013.11.067
Madrid, E. A., and Antonio, N. (2021). Short-term electricity load forecasting with machine learning. Information 12, 50. doi:10.3390/info12020050
Mellit, A., Massi Pavan, A., Ogliari, E., Leva, S., and Lughi, V. (2020). Advanced methods for photovoltaic output power forecasting: a review. Appl. Sci. 10 (2), 487. doi:10.3390/app10020487
Mian, S. H., Moiduddin, K., Alkhalefah, H., Abidi, M. H., Ahmed, F., and Hashmi, F. H. (2023). Mechanisms for choosing PV locations that allow for the most sustainable usage of solar energy. Sustainability 15 (4), 3284. doi:10.3390/su15043284
Miller, S. D., Rogers, M. A., Haynes, J. M., Sengupta, M., and Heidinger, A. K. (2018). Short-term solar irradiance forecasting via satellite/model coupling. Sol. Energy 168, 102–117. doi:10.1016/j.solener.2017.11.049
Muneer, T., Asif, M., and Munawwar, S. (2005). Sustainable production of solar electricity with particular reference to the Indian economy. Renew. Sustain. Energy Rev. 9 (5), 444–473. doi:10.1016/j.rser.2004.03.004
nasa (2023). nasapower. Available online at: https://power.larc.nasa.gov/.
National Research Council (2001). Climate Change Science, an analysis of some key questions. National Academy of Sciences.
Nations, U. (2015). The 2030 agenda for sustainable development transforming our world: the 2030 agenda for sustainable development preamble. Available online at: https://www.un.org/en/development/desa/.
Obama, B. (1979). The irreversible momentum of clean energy. Science 355 (6321), 126–129. doi:10.1126/science.aam6284
Pedro, H. T. C., and Coimbra, C. F. M. (2012). Assessment of forecasting techniques for solar power production with no exogenous inputs. Sol. Energy 86 (7), 2017–2028. doi:10.1016/j.solener.2012.04.004
Rana, M., Koprinska, I., and Agelidis, V. G. (2015). “Forecasting solar power generated by grid connected PV systems using ensembles of neural networks,” in 2015 international joint conference on neural networks (IJCNN) (IEEE), 1–8. doi:10.1109/IJCNN.2015.7280574
Rathore, P. K. S., Chauhan, D. S., and Singh, R. P. (2019). Decentralized solar rooftop photovoltaic in India: on the path of sustainable energy security. Renew. Energy 131, 297–307. doi:10.1016/j.renene.2018.07.049
Rodrigues, G. C., and Braga, R. P. (2021). Evaluation of NASA POWER reanalysis products to estimate daily weather variables in a hot summer mediterranean climate. Agronomy 11 (6), 1207. doi:10.3390/agronomy11061207
Ruiz, H. S., Sunarso, A., Ibrahim-Bathis, K., Murti, S. A., and Budiarto, I. (2020). GIS-AHP Multi Criteria Decision Analysis for the optimal location of solar energy plants at Indonesia. Energy Rep. 6, 3249–3263. doi:10.1016/j.egyr.2020.11.198
Sawadogo, W., Abiodun, B. J., and Okogbue, E. C. (2020). Impacts of global warming on photovoltaic power generation over West Africa. Renew. Energy 151, 263–277. doi:10.1016/j.renene.2019.11.032
Shi, J., Lee, W.-J., Liu, Y., Yang, Y., and Wang, P. (2012). Forecasting power output of photovoltaic systems based on weather classification and support vector machines. IEEE Trans. Ind. Appl. 48 (3), 1064–1069. doi:10.1109/TIA.2012.2190816
UNEP. Information Unit for Conventions. Climate change information kit. UNEP. Available online at: https://digitallibrary.un.org/record/261027.
XGBoost documentation. Available online at: https://xgboost.readthedocs.io (accessed on 20 August 2021).
Xiao, J., Yao, Z., Qu, J., and Sun, J. (2013). Research on an optimal site selection model for desert photovoltaic power plants based on analytic hierarchy process and geographic information system. J. Renew. Sustain. Energy 5 (2). doi:10.1063/1.4801451
Keywords: photovoltaic performance prediction, energy prediction, remote sensing, satellite imagery in solar energy, artificial intelligence
Citation: Ghaedrahmati H, Talebi S, Moradi A, Eskandari A, Parvin P and Aghaei M (2025) Potential analysis and energy prediction of photovoltaic power plants using satellite-based remote sensing and artificial intelligence techniques. Front. Energy Res. 13:1611429. doi: 10.3389/fenrg.2025.1611429
Received: 14 April 2025; Accepted: 19 May 2025;
Published: 04 June 2025.
Edited by:
Sudhakar Kumarasamy, Universiti Malaysia Pahang, MalaysiaReviewed by:
Abdelfetah Belaid, CDER, AlgeriaRajesh Narayan Deo, Government Engineering College Palamu, India
Copyright © 2025 Ghaedrahmati, Talebi, Moradi, Eskandari, Parvin and Aghaei. This is an open-access article distributed under the terms of the Creative Commons Attribution License (CC BY). The use, distribution or reproduction in other forums is permitted, provided the original author(s) and the copyright owner(s) are credited and that the original publication in this journal is cited, in accordance with accepted academic practice. No use, distribution or reproduction is permitted which does not comply with these terms.
*Correspondence: Mohammadreza Aghaei, bW9oYW1tYWRyZXphLmFnaGFlaUBudG51Lm5v