 Casimiro A. Pio1*
 João G. Cardoso1,2
 Mário A. Cerqueira1
 Ana Calvo1
 Teresa V. Nunes1
 Célia A. Alves1
 Danilo Custódio1
 Susana M. Almeida3
 Marina Almeida-Silva3
- 1CESAM and Department of Environment and Planning, University of Aveiro, Aveiro, Portugal
- 2Department of Science and Technology, University of Cape Verde, Praia, Cape Verde
- 3Centre for Nuclear Science and Technologies, IST, University of Lisbon, Sacavém, Portugal
One year of, almost continuous, measurements of aerosol optical properties and chemical composition were performed at the outskirts of Praia, Santiago Island, Cape Verde, within the framework of CV-DUST (Atmospheric aerosol in Cape Verde region: seasonal evaluation of composition, sources and transport) research project, during 2011. This article reports the aerosol number and mass concentration measurements using a GRIMM Optical Aerosol Spectrometer that provides number size discrimination into 31 size ranges from 0.25 to 32 μm. Time series of 5 min average PM10 concentrations revealed peak values higher than 1000 μg.m−3 during winter dust storm events originating over Northern Africa. The 24 h average concentrations exceeded the World Health Organization (WHO) guidelines for PM2.5 and PM10 in 20 and 30% of the 2001 days, respectively. Annual average mass concentrations (±standard deviation) for PM1, PM2.5, and PM10 were 5 ± 5, 19 ± 21, and 48 ± 64 μg.m−3, respectively. The annual PM2.5 and PM10 values were also above the limits prescribed by the WHO (10 and 20 μg.m−3, respectively). The aerosol mass size distribution revealed two main modes for particles smaller than 10 μm: a fine mode (0.7–0.8 μm), which possibly results of gas to particle conversion processes; and a coarse mode with maxima at 3–4 μm, which is associated with desert dust and sea salt sources. Within the coarse mode two sub-modes with maxima at 5–6 and 10–12 μm were frequently present.
Introduction
Aerosol particles are ubiquitous in the atmosphere; their behavior and effects depend on their physical and chemical properties. Particles size and size distribution are important physical properties governing aerosol interaction with atmospheric radiation, cloud formation, transport and deposition, and health effects. Atmospheric aerosol particles present sizes ranging from a few nanometers to hundreds of micrometers. Several classifications based on particle size have been proposed to differentiate the atmospheric aerosol; the most common divides the aerosol into a coarse fraction, for supermicrometer larger particles, usually produced by mechanical processes, and a fine fraction, for submicrometer smaller particles, resulting mostly from gas to particle conversion.
One of the largest sources of atmospheric aerosol is the mechanical action of wind on dry surfaces, originating the so called atmospheric dust. Dust sources include industry (cement and mining), road traffic and agriculture, but the overwhelming source of atmospheric dust is natural soil. Wind-blown dust is emitted mainly as coarse particles, but an important fraction is also in the fine size range. Together with sea salt spray formation over the oceans, soil wind-blown dust is the largest source of atmospheric aerosol with an estimated global emission rate of 250 Tg.year−1 of fine particles and 1000–4875 Tg.year−1 of coarse particles (Raes et al., 2000).
The main source regions of wind-blown dust are desert areas. Although desert regions such as the Arabian Peninsula, Iran, Afghanistan, China, Namib and Kalahari are important atmospheric dust sources, the North Africa's Sahara region is by far the major source of soil dust with an estimated production of 130–760 Tg.yr−1 (Goudie and Middleton, 2001), but some estimates put the number at as high as 1600 Tg.yr−1 (Ozer, 2001). From satellite data observations, the main dust emission regions in North Africa are the Bodélé depression, in Chad, and the Mali-Mauritanian border area, (Engelstaedter et al., 2006), but the southern Sahel region can contribute also with up to one third of North African dust emissions (Ginoux et al., 2004).
Multiannual and seasonal significant variability in North Africa dust concentrations and emissions have been reported (Engelstaedter et al., 2006); these variations have been attributed mostly to seasonal and long-term changes in rainfall patterns. Drought conditions in Sahel seem to affect dust emissions in these areas in the years immediately following a drought year (Chiapello et al., 2005), probably as result of decaying in vegetation covering. Field and satellite observations show strong seasonal variations in North African dust emissions. While in some regions such as Bodélé Depression are active emitters the whole year, dust emission activity seem to peak during summer in Western and North Western Sahara areas (Engelstaedter et al., 2006).
Sahara dust emissions are transported to neighboring areas in the Mediterranean, Europe, Western Asia and Atlantic. Kaufman et al. (2005) estimated North African annual dust transport to the west to be 240 ± 80 Tg, of which 140 Tg are deposited in the Atlantic Ocean, 20 Tg are transported toward Europe, 50 Tg fertilize the Amazon basin and 50 Tg reach the Caribe.
The transport of Sahara dust is strongly affected by variations in the position of the Inter Tropical Convergence Zone (ITCZ). During winter Hartmattan winds blow, at low altitudes, from Northeast to the ITCZ located at 5–10°N, transporting dust at the surface to regions off the African west coast, such as the Cape Verde islands (Engelstaedter et al., 2006). In summer the ITCZ moves to the North and transport of dust to the west Atlantic region happens preferably at higher altitudes; during summer at sea level wind blows preferentially from non-continental areas (Gama et al., submitted).
African desert dust has significant impacts on atmospheric heat balance and climate control, weakening Atlantic Tropical cyclones (Wu, 2007), on biogeochemical cycles in the Atlantic and Amazon basin (Mahowald et al., 2009) and on human health in Africa and surrounding regions, since it has been related with the spreading of meningitis in Sahel (Sultan et al., 2005) and seems to have an impact on the incidence of asthma and cardio vascular illnesses (De Longueville et al., 2010).
Although satellite information and transport modeling are powerful techniques to assess African desert dust role in the atmosphere, in-site aerosol measurements are fundamental complementary tools to evaluate atmospheric dust loading and transport from source regions. Long term measurements over the Atlantic to determine Sahara dust transport to the west are difficult to implement. Due to its location on the tropical North Atlantic, off the west coast of Africa, the Cape Verde Islands are particularly suitable to study the transport of Saharan dust plumes to the Atlantic, Caribbean Sea, and Amazon Basin (Prospero et al., 1981; Reid et al., 2003; Muhs et al., 2007). The geographical location of the Cape Verde Islands has attracted a number of important field experiments during the last decades (Jaenicke and Schutz, 1978; Moulin et al., 1997; Caquineau et al., 1998; Ratmeyer et al., 1999; Tanré et al., 2003; Nalli et al., 2005; Ansmann et al., 2009; Assmann et al., 2011; Chen et al., 2011). Most of these experiments consisted of short-term intensive campaigns and long term measurements covering all seasons are still scarce. Therefore, a 1 year continuous field measurement campaign was conducted during 2011 in Santiago Island, Cape Verde, within the framework of CV-DUST project, to collect and measure the atmospheric aerosol on air masses passing over the island. The aerosol physical and chemical properties, as well as the aerosol origin, estimated by transport and source apportionment modeling, were already described elsewhere (Almeida-Silva et al., 2013, 2014; Gama et al., submitted; Gross et al., submitted; Almeida et al., in preparation). This article only describes and discusses the results of measurements performed with a GRIMM aerosol spectrometer, relative to aerosol size distribution and PM1 (particles mass, smaller than 1 μm), PM2.5 (particles mass, smaller than 2.5 μm), and PM10 (particles mass, smaller than 10 μm) concentration variability, across seasons. There is very little published information concerning standard PM concentrations and size distributions for this region of Africa, on a seasonal scale, and therefore this information will be quite useful for modeling and health evaluation studies.
Materials and Methods
The GRIMM Aerosol Optical Spectrometer
Several types of instrumentation can be used to physically characterize atmospheric particles but none is capable of fully specify all aerosol size ranges. Aerosol Optical Spectrometers (AOS) are relatively affordable devices employed in the measurement of atmospheric aerosol size differentiated concentrations. Operation of these instruments is based on the univocal relation between particle size and its light scattering properties. AOSs are sensitive to measure atmospheric particles, but only for size ranges above 100–300 nm, and are specially adapted to the measurement of mechanically produced coarse aerosols such as soil dust and sea salt spray. Aerosol light scattering characteristics are highly dependent on particle size, shape and Refractive Index (RI), in accordance with the equation:
where I is the light scattering intensity from the particle, k is a constant depending on the instrument geometry characteristics, Θ is the scattering angle, Dp is the particle size (and shape) and f is the scattering intensity function (intensity of light scattering in Θ direction for a particle of size Dp and RI = n-ik). For spherical particles function f is given by the Mie theory. For non-spherical particles the function is more complex and several methods such as the Discrete Dipole Approximation can be employed (Yurkin and Hoekstra, 2007).
The GRIMM Spectrometer model EDM 164 employed in the present work uses multi-channel light scattering optics as the measuring principle; a detailed description with schematic diagrams of a similar instrument can be found in Grimm and Eatough (2009). The instrument is provided with a laser diode emitting at γ = 660 nm. Air is sucked continuously, at 1.2 l.min−1, into a measuring chamber. There, each single particle is illuminated by the laser beam, providing a scattering pulse height, directly related to the particle size. The particle scatters light in all directions in accordance with Maxwell theory. One fraction of this light is collected by a photo diode located at a 90° angle with the laser beam, with the help of a parabolic mirror located in the opposite direction. All scattered light between Θstart = 60° and Θstop = 120° is reflected by the parabolic mirror to the photo-detector, which collects and measures the arriving scattered and reflected laser photons. An algorithm (a manufacturer secret but probably based on Mie theory) relates the intensity of the measured scattered light impulse with the size of the particle. Grimm spectrometers are factory calibrated with polystyrene latex (PSL). The calibration is used for tuning the algorithm relating measured scattered light with particle size, for each instrument.
The instrument provides information on number concentration, in 31 size bins, for particles with sizes from 0.25 to 32 μm, for atmospheric aerosol loadings in the range 0.1–6000 μg.m−3. Number concentration time averages can be registered in the internal data logger for periods from 6 s to 1 h; during the CV-DUST sampling campaign, 5 min averaged number concentrations were registered for the 31 size bins.
The instrument is provided with a screened entrance head in accordance with Johannesburg Convention which, in accordance with the manufacturer, permits efficient entrance of particles of sizes up to 10–20 μm, for wind speeds up to 8 m.s−1 (Grimm and Eatough, 2009).
GRIMM Field Calibration
Volume size distributions can be derived from number size distributions if the form of particles is known or guessed. The Cape Verde atmospheric aerosol is a mixture of different types of particles with predominance of soil dust and sea salt spray. In the present study, we consider that dust is the prevailing component of the aerosol, making all calculations as if the aerosol is only formed by dust, as a valid approximation. Although desert dust particles are not truly spherical, presenting a Dynamic Shape Factor (χ) of around 1.25 (Kaaden et al., 2009), sphericity was used as an approximation in number to volume transformation. For comparison purposes, the dynamic shape factor for sodium chloride in the continuum regime is χ = 1.08 (Kelly and McMurry, 1992; Gysel et al., 2002).
Sahara dust particles measured previously at Cape Verde and in Morocco showed a specific dry mass between 2.45 and 2.7 g.cm−3 (Haywood et al., 2001; Kaaden et al., 2009). An average density of 2.5 g.cm−3 was employed here to calculate mass concentration and mass size distribution from the number distribution of GRIMM measurements. For comparison, the dry density of sodium chloride is approximately 2.16 g.cm−3 (Schladitz et al., 2011).
The GRIMM AOS is calibrated at the factory with PSL. As PSL is colorless, having a RI of 1.59 and desert dust has a reddish-brownish color, it is possible that the factory calibration does not reproduce correctly the light scattering behavior of the Cape Verde dust aerosol. During the CVDUST campaign the aerosol was collected in parallel, as PM10 (mass concentration of particles with diameters lower than 10 μm), in filters, and mass concentrations determined gravimetrically. A comparison between calculated time averaged GRIMM mass concentrations and PM10 gravimetric measurements is possible for equivalent sampling/measurement periods. The comparison is not direct because the GRIMM provides geometric size distributions while gravimetric PM10 determination is based on the pre-removal of coarser particles with a size selective inlet that uses impaction to separate particles according to their aerodynamic equivalent size. PM10 inlets present a sigmoidal efficiency curve, in accordance with USEPA (United States Environmental Protection Agency) regulations (USEPA, 1998). Therefore, to calculate aerodynamic PM10 from GRIMM mass size distribution, the aerodynamic equivalent size efficiency curve of the PM10 inlet needs to be transformed into an efficiency curve for the dust geometric size. The transformation was done using Stokes Law approximation:
where Dpgeo and Dpaer are respectively the geometric and aerodynamic equivalent diameters, χ is the dynamic shape factor, ρ is the density of the particle and ρ0 is the density of water.
An adapted impactor efficiency curve for geometric size particles based on previous equation for particles with a χ = 1.25 and a ρ of 2.5 g.cm−3 can be seen in Figure 1. Aerodynamic PM10 concentrations were calculated for GRIMM measurements using the transformed sampling inlet efficiency curve shown in Figure 1. The intercomparison results between the GRIMM calculated PM10 and gravimetric aerodynamic PM10 are given in Figure 2. The figure shows a good linear correlation between the two measurement sets (R2 = 0.96) but the GRIMM under-predicts true mass concentrations by more than 40%. A better ratio for GRIMM measurements can be achieved by increasing substantially the proposed density of particles, which does not seem reasonable given what is known from experimental measurements, or by recalculating the particles size, from light scattering values, for the instrument, taking into account the RI characteristics of sampled dust.
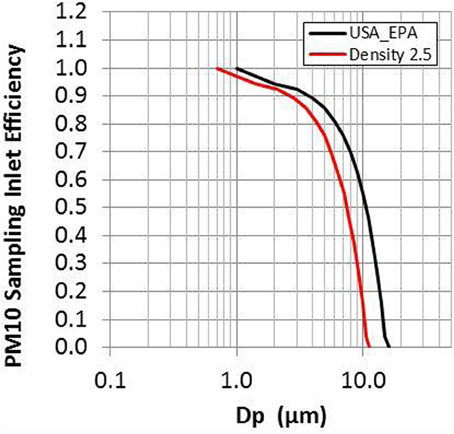
Figure 1. PM10 Sampling inlet efficiency curve in accordance with the USA EPA regulations, expressed originally in terms of aerodynamic equivalent sizes, and for dust aerosol particles having a specific mass density ρ = 2.5 g.cm−3 and a Dynamic Shape Factor χ = 1.25.
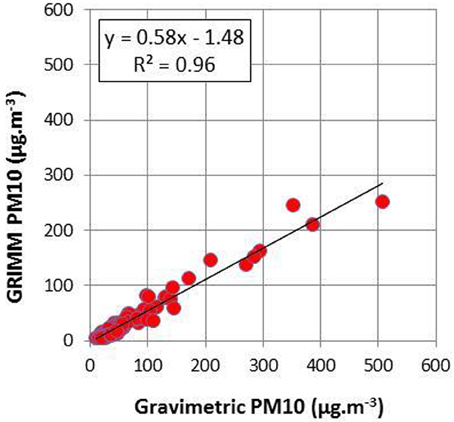
Figure 2. Comparison between PM10 concentrations measured in parallel with the GRIMM and with the gravimetric method. The best fit regression line and the respective equation and correlation coefficient are given in the figure.
Using the algorithm relating light scattering with aerosol size, that was developed based on the Mie theory, specifically for this instrument optical geometry, and gently provided by Thomas Müller (Leibniz Institute for Tropospheric Research, Leipzig, Germany), the particle diameters were recalculated from original factory calibration for different RIs. For γ = 660 nm, aerosol dust RIs vary between 1.53-0.001i and 1.53-0.005i (Kandler et al., 2011a,b; Muller et al., 2011). Figure 3 presents the recalculated diameter curve for dust particles having a RI = 1.53-0.005i; this figure shows that the new value of the RI increases the estimated value of bin diameters, principally for particles above 1 μm. Figure 4 shows the intercomparison between GRIMM and gravimetric PM10, after GRIMM diameter recalculation. The recalculated diameter values give mass concentration estimations much closer to gravimetric values (only 11% below); therefore the recalculated size bins are used in present measurements as a more correct estimate of concentrations and size distribution. As the Mie theory only applies to spherical particles and atmospheric dust has an irregular form, probably the new fitting gives excessive diameter values for most coarse measured particles. Also the GRIMM aerosol inlet is not prepared to efficiently collect giant particles. Therefore, particle concentrations with sizes greater than 10 μm measured with GRIMM were used with caution in this study.
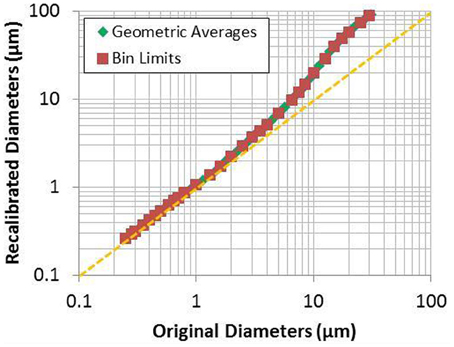
Figure 3. Recalibration curve for GRIMM AOS diameters from original factory values, using Mie equation applied to the equipment geometry, for particles with a RI = 1.53-0.005i.
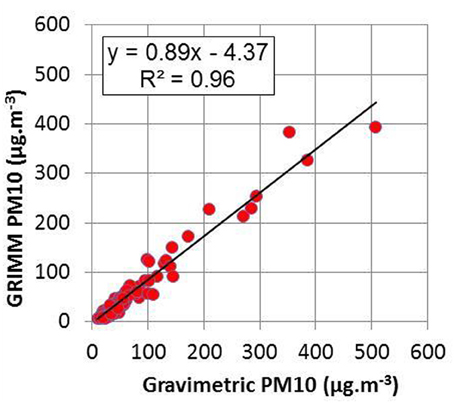
Figure 4. Comparison between PM10 concentrations measured in parallel with the GRIMM, after RI recalibration, and with the gravimetric method. The best fit regression line and the respective equation and correlation coefficient are given in the figure.
Local and Sampling Conditions
The CVDUST measurement station was installed at approximately 8 m above the ground, in the roof platform of the Cape Verde Meteorological Institute (CVMI), on the eastern outskirts of Praia city, the capital of the Republic of Cape Verde (90,000 inhabitants), in Santiago Island, at about 650 Km from the western coast of Senegal (see Map in Figure 5). The CVMI is located in the ex-traffic control tower of the former Praia airport, (14° 55'N; 23° 29'W; 98 m a.s.l.), at a distance of 200 m from the road connecting the new airport to the city center and 1700 m from sea shore. Therefore, aerosol concentrations are affected by both the transport of dust from Africa and by local dust and anthropogenic emissions. Other important particle sources are sea salt spray and long-range transport of pollution.
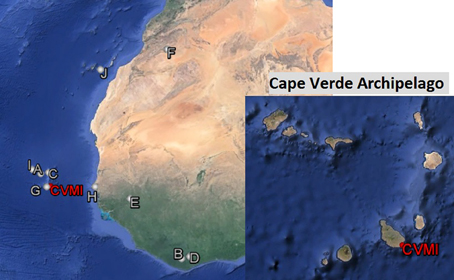
Figure 5. Map of sampling site (CVMI—Cape Verde Meteorological Institute) in the isle of Santiago, Cape Verde archipelago, off-shore of the North-west Africa coast. Letters from A to J show sampling sites of previous sampling campaigns referred and discussed in the text: A, Chiapello et al. (1997); B, Afeti and Resch (2000); C, Caquineau et al. (2002); D, Sunnu et al. (2008); E, Rajot et al. (2008); F, Kandler et al. (2009); G, Kandler et al. (2011b); H, Flament et al. (2011); I, Rodriguez et al. (2011); J, Gelado-Caballero et al. (2012).
The aerosol was collected and measured continuously during 2011, with exception of periods of electric power supply failure, which were quite frequent. Longer sampling interruptions occurred during the months of September and December as a result of equipment breakdown and/or removal; overall the equipment was able to gather aerosol data during 83% of the sampling campaign period. During the measuring campaign more than 100,000, 5 min averaged, samples were taken with the GRIMM. The data set contains approximately 2.5 million data concentration points for all size bins.
The local climate is humid but with scarce rainfall and the region is classified as semi-desert. The islands have a short wet season during the period of July to October, with some rain, and a dry season in the rest of the year. Total rainfall during the study period was 150 mm, and most of it was collected from August to October. Monthly averaged relative humidity varied between a minimum of 65% in February and a maximum of 81% in August. Monthly temperature averages were in the range 21 to 27°C.
During the period of November to March wind conditions favor the transport of air masses from west Africa at low altitudes, in the boundary layer, resulting in a quite dusty atmospheric environment, locally designed by “bruma seca” (dry fog).
Results and Discussion
PM Concentrations
Number concentrations measured with the GRIMM were used to calculate PM1 (mass concentration of particles with diameters lower than 1 μm), PM2.5 (mass concentration of particles with diameters lower than 2.5 μm) and PM10. The stored and calculated PM, 5 min averaged, mass concentrations show a large temporal variability, revealing the inhomogeneity of dust plumes transported from the African continent (standard deviations of 89, 115, and 133% for PM1, PM2.5, and PM10, respectively). Therefore, for PM climatology purposes, PM data are presented graphically in Figure 6, as 24 h run averages to permit enough variability attenuation and a better visualization of concentration values along all year. The results confirm the presence of substantial dust contamination during “bruma seca” months of December to February and lower values during the rest of the year. During winter months dust episodes can last for more than 1 week with important concentration variability within periods of hours. During dust events, 5 min average PM10 concentrations can reach values higher than 1000 μg.m−3, while 24 h run average values can reach maxima of 460 μg.m−3. Figure 7 represents one of those peak events, in January; the figure shows that short-term concentration variability happens principally for coarser size fractions.
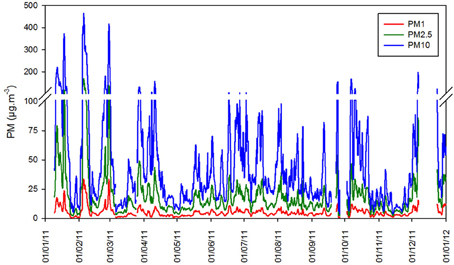
Figure 6. PM1, PM2.5, and PM10, 24 h geometric mass concentration running averages, for GRIMM recalibrated measurements.
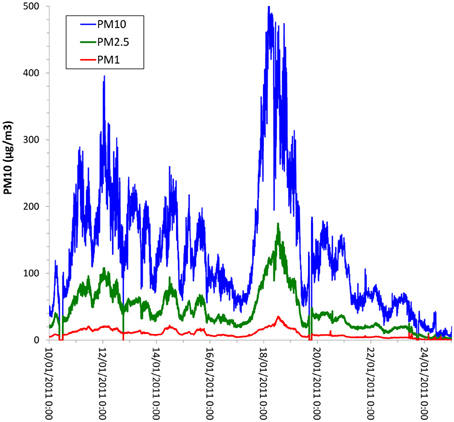
Figure 7. Five minutes averaged PM1, PM2.5, and PM10 concentration variability of a dust episode during the month of January, 2011.
Backward trajectories were calculated for all year using the Hysplit model (Draxler and Hess, 1998; Draxler and Rolph, 2014) show that increased dust concentrations resulted from direct air mass transport, in the boundary layer, from desert areas in Northern Africa during the winter season. Examples of two different situations (the dust episode given in Figure 7, a period without direct dust transport from Africa), are given in Figure 8. More detailed accounting of backward trajectories for the entire CV-DUST campaign is shown in Gama et al. (submitted).
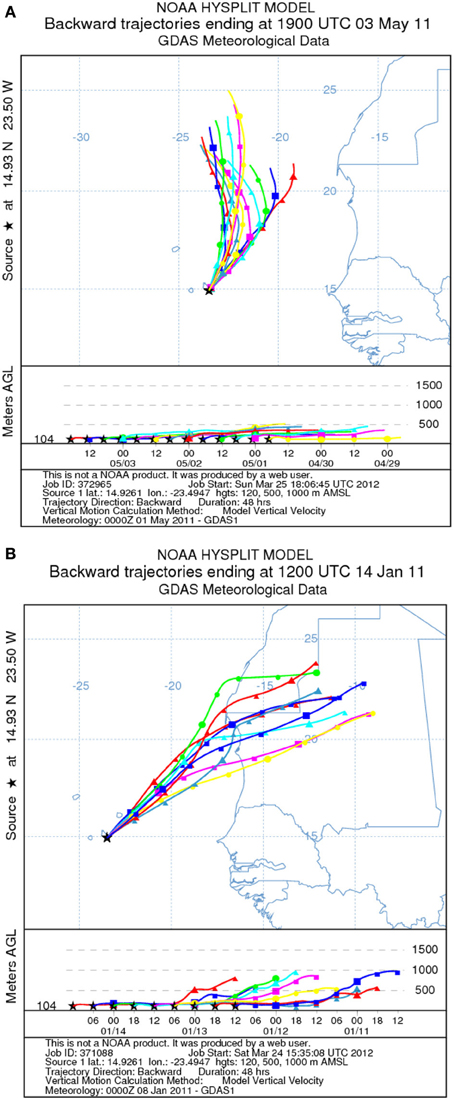
Figure 8. Hysplit 48 h backward trajectories of air masses arriving at Praia, for two distinct periods in 2011. (A) End of April and beginning of May, when PM10 mass concentrations exhibited minimum values; (B) 11–14 January with strong dust transport from West Africa, when PM10 mass concentrations were peaking. Each color represents a 48 backward trajectory. Trajectories were evaluated at each 6 h intervals.
Although the aerosol number concentration is mostly associated with submicrometer particles, the aerosol mass is mainly associated with the coarse supermicrometer fraction, preferentially above 2.5 μm. Annual average concentrations for PM1, PM2.5, and PM10 were 5 ± 5, 19 ± 21, and 48 ± 64 μg.m−3, respectively.
Up to now there is no consistent published information about annual average PM mass concentration from other studies to compare with our results. Published data on African dust concentrations usually refer to short term sampling campaigns or to measuring methodologies, such as bulk sampling, that do not permit direct retrieval of for PM1, PM2.5, or PM10 seasonal orannual averaged levels. Chiapello et al. (1997) used the Sal Island, also in Cape Verde, as a platform to sample atmospheric aerosol, on a daily basis, between 1991 and 1994, with a filter system, but only bulk aerosol samples were collected, presuming an effective filtration of particles smaller than 20 μm. The long-term data set of 24 h average mass concentrations was described later by Caquineau et al. (2002) and was characterized by intensive concentration pulses of short duration, principally during winter months, with maxima of 500 μg.m−3.
An intensive 1 month field experiment run in Praia during January 2008 integrated in the SAMUM-2 campaign revealed PM10 values of the order of 29 μg.m−3, during transport of maritime air masses, and of 223 μg.m−3, during dust events with air masses transported directly from Africa (Kandler et al., 2011b); the mass ratio between PM10 and PM2.5 did not present a significant variation during the field experiment, with an average of 2.67, not very different from our annual average ratio of 2.53.
World Health Organization prescribed maxima annual average concentrations of 10 and 20 μg.m−3, and 24 h average concentrations of 25 and 50 μg.m−3, for PM2.5 and PM10, respectively, which were recommended to provide public health protection (WHO, 2006). The annual average PM2.5 and PM10 concentrations at Praia during 2011 are well above the WHO recommended guidelines. Exceedances to the 24 h average limit value for PM2.5 and PM10 concentrations were also common. Twenty percent of 2011 days had average concentrations above the 25 μg.m−3 WHO guideline for PM2.5. Thirty percent of 2011 days had average concentrations above the 50 μg.m−3 WHO guideline for PM10. Exceedances of the daily limit value accumulated during the “bruma seca” period, from December to February, but a significant number of daily exceedances was also observed in most of the other months of the year. Monthly averaged PM mass concentrations, given in Figure 9, show that PM levels maintain an average monthly concentration value relatively high even during summer non dust events periods.
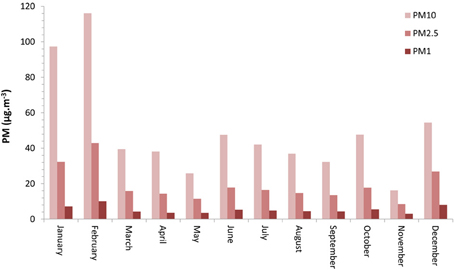
Figure 9. Monthly averaged PM1, PM2.5, and PM10 concentrations, for each month of 2011. Values for December are less representative of average conditions during this month because of important measuring interruptions.
These dust contamination levels may have important health effects on the Cape Verde human population. Although, detailed statistical health information is not available for the country, it is widely recognized locally that hospital admissions in relation to respiratory/cardiovascular diseases increase during the “bruma seca” periods.
Despite the high aerosol mass concentrations found in the Cape Verde atmosphere during CV-DUST, these values were clearly lower than those reported before in continental West African areas, near dust sources. Kandler et al. (2009) found background PM2.5 and PM10 concentrations of 30 and 80 μg.m−3, respectively, during SAMUM-1 experiment, that took place in Morocco, between May and June 2006. During haze periods, aerosol concentrations increased one order of magnitude and were dependent on wind intensity. PM10 concentrations up to 3000 μg.m−3 and PM2.5 concentrations up to 1000 μg.m−3 were observed under moderate winds. Aerosol particles greater than 10 μm accounted for more than 90% of airborne aerosol mass under the influence of strong winds.
An intensive field campaign of aerosol measurement was performed in Senegal during February 2006, as part of the AMMA project (Flament et al., 2011). Although, no major dust event occurred during the campaign period, measurements with a R&P TEOM revealed 5 min average PM10 concentrations between 10 and 500 μg.m−3. Concentration levels were dependent on the origin of air masses and wind direction. While an average PM10 concentration of 47 μg.m−3 was observed for marine air masses, an increase to values of the order of 100–114 μg.m−3 was reported to occur during coastal and continental wind direction/air mass transport.
Dust particles resulting from African desert emissions can impact regions located a significant distance from source emission areas. Average Total Suspended Particles (TSP) concentrations (0.5–25 μm particles) of 18, 53, and 134 μg.m−3, were found in 1996, 1997, and 1998, respectively, in Ghana, at a distance of 3000 Km from dust production zones, during Hartmattan wind periods (Afeti and Resch, 2000). These values were much lower than measurements performed in the same country by Sunnu et al. (2008) with an OAS instrument, during a 9 year period between 1996 and 2005 where annual mean concentrations ranged from 160 to 1204 μg.m−3.
Measurements performed during 2005–2008 at the Izaña GAW Observatory, in Tenerife Island (Canary Islands), at 2367 m a.s.l., revealed, most of the time, PM10 levels of the order of 1–5 μg.m−3, characteristic of the free troposphere. Twenty-four hour average PM10 concentrations could reach values as high as 150 μg.m−3 during periods of Saharan dust advection (Rodriguez et al., 2011). TSP measurements, taken in Gran Canary island at lower altitudes, within the marine boundary layer, during 2002–2005 revealed much higher peak concentrations during dust events, up to 5586 μg.m−3 in January 2005 (Gelado-Caballero et al., 2012); TSP background concentrations during periods without Saharan dust transport influence were of the order of 11–28 μg.m−3.
Size Distributions
Particles size distribution provides important information concerning atmospheric aerosol behavior and its effect on radiative transfer and health. The GRIMM is sensitive only to particles above 0.25 μm and therefore no information concerning Nucleation and Aitken particles can be taken from this instrument. Figure 10 shows the annual average number and mass size distribution of Cape Verde aerosol during 2011. While for number, most of the particles concentrate in diameters lower than 0.6 μm, for mass the bulk of the aerosol is above 1 μm. The annual mass size distribution shows clearly the existence of two main modes under 10 μm size: a smaller mode with maximum at 0.7–0.8 μm and a larger coarse mode with a maximum at 3–4 μm. The instrument measurements also reveals the existence of a second coarser mode for particles larger than 10 μm but neither the instrument entrance geometry nor the measurement principle were developed to measure giant particles and therefore these results will not be discussed in detail. The annual average size distribution is mainly influenced by peak concentrations in January and February during the “bruma seca” period.
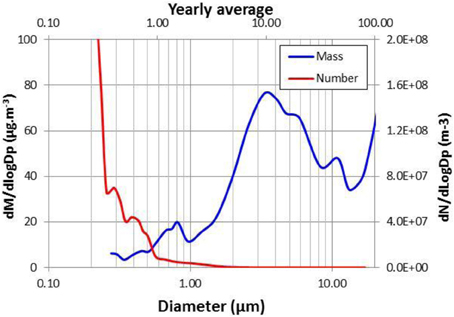
Figure 10. Yearly averaged mass and number concentration size distributions for the Praia atmospheric aerosol during 2011.
Figure 11 presents the monthly averaged mass size distributions for each of the 2011 months. The figure reveals the existence of multimodal size distributions for particles above 1 μm. The main mode with maximum at 4 μm is more evident during months with strong dust events. A second mode at 5–6 μm becomes predominant at lower intermediate aerosol loadings. There is also a constant presence of a mode with maximum at 10–12 μm. These multiple aerosol modes in coarse particles may reflect the multiple sources and formation/transport processes contributing to the coarse aerosol loading in Praia atmosphere, at ground level. The coarse aerosol at this site results from dust transport from Africa at low altitude, from local emission of dust by the action of the wind on the island bare and dusty soil (Santiago island has a semi desert landscape), from human activities (road traffic, building construction, etc.) and from the constant presence of sea salt spray from the surrounding ocean. Each one of those sources may imprint the size distribution with slightly different mode maxima. Local intense human activities and soil characteristics result in the constant emission of dust that adds to the long range transported atmospheric dust loading. In periods of “bruma seca” this local emissions are difficultly discerned from North Africa imports because of the high variability of this contamination (see Figure 7). But in periods non-affected by direct African plumes the local dust imprint can easily be seen from the daily patterns in concentration variability. As shown in Figure 12 hourly variations in size distributions presented a common daily pattern in the coarser size bins (>2.5 μm) with minimum coarse particle concentration values during night and maximum values during the daytime period when road traffic and human activities peak.
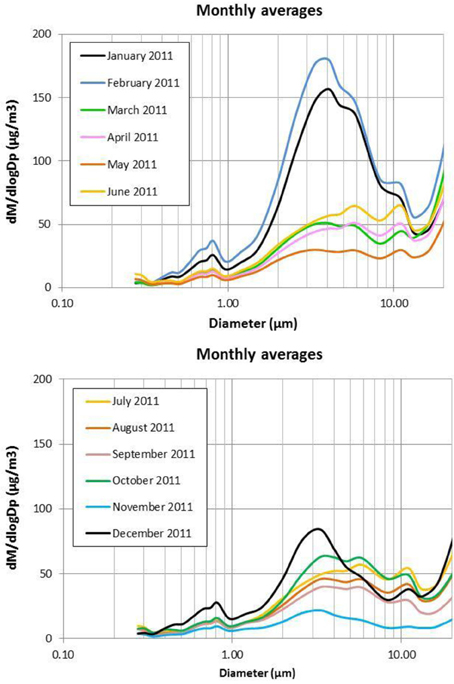
Figure 11. Monthly averaged mass concentration size distributions of the Praia atmospheric aerosol, for every 2011 month.
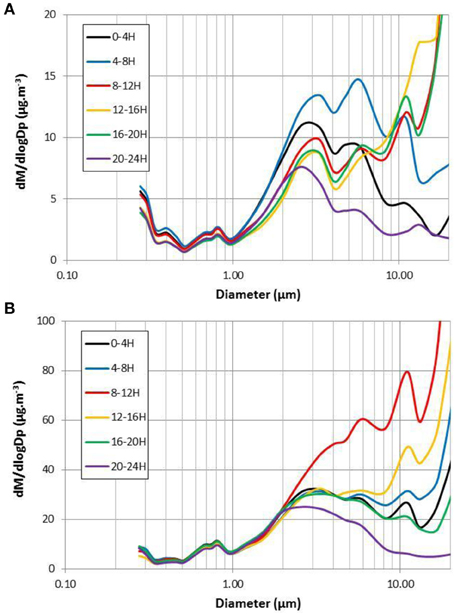
Figure 12. Four hours average mass concentration size distributions during 2 days without direct Saharan dust intrusions. (A) 2nd May, 2011; (B) 12th June, 2011.
Goudie and Middleton (2001) reviewed and summarized published information concerning North African dust particle size characteristic. The authors concluded that exists a lack of information concerning dust size in dust producing areas. Most of the information relates with dust storms that have already traveled outwards the major source regions; in these conditions dust may have modal and median sizes between 5 and 30 μm in diameter in areas such as Nigeria. Conversely samples from Gana, Bermudas and South Europe have shown sizes lower than 5 μm. Besides modal information experiments revealed the presence of giant particles of up to 350 μm at distances of more than a thousand kilometers from dust sources.
Our results compare well with Goudie and Middleton (2001) published data and with other size distribution measurements performed during field experiments in Western Africa. Kandler et al. (2011b) observed the presence of 4 size distribution modes during the SAMUM-2 campaign, in January of 2008, at Praia airport, using a Differential Mobility Particle Sizer (DMPS) for the size range 26–800 nm and an Aerodynamic Particle Sizer (APS) for the aerodynamic size range of 570 nm–10 μm. The finest mode of the volume size distribution was found for Dp of 200–300 nm and was attributed to sulfate. The second mode with maxima at 2–3 μm particle diameters was interpreted to be characteristic of marine aerosol and advected mineral dust. The third mode with maxima at 7–10 μm was attributed to sea salt and dust in changing proportions. The 4th mode in sizes above 10 μm was attributed only to mineral dust. The authors considered that the giant aerosol particles had a predominantly local origin.
Rajot et al. (2008) performed a 1 month campaign in January-February 2006 at the Amma supersite in Niger. Mass Size distribution measurements with an AOS Grimm OPC1.108 revealed the existence of two distinct supermicrometric modes with maxima at 4–5 and 7.5–10 μm. During local dust events the 7.5–10 μm mode was clearly dominant, whereas regional dust transported events had a mixture of both modes. A closer examination of the size distributions suggested that a coarser mode above 10 μm might also be present, in a size range too large to be well characterized with the AOS. Similarly to our measurements, a submicrometer mode with maxima in the range 0.8–1 μm was also observed in the Niger atmospheric aerosol.
Rodriguez et al. (2011) measured aerosol particle size distribution in the low free troposphere at Izaña station, in Tenerife Island, during dust episodes, with a combination of a SMPS and APS. Two main modes were observed. The smaller, centered at 240 nm, was attributed to ammonium nitrate. The larger mode had a maximum at 3 μm, being attributed to Saharan advected dust. Sunnu et al. (2008) performed extensive particle size distribution measurements in Ghana during Harmattan periods (November to March), between 1996 and 2005, with an AOS instrument measuring in the size range of 0.5–25 μm. Annual mass size distributions revealed two modes: a smaller mode at Dp < 0.5 μm and a higher mode for coarser particles with maxima in the range 3–9 μm.
The AERONET station in Sal Island, Cape Verde, (http://aeronet.gsfc.nasa.gov) provides Aerosol Optical Depth (AOD) information related with the aerosol column in the atmosphere. The AOD values show that the intense aerosol layer over the Cape Verde Islands in 2011 was not only observed during the “bruma seca” winter period but also during summer months. Aerosol transport modeling applied to Saharan dust transport in 2011 (Gama et al., submitted) revealed that while, in winter, the aerosol is transported to the islands at low altitudes, impacting directly the surface, during summer, transport occurs only at higher altitudes. A similar behavior was observed in Cape Verde in previous studies (Assmann et al., 2011; Kandler et al., 2011a,b). During this summer period it is probable that the coarser particles, having a higher sedimentation velocity, will fall from higher atmospheric layers to the surface, influencing the aerosol distribution with peaks at sizes larger than those resulting from direct transport. Figure 13 was created with aerosol size distribution data retrieved from the AERONET web site and shows monthly averaged distributions for most of the 2011 months (for August-October no monthly data is available). The retrieved AERONET size distribution data confirms the existence of two volume size modes, a smaller one in the submicrometer region with maximum values at 0.2–0.3 μm and a predominant coarse mode with maximum values in the 3–5 μm size range. The maxima in the fine aerosol mode are at lower sizes than GRIMM results which may be explained by the AOS lack of sensitivity in the lower submicrometer size region. In the coarse size region the maxima values of AERONET measurements compare very favorably with GRIMM measurements, although no presence is obvious for multiple coarse aerosol modes in AERONET data. This may result from the height integrated characteristics of AERONET size modes that smooth any variability that may happen for shorter residence times of boundary layer coarse particle populations. Differently from GRIMM measurements, the aerosol loading in AERONET retrieval does not show a peak maxima during the “bruma seca” season, as result of the opposite patterns of dust transport at low and high altitudes over the Cape Verde region in the different seasons of the year (see Gama et al., submitted for a more detailed discussion of transport patterns).
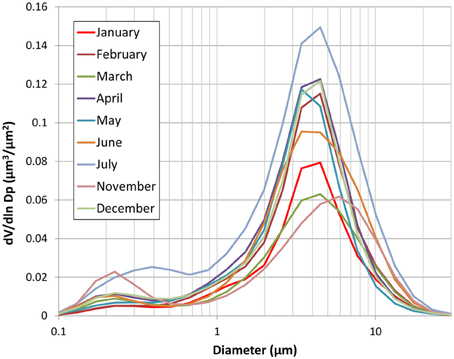
Figure 13. Monthly averaged, column integrated, volumetric size distributions retrieved from AOD measurements in AERONET station at Sal Island, Cape Verde. No data is available for August-October.
Conclusions
Aerosol concentrations were measured almost continuously during the entire year of 2011 with a GRIMM Optical Aerosol Spectrometer that provides number concentrations in 31 size bins between 0.25 and 32 μm. The GRIMM AOS was recalibrated from co-collected gravimetric PM10 aerosol measurements, taking into account the real dust aerosol RI, thus permitting a much better comparison with gravimetric aerosol concentration data.
Mass size distributions and PM1, PM2.5, and PM10 were calculated from number concentration measurements, with basis on dust specific density. PM concentration values peaked during winter months and were much lower during the rest of the year. Annual average mass concentrations for PM1, PM2.5, and PM10 were 5, 19, and 48 μg.m−3, respectively. During some dust events, 5 min average PM10 concentrations increased to values higher than 1000 μg.m−3, while 24 h run average values reached maxima of 460 μg.m−3. Daily concentration levels were above the WHO recommended guidelines during 20–30% of the days, in 2011. Also the PM2.5 and PM10 annual averages were well above the WHO recommended limits. As pointed by De Longueville et al. (2010) West African populations are subject to elevated amounts of aerosol particles resulting mostly from soil dust production and transport, with possible important impacts on their health. Cape Verde is one of those cases.
Mass concentration size distributions revealed the presence of two main modes under the 10 μm size range: a smaller mode with a maximum at 0.7–0.8 μm and a larger broad coarse mode with a maximum at 3–4 μm. While the fine mode is possibly the result of gas to particle conversion processes, the coarser particles, above 1 μm, have a clear origin in dust or/and sea salt formation and transport. A closer inspection for particles above 1 μm reveals the existence of multimodal size distributions. The main mode, with maximum at 4 μm is more evident during strong dust events. A second mode at 5–6 μm becomes predominant at lower intermediate aerosol loadings. There is also a constant presence of a mode with maximum at 10–12 μm. These multiple aerosol modes in coarse particles may reflect the multiple sources and formation/transport processes contributing to the coarse aerosol loading in the Praia atmosphere at ground level. The coarse aerosol at this site is the result of dust transport from Africa at low altitude, from local emission of dust by the action of wind on the island bare soil, from human activities (road traffic, building construction, etc.) and from the constant presence of sea salt spray from the surrounding ocean. Each one of those sources may imprint the size distribution with slightly different mode maxima.
Comparison of Cape Verde measurements with previously reported concentration data from Western Africa reveals that although high the PM levels at Cape Verde are significantly lower than in Western Africa continental regions, principally in relation to giant particle loadings. Measured size distributions compare reasonably well with AERONET size information taken from AOT measurements in the Cape Verde's Sal Island and with other size distribution measurements performed under Saharan dust intrusions.
Conflict of Interest Statement
The authors declare that the research was conducted in the absence of any commercial or financial relationships that could be construed as a potential conflict of interest.
Acknowledgments
The authors gratefully acknowledge the Portuguese Science Foundation through the project CV-DUST—Atmospheric aerosol in Cape Verde region: seasonal evaluation of composition, sources and transport (PTDD/AAC-CLI/100331/2008) and the PhD scholarship of João G. Cardoso.
References
Afeti, G. M., and Resch, F. J. (2000). Physical characteristics of Saharan dust near the Gulf of Guinea. Atmos. Environ. 34, 1273–1279. doi: 10.1016/S1352-2310(99)00296-4
Almeida-Silva, M., Almeida, S. M., Cardoso, J., Nunes T., Reis, M. A., Chaves, P. C., et al. (2014). Characterization of the Aeolian aerosol from Cape Verde by k0-INAA and PIXE. J. Radioanalyt. Nuclear Chem. 300, 629–635. doi: 10.1007/s10967-014-2957-9
Almeida-Silva, M., Almeida S. M., Freitas, M. C., Pio, C. A., Nunes, T., and Cardoso, J. (2013). Impact of Sahara Dust transport on Cape Verde atmospheric element particles, J. Toxicol. Environ. Health 76, 240–251. doi: 10.1080/15287394.2013.757200
Ansmann, A., Baars, H., Tesche, M., Muller, D., Althausen, D. Engelmann, R., et al. (2009). Dust and smoke transport from Africa to South America: lidar profiling over Cape Verde and the Amazon rainforest. Geophys. Res. Lett. 36, L11802. doi: 10.1029/2009GL037923
Assmann, A., Petzold, A., Kandler, K., Tegen, I., Wendisch, M., Muller, D., et al. (2011). Saharan Mineral Dust E SAMUM-1 and SAMUM-2: what we have learned? Tellus 63B, 403–429. doi: 10.1111/j.1600-0889.2011.00555.x
Caquineau, S., Gaudichet, A., Gomes, L., and Legrand, M. (2002). Mineralogy of Saharan dust transported over northwestern tropical Atlantic Ocean in relation to source regions. J. Geophys. Res. 107, D15. doi: 10.1029/2000JD000247
Caquineau, S., Gaudichet, A., Gomes, L., Magonthier, M.-C., and Chatenet, B. (1998). Saharan dust: clay ratio as a relevant tracer to assess the origin of soil-derived aerosols. Geophys. Res. Lett. 25, 983–986. doi: 10.1029/98GL00569
Chen, G., Ziemba, L. D., Chu, D. A., Thornhill, K. L., Schuster, G. L., Winstead, E. L., et al. (2011). Observations of Saharan dust microphysical and optical properties from the Eastern Atlantic during NAMMA airborne field campaign. Atmos. Chem. Phys. 11, 723–740. doi: 10.5194/acp-11-723-2011
Chiapello, I., Bergametti, G., Chatenet, B., Bousquet, P., Dulac, F., and Santos Soares, E. (1997). Origins of African dust transported over the northeastern tropical Atlantic. J. Geophys. Res. 102, 13701–13709. doi: 10.1029/97JD00259
Chiapello, I., Moulin, C., and Prospero, J. M. (2005). Understanding the long-term variability of African dust transport across the Atlantic as recorded in both Barbados surface concentrations and large-scale Total Ozone Mapping Spectrometer (TOMS) optical thickness. J. Geophys. Res. 110:D18S10. doi: 10.1029/2004JD005132
De Longueville, F., Hountondji, Y.-C., Henry, S., and Ozer, P. (2010). What we do know about effects of desert dust on air quality on human health in West Africa compared to other regions? Sci. Total Environ. 409, 1–8. doi: 10.1016/j.scitotenv.2010.09.025
Draxler, R. R., and Hess, G. D. (1998). An overview of the HYSPLIT_4 modelling system of trajectories, dispersion, and deposition. Aust. Meteor. Mag. 47, 295–308.
Draxler, R. R., and Rolph, G. D. (2014). HYSPLIT (HYbrid Single-Particle Lagrangian Integrated Trajectory) Model Access via NOAA ARL READY. Silver Spring, MD: NOAA Air Resources Laboratory. Available online at: http://ready.arl.noaa.gov/HYSPLIT.php
Engelstaedter, S., Tegen, I., and Washington, R. (2006). North African dust emissions and transport. Earth Sci. Rev. 79, 73–100. doi: 10.1016/j.earscirev.2006.06.004
Flament, P., Debout, K., Cachier, H., Châtenet, B., and Mériaux, X. (2011). Mineral dust and carbonaceous aerosols in West Africa: source assessment and characterization. Atmos. Environ. 45, 3742–3749. doi: 10.1016/j.atmosenv.2011.04.013
Gelado-Caballero, M. D., Lopez-Garcia, P., Prieto, S., Patey, M. D., Collado, C., and Hernandez-Brito, J. J. (2012). Long-term aerosol measurements in Gran Canaria, Canary Islands: particle concentration, sources and elemental composition. J. Geophys. Res. 117, D03304. doi: 10.1029/2011JD016646
Ginoux, P., Prospero, J. M., Torres, O., and Chin, M. (2004). Long-term simulation of global dust distribution with the GOCART model: correlation with North Atlantic Oscillation. Environ. Modell. Softw. 19, 113–128. doi: 10.1016/S1364-8152(03)00114-2
Goudie, A. S., and Middleton, N. J. (2001). Saharan dust storms: nature and consequences. Earth Sci. Rev. 56, 179–204. doi: 10.1016/S0012-8252(01)00067-8
Grimm, H., and Eatough, D. J. (2009). Aerosol measurement: the use of optical light scattering for the determination of particulate size distribution, and particulate mass, including the semi-volatile fraction. J. Air Waste Manage. Assoc. 59, 101–107. doi: 10.3155/1047-3289.59.1.101
Gysel, M., Weingartner, E., and Baltensperger, U. (2002). Hygroscopicity of aerosol particles at low temperatures. 2. Theoretical and experimental hygroscopic properties of laboratory generated aerosols. Environ. Sci. Technol. 36, 63–68. doi: 10.1021/es010055g
Haywood, J. M., Francis, P. N., Glew, M. D., and Taylor, J. P. (2001). Optical properties and direct radiative effect of Saharan dust: a case study of two Saharan dust outbreaks using aircraft data. J. Geophys. Res. 106, 18417–18430. doi: 10.1029/2000JD900319
Jaenicke, R., and Schutz, L. (1978). Comprehensive study of physical and chemical properties of the surface Aerosols in the Cape Verde Islands Region. J. Geophys. Res. 83, 3585–3599. doi: 10.1029/JC083iC07p03585
Kaaden, N., Massling, A., Schladitz, A., Muller, T., Kandler, K., Schutz, L., et al. (2009). State of mixing, shape factor, number size distribution, and hygroscopic growth of the Saharan anthropogenic and mineral dust aerosol at Tinfou, Morocco. Tellus, 61B, 51–63. doi: 10.1111/j.1600-0889.2008.00388.x
Kandler, K., Lieke, K., Benker, N., Emmel, C., Kupper, M., Muller-Ebert, D., et al. (2011a). Electron microscopy of particles collected at Praia, Cape Verde, during the Saharan Mineral Dust Experiment: particle chemistry, shape, mixing state and complex refractive index. Tellus 63B, 475–496. doi: 10.1111/j.1600-0889.2011.00550.x
Kandler, K., Schutz, I., Jackel, S., Lieke, K., Emmel, C., Muller-Ebert, D., et al. (2011b). Ground-based off-line aerosol measurements at Praia, Cape Verde, during the Saharan Mineral Dust Experiment: microphysical properties and mineralogy. Tellus, 63B, 459–474. doi: 10.1111/j.1600-0889.2011.00546.x
Kandler, K., Schutz, L., Deutscher, C., Ebert, M., Hofmann, H., Jackel, S., et al. (2009). Size distribution, mass concentration, chemical and mineralogical composition and derived optical parameters of the boundary layer aerosol at Tinfou, Morocco, during SAMUM 2006. Tellus 61B, 32–50. doi: 10.1111/j.1600-0889.2008.00385.x
Kaufman, Y. J., Koren, I., Remer, L. A., Tanré, D., Ginoux, P., and Fan, S., (2005). Dust transport and deposition observed from the Terra-Moderate Resolution Imaging Spectroradiometer (MODIS) space-craft over the Atlantic ocean. J. Geophys. Res. 110, S12–S16. doi: 10.1029/2003JD004436
Kelly, W. P., and McMurry, P. H. (1992). Measurement of particle density by inertial classification of differential mobility analyzer–generated monodisperse aerosols. Aerosol. Sci. Technol. 17, 199–212. doi: 10.1080/02786829208959571
Mahowald, N. M., Engelstaedter, S., Luo C., Sealy, A., Artaxo, P., Benitez-Nelson, C., et al. (2009). Atmospheric iron deposition: global distribution, variability and human perturbation. Annu. Rev. Mar. Sci. 1, 245–278. doi: 10.1146/annurev.marine.010908.163727
Moulin, C., Dulac, F., Lambert, C. E., Chazette, P., Jankowiak, I., Chatenet, B., et al. (1997). Long-term daily monitoring of Saharan dust load over ocean using Meteosat ISCCP-B2 data 2. Accuracy of the method and validation using Sun photometer measurements. J. Geophys. Res. 102, 16959–16969. doi: 10.1029/96JD02598
Muhs, D. R., Budahn, J. R., Prospero, J. M., and Carey, S. N. (2007). Geochemical evidence for African dust inputs to soils of western Atlantic islands: Barbados, the Bahamas, and Florida. J. Geophys.Res. 112, F02009. doi: 10.1029/2005JF000445
Muller T., Schladitz A., Kandler K., and Wiedensohler A. (2011). Spectral particle absorption coefficients, single scattering albedos and imaginary parts of refractive indices from ground based in situ measurements at Cape Verde Island during SAMUM-2. Tellus 63B, 573–588. doi: 10.1111/j.1600-0889.2011.00572.x
Nalli, N. R., Clemente-Colón, P., Morris, V., Joseph, E., Szczodrak, M., Minnett, P. J., et al. (2005). Profile observations of the Saharan air layer during AEROSE 2004. Geophys. Res. Lett. 32, L05815. doi: 10.1029/2004GL022028
Prospero, J. M., Glaccum, R. A., and Nees, R. T. (1981). Atmospheric transport of soil dust from Africa to South America. Nature 289, 570–572. doi: 10.1038/289570a0
Raes, F., Van Dingenen, R., Vignati, E., Wilson, J., Putaud, J.-P., Seinfeld, J. H., et al. (2000). Formation and cycling of aerosols in the global troposphere. Atmos. Environ. 34, 4215–4240. doi: 10.1016/S1352-2310(00)00239-9
Rajot, J. L., Formenti, P., Alfaro, S., Desboeufs, K., Chevaillier, S., Chatenet, B., et al. (2008). AMMA dust experiment: an overview of measurements performed during the dry season special observation period (SOP0) at the Banizoumbou (Niger) supersite. J. Geophys. Res. 113, D00C14. doi: 10.1029/2008JD009906
Ratmeyer, V., Balzer, W., Bergametti, G., Chiapello, I., Fischer, G., and Wiputta, U. (1999). Seasonal impact of mineral dust on deep-ocean particle flux in the eastern subtropical Atlantic Ocean. Mar. Geol. 159, 241–252. doi: 10.1016/S0025-3227(98)00197-2
Reid, J. S., Kinney, J. E., Westphal, D. L., Holben, B. N., Welton, E. J., Tsay, S. C., et al. (2003). Analysis of measurements of Saharan dust by airborne and ground-based remote sensing methods during the Puerto Rico Dust Experiment (PRIDE). J. Geophys. Res. 108, 8586. doi: 10.1029/2002JD002493
Rodriguez, S., Alastuey, A., Alonso-Perez, S., Querol, X., Cuevas, E., Abreu-Afonso, J., et al. (2011). Transport of desert dust mixed with North African industrial pollutants in the subtropical Saharan Air Layer. Atmos. Chem. Phys. 11, 6663–6685. doi: 10.5194/acp-11-6663-2011
Schladitz, A., Muller, T., Nowak, A., Kandler, K., Lieke, K., Massling, A., et al. (2011). In-situ aerosol characterization at Cape Verde. Part 1: particle number size distributions, hygroscopic growth and state of mixing of the marine and Saharan dust aerosol. Tellus 63B, 531–548. doi: 10.1111/j.1600-0889.2011.00569.x
Sultan, B., Labadi, K., Guégan, J.-F., and Janicot, S. (2005). Climate drives the meningitis epidemics onset in West Africa. PLoS Med 2:e6. doi: 10.1371/journal.pmed.0020006
Sunnu, A., Afeti, G., and Resch, F. (2008). A long-term experimental study of the Saharan dust presence in West Africa. Atmos. Res. 87, 13–26. doi: 10.1016/j.atmosres.2007.07.004
Tanré, D., Haywood, J., Pelon, J., Léon, J. F., Chatenet, B., Formenti, P., et al. (2003). Measurement and modeling of the Saharan dust radiative impact: overview of the Saharan Dust Experiment (SHADE). J. Geophys. Res. 108, 8574. doi: 10.1029/2002JD003273
USEPA. (1998). Subpart D- Procedures for testing performance characteristics of methods for PM10. Fed. Reg. 52, 47–55. 24729. CFR Ch.1 (7-1-98 Edition).
WHO. (2006). WHO Air Quality Guidelines for Particulate Matter, Ozone, Nitrogen Dioxide and Sulfur Dioxide. Global Update 2005. Summary of Risk Assessment. Geneva: World Health Organization.
Wu, L. (2007). Impact of Saharan air layer on hurricane peak intensity. Geophys. Res. Lett. 34, L09802. doi: 10.1029/2007GL029564
Keywords: Sahara dust, Cape Verde, PM levels, size distribution, seasonal variation
Citation: Pio CA, Cardoso JG, Cerqueira MA, Calvo A, Nunes TV, Alves CA, Custódio D, Almeida SM and Almeida-Silva M (2014) Seasonal variability of aerosol concentration and size distribution in Cape Verde using a continuous aerosol optical spectrometer. Front. Environ. Sci. 2:15. doi: 10.3389/fenvs.2014.00015
Received: 24 January 2014; Accepted: 29 April 2014;
Published online: 20 May 2014.
Edited by:
Paulo Artaxo, University of São Paulo, BrazilReviewed by:
Sagnik Dey, Indian Institute of Technology Delhi, IndiaNan Hao, German Aerospace Center, Germany
Copyright © 2014 Pio, Cardoso, Cerqueira, Calvo, Nunes, Alves, Custódio, Almeida and Almeida-Silva. This is an open-access article distributed under the terms of the Creative Commons Attribution License (CC BY). The use, distribution or reproduction in other forums is permitted, provided the original author(s) or licensor are credited and that the original publication in this journal is cited, in accordance with accepted academic practice. No use, distribution or reproduction is permitted which does not comply with these terms.
*Correspondence: Casimiro A. Pio, Department of Environment and Planning, University of Aveiro, Campus de Santiago, 3810-193 Aveiro, Portugal e-mail:Y2FzaW1pcm9AdWEucHQ=