 Xin Liu*
 Huige Liu
- School of Economics and Business Administration, Chongqing University, Chongqing, China
Educational inequality has always been the most discussed topic in China, and it may also result in a series of social problems with an expansionist trend. More specifically, education issues have possible influences on environmental activities, while some of them are unaccounted for. To fill in the gaps where few studies focus on the relationship between inequality and environmental pollution, we empirically study the impact of educational inequality on air quality as fine particulate matter (PM2.5) using panel data from 30 provinces and cities in China. Based on an analysis of the imbalanced distribution of educational level and individual behaviors, we theoretically infer that deepening educational inequality weakens individual environmental behaviors and thus aggravates environmental quality. We undertake a panel data analysis and, to a certain extent, confirm our expected negative relation. To precisely estimate the causality, we consider the spatial spillover effect to be a key property of air pollutants. We find that widening educational inequality, which is measured by the Gini coefficient of education, causes environmental deterioration. More specifically, educational inequality will inhibit the level of regional technological innovation, thereby damaging environmental quality. In addition, we estimate a series of other variables about education and find that enhancing educational expenditure and educational resources at the regional level of education would improve air quality. Our results suggest that even from an environmental perspective, governments should take measures to prevent the potential excessive centralization of educational resources. Efforts to achieve equality in education engender not only social fairness but also practical significance for environmental protection.
1 Introduction
Education is traditionally one of the most contentious livelihood issues in China. It is an essential motive force of social and intergenerational mobility, especially in developing countries. Over the past 3 decades, along with its outstanding achievement on economic growth, China has substantially promoted the average schooling years of Chinese citizens (10.71 years with working-age population up to 2019). Conversely, as the wealth of Chinese residents accumulates rapidly, public concern on environmental issues have upsurged unprecedentedly.
1.1 Literature Review
There is considerable evidence that education significantly contributes to individual benefit and has positive externality to the society (e.g., Yue, 2004; Iranzo and Peri, 2009; Ricci and Zachariadis, 2013; Chapman, and Lounkaew, 2015; Azadi et al., 2021; Hinata et al., 2021; Nguyen et al., 2021). Besides the overall level of supply, equity of educational resources allocation has also been concerned widely. Numerous studies have extensively focused on measuring educational inequality around the world, especially in developing countries and regions. Until recently, the changing trend of educational inequality from a global perspective has remained debatable; some researchers believe that absolute and intermediate educational inequality is widening (Permanyer and Boertien, 2021). Some other studies state that the educational gap has narrowed along with its higher attainability (Tasseva, 2021). As cross-national studies often draw ambiguous conclusions, it is better to discuss educational inequality issues within the scope of one country. Lam and Levison. (1991) found that Brazilian males born between 1925 and 1963 experienced both increases in mean schooling and a decrease in educational inequality; Breen et al. (2010) studied seven European countries and found class and gender differences in inequality in educational attainment had declined significantly over the 20th century. Shukla and Mishra (2019) verified the educational Kuznets Curve in India and found the turning point of inverted U-shaped relationship between mean and dispersion (measured in standard deviation, but not in Gini coefficient) of schooling occurs around a mean schooling of about 7 years. Agrawal (2014) studied another aspect of educational inequality in India and argued that although educational inequality declined significantly between 1993 and 2009, the inequality indicator in the rural sector remained much higher than that in the urban sector. Lei and Shen (2015) investigated educational inequality in China and found it deteriorated for both educational attainment and expectations over the past several decades.
As a prevalent social and economic issue, educational inequality may significantly affect other economic variables and social issues. Persistently high level of educational inequality might aggravate the mismatch of resources and cause low efficiency of economic activities in a variety of ways. The previous literature has mainly focused on the impact of educational inequality on income inequality. The latest research by Clement and Piaser (2021) showed a negative relationship between income and educational inequality. The research in Brazil, as mentioned earlier (Lam and Levison, 1991), also indicated that a reduction in educational inequality would fundamentally improve the earnings inequality. Checchi and van de Werfhorst (2017) found skill inequality to be a more important predictor of income inequality than educational attainment inequality, thus supporting the prediction of the neoclassical economic theory. Munir and Kanwal (2020) confirmed the positive impact of educational inequality on income inequality in six South Asian countries and investigated heterogeneity in different educational stages. The controversial findings of Yang et al. (2008) asserted that reducing educational inequality did not improved the income inequality in China, while income inequality could aggravate educational inequality. In their later study, Yang and Huang (2010), investigated the mechanism between educational and income inequality and found that it was necessary for educational inequality to be sufficiently low to reduce income inequality. In addition to income inequality, several other variables are considered when studying educational inequality. Danler and Pfaff (2021) testified to the positive association between educational inequality and inequality in life expectancy. Xiao and McCright (2012) used panel data of 29 provinces in China between 1988 and 2006 and studied the effect of human capital inequality on total factor productivity (TFP). Their results showed that such educational inequality had a significantly negative effect on TFP growth in China.
Several studies have focused on education vis-à-vis its seemingly close link with environmental activities and behaviors (Wang, 2008; Xiao and McCright, 2012; Chen et al., 2019). Moreover, the academic community usually considers income inequality and TFP as important independent variables in environmental studies, and it can be summarily concluded that educational inequality probably has an impact on environmental pollution through several special mechanisms. The analysis of both educational inequality and environmental quality within a framework should be helpful for public policy-making. However, the possible relationship between educational inequality and environmental behavior has been barely discussed in previous literature. Thus far, the impact of educational inequality on environmental pollution remains unaccounted for. In this study, we focus on fine particulate matter (PM2.5), which is the most representative air pollutant. Our interest in these questions ensues some contributions.
With the advancement of information technology, the issue of educational inequality is gradually changing. The impact of information technology on users is becoming increasingly profound, and such an impact has both positive (Abbas et al., 2019a) and possibly negative effects (Lebni et al., 2020; Khazaie et al., 2021). On the one hand, the dissemination of more negative or misleading information and news has negative influences on society and residents (Su et al., 2021). On the other hand, the coronavirus disease 2019 (COVID-19) epidemic also promotes knowledge sharing, which leads to the accelerated integration of traditional education and information technology, thus improving the availability of educational resources (Maqsood et al., 2021), and online education may further affect fairness in education to a certain extent. Therefore, exploring the relationship between educational inequality and environmental problems seems more interesting and significant.
1.2 Problem Statement and Research Objectives
With the rapid development of China’s economy, its overall educational level has significantly improved (Yuan et al., 2020), while the equality of education and its related social problems have become increasingly important (Yang et al., 2008; Yang and Huang, 2010; Lei and Shen, 2015). However, China’s attention to environmental protection has increased to an unprecedented level in recent years. Albeit there are many high-level studies on the factors that cause and affect China’s environmental pollution (e.g., Guan et al., 2019; Liu et al., 2021; Mei et al., 2021; Zhao et al., 2021), merely a few have focused on the relationship between the distribution of education and environmental pollution. With the continuous promotion of China’s education reform, it is important to study whether potential changes in educational inequality will result in environmental pollution.
Our research aims to investigate the potential relationship between educational inequality and environmental pollution through theoretical analysis, and then quantify the impact of educational inequality on some specific environmental variables based on empirical research.
The Objectives Are as Follows:
1) To estimate the degree of educational inequality in China based on the Gini coefficient of education at the provincial level;
2) To estimate the impact of some educational variables on environmental variables;
3) To accurately assess the impact of educational inequality on air pollution considering the spatial spillover effect of air pollutants;
4) To explore the internal mechanism of how educational inequality works on the environment.
Our theoretical analysis starts with the known Lorenz curve, which shows the degree of inequality of some schooling distribution. In this analysis, education is the fundamental determinant of individual environmental behaviors, and the overall beneficial behaviors are influenced by educational inequality. With the help of former literature and its mathematical contribution to inequality measurement and stochastic dominance, we infer that educational inequality might theoretically have a positive impact on pollution under a series of assumptions.
We collect data from China Statistical Yearbook, the China Statistical Yearbook on Environment, the China Statistical Yearbook on Education, the China Statistical Yearbook on Population, CNRDS, and CSMAR covering schooling years and PM2.5 of 30 Chinese provinces from 2000 to 2016. We form the Gini coefficient of education—most commonly used in measuring educational inequality (e.g., Thomas et al., 2001; Xiao and McCright, 2012; Agrawal, 2014; Yang et al., 2014; Yu et al., 2015; Munir and Kanwal, 2020), standard deviation of education and index of urban and rural educational inequality to measure and represent the educational inequality.
Based on the dataset mentioned above, we use panel data regression for this empirical study and investigated how widening educational inequality affects air quality. For the precision of our estimation, we consider the spatial spillover effect. Our major contribution follows that:
1) This study expands the research framework of the interaction between social and environmental problems. Studying the impact of educational inequality, causing wide public concern, on environmental quality could provide new ideas for the government to alleviate environmental pollution from the perspective of educational inequality.
2) Theoretically, this study expands the analysis of educational inequality through the mathematical thought of the Lorenz curve and stochastic dominance theory; then, we try to explain the impact of educational inequality on environmental quality by this expansion. Because of this theoretical method, we deduce that educational inequality probably has a negative impact on environmental quality by influencing residents’ environmental behavior and confirm such conjecture in our empirical part.
3) Empirically, combined with spatial factors, this study estimates the specific impact of educational inequality on environmental quality for the first time. This study also expands the research perspective of the impact of educational level on environmental quality. We use the panel datasets of 30 provinces in China considering the spatial factors to estimate the causality in which we are interested. We also measure the impact of educational level on environmental quality by using different indicators that can represent the regional educational level. Finally, it is concluded that educational inequality has a negative effect on environmental quality and educational level has a positive effect on environmental quality.
This study is organized as follows. We establish the theoretical analysis in Section 2. We provide methods in Section 3. The results of the impact of educational inequality on environmental pollution are stated in Section 4. In Section 5, we discussed the results of the study in combination with the real society. Finally, Section 6 concludes.
2 Theoretical Analysis
Based on the brilliant research about decision-making under uncertainty (Hanoch and Levy, 1969; Harder and Russell, 1969; Rothschild and Stiglitz, 1969; Atkinson, 1970) proved that if the Lorenz curve for a specified income distribution, for example, a distribution with probability density function f(x), lies above another one for all x, then the former is preferred to the latter from an overall utility perspective. Inspired by previous literature, we try to study qualitatively how educational inequality affects individual environmental behaviors and our theoretical analysis infers that educational inequality aggravates air pollution—to some extent confirmed by our empirical study.
Consider a population, in which educational level of individual measured in years is denoted by y. There are several kinds of different possible distributions of educational level of residents, denoted by
and the educational inequality is shown by a function similar to Lorenz curve defined by Atkinson (1970), which could be given by
where
for any y on
Given
In this population, environmentally friendly behaviors (e.g., recycling, conserving energy, or any other public environmental behaviors) affected by individuals’ education level are represented by the function b(y) (assumed to be twice continuously differentiable). In the previous literature, some argued that better educated individuals perform better on environmental issues (e.g., Wang, 2008; Wang and Han, 2016; Amore et al., 2019), that is, more years of education related to more environmental behaviors [b’(y) > 0]. Furthermore, assume that b’’(y) < 0.
To manifest how educational inequality affects environmental protection, define average level of environmental behaviors in this population as
The environmental effects of an educational level distribution dominating another imply:
Based on the mathematical ideas of stochastic dominance theory (Hanoch and Levy, 1969), it could be proved that if inequality 1) holds for two distributions mentioned above, then inequality 2) and subsequently inequality 3) would also hold. Eventually, we approach our important conclusion of theoretical analysis.
Proposition. Given two distributions mentioned above, if condition
Our proposition implies that educational inequality could reduce positive environmental behaviors. In other words, educational inequality should aggravate environmental pollution, which will be confirmed by our following empirical study.
3 Materials and Methods
3.1 Overview
Based on the aforementioned theoretical analysis, this study aims to examine the two major themes of educational inequality and environmental quality to conduct an empirical analysis. First, this study mainly used the spatial autoregressive model to estimate the impact of educational inequality on environmental quality. Considering that China has a large geographic space and regional development is not balanced, this study divides the sample into eastern, middle, and western regions, and conducts a heterogeneous analysis. Second, considering that educational inequality and environmental quality belong to the two macro aspects of the economy and society, the connection between the two may need to rely on intermediate variables. Our study analyzes the mechanism of the link between educational inequality and environmental quality. Ultimately, educational inequality is a relative variable that involves distribution. To fully analyze the impact of education on environmental quality, we also appraise the impact of absolute educational level on environmental quality.
3.2 Variables and Data
3.2.1 Explanatory Variables
The explanatory variable in this study is the degree of educational inequality. We select the Gini coefficient of education (
Similar to Gini coefficient of income—the most prevalent indicator for measuring income inequality—Gini coefficient of education can be calculated using basic data on enrollment rate, educational input, and educational attainment (Mass and Criel, 1982; Thomas et al., 2003). The education attainment is the ultimate goal of education. Compared with other indicators, such as enrollment rate or educational input, educational attainment is commonly considered as a better barometer of the overall educational level of a certain population, and it is also the most appropriate indicator to reflect the human capital stock (Psacharopoulos and Arriagda, 1986). Based on the educational attainment data of the population over 6 years old from the China Statistical Yearbook on Population, we estimate the Gini coefficient and the standard deviation of education in 30 provinces (cities) of China from 2000 to 2016 by applying the improved formula of Thomas et al. (2003). The calculation formula is as follows:
Where
However, the imbalance between urban and rural development is a long-standing problem in China. Paying attention to the impact of educational inequality between different groups on environmental quality is also a robust perspective to fully explore the relationship between educational inequality and environmental quality. Therefore, in this study, we also selected the ratio of the average schooling years of urban and rural residents (
3.2.2 Explained Variables
Air pollution is a pollution indicator that is closely related to individual microscopic activities and life. This study uses the annual average concentration of PM2.5 as an indicator of environmental pollution to reversely characterize environmental quality. The concentration data of PM2.5 are originally derived from the grid data of global concentration average of PM2.5 based on satellite monitoring released by the social and economic data and application center of Columbia University (Van Donkelaar et al., 2015). We further use ArcGIS software to parse the grid data into the annual average PM2.5 concentration data of China’s provincial level.
3.2.3 Control Variables
In addition to educational inequality, other economic and social variables affect environmental quality. Based on the existing literature and considering the availability of data, in this study, we select the proportion of the secondary industry (
3.2.4 Path Variables
Educational inequality and environmental quality are two relatively macroscopic variables. The connection between the two may need to rely on a specific intermediate transmission path. Therefore, this study attempts to explore a possible mechanism path between the two. Technological innovation is a manifestation of regional human capital. The difference in the regional technological innovation level is a possible result of educational inequality. The effect of the level of regional technological innovation on environmental quality has been confirmed in previous studies. Therefore, this study selects the regional technological innovation level (
3.2.5 Education-Level Variable
A lot literatures have already focused on the sustainable development of human (e.g., Paulson, K et al., 2021; Abbas, J et al., 2019c) or environment (e.g., Gracia and Siregar, 2021). From the perspective of economic analysis, this problem largely depends on the continuous investment of funds. Therefore, to compare the analysis results of the effect of educational inequality on environmental quality and to consider educational issues and environmental issues from more perspectives, this study introduces three variables to analyze the impact of regional educational levels on environmental quality. Specifically, the regional educational funding input (
3.3 Sample Size and Descriptive Statistics
We develop a panel dataset from 2000 to 2016 spanning 30 Chinese Provinces (data from Hong Kong, Macao, Taiwan, and Tibet are partially missing). The data are sourced from the China Statistical Yearbook, the China Statistical Yearbook on Environment, the China Statistical Yearbook on Education, the China Statistical Yearbook on Population, CNRDS and CSMAR. A small amount of missing data are obtained by interpolation. In the following empirical analysis, to alleviate the problem of heteroscedasticity and eliminate the impact of inflation, we took the logarithm of some variables and deflated all nominal variables expressed in currency based on 2000.
The descriptive statistical characteristics of all the variables in this study are listed in Table 1. The Gini coefficient of education fluctuates between 0.169 and 0.393, showing that the degree of educational inequality varies significantly among provinces in China. The urban–rural educational inequality fluctuates between 1.079 and 1.806, with an average of 1.331. This shows that the degree of educational inequality within administrative divisions is equally large under the dual structure of urban and rural areas in China. The overall and partial balance of education are aspects that we should pay attention to. To show the correlation between the main explanatory variables more clearly, we drew distribution maps of PM2.5 concentration and the Gini coefficient of education, as shown in Figure 1 and Figure 2. The figures illustrate that the distribution of PM2.5 concentration has the following trend and correlation with the distribution of Gini coefficient of education, especially in the western region.
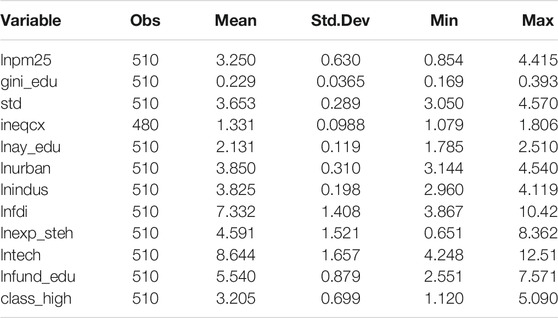
TABLE 1. Summary statistics for all the variables.
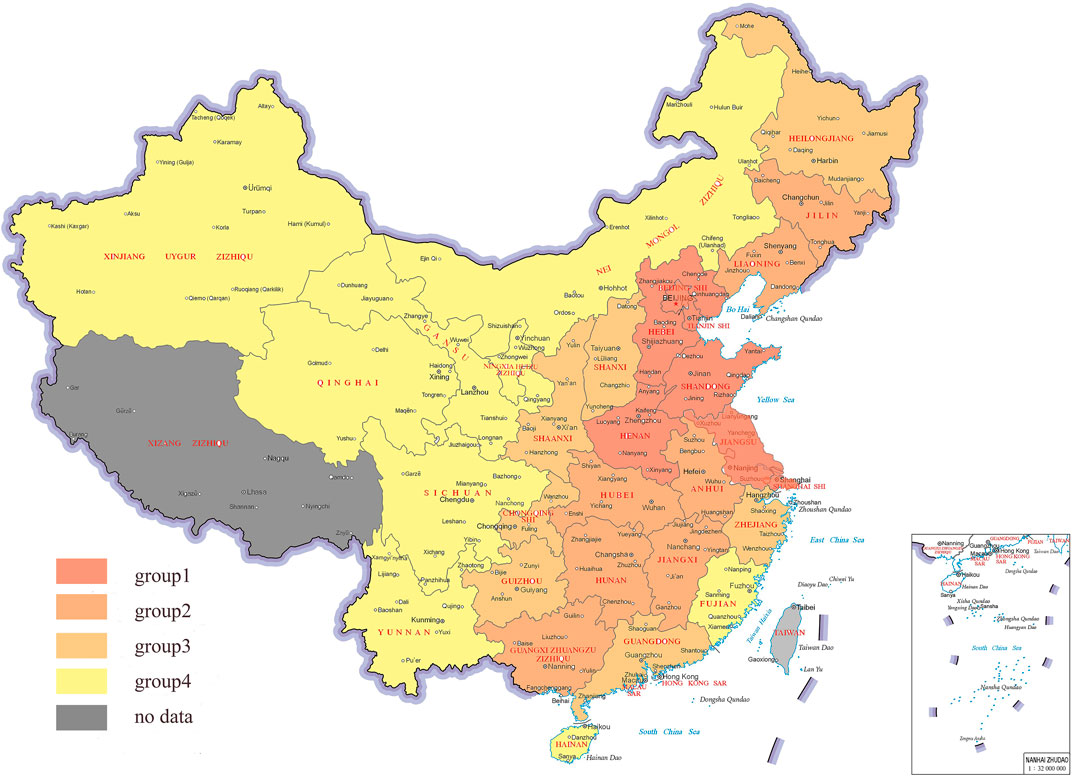
FIGURE 1. PM2.5 concentration distribution. Notes: We sort PM2.5 concentrations from large to small and divided them into four groups. In the figure, group 1 represents the high pollution group, group 2 represents the medium pollution group, group 3 represents the low pollution group, and group 4 represents the lowest pollution group. From 1 to 4, the degree of pollution gradually decreased.
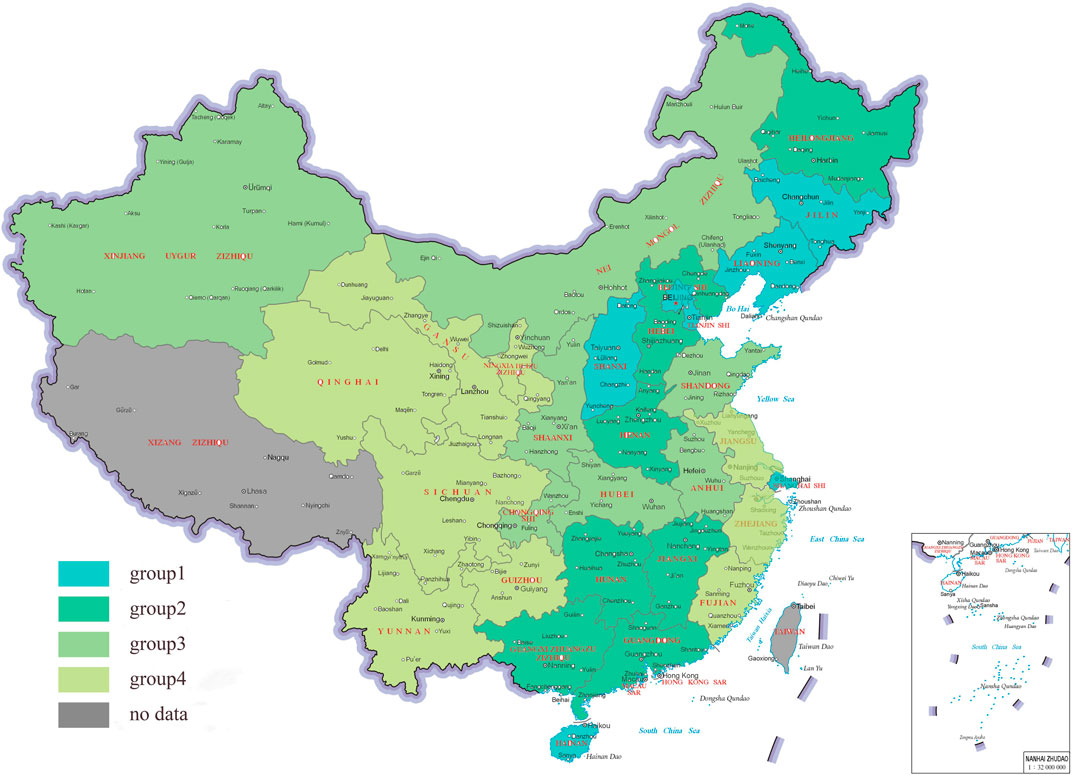
FIGURE 2. The distribution of educational inequality. Notes: We rank the Gini coefficient of education in each province from small to large in 2016 and divide it into four groups. In the figure, group 1 represents more equality, group 2 represents equality, group 3 represents inequality, and group 4 represents the most inequality. From 1 to 4, the degree of inequality gradually increased.
3.4 Spatial Econometric Model
In recent years, more and more studies (e.g., Yang and Xu, 2020; Local Burden of Disease, 2021) take spatial effects into account. Therefore, considering the spatial diffusion of PM2.5, we mainly study the relationship of educational inequality and environmental quality by constructing a spatial regression model.
3.4.1 Spatial Autocorrelation Test
The spatial correlation of variables is the basis for building a spatial econometric model, so the spatial correlation test must be carried out before building a spatial measurement model. Notably, PM2.5 concentrations are spatially dependent because of their strong spatial diffusion (Pan et al., 2015; Shao et al., 2016). That is, pollutants in a region are not only related to local emissions but also affected by neighboring regions. In our study, the global and local spatial correlation indexes in ESDA are used to test the spatial spillover effect of PM2.5, and the
In the calculation of
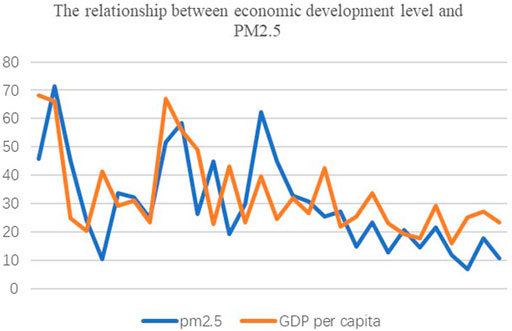
FIGURE 3. The relationship between economic development level and PM2.5. Notes: In Figure 3, we show the relationship between the economic development level and PM2.5 concentration of each province in 2016.
Based on the spatial weight matrix of the geographic distance (Wd), the formula is defined as follows:
where
The spatial weight matrix of the geographic economic distance can not only consider the influence of geographic distance but also reflect economic factors have regional spillover and radiation effects. Therefore, it can reflect the degree of spatial correlation between cross-sectional elements more objectively (Shao et al., 2016). The specific formula is as follows:
where
Based on the above-mentioned spatial weight matrix, this study calculates the
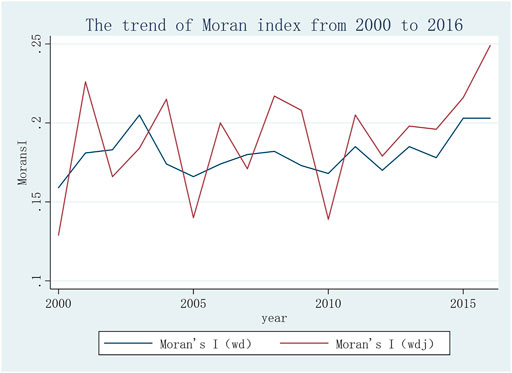
FIGURE 4. Moran index from 2000 to 2016 under two spatial weight matrices.
To illustrate the spatial correlation of PM2.5, we also provide a scatter diagram of the provincial PM2.5 concentration distribution in the beginning and end years of the sample interval. As shown in Figure 5 and Figure 6, the graph illustrates that most of the provinces are in the first and third quadrants, thereby further showing that PM2.5 has a positive spatial spillover effect.
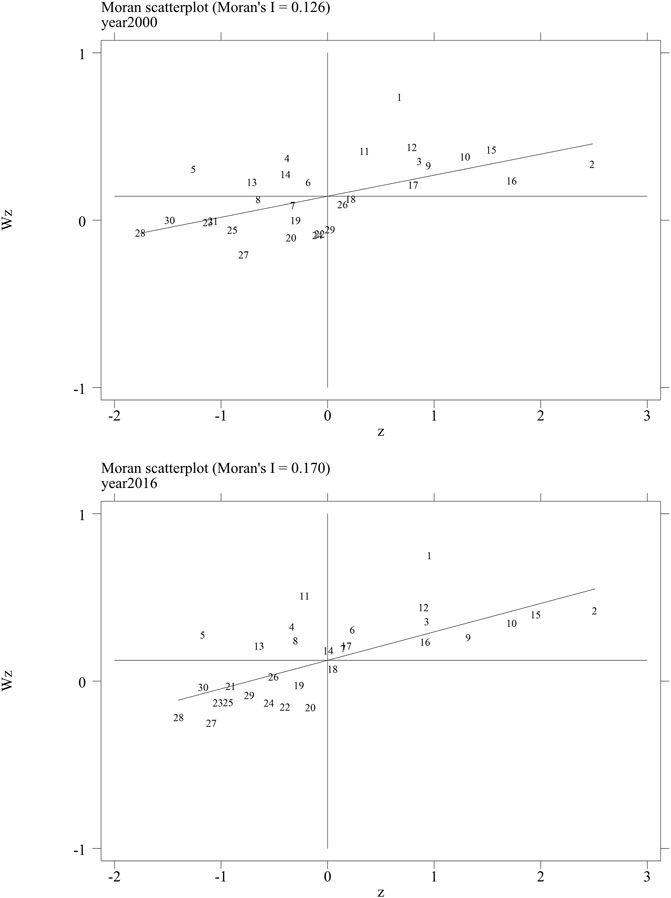
FIGURE 5. Moran scatter under the spatial weight matrix of geographical distance in 2000 and 2016.
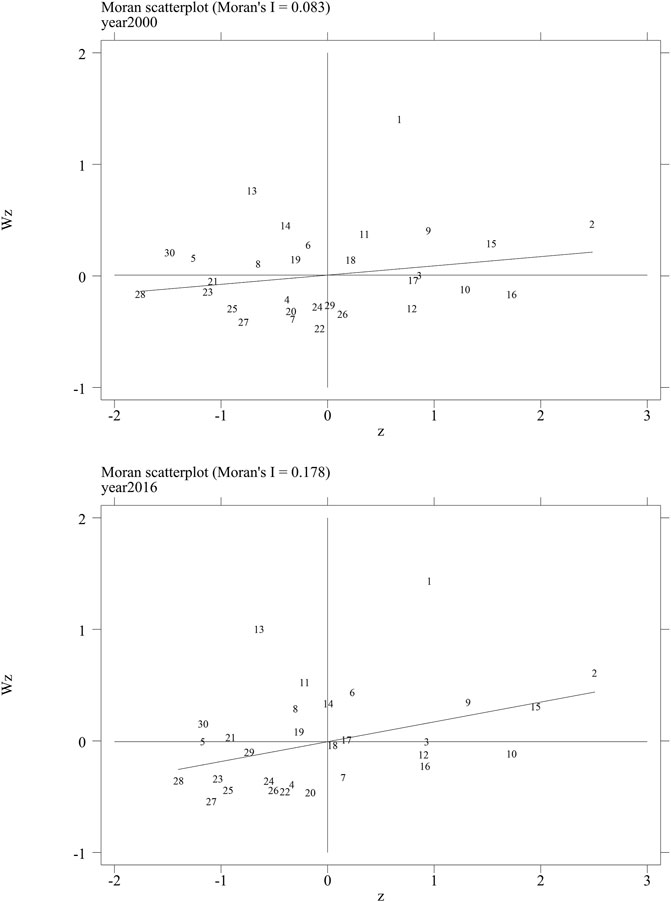
FIGURE 6. Moran scatter under the spatial weight matrix of geo economic distance in 2000 and 2016.
3.4.2 Model Specification
Based on the aforementioned analysis of the spatial correlation of PM2.5, and considering the spatial spillover effect, this study constructs a spatial autoregressive model to further analyze the relationship between educational inequality and environmental quality. The model is presented as follows:
Among them, the
4 Results
4.1 Analysis of Non-Spatial Panel Model Results
To compare our results with those of the spatial panel model, we first use the non-spatial panel model for analysis. The results are shown in Table 2. The first column shows the regression result of the effect of the Gini coefficient of education on environmental quality. Evidently, educational inequality has a significant negative effect on environmental quality, and this result is in line with the expectations of the aforementioned theories. The second column shows the regression results after adding the corresponding control variables. The third column entails the time lag of education as a way of human capital accumulation and estimates the impact of the lagging Gini coefficient of education on the environmental quality. We find that after adding the corresponding control variables, the effect of the Gini coefficient of education on environmental quality is correspondingly weakened, but it still has a strong negative effect. In the fourth and fifth columns, the standard deviation of education and the urban–rural educational inequality also have a negative impact on environmental quality, which further shows that the negative impact of the regional imbalance of education on environmental quality is sound. In summary, the degree of educational inequality, represented by many aspects, has a significant negative impact on environmental quality. Possible explanations for this conclusion include the following aspects: first, education affects residents’ environmental awareness, and educational inequality may affect residents’ environmental behavior, which in turn affects environmental quality; second, educational inequality leads to income inequality through the imbalance of human capital accumulation, which intensifies environmental pollution. Thus, educational inequality may be detrimental to technological innovation, thereby deteriorating environmental quality. Finally, educational inequality may affect environmental quality by restraining the upgrading of industrial structure. This suggests that to alleviate environmental pollution, we should not only focus on the government and enterprise level but also pay attention to the social level, promote the equalization of education, and facilitate the improvement of environmental quality from a more macroscopic and long-term perspective.
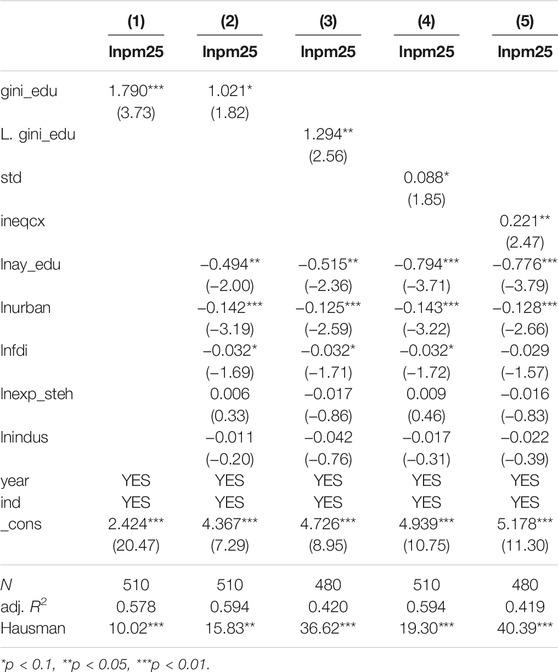
TABLE 2. The regression results of educational inequality.
In the regression results of the control variables, educational level, urbanization and foreign direct investment (FDI) all have a significant effect on environmental quality. This shows that, in terms of macro policies, vigorously promoting the process of urbanization is a desirable move to alleviate environmental pollution. Meanwhile, we can also alleviate regional pollution by vigorously introducing foreign capital, promoting capital mobility, and making full use of the technological innovation effect brought by FDI. From another perspective, based on promoting the equalization of education, it is necessary to increase educational investment to ensure the absolute supply of educational level, improve the overall level of residents’ enjoyment of educational resources, and promote the improvement of residents’ educational level to alleviate environmental pollution. The proportion of industry has a positive impact on environmental quality, but it is not significant. This may be because the polluting industry pays more attention to innovation in technology and process than other industries while generating pollution, which offsets part of the impact of pollution. The impact of science and technology expenditure on environmental quality is uncertain and insignificant. A possible reason for this is that the application of fiscal expenditure to production technology, process upgrade, and innovation requires a long intermediate transmission process and influencing factors.
What are the results of the above-mentioned correlation in geographic space? We need to further verify the Spatial autoregressive model.
4.2 Analysis of Spatial Autoregressive Model Results
We established a spatial autoregressive model and used a geographic distance matrix and geographic economic distance matrix to perform regression analysis. The results are shown in Supplementary Table S1. The first and second columns are the regression results of the Gini coefficient of education on the environmental quality under the spatial weight of geographic distance and economic geographic distance, respectively. The third and fourth columns are the regression results of the standard deviation of education under the two spatial weight matrices. The fifth and sixth columns are the regression results of urban and rural educational inequality under the two matrices, respectively. It can be seen from the table that after considering the spatial spillover effects, the negative impact of educational inequality on environmental quality remains significant. Compared with the regression results that do not introduce spatial factors in the previous section, we find that the impact of all the indicators of educational inequality on environmental quality has been reduced. This shows that the spatial correlation of PM2.5, which is an important factor that affects the negative impact of educational inequality on environmental quality. Nonetheless, Comparing the impact coefficients of the three educational inequality indicators on the environmental quality under the two spatial weight matrices, it can be found that relative to the geographic spatial weight matrix, under the economic geographic spatial weight matrix considering economic factors, educational inequality has a greater impact on environmental quality. That is, in addition to the spatial spillover of geographic distance, the spatial correlation of the economy is also an important aspect of the spatial spillover characteristics of PM2.5. In the application of spatial econometric models, LESAGE J,PACE R K. (2009) have proposed the use of partial differential methods to decompose the regression results of direct and indirect effects to test whether the spatial spillover effect exists. We also used this method to study the direct and indirect effects (see Table 3). It can be found that educational inequality has a significant negative effect on the local environmental quality. However, the indirect effect is not significant, which proves that local educational inequality has no impact on the environmental quality of neighboring areas, and the degree of local educational inequality only has a negative impact on the local environmental quality. This may be because the degree of educational inequality in the region is a relatively regional objective variable. Chinese administrative division barriers cause educational inequality to affect only the residents of the region and therefore only have a major impact on the environmental behavior of the residents in the region. The degree of the educational inequality of urban and rural residents has the most significant negative impact on the environmental quality of the region, which also proves that the serious imbalance of educational resources has an important impact on environmental quality under the dual urban–rural structure in China. When formulating policy ideas to alleviate environmental pollution, more attention must be paid to the equalization of urban and rural education.
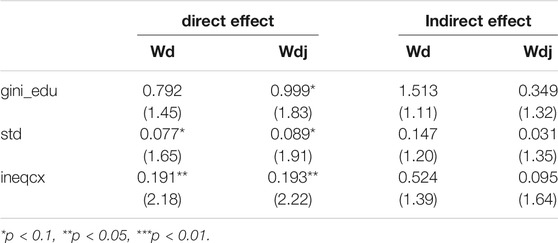
TABLE 3. Decomposition of direct and indirect effects.
4.3 Heterogeneity Analysis
Considering the possibility of heterogeneity among the samples, we divide the 30 sample provinces into three parts—east, middle, and west—according to the classification standard of the national geographic system. Table 4 presents the regression results. We find that the degree of educational inequality has a negative impact on environmental quality in the eastern and middle regions, but not in the eastern region. We suspect that the higher level of economic and technological development in the eastern region may conceal the impact of educational inequality on environmental quality. The impact of educational inequality on environmental quality in western region is positive. This abnormal phenomenon might result from the regional imbalance in development in China. An increase in the relatively low level of education in some parts of western areas may temporarily raise educational inequality, while it benefits the environment. This result highlights the need to pay more attention toward alleviating educational inequality in the middle region to better achieve pollution control effects. This phenomenon is also in line with objective reality. The middle region has a large population and vast territory, and it is the backbone of national development. By vigorously promoting the equalization of education in the middle region, environmental problems can be alleviated more effectively.
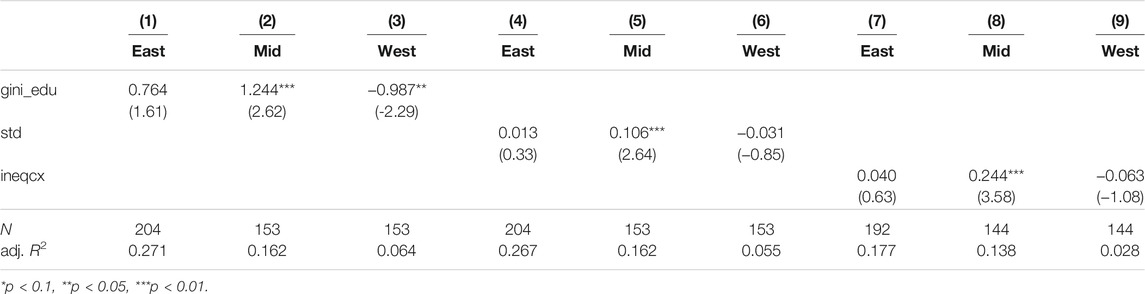
TABLE 4. Heterogeneity analysis.
4.4 Path Analysis
Educational inequality and environmental pollution are two major social issues at the macro level, which belong to different areas of the economy and society. The mutual influence between the two may depend on a specific intermediate path. The level of regional technological innovation may be hindered by inequality in regional education, and regional technological innovation can improve environmental quality. Therefore, this study attempts to verify the level of regional technological innovation as one of the ways whereby educational inequality affects environmental quality to explore the complex impact mechanism between educational inequality and environmental quality. The results are listed in Supplementary Table S2. It can be found that in the regression results of the Gini coefficient of education and urban-rural educational inequality, as the degree of educational inequality deepens, the regional technical level declines. Although the standard deviation of education has a positive impact on the level of technological progress, it is not significant. This shows that the degree of educational inequality can have a negative impact on environmental quality by restraining regional technological progress. This result suggests that to achieve better environmental governance effects, we must create a good technological innovation environment, while alleviating educational inequality, and unblock the mitigation effect of educational inequality on environmental pollution.
4.5 The Regression Results of Regional Educational Level
Because educational inequality is a relative variable, it represents the distribution of education. In the above-mentioned analysis, we have verified the negative impact of educational inequality on environmental quality. To better understand the impact of education on environmental quality, in this section, we empirically analyze the impact of the absolute amount of regional educational level on environmental quality to contrast it with the relative variable of educational inequality and provide us with more reference in policy instructions. We examine the impact of regional educational level on environmental quality from different perspectives, and the results are shown in Supplementary Table S3. In the first column, we estimate the impact of the average schooling years on the air quality and find that with the promotion of the average schooling years of residents, the regional air quality also gradually improves. Every 1% increase in the average schooling years will decrease the PM2.5 concentration by 0.727%, which, to some extent, confirms the positive relationship between educational level and environmental quality. A similar result reported in the second column shows the impact of the number of high school classes per 100 people on air quality. The p-value is 0.101, which indicates that the regional high school education resources have a significant positive impact on environmental quality. The tired column shows the regression results of educational expenditures on environmental quality. The higher the regional educational expenditures, the better the educational conditions, which has a positive effect on environmental quality. This also suggests that when contemplating ways to improve environmental quality from an educational perspective, in addition to promoting the equalization of education, we must also vigorously increase the absolute level of education to eliminate the negative impact of educational inequality on environmental quality. It is necessary to work from two dimensions: eliminating the negative impact of educational inequality on environmental quality and improving the positive impact of educational level on environmental quality to achieve better environmental quality improvement effects.
5 Discussion
5.1 Findings
Specific findings are as follows:
Finding 1: Educational inequality, measured by the Gini coefficient of education and standard deviation of education, has a significant negative impact on environmental quality. Considering the spatial spillover effect of PM2.5, such a negative impact is weakened. Based on the spatial econometric analysis, inequality in one region has a much more significant impact on the local environment than its neighbors.
Finding 2: Urbanization and FDI significantly improve environmental quality, while industrial structure, science and technology expenditure do not.
Finding 3: Educational inequality in central China has a significant negative impact on environmental quality. Eastern China also shows a negative but insignificant impact, while western China shows a significant positive impact.
Finding 4: Educational inequality will inhibit the level of regional technological innovation, thereby threatening environmental quality.
Finding 5: Regional educational expenditure and average schooling years can significantly improve local environmental quality, while it is not significant from the perspective of the number of high school classes per 100 people.
Finding 1 corresponds to the theoretical analysis. Based on a framework with a concave behavior (sometimes utility) function (Hanoch and Levy, 1969; Harder and Russell, 1969; Rothschild and Stiglitz, 1969), a more balanced distribution is barely undesirable. Finding 2 is consistent with those of Zeng and Eastin (2012) and Zhu et al. (2016), who have demonstrated that FDI or urbanization is associated with lower levels of pollution, but inconsistent with those of Demena and Afesorgbor (2020) and Chen et al. (2020), who have demonstrated that FDI or urbanization has a negative or inapparent impact on the environment. Similar to many environmental and economic studies focusing on China (e.g., Zhan, 2018; Chen et al., 2020), Finding 3 shows significant regional heterogeneity. The study of regional and geographical factors should be one of the core objectives of future research. Finding 4 reveals one of the paths by which educational inequality leads to environmental deterioration, while more possible mechanisms remain ambiguous. This is a limitation of the present study.
5.2 Educational Inequality and Social Change Under the COVID-19 Pandemic
At present, the main background issue of recent sociological research is the COVID-19 epidemic. Although some industries (e.g., health insurance) have developed during the epidemic (Ye et al., 2021), the adverse economic effects are more evident (Rababah et al., 2020; Shen et al., 2020; Lee and Lu, 2021). The epidemic has a significant impact on the companies’ financial situation (Shaharuddin et al., 2021), and robust financial strategies are conducive toward improving companies’ performances during the epidemic (Golubeva, 2021). Meanwhile, the change in the company’s office mode also poses a challenge to the company’s management level (Muttaqin et al., 2020).
In addition, the negative impact of the pandemic and menta on humans is both physical and psychological, while the latter one could also cause mental diseases (Abbas et al., 2019b; Aqeel et al., 2021). Moreover, taking measures to address the epidemic often has high social costs and ethical disputes (Su et al., 2021). In the post-epidemic era, information exchange and information technology are not only very important for economic recovery (Li et al., 2021) but also may have a certain impact on educational inequality.
In general, the impact of COVID-19 on inequality in education remains unclear. On the one hand, more online courses and conferences promote the exchange of knowledge and reduce the acquisition cost of some educational resources during the COVID-19 pandemic (Maqsood et al., 2021). On the other hand, whether changes in the economic situation will lead to an excessive concentration of educational resources is now a very interesting question.
5.3 Policy Implication
Our major finding on educational inequality suggests that the pursuit of educational equalization not only entails social fairness but also presents practical significance for environmental protection. When solving educational inequality and environmental problems, the two can be combined for policy design to achieve the maximum effect of the policy. The government should vigorously increase educational investment, carry out educational resource construction, improve the educational level of residents, and focus on solving the problem of regional educational inequality to achieve a win–win situation in alleviating educational inequality and environmental problems simultaneously.
Specifically, to solve environmental problems in the direction of alleviating educational inequality, the focus is on both reducing the negative impact of educational inequality on environmental quality and improving the positive impact of educational level on the environment. More measures are presented as follows: first, promote the equalized development of education at the overall global level and gradually deregulate household registration and administrative divisions. Second, it is necessary to break the imbalance of urban and rural education and ensure the equalization of education among different groups. Third, attention should be paid toward improving the absolute level of regional educational resources and increasing the construction of educational facilities. Finally, provide a suitable environment for technological innovation, strengthen the protection of intellectual property rights, promote regional innovation vitality.
6 Conclusion
This study analyzes the impact of educational inequality on environmental quality by establishing a theoretical and empirical framework. Our theoretical analysis infers that educational inequality should have a negative impact on environmental behaviors and thus cause more pollutant emissions, which is then confirmed by the estimation result of our empirical model. Therefore, we conclude that widening educational inequality would lead to higher environmental pollution. Meanwhile, this study analyzes the level of regional technological innovation as the path through which educational inequality affects environmental quality and concludes that the deepening of educational inequality will inhibit the regional technological innovation level, which will subsequently have an impact on environmental quality. Furthermore, this study divides the research sample into three parts: east, middle, and west. It is found that educational inequality in the eastern and middle regions has a negative impact on environmental quality, while the western region shows that as the degree of educational inequality deepens, environmental quality improves. In addition, we estimate the impact of the regional level of education on air quality and testify the negative relationship between some typical variables (average schooling years, education expenditure, the number of senior high school classes per 100 students) of educational level and air pollutants.
A limitation of our study is that our model implies the negative impact of an imbalanced level of education on individual environmental behaviors, while how exactly this internal connection is established is not revealed. Except for technological innovation, educational inequality may affect other factors that cause environmental issues. However, these potential mechanisms remain unaccounted for and should be empirically verified. To improve our theoretical analysis in future research, we expect to introduce more assumptions and specifications to characterize individual behaviors and recognize the interactions among groups at different levels of education. Another limitation is that there is a certain deviation in the accuracy of the estimation results, and the methodology of our study does not completely solve the problem of missing variables. Although we have controlled the relevant factors that affect environmental quality from as many aspects as possible, limited by the availability of data and the unpredictability of some micro-variables, the analysis of this study cannot cover most of the economic and social factors that affect environmental quality. Consequently, the impact of other factors on environmental quality cannot be completely eliminated, which leads to the inability to accurately estimate the degree of the impact of educational inequality on environmental quality. We consider adding more socioeconomic variables that affect environmental quality at the micro-individual level, such as enterprises and residents, and improve the accuracy of estimating the impact of educational inequality on environmental quality.
Data Availability Statement
The original contributions presented in the study are included in the article/Supplementary Material, further inquiries can be directed to the corresponding author.
Author Contributions
XL: Supervision, Methodology, Formal analysis, and Project administration. HL: Software, Validation, and Investigation. JY: Conceptualization, Writing—Original Draft, Writing—Review and Editing.
Funding
This work was supported by the National Office for Philosophy and Social Sciences of China (grant number 17BGL144); the Fundamental Research Funds for the Central Universities (grant number 2020CDJSK02XK10); the Chongqing Social Science Planning Office Social Science Planning Major Project (grant number 2021ZDSC12).
Conflict of Interest
The authors declare that the research was conducted in the absence of any commercial or financial relationships that could be construed as a potential conflict of interest.
Publisher’s Note
All claims expressed in this article are solely those of the authors and do not necessarily represent those of their affiliated organizations, or those of the publisher, the editors and the reviewers. Any product that may be evaluated in this article, or claim that may be made by its manufacturer, is not guaranteed or endorsed by the publisher.
Acknowledgments
Thanks to School of Economics and Business Administration, Chongqing University and research team members Dewang Wu and Yuting Shi for their suggestions and help in the research and writing process of this study.
Supplementary Material
The Supplementary Material for this article can be found online at: https://www.frontiersin.org/articles/10.3389/fenvs.2022.813254/full#supplementary-material
Footnotes
1http://www.moe.gov.cn/fbh/live/2020/52692/mtbd/202012/t20201201_502753.html.
References
Abbas, J., Aman, J., Nurunnabi, M., and Bano, S. (2019c). The Impact of Social media on Learning Behavior for Sustainable Education: Evidence of Students from Selected Universities in Pakistan. Sustainability 11 (6), 1683. doi:10.3390/su11061683
Abbas, J., Aqeel, M., Abbas, J., Shaher, B. A., and Zhang, W. (2019b). The Moderating Role of Social Support for Marital Adjustment, Depression, Anxiety, and Stress: Evidence from Pakistani Working and Nonworking Women. J. Affective Disord. 244, 231–238. doi:10.1016/j.jad.2018.07.071
Abbas, J., Hussain, I., Hussain, S., Akram, S., Shaheen, I., and Niu, B. (2019a). The Impact of Knowledge Sharing and Innovation upon Sustainable Performance in Islamic Banks: A Mediation Analysis through an SEM Approach. Sustainability 11 (15), 4049. doi:10.3390/su11154049
Agrawal, T., 2014. Educational Inequality in Iural and Urban India. International Journal of Educational Development, Vol.34, 11-19. doi:10.1016/j.ijedudev.2013.05.002
Amore, M. D., Bennedsen, M., Larsen, B., and Rosenbaum, P. (2019). CEO Education and Corporate Environmental Footprint. J. Environ. Econ. Manag. 94, 254–273. doi:10.1016/j.jeem.2019.02.001
Aqeel, M., Abbas, J., Shuja, K. H., Rehna, T., Ziapour, A., Yousaf, I., et al. (2021). The Influence of Illness Perception, Anxiety and Depression Disorders on Students Mental Health during COVID-19 Outbreak in Pakistan: a Web-Based Cross-Sectional Survey. Ijhrh, 1–14. doi:10.1108/ijhrh-10-2020-0095
Atkinson, A. B. (1970). On the Measurement of Inequality. J. Econ. TheoryIss.3 2, 244–263. doi:10.1016/0022-0531(70)90039-6
Azadi, N. A., Ziapour, A., Lebni, J. Y., Irandoost, S. F., Abbas, J., and Chaboksavar, F. (2021). The Effect of Education Based on Health Belief Model on Promoting Preventive Behaviors of Hypertensive Disease in Staff of the Iran University of Medical Sciences. Arch. Public Health 79 (1), 69. doi:10.1186/s13690-021-00594-4
Breen, R., Luijkx, R., Müller, W., and Pollak, R. (2010). Long-term Trends in Educational Inequality in Europe: Class Inequalities and Gender Differences. Eur. Sociological Rev. 26 (1), 31–48. doi:10.1093/esr/jcp001
Chapman, B., and Lounkaew, K. (2015). Measuring the Value of Externalities from Higher Education. High Educ. 70, 767–785. doi:10.1007/s10734-015-9866-x
Checchi, D., and van de Werfhorst, H. G. (2017). Policies, Skills and Earnings: How Educational Inequality Affects Earnings Inequality. Socio-Economic ReviewIss.01 16, 137–160. doi:10.1093/ser/mwx008
Chen, R., Ding, X., and Min, W. (2019). The Contributions of Education to the green GDP. Educational Research. No.05, 133–141.
Chen, Y., Zhu, Z., and Yu, X. (2020). How Urbanization Affects Energy-Environment Efficiency: Evidence from China. Singapore Econ. Rev. 65 (No. 6). doi:10.1142/s0217590820500447
Clément, M., and Piaser, L., 2021. Geography of Income and Education Inequalities in Mexico: Evidence from Small Area Estimation and Exploratory Spatial Analysis. Eur J Dev Res. doi:10.1057/s41287-021-00386-0
Danler, C., and Pfaff, K. (2021). The Impact of an Unequal Distribution of Education on Inequalities in Life Expectancy. SSM Popul. Health 16, 100954. doi:10.1016/j.ssmph.2021.100954
Demena, B. A., and Afesorgbor, S. K. (2020). The Effect of FDI on Environmental Emissions: Evidence from a Meta-Analysis. Energy Policy 138. doi:10.1016/j.enpol.2019.111192
Elahi, E., Khalid, Z., Tauni, M. Z., Zhang, H., and Lirong, X. (2021). Extreme Weather Events Risk to Crop-Production and the Adaptation of Innovative Management Strategies to Mitigate the Risk: A Retrospective Survey of Rural Punjab, Pakistan.Technovation, doi:10.1016/j.technovation.2021.102255
Elahi, E., Khalid, Z., and Zhang, Z. (2022b). Understanding Farmers’ Intention and Willingness to Install Renewable Energy Technology: A Solution to Reduce the Environmental Emissions of Agriculture. Appl. Energ. 309, 0306–2619. doi:10.1016/j.apenergy.2021.118459
Elahi, E., Zhang, Z., Khalid, Z., and Xu, H. (2022a). Application of an Artificial Neural Network to Optimise Energy Inputs: An Energy- and Cost-Saving Strategy for Commercial Poultry Farms. Energy 244, 0360–5442. doi:10.1016/j.energy.2022.123169
Golubeva, O. (2021). Firms' Performance during the COVID-19 Outbreak: International Evidence from 13 Countries. CgNo. 216, 1011–1027. doi:10.1108/CG-09-2020-0405
Gracia, O., and Siregar, S. V., 2021. Sustainability Practices and the Cost of Debt: Evidence from ASEAN Countries. Journal of Cleaner Production, 300. doi:10.1016/j.jclepro.2021.126942
Guan, Y., Huang, G., Liu, L., Zhai, M., and Xu, X., 2019. Measurement of Air-Pollution Inequality through a Three-Perspective Accounting Model. Science of the Total Environment, 696. doi:10.1016/j.scitotenv.2019.133937
Hadar, J., and Russell, W. R. (1969). Rules for Ordering Uncertain Prospects. Am. Econ. Rev. 59 (No.1), 25–34. Available at: https://www.jstor.org/stable/1811090.
Hanoch, G., and Levy, H. (1969). The Efficiency Analysis of Choices Involving Risk. The Rev. Econ. StudiesIss.3 36, 335–346. doi:10.2307/2296431
Hinata, A., Kabasawa, K., Watanabe, Y., Kitamura, K., Ito, Y., Takachi, R., et al. (2021). Education, Household Income, and Depressive Symptoms in Middle-Aged and Older Japanese Adults. BMC Public Health 21, 2120. doi:10.1186/s12889-021-12168-8
Iranzo, S., and Peri, G. (2009). Schooling Externalities, Technology, and Productivity: Theory and Evidence from U.S. States. Rev. Econ. Stat. 91 (2), 420–431. doi:10.1162/rest.91.2.420
Khazaie, H., Lebni, J. Y., Abbas, J., Mahaki, B., Chaboksavar, F., Kianipour, N., et al. (2021). Internet Addiction Status and Related Factors Among Medical Students: A Cross-Sectional Study in Western Iran. Int. Q. Community Health Educ., 0272684X2110254. doi:10.1177/0272684X211025438
Lam, D., and Levison, D. (1991). Declining Inequality in Schooling in Brazil and its Effects on Inequality in Earnings. J. Dev. Econ. 37 (1–2), 199–225. doi:10.1016/0304-3878(91)90088-D
Lebni, J. Y., Toghroli, R., Abbas, J., NeJhaddadgar, N., Salahshoor, M. R., Mansourian, M., et al. (2020). A Study of Internet Addiction and its Effects on Mental Health: A Study Based on Iranian University Students. J. Educ. Health Promot. 9 (1), 205. doi:10.4103/jehp.jehp_148_20
Lee, K., and Lu, S. (2021). The Impact of COVID-19 on the Stock price of Socially Responsible Enterprises: An Empirical Study in Taiwan Stock Market. Int. J. Environ. Res. Public Health 18 (No. 4), 1398. doi:10.3390/ijerph18041398
Lei, X., and Shen, Y. (2015). Inequality in Educational Attainment and Expectation: Evidence from the China Family Panel Studies. China Econ. JournalIss.3 8, 252–263. doi:10.1080/17538963.2015.1108119
Li, J., Wang, D., Abbas, J., Duan, K., and Mubeen, R. (2021). Tourists’ Health Risk Threats amid COVID-19 Era: Role of Technology Innovation, Transformation, and Recovery Implications for Sustainable Tourism. Front. Psychol. 12, 769175. doi:10.3389/fpsyg.2021.769175
Liu, F., Wang, D., Duan, K., and Mubeen, R. (2021). Social media Efficacy in Crisis Management: Effectiveness of Non-pharmaceutical Interventions to Manage the COVID-19 Challenges. Front. Psychiatry 12 (1099), 626134. doi:10.3389/fpsyt.2021.626134
Local Burden of Disease, H. I. V. C (2021). Mapping Subnational HIV Mortality in Six Latin American Countries with Incomplete Vital Registration Systems. BMC Med. 19 (1), 4. doi:10.1186/s12916-020-01876-4
Maas, van Lutsenburg, J., and Criel, C. (1982). Distribution of Primary School Enrollments in Eastern Africa. World Bank Staff Working Papers. Washington D.C: No.511.The Word Bank.
Maqsood, A., Abbas, J., Rehman, G., and Mubeen, R. (2021). The Paradigm Shift for Educational System Continuance in the Advent of COVID-19 Pandemic: Mental Health Challenges and Reflections. Curr. Res. Behav. Sci. 2, 100011. doi:10.1016/j.crbeha.2020.100011
Mei, Y., Gao, L., Zhang, W., and Yang, F. (2021). Do homeowners Benefit when Coal-Fired Power Plants Switch to Natural Gas? Evidence from Beijing, China. J. Environ. Econ. Manag. 110. doi:10.1016/j.jeem.2021.102566
Munir, K., and Kanwal, A. (2020). Impact of Educational and Gender Inequality on Income and Income Inequality in South Asian Countries. IjseIss.8 47, 1043–1062. doi:10.1108/IJSE-04-2020-0226
Muttaqin, G. F., Taqi, M., and Arifin, B. (2020). Job Performance during COVID-19 Pandemic: A Study on Indonesian Startup Companies, Journal of Asian Finance. Econ. Business 7 (No. 12), 1027–1033. doi:10.13106/jafeb.2020.vol7.no12.1027
Nguyen, H. D., Ho, K. H., and Can, T. T. H. 2021. The Role of Education in Young Household Income in Rural Vietnam. The Journal of Asian Finance. Econ. Business 8 (2). doi:10.13106/JAFEB.2021.VOL8.NO2.1237
Nie, F., and Liu, H. (2015). Correlation Analysis of FDI, Environmental Pollution and Economic Growth: An Empirical Examination Based on Dynamic Simultaneous Equation Model. J. Int. Trade 2, 72–83. doi:10.13510/j.cnki.jit.2015.02.008
Pan, H., Wang, X., and Zhang, S. (2015). Duration and Spatial Spillover Effects of Haze Pollution—Evidence from Beijing-Tianjin-Hebei Region. China soft Sci. 12, 134–143. doi:10.3969/j.issn.1002-9753.2015.12.011
Paulson, K. R., Kamath, A. M., Alam, T., Bienhoff, K., Abady, G. G., and Kassebaum, N. J. (2021). Global, Regional, and National Progress towards Sustainable Development Goal 3.2 for Neonatal and Child Health: All-Cause and Cause-specific Mortality Findings from the Global Burden of Disease Study 2019. The Lancet, 1–36. doi:10.1016/s0140-6736(21)01207-1
Permanyer, I., and Boertien, D. (2021). Global Trends in Education Inequality: 1950–2010. J. Hum. Dev. Capabilities 22 (No. 4), 615–646. doi:10.1080/19452829.2021.1911968
Psacharopoulos, G., and Ana-Maria, A. H. (1986). The Educational Attainment of the Labor Force: an International Comparison. The World bank. Report No. EDT38.
Rababah, A., Al-Haddad, L., Sial, M. S., Zheng, C., and Cherian, J. (2020). Analyzing the Effects of COVID-19 Pandemic on the Financial Performance of Chinese Listed Companies. Public Affairs, 20. doi:10.1002/pa.2440
Ricci, F., and Zachariadis, M. (2013). Education Externalities on Longevity. EconomicaIss.319 80, 404–440. doi:10.1111/ecca.12013
Rothschild, M., and Stiglitz, J. E. (1969). Increasing Risk: A Definition and its Economic Consequences. Cowles Foundation Discussion Papers 275. Cowles Found. Res. Econ. Yale University Available at: https://cowles.yale.edu/sites/default/files/files/pub/d02/d0275.pdf.
Shaharuddin, S. N. H., Mahmud, R., Mohd Azhari, N. K., and Perwitasari, W. (2021). Company Performance during Covid-19: Impact of Leverage, Liquidity and Cash Flows. E-BPJ 6 (17), 11–16. doi:10.21834/ebpj.v6i17.2878
Shao, S., Li, X., Cao, J., and Yang, L. (2016). China’s Economic Policy Choices for Governing Smog Pollution Based on Spatial Spillover Effects. Econ. Res. J. 51 (09), 73–88.
Shen, H., Fu, M., Pan, H., Yu, Z., and Chen, Y. (2020). The Impact of the COVID-19 Pandemic on Firm Performance. Emerging Markets Finance and Trade 56 (10), 2213–2230. doi:10.1080/1540496X.2020.1785863
Shukla, V., and Mishra, U. S. (2019). Educational Expansion and Schooling Inequality: Testing Educational Kuznets Curve for India. Soc. Indic Res. 141, 1265–1283. doi:10.1007/s11205-018-1863-x
Su, Z., McDonnell, D., Cheshmehzangi, A., Li, X., and Cai, Y. (2021). The Promise and Perils of Unit 731 Data to advance COVID-19 Research. BMJ Glob. Health 6 (5), e004772. doi:10.1136/bmjgh-2020-004772
Su, Z., McDonnell, D., Wen, J., Kozak, M., Abbas, J., Šegalo, S., et al. (2021). Mental Health Consequences of COVID-19 media Coverage: the Need for Effective Crisis Communication Practices. Glob. Health 17 (1), 4. doi:10.1186/s12992-020-00654-4
Tasseva, I. V. (2021). The Changing Education Distribution and Income Inequality in Great Britain. Rev. Income Wealth 67 (3). doi:10.1111/roiw.12486
Thomas, V., Wang, Y., and Fan, X. (2003). Measuring Education Inequality: Gini Coefficients of Education For140 Countries 1960-2000. J. Edu. Plann. Adm. 17 (1), 5–33.
Thomas, V., Wang, Y., and Fan, X. (2001). Measuring Education Inequality: Gini Coefficients of Education. World Bank Policy Research Working Paper, No.2525. Washington, DC. doi:10.1596/1813-9450-2525
Van Donkelaar, A., Martin, R. V., Brauer, M., and Boys, B. L. (2015). Use of Satellite Observations for Long-Term Exposure Assessment of Global Concentrations of fine Particulate Matter. Environ. Health Perspect. 123 (No.2), 135–143. doi:10.1289/ehp.1408646
Wang, F. (2008). An Empirical Study on Factors Influencing Environmental Behavior of Public Participation. China Population. Resour. Environ. 18 (No.6), 30–35. doi:10.3969/j.issn.1002-2104.2008.06.006
Wang, Y., and Han, D. (2016). Economic Development, Environmental Pollution and Public Pro-environmental Behavior: A Multi-Level Analysis of the 2013 Chinese General Social Survey. China: Journal of Renmin University of China, 79–92.
Xiao, C., and McCright, A. M. (2012). A Test of the Biographical Availability Argument for Gender Differences in Environmental Behaviors. Environ. BehaviorIss.2 46, 241–263. doi:10.1177/0013916512453991
Yang, J., and Huang, X. (2010). The Mechanism between Education Inequality and Income Inequality—An Empirical Analysis Based on China’s Provincial Panel Data. J. Public Manag. 7 (No.03), 75–82+126.
Yang, J., Huang, X., and Li, X. (2008). The Educational Inequality and the gap in Income Distribution: An Empirical Analysis on China. Manag. World 01, 38–47+187. doi:10.19744/j.cnki.11-1235/f.2008.01.006
Yang, J., Huang, X., and Liu, X. (2014). An Analysis of Education Inequality in China. Int. J. Educ. Dev. 37, 2–10. doi:10.1016/j.ijedudev.2014.03.002
Yang, J., and Xu, L. (2020). How Does China's Air Pollution Influence its Labor Wage Distortions? Theoretical and Empirical Analysis from the Perspective of Spatial Spillover Effects. Science of the Total Environment, 745. doi:10.1016/j.scitotenv.2020.140843
Ye, R., An, N., Xie, Y., Luo, K., and Lin, Y. (2021). An Empirical Study on the Equity Performance of China's Health Insurance Companies during the COVID-19 Pandemic-Based on Cases of Dominant Listed Companies. Frontiers in Public Health, 9. doi:10.3389/fpubh.2021.663189
Yu, N., Yu, B., De Jong, M., and Storm, S. (2015). Does Inequality in Educational Attainment Matter for China's Economic Growth? Int. J. Educ. Dev. 41, 164–173. doi:10.1016/j.ijedudev.2015.02.008
Yuan, Z., Guo, J., Yang, Y., and Zhu, H. (2020). Analysis of the Spatial Structure, Mechanism and Social-Political Effects of the High-Quality Basic Educational Resources in China. Acta Geographica Sinica 75 (No.2).
Yue, C. (2004). The Impact of Education on Income Difference in Urban China. China Econ. Q. 3, 135–150.
Zeng, K., and Eastin, J. (2012). Do developing Countries Invest up? the Environmental Effects of Foreign Direct Investment from Less-Developed Countries. World Dev. 40 (11), 2221–2233. doi:10.1016/j.worlddev.2012.03.008
Zhan, H. (2018). The Effect of Income Inequality on Environmental Pollution: Reassessment of the Environmental Kuznets Curve of China. Econ. Rev., 6. doi:10.19361/j.er.2018.06.08
Zhao, J., Jiang, Q., Dong, X., and Dong, K. (2021). Assessing Energy Poverty and its Effect on CO2 Emissions: The Case of China, Energy Economics, 97. doi:10.1016/j.eneco.2021.105191
Keywords: educational inequality, gini coefficient of education, the imbalance of urban and rural development, air quality, spatial spillover
Citation: Liu X, Liu H and Yang J (2022) Would Educational Inequality Aggravate Environmental Pollution? —Evidence From Spatial-Based Panel Analysis in China. Front. Environ. Sci. 10:813254. doi: 10.3389/fenvs.2022.813254
Received: 11 November 2021; Accepted: 07 February 2022;
Published: 24 February 2022.
Edited by:
Ehsan Elahi, Shandong University of Technology, ChinaReviewed by:
Luigi Aldieri, University of Salerno, ItalyJ. Abbas, Shanghai Jiao Tong University, China
Copyright © 2022 Liu, Liu and Yang. This is an open-access article distributed under the terms of the Creative Commons Attribution License (CC BY). The use, distribution or reproduction in other forums is permitted, provided the original author(s) and the copyright owner(s) are credited and that the original publication in this journal is cited, in accordance with accepted academic practice. No use, distribution or reproduction is permitted which does not comply with these terms.
*Correspondence: Xin Liu, bGl1eGluQGNxdS5lZHUuY24=