 Grace Mulindwa Bahizire
 Li Fanglin1*
 Michael Appiah
- 1School of Finance and Economics, Jiangsu University, Zhenjiang, China
- 2Dorstell Research & Consultancy, Koforidua, Ghana
The study investigates the impact of institutional quality on environmental efficiency in the presence of the Environmental Kuznets Curve (EKC) using data on desirable and undesirable outputs as well as institutional quality dimensions from the World Governance Indicators (WGI) for 19 Sub-Sahara African (SSA) countries over an annual period from 2005 to 2014. Environmental efficiency was low in eight SSA countries and excellent in eleven others, according to the efficiency results. Two countries had the highest average environmental efficiency over the first period, while one had the lowest. In 2013, the majority of SSA countries had high efficiency indexes, with one country having an index of 2.098 and four countries having efficiency rates of one. After controlling for industrialization, energy consumption, and population variables, the results show that corruption control and regulatory quality lower environmental efficiency while government effectiveness increases. The DH causality test revealed that environmental efficiency, control of corruption, regulatory quality, energy consumption, and population had no causal relationship. There are also one-way causal linkages between environmental efficiency and government effectiveness and industrialization.
1 Introduction
Countries, particularly those in Sub-Saharan Africa, face reducing CO2 emissions while ensuring that economic gains are not harmed, which leads to conflict both within and between them. Conflict resolution raises fundamental concerns that exacerbate inefficiencies in emission reduction. Although institutions have a role in addressing these concerns, their influence is difficult to quantify, and different institutions can have different effects (Tateishi et al., 2020). Improving environmental efficiency is critical to halting environmental degradation and averting the worst effects of climate change (Elahi et al., 2022; Elahi et al., 2022). On the other hand, institutions are required to improve the effectiveness of environmental protection (IPCC, 2014). Uncertainty can be decreased by defining norms, allowing institutions to perform, linking them to both economic and environmental performance (Coase, 1937; Coase, 1960; North, 1990). Because institutional performances are fundamental in how countries, enterprises, and markets function, North (1990) claims that a theory of production can examine the role of institutions in economic performance. In this same way, institutions are encouraged to exercise duties and responsibilities in the quest to improve environmental efficiency since there are drawbacks to their activities. These include trust, information, and enforcing others’ conduct, which is difficult to assess because they are fundamental characteristics of the manufacturing procedure that may inspire outputs but are not inputs (Coase, 1960; North, 1990; Paavola and Adger, 2006).
The literature on environmental efficiency has exploded, but there is diminutive or no tentative evidence to support the overriding role that institutions perform in Africa’s search for environmental efficiency. As a result, essential aspects that could ignite a paradigm shift in Africa’s environmental efficiency quest management have been left out. With this, it is critical to figure out the quantifiable bearing of institutions on environmental efficiency and deliver creative and practical solutions to Africa’s seemingly inexorable global environmental change trends. The ecology in Africa has been varying for years, but the more considerable worries about community health problems are yet to be addressed (Ahenkan and Osei-Kojo, 2014). Throughout the literature search on environmental efficiency, there is no such study that puts SSA countries on the line and emphasizing this situation. The quest to conduct a study with SSA countries is in focus. Following the above, the study tries to ascertain the following; 1) to use the Malmquist Model (MM) model to assess environmental efficiency scores for SSA countries, 2) to investigate the existence of EKC in the institutions-environmental efficiency nexus, 3) assess the influence of institutions on environmental efficiency thus there is a positive relations between institutional quality indicators and environmental efficiency, and 4) to uncover the causal linkages between institutions and environmental efficiency in SSA.
Most literature on environmental efficiency see (Zaim and Taskin, 2000; Kumar and Khanna, 2009; Song et al., 2013; Chen et al., 2017) mainly focused on developed countries. Studies like Hermoso-Orzáez et al. (2020) used the DEA approach to assess some EU member countries’ relative environmental efficiency (eco-efficiency). According to their research, 14 of the 28 countries have a high relative environmental efficiency. Using meta-Frontier and DEA methodologies, Wang et al. (2015) estimated the EEs of some Chinese cities from ecological defence and commercial development perspectives. Regional EEs flanked by provinces were explored, resulting in five-level EE categories. The efficiency gaps or discrepancies between cities, on the other hand, were not obvious, and the inter-annual EE fluctuations were not examined. The energy-conservation and emissions-lessening activities of Chinese cities was researched by Wang et al. (2015), but the individual cities were not given to see the EE disseminations and changes. Furthermore, the alternative efficiency of the ecosystem over time was not examined.
Rong et al. (2015) and Zhang et al. (2015) investigated the industrial ecological efficiency of certain Chinese towns using super-efficiency DEA. Following a summary of the current study’s progress, the DEA approach was primarily used in the evaluation. Both studies found that China’s national environmental efficiency is improving rapidly. Their findings suggested that economic performance evaluations be carried out from environmental efficiency to balance studies on western development and play a significant role in promoting China’s green growth in the next round of western development. In China, some studies focused on improvement of environmental efficiency of industrial sector (Zhao et al., 2020; Zhao et al., 2021).
Environmental challenges have emerged as one of the most pressing issues confronting social and economic progress. Environmental efficiency evaluation in various locations and sectors has significant practical significance. This work helps countries comprehend the differences in their environmental performance and serves as an objective benchmark for enhancing environmental performance. However, most contemporary environmental efficiency evaluation methods are based on determining the inputs and outputs appraisal index. Some assessment methods (such as DEA and SFA) are proposed built on the macro data or microdata. This work adds to previous research in the following ways: first and foremost, our research focuses on the environmental efficiency of SSA countries. The majority of the current research is focused on industry, with a few exceptions covering individual countries. Second, in the computation of environmental efficiency with a robust econometric system to achieve reliable and credible outcomes.
The following are some of our policy recommendations for establishing a happy coexistence of economic and environmental development: First, we should promote a more balanced development of SSA trade and investment, notably in energy-saving and environmental-protection products and technology; second, while changing and modernizing sectors, we should emphasize environmental improvement. At the same time, we must continue to enhance energy-efficient enterprises while eliminating unwanted outputs; third, we must adopt policy dimensions that are appropriately differentiated depending on the specific conditions of diverse industries. In addition, industry-specific economic-environmental efficiencies provide commercial banks with more information to analyze the environmental risk associated with their commercial financing services in terms of ecological finance.
2 Literature Review
How to efficiently encourage economic change without damaging the ecosystem has received much consideration in recent years. The World Business Council for Sustainable Progress (WBCSD) suggested environmental efficiency in 1992, and Ehrenfeld (2005) defined it as an all-inclusive index quantifying the ecological impact of economic progress. The proportion of economic goods or services to the use or emissions of natural resources is the simple principle of environmental efficiency. This concept emphasizes that economic advance should not be pursued at the expense of ecological degradation. One of the imperative customs to statistically analyse the economy’s performance and its connection with the environment is to conduct an environmental efficiency evaluation. In calculating environmental efficiency, a variety of efficiency analysis and methodologies have been presented.
These systems can be classified into two sets constructed on the production possibility Frontier PPF theory: parametric and nonparametric. SFA (Aigner et al., 1977; Meeusen and van Den Broeck, 1977) and DEA (Charnes et al., 1978; Banker et al., 1984), is the parametric and nonparametric approaches, respectively. To evaluate the link between inputs and outputs, SFA used regression analysis. A SET and a systematic inefficiency factor are used to decompose the efficiency of peer DMUs. Unlike SFA, the DEA approach does not need the specification of functional relationships amongst inputs and outputs. The DEA method is a nonparametric method for determining the qualified efficiency of DMUs with many inputs and outputs found that DEA is laid-back to apply in situations with several variables than SFA.
Liu and Guo (2016) and Wei and Yunfei (2016) used super-efficiency DEA, and the DEA model was used to examine China’s provincial environmental efficiency empirically. Some researchers looked into the environmental efficiency of various sectors suggested a worldwide energy efficiency model that is important for measuring and making decisions on environmental efficacy. They also hypothesized a relationship between energy use and economic development, as well as a 100-years prediction (Iqbal et al., 2019; Mohsin et al., 2018) stipulated that refining environmental efficiency has been viewed as an objective need and an unavoidable path for developing a resource-saving and environmentally friendly society. The use of SBM and Tobit models revealed that GDP per capita relies on foreign capital and commerce, environmental awareness, and population density positively affect environmental efficiency. Furthermore, the study recorded that the share of secondary industries in GDP has a large undesirable effect on environmental efficiency. The distance function technique has been utilized in several pieces of research to determine the EE of countries (Taskin and Zaim, 2001; Zaim and Taskin, 2000; Zofı́o and Prieto, 2001). The first two studies are limited to OECD nations, whereas the third study looks at the bearing of international commerce on EE for a group of industrialized and emerging countries. According to these studies, there is a U-shaped EKC between EE and per capita income in OECD nations. This is the case for high-income countries, according to Taskin and Zaim (2001), but there is an opposite U-shaped association for low- and middle-income nations.
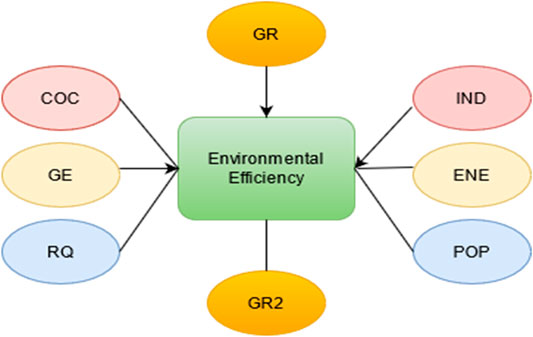
FIGURE 1. Graphical Representation of causation −, → signifies a non-direction and unidirectional causal way, respectively.
3 Data, Model and Methodology
3.1 Data
The beginning year chosen for this article was 2005, and the cut-off time was 2014 due to current data availability. The periods and countries for the estimation was selected due to the unavailability of data. Labour, capital and energy usage are all input indicators. GDP and CO2 are the desired and unwanted output indicators, respectively. This publication used fundamental data from the PWT, WDI, and WGI to make estimations throughout the study. The study looked at three types of factors: labour, capital, and energy use in terms of inputs. The labour input in this study is measured using the portion of labour return in GDP at recent national prices. We utilize the capital stock at constant 2011 national prices (in mil. 2011US$). Energy consumption represents the input of natural resources. It contains both good and undesired outputs in terms of output. The real GDP of each country, using 2005 as the base year, reflects the desired output. We chose CO2 emissions as an unwanted output metric to properly consider environmental contamination problems.
According to relevant environmental economics theories and extant literature, the key aspects that affect environmental efficiency are industrial structure, energy consumption structure, economic development level, and population. To see if the Kuznets curve exists for changes in environmental efficiency in the SSA, we plug in the square of the per capita GR and GR2 into the regression model. Similarly, we use the value-added (percentage of GDP) of industry (including construction) to reflect the industrial structure, which is expressed as “IND,” the percentage of coal usage to reflect energy use structure, which is expressed as “ENE,” the per capita GDP to replicate economic development level, and CO2 emissions (metric tons per capita) to reflect environmental protection strength.
3.2 Model
This piece of literature planned the resulting construction in the occurrence of the EKC to assemble the framework of cointegration and causality between institutional efficacy and environmental efficiency, which is intended to achieve the objectives. The significant variables involved in the model construction are environmental efficiency (EE), IQ indicators, EKC factors (GR and GR2) with Industrialization (IND), energy consumption (ENE), and growth of populace (POP) as control variables. The underlying econometric framework founded on the EKC philosophy is provided based on the above assumptions.
With β0 denoting an unobserved time-invariant discrete impact; β1, and β3, correspondingly, describe the influence of IQ markers on EE with some control variables in the presence of EKC. εit denotes the probability term. The stochastic term is disseminated with a zero average and continual variance assumption, and the time (t = 1, 2, 3, T) is superscripted. The EKC theory proposes the above model, which may be instituted below:
Corruption prevention, quality of regulation, and government competence are among the institutional quality indicators.
3.3 Methodology
In quantifying environmental efficiency and examining the stimulus of institutions on environmental efficiency, the study employs a two-stage DEA-GMM model. The first stage is utilising the MM-DEA prototype to compute the environmental efficiency scores of SSA nations from 2005 to 2014 to examine the impact of environmental factors as undesired outputs to different businesses. The activation of the 2 Step system GMM regression model to examine the impact of institutions on environmental efficiency came at the second stage, using the obtained environmental efficiency scores as dependent variables. The Kao (1999) approach for cointegration, including Dumitrescu and Hurlin (2012) causation trials, were adopted to cater for the long and expanded period interconnections and the causal effects among the variables under consideration.
3.3.1 Malmquist Productivity Index Model
In 1953, statistician Malmquist proposed the Malmquist index. The Malmquist index is based on the DEA and was first introduced by (Färe et al., 1994). Färe et al. (1994) decomposed the technical efficiency as follows: Given the requirement of constant returns to scale and elements with high disposability, Fare decomposed the technical efficiency as follows:
Where Ft(yt,xt/v,w) stands for pure technical efficiency, sti(yt,xt/s) for scale efficiency, CNti(yt,xt/v) for strong disposability elements, and Ft(yt,xt/v,w) for pure technical efficiency. Fare technical efficiency input distance function Dti=(Yt,Xt) multiply Fti=(yt,xt/c,s) is always equal to one. The compression fraction of a specific point (yt,xt) compresses to ideal input can be thought of as the input distance function. When Dti=(yt,xt) = 1, (yt,xt) is on the cutting edge, that is, when technic is at its most efficient. Dti=(yt,xt)>1 denotes (yt,xt)’s departure from the Frontier, at which point technic becomes ineffective. The distance function will be Dt+1i= (yt+1, xt+1) if we use time t+1 to place t. According to the idea of (Caves et al., 1982a; 1982b), input-oriented TFP can be stated by the Malmquist index as
The previous index depicts the DMU’s technical changes in the time t technical system from time t to time t+1. The technical change index of the DMU from time t to time t+1 is easy to notice on time t+1 technical state.
To export the Malmquist index, (Färe et al., 1994) used two geometric averages of the Malmquist index:
Where
3.3.2 Kao Cointegration Test
Kao (1999) Recommends using pooled regression with individual fixed effects to estimate the homogeneous cointegrating relationship. The equation for regression is:
A joint DF regression is now estimated
Where (ρ−1) is estimated using a POLS estimator
Kao (1999) tests
Where,
3.3.3 Two Step System GMM Test
The study used a two-step GMM approach to capture the impact of institutional quality on environmental efficiency. The use of the two-step system GMM technique is due to the following reasons: Its capacity to monitor poor instrument issues (Arellano and Bover, 1995). It captures endogeneity issues once again, which can change the magnitudes of coefficient signs if disregarded (Wintoki et al., 2012). Its solution to the problem of omitted variables bias, which has been noted as a concern in general OLS estimations. The approach detects this problem by using the lags of the dependent variables as explanatory factors. Lagged values of the dependent variables are also utilized as instruments to modulate this endogenous link (Roodman, 2009). It also incorporates a covariance matrix for the disturbance term calculated using the one-step estimator’s leftovers. To sum it up, it uses equations at both the level and first-difference as a method and large CS data groups and a limited number of time-series measurements (huge N and few T). The GMM model is also chosen since it is linked to diagnostic tests that verify the instruments’ validity and reliability. This is to see if there is a link between the residual and the data. To do this, the HJ test is performed. In addition, the AB test is used to assess both first and second order serial autocorrelation. The following is the dynamic model used:
In which i = 1, N and t = 1, T, α is the unknown intercept for each entity, Yit is the reliant variable, and β is the coefficient for the self-determining variable ε is the error term which is assumed to normally distributed at zero mean value and constant variance (Elahi et al., 2021).
3.4 DH Causation Test
The Dumitrescu and Hurlin (2012) technique for heterogeneous tables is an upgraded causation technique. Using the Granger causation test, the approach determines the average of several Wald analyses for cross-sectional units. Three alternative statistical values are calculated in the panel causation test by Dumitrescu and Hurlin (2012).
The average value of the distinct Wald estimates is
The z-values are
For the calculated panel statistics, the void statement and alternative argument are as follows:
Normal panel data scheme.
4 Results and Discussions
The descriptive outline of the variables used is presented in Table 1. Corruption control (COC), government effectiveness (GE), and regulatory efficiency (RQ) are all scaled by index and reflected in averages of −0.5278, −0.5402, and −0.4311 separately. Accordingly, the average environmental efficiency (EE) was 1.0082, with a max and min of 0.618 and 2.422, and an Std. Dev of 0.2138, as per the table. This implies that Africa’s institutional metrics are still low. Many factors, including political intervention and infrastructural deficits in many African countries, can be blamed for this. Furthermore, the table shows that the average level of Industrialization (IND) is 26.5627, while the average levels of energy usage (ENE) and growth (GR) are 2.6496 kt and 8.2927%, respectively, with a population of 2.3803. The effects of standard deviation are also interesting. The table’s results show that Industrialization, growth, energy, and population are all spread well beyond their means. This may be linked to any outliers in the data or data measurement error. However, by transforming the data before using it for analytical estimations, these issues were avoided. The results of the correlation matrix are presented in the table again; all institutional quality metrics are positively correlated with environmental efficiency. Corruption control (COC), government effectiveness (GE), and regulatory quality (RQ) have correlation coefficients of 0.0163, 0.0268, and 0.0307, respectively. The association between environmental efficiency and other control variables is worth considering, as the findings show mixed results. For example, with correlation coefficients of 0.0379 and 0.1009, industrialisation and growth are positively related to environmental efficiency. At the same time, energy and population are undesirably related to environmental efficiency, with correlation coefficients of −0.0648 and −0.0166, respectively.
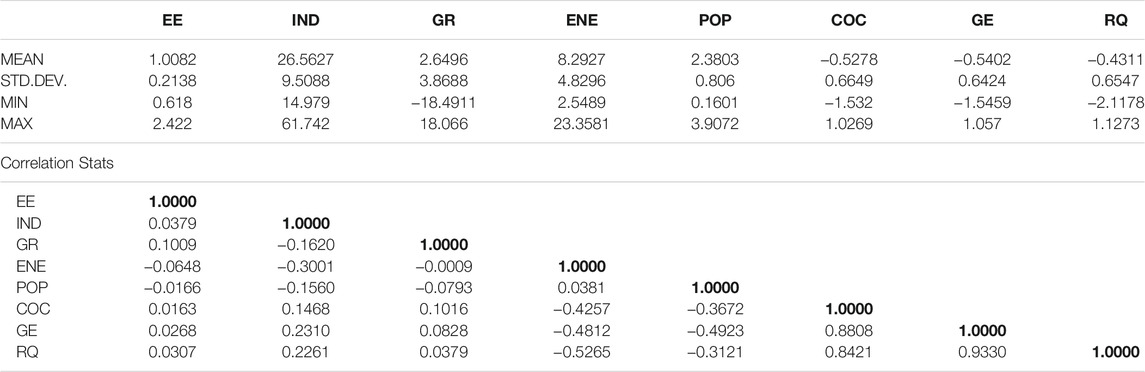
TABLE 1. Descriptive and Correlation statistics.
From 2006 to 2014, the Malmquist productivity index for SSA nations is shown in Table 2. The findings reveal that environmental efficiency varies depending on a variety of inputs and outputs and country and period. A score greater than one indicates an increase in environmental efficiency, a value less than one suggests a decrease in environmental efficiency, and a value equal to one shows no variation in efficiency. Table 2 shows that in 2006, environmental efficiency was low in eight SSA nations and high in eleven. Over the first period, Botswana and Gabon had the highest average environmental efficiency, while Guinea had the lowest. This pattern indicates that these SSA countries struggled to enhance environmental efficiency during the study period, even though external factors hampered efficiency. This is because these countries were unable to increase their environmental efficiency during the first period, showing that renewable energy is still inefficient compared to traditional resources (Chien and Hu, 2007). Table 1 further illustrates that unanticipated market surprises impact the variations in environmental efficiency between 2007 and 2012. The table shows that most countries in this region have a poor efficiency index (below 1), indicating that additional environmental degradation mitigation strategies are needed to close the efficiency gap. This disparity may exist because most countries do not realize the value of renewable energy technology, which will eventually have prices equivalent to fuel energy (Owen, 2004). Table 3 further shows that most SSA nations have high-efficiency indexes in 2013, with Cote D’voire having an index of 2.098 and Botswana, South Africa, Senegal, and Tanzania having efficiency rates of 1.00 in 2013. This conclusion backs up the fact that environmental challenges are strongly linked to long-term economic success (Arabi et al., 2014; Korhonen and Luptacik, 2004).
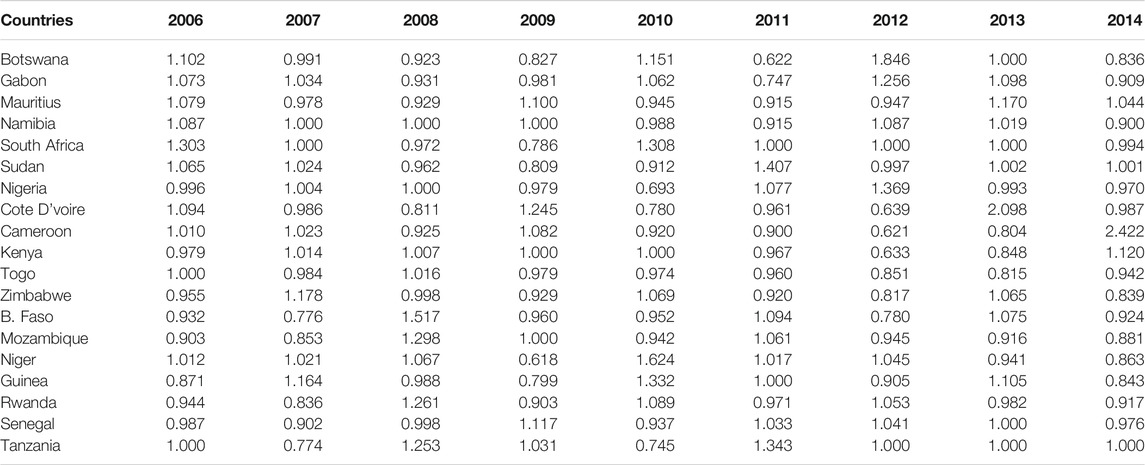
TABLE 2. Environmental efficiency results.
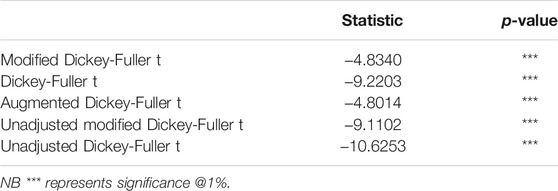
TABLE 3. Kao cointegration test.
The Kao (1999) panel cointegration results in Table 4 help affirm the cointegration between the variables for all of the tests. In all of the experiments that were conducted, the null assertions of no cointegration were dismissed. This holds for the five test statistics mentioned in the table, indicating that all data panels are cointegrated. Overall, it is now reasonable to conclude that a long-run stability link exists between the institutional quality indicators, the control variables, the EKC variable growth, and the dependent variable of environmental efficiency.
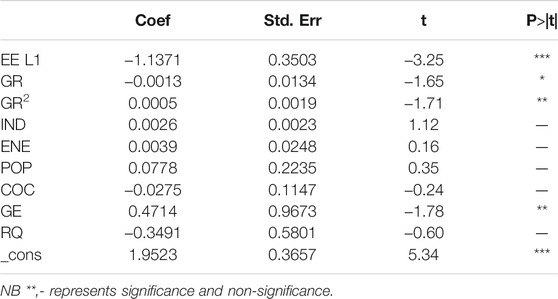
TABLE 4. 2Step GMM results.
After running the extended haul test, the research estimates the model using 2 step system GMM panel estimation methodologies to evaluate the extended run rapport between the variables and several post-estimation diagnostic tests Table 5. The presence of EKC and the effect of institutions on environmental efficiency are determined following the study’s objectives. The EKC notion is investigated by first looking at Table 4 to check if it exists. (GR) Moreover, (GR2) is negative and positive approximation coefficients, respectively, and both passed the significance test. It means that the degree of economic growth has a substantial impression on environmental efficiency. The Kuznets curve of environmental efficiency exists in SSA nations, with the environmental efficiency of SSA countries improving as the level of growth rises.
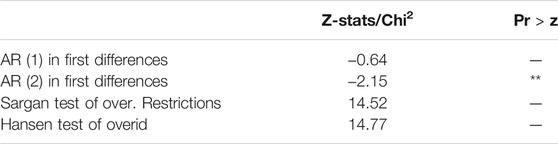
TABLE 5. Results of diagnostic.
In the case of environmental efficiency estimation, there is an outcome of the EKC principle which states that growth is negative while the squared growth is positive (Chen et al., 2017). The essence of the EKC principle is determined by long-term projections, beginning with the Environmental efficiency consequences of growth, which determine the conclusion. The positive relationship between growth and environmental efficiency as measured in the index shows that environmental efficiency often reduces with growth. It is worth noting that the growth outcome studied here is a short-run consequence, not an EKC consequence. On the other hand, the EKC effect is quantified using squared growth (GR2), which yields a positive coefficient that is statistically significant across the specification. The data reveal that when growth rises, predicted efficiency falls at first but then rises. Based on empirical estimations, the estimated tipping point occurs at a level of growth and is outside the range of findings in the sample evaluated for empirical investigation. The coefficient’s value indicates that a 0.0005 rise in environmental efficiency equals a 1% increase in growth programs. This illustrates that growth has an inverted U-shaped and linear relationship with environmental efficiency. As a result, the EKC assertions hold for the SSA economies studied in this study.
The complete study’s regression outcomes show a favourable association between IND and environmental efficiency, even though it is statistically insignificant. The findings show that a higher percentage of industrialized output leads to greater environmental efficiency. On the other hand, the data suggest that an increase in production has little bearing on environmental efficiency. According to Yin (2017) and Wang et al. (2017), the likely reason is that while the expansion of the second industry has positive effects on environmental efficiency through increased outputs, it also has adverse effects on environmental efficiency since it produces pollution. The coefficient of ENE is positive and failed the significance test. The improvement in energy over-exploitation in recent years is most likely to blame for this anomaly.
Meanwhile, manufacturing industries improve environmental governance to reduce polluting emissions, but they have little impact. As a result, energy use has a negligible positive environmental impact. This suggests that manufacturing energy structures and environmental governance in SSA countries need to be addressed. The study of Wang et al. (2017) backs up the findings of this current study. The POP coefficient estimate is positive and consistently significant, indicating that densely populated nations in the SSA group are more concerned about boosting environmental efficiency. The density of the population has a favourable impact on environmental efficiency. Whether the population is valid or not, the right population in the right place can assure the region’s economic progress and prosperity. Indirectly, increasing population density can help to improve environmental efficiency to some extent. According to some literature see [(Zaim and Taskin, 2000; Kumar and Khanna, 2009; Song et al., 2013; Chen et al., 2017)], population plays a significant impact in enhancing environmental efficiency. According to these studies, population expansion will be linked to the ongoing improvement of economic level and extension of the economic scale. With rising income levels, people’s expectations for environmental quality will rise, perhaps increasing environmental efficiency.
The coefficient of COC is negative, and the significance test was passed at the 5% level. Because this contradicts our ordinary perception, we should think in the opposite direction. It reflects that the SSA countries’ economies have expanded, but that progress has come at the expense of a lot of resource consumption and pollution emissions, resulting in a situation where the SSA countries are “polluting while treating”. The RQ that fails to pass the significance test implies that regulatory quality has no meaningful impact on SSA nations’ environmental efficiency. The explanation for this could be that the SSA countries’ regulatory quality is low, and the environmental benefits of regulatory quality are not readily apparent. Because lower environmental efficiency translates to more serious environmental pollution, SSA nations with lower environmental efficiency must develop other anti-corruption laws to address and regulate pollution.
To explain, institutional quality indices such as corruption prevention and regulatory quality cannot improve overall environmental efficiency. The information presented thus far has elicited a wide range of reactions. On the other hand, empirical evidence shows that anti-corruption measures and regulatory consistency significantly negatively impact environmental efficiency. Increasing corruption control and regulatory uniformity, according to some theories, diminishes environmental efficiency rather than displaying environmental efficiency features. As a result, poor regulatory quality and the absence of anti-corruption laws jeopardize environmental efficiency. According to (Esty et al., 2005; Hosseini and Kaneko, 2013), Corruption has two distinct effects on the environment: the direct and indirect processes, which hurts environmental policy and compliance in the natural process. More Corruption is bad for environmental policy because it shifts the government’s relative weight away from benefits and toward bribes, making government influence cheaper to buy. Again, Corruption leads to ineffective environmental regulatory implementation and producers’ and consumers’ ability to avoid accountability for the environmental damage they cause.
On the other hand, there is an unspoken relation between Corruption and wealth. While Corruption affects metrics of wealth (such as income or economic growth), the EKC relationship affects environmental quality. Similarly, empirical evidence suggests that government efficacy boosts environmental efficiency significantly. Improvements in government procedures tend to boost environmental efficiency by 0.4714, as measured by the unit index. It can be seen that the quality of governance is linked to the benefit of environmental outcomes in SSA countries, and this can be done through its relationship with public support for environmental policy.
The study indicates that the structural instability that afflicts SSA countries prohibits them from effectively implementing environmental legislation as their economies grow in the setting of the EKC. This is demonstrated by stages of voice and corruption control and regulatory quality without limits on industry and population events that have undercut environmental laws by incorporating bias. It might be claimed that Sub-Saharan Africa’s institutions are ineffective when it comes to improving environmental efficiency. As a result of the policy implications, institutions must have a more considerable mitigating impact on environmental efficiency to conceive, pass, and implement appropriate environmental regulatory regulations with incentives and penalties.
To test for the track of causation in the heterogeneous panel data, the researchers adopt (Dumitrescu and Hurlin, 2012) to investigate the insignificant assertions of Granger non-causality shown in Table 6. At a 10, 5, and 1% significance level, the evidence from the analysis demonstrates two primary outcomes: single and no lane causation, denying the null premise of Granger non-causality. Table 6 shows the results of the Granger causality test, which shows a unidirectional relation between Environmental Efficiency and Industrialization, with the causation travelling from Industrialization to Environmental Efficiency, corroborating (Wang et al., 2017; Yin, 2017) assertions that Industrialization causes Environmental Efficiency. This suggests that Industrialization is a significant component in the SSA Environmental Efficiency equation; as a result, the authority concerned is carefully considering the implementation of degradation mitigation measures such as carbon taxes and tax exemptions for renewable energy companies. The empirical finding further reveals a one-way link only from Environmental Efficiency to Growth which is consistent with the empirical studies (Chakravarty et al., 2020).
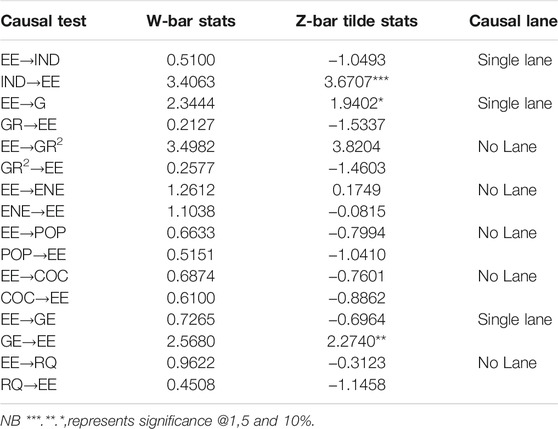
TABLE 6. Results and discussions on causal way assessment.
Further findings reinforce the priori anticipation by proving a one-way causal link going from Government Effectiveness to Environmental Efficiency, which is confirmed in the regression results above that effectiveness of government activities and programs have a positive influence on environmental efficiency. This implies that the current state of government efficacy in SSA attracts investors to the economy. The correct processes and structures, according to the conclusions of this study, are what define the efficacy of government in the SSA region.
The outcome also depicts a non-causal relationship between Energy and Environmental Efficiency. A well-articulated renewable energy-intensive policy that encourages the use of solar, biomass and other alternative sources of energy as alternative source energy will benefit and set the environment on a path to achieving rapid environmental sustainability, according to the study. Another finding reveals a non-causal relationship between Population growth and environmental efficiency related to the studies of (Cropper and Griffiths, 1994; Konisky, 2009). Because most people in the SSA are unaware of how to use contemporary energy sources, which is a critical component of environmental efficiency, Population growth and expansion could have no direct or indirect bearing on ecological efficiency. This is due to the lack of use of modern emission-reduction energy sources in the manufacturing process. Coal and other environmentally degradable forms of energy are the primary sources of energy in the homes and communities of the inhabitants. As a result, governments and administrations in SSA nations must urgently implement upgraded energy sources in homes and residential areas, just as they have in the developed world.
In another situation, the findings revealed that two institutional quality indicators and environmental efficiency have a non-causal relationship. Individuals and industries are not committed to using the country systems, even though SSA nations are expected to build particular national institutions to manage environmental degradation. These national systems are frequently absent. Because developing national systems and institutions to deal with environmental deterioration requires much money, industries are under pressure to bypass systems and structures to get their job started. Instead of individuals and corporations respecting national institutions, priorities, and systems, governments are forced to accommodate industry demands, putting even more strain on weak institutions. According to (Noonan, 2008; Shimshack, 2014; Sigman and Stafford, 2011), environmental enforcement institutions and regulatory operations have no causal connections or relations with environmental protection. They attributed the results to the fact that environmental protection processes and enforcement structures are inadequate and that additional resources should be directed toward it.
5 Conclusion and Implications
The study used a two-phase DEA-GMM model to examine environmental efficiency and the effects of institutions on achieving environmental efficiency after collecting data from 19 SSA nations. In the first phase, we employ the MM-DEA prototype to calculate environmental efficiency while treating good outputs as growth and poor outputs as environmental issues. Environmental efficiency was found to be low in eight SSA countries in 2006 but good in eleven. Botswana and Gabon had the highest average environmental efficiency throughout the first period, while Guinea had the lowest. In addition, most SSA countries have high-efficiency indexes in 2013, with Cote D’Voire having an index of 2.098 and Botswana, South Africa, Senegal, and Tanzania having efficiency rates of 1.00.
The 2 Step System GMM model is used in the second stage to confirm the effects of institutions on environmental efficiency. The EKC Hypothesis is present in the study, according to the results of the second stage. In a study of environmental efficiency, the EKC perspective argues that (GR) and (GR2) have negative and positive approximation coefficients, respectively, and pass the significance test. Further, the degree of economic growth has a significant impact on environmental efficiency, and the Kuznets curve of environmental efficiency occurs in SSA countries, with SSA countries’ environmental efficiency improving as their growth rate increases. There is an outcome of the EKC principle in environmental efficiency estimation, which implies that growth is negative while squared growth is positive (Chen et al., 2017).
The empirical data suggest that improving environmental efficiency requires focusing on population, industrial scale, and energy usage. When it comes to the impact of institutions on environmental efficiency, the study finds that Corruption and regulatory quality negatively impact. The causal examination revealed two major causations, indicating no causal channel and that causation is just one way. The link between Corruption, regulatory quality, energy use, and population growth is non-causal. In contrast, the link between government efficiency, growth, and Industrialization is mono-causal, with the direction of causation shifting from growth, Industrialization, and government efficiency to environmental efficiency.
Our policy ideas for achieving a harmonious coexistence between economic and environmental development are as follows: First, we should encourage more balanced development of SSA trade and investment, particularly in energy-saving and environmental-protection products and technologies; second, prioritize environmental improvement when transforming and modernizing industries. At the same time, we must continue to improve energy-efficient businesses while reducing undesired outputs; third, we must accept aptly differentiated policy dimensions based on the individual circumstances of various industries. Furthermore, industry-specific economic-environmental efficiencies give commercial banks more data to assess the environmental risk associated with their commercial financing services in terms of ecological finance.
Some limitations of the study include: 1) the period of years for the estimation was limited due to the unavailability of data. The number of the countries under study was limited to some sub Saharan Africa countries which do not reflect the whole sub-Sahara African regions.
Data Availability Statement
The original contributions presented in the study are included in the article/Supplementary Materials, further inquiries can be directed to the corresponding author.
Author Contributions
GMB and MA analysed and interpreted the data and carried the overall write up. MA gathered the data for the entire study. LF and ZX research supervision and funding acquisition.
Funding
This research was supported by the National Natural Science Foundation of China (Grant No 71503105).
Conflict of Interest
The authors declare that the research was conducted in the absence of any commercial or financial relationships that could be construed as a potential conflict of interest.
Publisher’s Note
All claims expressed in this article are solely those of the authors and do not necessarily represent those of their affiliated organizations, or those of the publisher, the editors and the reviewers. Any product that may be evaluated in this article, or claim that may be made by its manufacturer, is not guaranteed or endorsed by the publisher.
Abbreviations
AB, Arellano and Bond; CS, Cross Section; CO2, Carbon Emissions; DEA, Data Envelopment Analysis; DH, Dumitrescu and Hurlin; DMU, Decision Making Unit; EE, Environmental Efficiency; ENE, Energy; EKC, Environmental Kuznets Curve; GMM, Generalized method of moment; GDP, Gross Domestic Product; HJ, Hansen J; IND, Industrialization; IPCC, Intergovernmental Panel on Climate Change; IQ, Institutional Quality; MM, Malmquist Model; OECD, Organization for Economic Cooperation and Development; OLS, Ordinary Least Square; PWT, Penn World Table; PPF, Production Possibility Frontier; SBM, Slack Based Measure; SET, Stochastic Error Term; SSA, South Sahara Africa; SFA, Stochastic Frontier Analysis; UN-SDG, United Nations Sustainable Development Goals; WBCSD, World Business Council for Sustainable Progress; WDI, World Development Indicators; WGI, World Governance Indicators.
References
Ahenkan, A., and Osei-Kojo, A. (2014). Achieving Sustainable Development in Africa: Progress, Challenges and Prospects. Int. J. Dev. Sustainability 3 (1), 162–176.
Aigner, D., Lovell, C. A. K., and Schmidt, P. (1977). Formulation and Estimation of Stochastic Frontier Production Function Models. J. Econom. 6 (1), 21–37. doi:10.1016/0304-4076(77)90052-5
Arabi, B., Munisamy, S., Emrouznejad, A., and Shadman, F. (2014). Power Industry Restructuring and Eco-Efficiency Changes: A New Slacks-Based Model in Malmquist-Luenberger Index Measurement. Energy policy 68, 132–145. doi:10.1016/j.enpol.2014.01.016
Arellano, M., and Bover, O. (1995). Another Look at the Instrumental Variable Estimation of Error-Components Models. J. Econom., 68(1), 29–51. doi:10.1016/0304-4076(94)01642-D
Banker, R. D., Charnes, A., and Cooper, W. W. (1984). Some Models for Estimating Technical and Scale Inefficiencies in Data Envelopment Analysis. Manag. Sci. 30 (9), 1078–1092. doi:10.1287/mnsc.30.9.1078
Caves, D. W., Christensen, L. R., and Diewert, W. E. (1982b). Multilateral Comparisons of Output, Input, and Productivity Using Superlative index Numbers. Econ. J. 92 (365), 73–86. doi:10.2307/2232257
Caves, D. W., Christensen, L. R., and Diewert, W. E. (1982a). The Economic Theory of index Numbers and the Measurement of Input, Output, and Productivity. Econometrica 50, 1393–1414. doi:10.2307/1913388
Chakravarty, D., Mandal, S. K., and Indicators, S. (2020). Is Economic Growth a Cause or Cure for Environmental Degradation? Empirical Evidences from Selected Developing Economies. Environ. Sustainability Indicators 7, 100045. doi:10.1016/j.indic.2020.100045
Charnes, A., Cooper, W. W., and Rhodes, E. (1978). Measuring the Efficiency of Decision Making Units. Eur. J. Oper. Res. 2 (6), 429–444. doi:10.1016/0377-2217(78)90138-8
Chen, N., Xu, L., and Chen, Z. (2017). Environmental Efficiency Analysis of the Yangtze River Economic Zone Using Super Efficiency Data Envelopment Analysis (SEDEA) and Tobit Models. Energy 134, 659–671. doi:10.1016/j.energy.2017.06.076
Chien, T., and Hu, J.-L. (2007). Renewable Energy and Macroeconomic Efficiency of OECD and Non-OECD Economies. Energy Policy 35 (7), 3606–3615. doi:10.1016/j.enpol.2006.12.033
Coase, R. H. (1937). The Nature of the Firm. Economica 4 (16), 386–405. doi:10.1111/j.1468-0335.1937.tb00002.x
Coase, R. H. (1960). “The Problem of Social Cost,” in Classic Papers in Natural Resource Economics (Springer), 87–137. doi:10.1057/9780230523210_6
Cropper, M., and Griffiths, C. (1994). The Interaction of Population Growth and Environmental Quality. American Economic Review 84 (2), 250–254.
Dumitrescu, E.-I., and Hurlin, C. (2012). Testing for Granger Non-causality in Heterogeneous Panels. Econ. Model. 29 (4), 1450–1460. doi:10.1016/j.econmod.2012.02.014
Ehrenfeld, J. R. (2005). Eco-efficiency: Philosophy, Theory, and Tools. J. Ind. Ecol. 9 (4), 6–8. doi:10.1162/108819805775248070
Elahi, E., Khalid, Z., Tauni, M. Z., Zhang, H., and Lirong, X. (2021). Extreme Weather Events Risk to Crop-Production and the Adaptation of Innovative Management Strategies to Mitigate the Risk: A Retrospective Survey of Rural Punjab, Pakistan. Technovation, 102255. doi:10.1016/j.technovation.2021.102255
Elahi, E., Khalid, Z., and Zhang, Z. (2022). Understanding Farmers' Intention and Willingness to Install Renewable Energy Technology: A Solution to Reduce the Environmental Emissions of Agriculture. Appl. Energ. 309, 118459. doi:10.1016/j.apenergy.2021.118459
Elahi, E., Zhang, Z., Khalid, Z., and Xu, H. (2022). Application of an Artificial Neural Network to Optimise Energy Inputs: An Energy- and Cost-Saving Strategy for Commercial Poultry Farms. Energy 244, 123169. doi:10.1016/j.energy.2022.123169
Esty, D. C., Levy, M., Srebotnjak, T., and De Sherbinin, A. (2005). Environmental Sustainability index: Benchmarking National Environmental Stewardship. New Haven: Yale Center for Environmental Law Policy, 47.
Färe, R., Grosskopf, S., Lindgren, B., and Roos, P. (1994). “Productivity Developments in Swedish Hospitals: a Malmquist Output index Approach,” in Data Envelopment Analysis: Theory, Methodology, and Applications (Springer), 253–272.
Hermoso-Orzáez, J., García-Alguacil, M., Terrados-Cepeda, J., and Brito, P. (2020). Measurement of Environmental Efficiency in the Countries of the European Union with the Enhanced Data Envelopment Analysis Method (DEA) during the Period 2005–2012. Environmental Science and Pollution Research 27 (13), 15691–15715. doi:10.1007/s11356-020-08029-3
Hosseini, H. M., and Kaneko, S. (2013). Can Environmental Quality Spread through Institutions. Energy Policy 56, 312
Iqbal, W., Yumei, H., Abbas, Q., Hafeez, M., Mohsin, M., Fatima, A., et al. (2019). Assessment of Wind Energy Potential for the Production of Renewable Hydrogen in Sindh Province of Pakistan. Processes 7 (4), 196. doi:10.3390/pr7040196
Kao, C. (1999). Spurious Regression and Residual-Based Tests for Cointegration in Panel Data. J. Econom. 90 (1), 1–44. doi:10.1016/s0304-4076(98)00023-2
Konisky, D. M. (2009). Inequities in Enforcement? Environmental Justice and Government Performance. Journal of Policy Analysis and Management 28 (1), 102–121.
Korhonen, P. J., and Luptacik, M. (2004). Eco-efficiency Analysis of Power Plants: An Extension of Data Envelopment Analysis. Eur. J. Oper. Res. 154 (2), 437–446. doi:10.1016/s0377-2217(03)00180-2
Kumar, S., and Khanna, M. (2009). Measurement of Environmental Efficiency and Productivity: a Cross-Country Analysis, Envir. Dev. Econ., 14, 473–495. doi:10.1017/s1355770x08005032
Liu, D. G., and Guo, J. R. (2016). Empirical Study on Factors Influencing Provincial Environmental Efficiency in China: Based on Social Embedded Perspective and Multilevel Statistical Model. China J. Popul. Resource Environ. 8, 79–87.
Meeusen, W., and van Den Broeck, J. (1977). Efficiency Estimation from Cobb-Douglas Production Functions with Composed Error. Int. Econ. Rev. 18, 435–444. doi:10.2307/2525757
Mohsin, M., Rasheed, A. K., and Saidur, R. (2018). Economic Viability and Production Capacity of Wind Generated Renewable Hydrogen. Int. J. Hydrogen Energ. 43 (5), 2621–2630. doi:10.1016/j.ijhydene.2017.12.113
Noonan, D. S. (2008). Evidence of Environmental Justice: A Critical Perspective on the Practice of EJ Research and Lessons for Policy Design. Social Science Quarterly 89 (5), 1153–1174.
Owen, A. D. (2004). Environmental Externalities, Market Distortions and the Economics of Renewable Energy Technologies. Energ. J. 25 (3), 127–156. doi:10.5547/issn0195-6574-ej-vol25-no3-7
Paavola, J., and Adger, W. N. (2006). Fair Adaptation to Climate Change. Ecol. Econ. 56 (4), 594–609. doi:10.1016/j.ecolecon.2005.03.015
Rong, J. B., Yan, L. J., Huang, S. R., and Zhang, G. (2015). Environmental Efficiency Evaluation under Carbon Emission Constraint in Western China. Ying Yong Sheng Tai Xue Bao 26 (6), 1821–1830.
Roodman, D. (2009). How to Do Xtabond2: An Introduction to Difference and System GMM in Stata. Stata J., 9(1), 86–136. doi:10.1177/1536867X0900900106
Sigman, H., and Stafford, S. (2011). Management of Hazardous Waste and Contaminated Land. Annual Review of Resource Economics, 3 (1), 255–275.
Shimshack, J. P. (2014). The Economics of Environmental Monitoring and Enforcement. Annual Review of Resource Economics, 6 (1), 339–360.
Song, M., Song, Y., An, Q., and Yu, H. (2013). Review of Environmental Efficiency and its Influencing Factors in China: 1998-2009. Renew. Sust. Energ. Rev. 20, 8–14. doi:10.1016/j.rser.2012.11.075
Taskin, F., and Zaim, O. (2001). The Role of International Trade on Environmental Efficiency: a DEA Approach. Econ. Model. 18 (1), 1–17. doi:10.1016/s0264-9993(00)00025-0
Tateishi, H. R., Bragagnolo, C., and de Faria, R. N. (2020). Economic and Environmental Efficiencies of Greenhouse Gases' Emissions under Institutional Influence. Technol. Forecast. Soc. Change, 161, 120321–120322. doi:10.1016/j.techfore.2020.120321
Wang, Q., Zhao, Z., Shen, N., and Liu, T. (2015). Have Chinese Cities Achieved the Win-Win between Environmental protection and Economic Development? from the Perspective of Environmental Efficiency. Ecol. Indicators 51, 151–158. doi:10.1016/j.ecolind.2014.07.022
Wang, X., Han, L., and Yin, L. (2017). Environmental Efficiency and its Determinants for Manufacturing in China. Sustainability 9 (1), 1–18. doi:10.3390/su9020085
Wei, L., and Yunfei, Z. (2016). Chinese Regional Environmental Efficiency Rating and its Influence Factors. J. Beijing Univ. Aeronautics Astronautics Soc. Sci. Edition 29 (3), 30. doi:10.13766/j.bhsk.1008-2204.2015.0127
Wintoki, M. B., Linck, J. S., and Netter, J. M. (2012). Endogeneity and the Dynamics of Internal Corporate Governance. J. Financial Econ., 105(3), 581–606. doi:10.1016/j.jfineco.2012.03.005
Yin, C. (2017). Environmental Efficiency and its Determinants in the Development of China's Western Regions in 2000-2014. Chin. J. Popul. Resour. Environ. 15 (2), 157–166. doi:10.1080/10042857.2017.1327687
Zaim, O., and Taskin, F. (2000). A Kuznets Curve in Environmental Efficiency: an Application on OECD Countries. Environ. Resource Econ. 17 (1), 21–36. doi:10.1023/a:1008318605976
Zhang, Z., Xue, B., Chen, X., and Li, Y. (2015). Convergence in Spatial Difference of Industrial Environmental Efficiency in China. China Popul. Resour. Environ. 25 (2), 30–38.
Zhao, X., Peng, B., Elahi, E., Zheng, C., and Wan, A. (2020). Optimization of Chinese Coal-Fired Power Plants for Cleaner Production Using Bayesian Network. J. Clean. Prod. 273, 122837. doi:10.1016/j.jclepro.2020.122837
Zhao, Y., Peng, B., Elahi, E., and Wan, A. (2021). Does the Extended Producer Responsibility System Promote the green Technological Innovation of Enterprises? an Empirical Study Based on the Difference-In-Differences Model. J. Clean. Prod. 319, 128631. doi:10.1016/j.jclepro.2021.128631
Keywords: institutional quality indicators, data envelopment analysis (DEA), generalized method of moment (GMM), environmental efficiency, EKC (environment kuznets curve)
Citation: Bahizire GM, Fanglin L, Appiah M and Xicang Z (2022) Research on the Advance Role of Institutional Quality on Achieving Environmental Efficiency in Sub Sahara Africa. Front. Environ. Sci. 10:845433. doi: 10.3389/fenvs.2022.845433
Received: 29 December 2021; Accepted: 27 January 2022;
Published: 11 March 2022.
Edited by:
Faik Bilgili, Erciyes University, TurkeyReviewed by:
Ehsan Elahi, Shandong University of Technology, ChinaLuigi Aldieri, University of Salerno, Italy
Copyright © 2022 Bahizire, Fanglin, Appiah and Xicang. This is an open-access article distributed under the terms of the Creative Commons Attribution License (CC BY). The use, distribution or reproduction in other forums is permitted, provided the original author(s) and the copyright owner(s) are credited and that the original publication in this journal is cited, in accordance with accepted academic practice. No use, distribution or reproduction is permitted which does not comply with these terms.
*Correspondence: Li Fanglin, NjU2NTc1OTA1QHFxLmNvbQ==