 Mihaela Simionescu
 Olimpia Neagu
 Beata Gavurova
- 1Institute for Economic Forecasting of the Romanian Academy, Bucharest, Romania
- 2Faculty of Economics, Computer Science and Engineering, “Vasile Goldiș” Western University of Arad, Arad, Romania
- 3Doctoral School in Economic Sciences, University of Oradea, Oradea, Romania
- 4Faculty of Mining, Ecology, Process Control and Geotechnologies, Technical University of Košice, Košice, Slovakia
Achieving global sustainability and greener growth goals poses a challenge for all countries, especially the developing ones. The quality of institutional framework of a country and its effectiveness determines the level of environmental control and sustainability. Since pollution reduction is an objective for European environmental policies, Romania should achieve this goal taking into account the quality of governance. In this study, the impact of Worldwide Governance Indicators on greenhouse gas emissions is assessed for Romania during 1996–2019 using autoregressive distributed lag models. The results indicate that control of corruption, political stability, and regulatory quality reduced pollution in the long-run, while voice and accountability contributed to the growth of greenhouse gas emissions. Renewable energy consumption did not reduce pollution in the short- and long-run during 1996–2019, while the analysis made for 2007–2019 suggested the significant contribution of renewable energy consumption in reducing pollution. The analysis based on Bayesian ridge regressions after Romania joined the European Union indicated that control of corruption and political stability reduced the level of pollution. Policy implications of these results are widely discussed.
Introduction
As a member state, Romania assumed the commitment to implement the European Union’s Renewable Energy Directive (European Union, 2018) that fixed the share of renewable energy in the energy sources to 27% as target for 2030. Moreover, based on the commitments to the Kyoto Protocol and Paris Agreement, Romanian authorities make efforts to promote sustainable clean energy technologies and manage climate change. Also, the recently adopted European Green Deal (EGD) initiative (Dupont et al., 2020) aims to make Europe climate neutral by reducing greenhouse gas emissions to zero by 2050 (Skjaerseth, 2021). The attainment of the assumed goals is under the influence of several economic, social, and political factors. Among them, the quality of institutions specifically, weaknesses, and environmental policies and regulations are found as increasing factors of the environmental degradation caused by pollution in the case of developing countries (e.g., Le & Ozturk, 2020) such as Romania.
Romania registered rising shares of renewable energy sources in the energy consumption mix in recent years. Based on the EUROSTAT data (EUROSTAT, 2021), it is noticeable that the share of energy from renewable sources increased from 16.81% (2004) to 24.29% in 2019.
Several recent studies concluded that policy measures aiming to increase the share of renewable energy sources in the energy mix represent effective tools for pollution reduction (e.g., Khalid et al., 2021; Usman et al., 2021; Usman and Makhdum, 2021; Usman et al., 2022a; Balsalobre-Lorente et al., 2022; Usman et al., 2022b; Huang et al., 2022; Usman and Balsalobre-Lorente, 2022). The quality of governance plays an important role in mitigating the environmental consequences of economic growth (e.g., Chen et al., 2022; Christoforidis and Katrakilidis, 2021; Jamil et al., 2021; Yang and Khan, 2021; Ronaghi et al., 2020). Improved institutional quality positively moderates the size of impacts of renewable energy use and economic growth (e.g., Adekoya et al., 2022; Khan et al., 2022). An effective environmental policy could advance the turning point of pollution, when the pressure of economic activities on the environment starts declining and the economy registers a threshold of its development. This threshold is achieved due to appropriate policy measures oriented on environmental quality.
In recent studies, the model of the environmental Kuznets curve (EKC) was modified in the renewable energy Kuznets curve (RKC) with a U-shaped form, in order to highlight the impact of renewable energy on pollution mitigation. Moreover, promoting renewable energy sources is considered the policy tool for tracking the development of the U-inverted EKC (e.g., Navqi et al., 2021).
The present study aims to assess the impact of quality of governance on greenhouse gas (GHG) emissions in the renewable Kuznets curve (RKC) model for the study of the Romanian economy during 1996–2019.
Despite many studies on economic growth, energy consumption, and environmental degradation, specific research highlighting the environmental implications of institutional quality and renewable energy consumption is scarce. Moreover, taking into consideration the reduced number of studies focused on the RKC model in developing economies, such as Romania, our research intends to cover this gap in the current literature. Another valuable contribution of the study is given by the policy recommendations to support environmental protection starting from the quality of governance. A good control of corruption and political stability make people more aware of the need for a clean environment. Before joining EU, the use of renewable energy did not have significant impact on pollution, and the renewable energy consumption has played an essential role in ensuring a cleaner environment after Romania became a member state and followed the European targets.
The rest of the study is structured as follows. After the description of data, Methodology explains the methodology of the study. Results and Discussion presents the results and discusses its interpretations. Conclusion contains conclusions and policy recommendations.
Literature Review
The Concept of Governance and Its Measurements
The importance of institutions in economy was extensively highlighted in the new institutional economics where they were seen as providing “efficient solutions to economic problems” (Rutherford, 2001). The new institutionalism stimulated a debate that reconnected economics with sociology and political sciences (with concepts such as public trust, social capital or civil society, and social and institutional change).
Kaufmann et al. (2004, 2011) defines governance as “the traditions and institutions by which authority is exercised.” This suggests a process by which governments are selected and replaced, the capacity to design and implement sound public policies and also, the respect of the state and citizens for the institutions that govern economic and social interactions among institutions, citizens, and the state.
Kaufmann et al. (1999) introduced six measures of good governance: the rule of law, regulatory quality, control of corruption, government effectiveness and voice, and accountability. These variables reflect the quality of institutions (e.g., the capacity of the government to design and implement sound policies, the involvement of citizens in the process of public decision making, level of corruption, and law and order) in different countries. The World Bank initiated the Worldwide Governance Indicators project and, as result, a set of Worldwide Governance Indicators was developed. It comprises the following aspects of governance: control of corruption (perception of the extent to which public power is exercised) and regulatory quality (i.e., capacity of the government to formulate and implement sound policies of property rights and sound regulation promoting private sector development) (Kaufmann et al., 1999, 2004, 2010, 2011; www.govindicators.org).
Studies focused on the role of the governance quality on economic and social life are also using metrics of economic freedom to express the institutional quality in a country. For instance, the economic freedom index calculated by the Fraser Institute measures the degree of economic freedom in five major areas: size of government, legal system and security money, and freedom to trade internationally and corruption (Fraser Institute, 2021, https://www.fraserinstitute.org/economic-freedom/approach). The Heritage Foundation in Washington computes also an Index of Economic Freedom based on 12 quantitative and qualitative factors grouped in four categories: the rule of law (property rights, government integrity, and judicial effectiveness), government size (government spending, tax burden, fiscal health), regulatory efficiency (business, labor, and monetary freedom), and open markets (trade, investment, and financial freedom) Heritage Foundation (1973) (https://www.heritage.org/index/about).
nother set of data on institutional quality is provided by the Harvard–MIT Data Center, namely, The International Country Risk data, comprising of 22 variables grouped in three subcategories of risks (political, financial, and economic) for 146 countries during 1984–2019 (ICRG, 2013).
The relevant studies of the current literature regarding the impact of governance on environmental pollution are grouped as follows: 1) using various indicators of institutional quality; 2) focused on diverse aspects of governance and national policy measures; 3) examining the validation of the environmental Kuznets curve (EKC) model; and 4) checking the presence of the renewable Kuznets curve (RKC) model.
Studies Using Various Indicators of institutional Quality
Gani (2012) examined the relationship between five dimensions of good governance (political stability, government effectiveness, regulatory quality, rule of law, and corruption control) and CO2 emissions in a cross-section of 99 developing countries during 1998–2007. His results show that political stability, the rule of law, and control of corruption are negatively associated with CO2 emissions. In their analysis of the twenty largest economies (group of twenty, G-20) during 1996–2010 taking into consideration six governance measures of the World Governance Indicators database, Halkos and Tzeremes (2013) identified a nonlinear relationship between governance indicators and CO2 emissions. Specifically, an increased ability of citizens’ public participation, freedom of association, and free media are associated with lower emissions. The quality of policy formulation, rule of law, and control of corruption has a “U”-shaped relationship with air pollutants, while government instability can induce higher carbon emissions. It is also suggested that increasing the quality of different governance measures does not always induce a reduction in CO2 emissions, and the specific economic and regional variations shaping the way of governance influence the levels of carbon dioxide emissions. Taverdi (2018) identified a nonlinear relationship between CO2 emission and the control of corruption in 125 countries (1991–2011) and found no significant associations between other dimensions of governance (rule of law, regulatory quality, and government effectiveness) on pollution. Baloch and Wang (2019) analyzed the behavior of governance in CO2 emissions in the BRICS countries (Brazil, Russia, India, China, and South Africa) from 1996 to 2017. They found a negative and significant impact of governance on CO2 emissions that can be attributed to the governments’ attitude toward the design and implementation of sound and effective regulations and policies to control environmental degradation. Ronaghi et al. (2020) revealed that the governance represents a factor that has the potential to reduce emissions in the OPEC countries over 8 years (2006–2015). Quality governance increased carbon emissions in Saudi Arabia during 1996–2016 (Omri et al., 2021). Yang and Khan (2021) found that governance has a mediating role together with finance on improving the environmental quality in the South Asian Association for Regional Cooperation (SAARC) for 1996–2018. Jamil et al. (2021) proved that governance managed to decrease CO2 emissions in 49 Belt and Road Initiative (BRI) countries during 1996–2014. Improvement of governance quality increases environmental quality in high-income countries, while it decreases environmental quality in middle-and low-income countries (Gök and Sodhi, 2021). When the dimensions of governance improve, the environmental protection spending reduces the air pollutants. This is the case of Middle East and North Africa (MENA) countries during 1996–2015 (Gholipour and Farzanegan, 2018).
Apergis and Garcia (2019) explored the link between governance quality and energy efficiency for 28 European Union (EU) countries spanning 1995–2014. They measured the institutional quality through indicators of the World Bank (Control of Corruption and Regulatory quality) and Fraser Institute (Economic Freedom). The results show that governance quality is a driver of energy efficiency in the energy sector. Due to the fact that energy policy is a critical part of environmental policies, governance quality could create and maintain a strong and innovative energy sector that generates less pollution. Gil et al. (2019) found that all six dimensions of governance have impact on the slope of the environmental Kuznets curve (EKC) in the case of 19 Southeast Asian countries during 2002–2016.
Also, we identified studies using ICRG data. For example, Dhrifi (2019) used such data sets for 45 African countries during 1995–2015 in order to examine the effects of institutional quality on environmental degradation. His study concluded that the effect of environmental degradation on human health may be decreased through institutional quality. Institutional quality is found as a channel through which environmental quality affects health status. Based on these data sets, another study was developed by Brännlund et al. (2017) in order to assess the impact of the quality of government institutions on the convergence of per capita carbon emission in a panel of 124 countries. They reported a net positive effect of institutional quality on growth of per capita carbon emissions in the globally examined sample and a negative direct effect in the panel of high-income countries.
Studies Focused on Various Aspects of Governance and National Policy Measures
An impressive number of studies are focused on the impact of democracy on environmental quality, as follows. Farzin and Bond (2006) revealed that countries governed by more democratic institutions have a higher tendency to reduce pollution. Li and Reuveny (2006) found that democracy has negative and significant impact on environmental degradation. Similar results were obtained by Bernauer and Koubi (2009) in 42 countries for 1971–1996. According to the results of Arwin and Lew (2011), an increase in democracy positively affects carbon emissions and water pollution in 141 developing countries during 1971–1996. You et al. (2015) found mixed results regarding this relationship in a cross-section of countries during 1985–2005: in their pooled ordinary least squares (OLS) estimation, democracy increases carbon emissions, while in the fixed effect (FE) estimation democracy increase pollution. Similarly, mixed results are reported by Charffeddine and Mrabet (2017) in 15 Middle East and North Africa (MENA) countries during 1975–2007. Fully modified ordinary least squares (FMOLS) estimation indicates that democracy increases the ecological footprint whereas dynamic ordinary least squares (DOLS) findings show a statistical not-validated effect on ecological footprint. Another study on 17 MENA countries conducted by Farzanegan and Markwardt (2018) during 1980–2005 suggests that democracy could be seen as an effective tool for reducing environmental pollution. Contrary to these results, the study developed by Lv (2017) for 19 emerging economies reveals that democracy increased the carbon emission level during 1997–2010.
Kim et al. (2019) identified a positive relationship between democracy and environment quality in 132 countries during of 2014–2016. Policardo (2017) has also shown that democracy and environmental quality are positively correlated in a panel of 47 transition countries. Clark et al. (2019) found that the relationship between democracy and air pollution generated by the power sector in 71 countries between 1980 and 2016 varies according to the EKC logic. Democratic political institutions at lower levels of development are correlated with increased pollution, as country becomes richer; democracy tends to have a negative association with pollution. Usman et al. (2020) revealed that there is no significant relationship between democracy and environmental degradation and confirmed the EKC hypothesis in South Africa from 1971 to 2014. You et al. (2020) reported the validation of EKC hypothesis for 41 Belt and Road initiative countries and suggested that poor democratic institutions are likely to generate higher pollution. Similar results were revealed by Satrovic et al. (2021) in the case of the Gulf Cooperation Council (GCC) region from 1990 to 2019: the democratic accountability promoted the increase of emissions in the examined period, in other words, it failed to contribute to the environmental protection. Adams and Acheampong (2019) found that democracy promotes the decrease of carbon emission in 46 sub-Saharan African countries for 1980–2015, while Adams and Nsiah (2019) revealed for 28 sub-Saharan African countries from 1980 to 2014, namely, that less-democratic countries tend to pollute the environment. Jahanger et al. (2020) revealed that autocracy contributed to the increase of carbon emissions in 74 developing countries during 1990–2016. The study developed by Ren et al. (2020) for the BRICS countries (Brazil, Russia, India, China, and South Africa) from 1992 to 2018 report that the impact of democracy on carbon emissions is significantly negative in high-emission countries. Akalin and Erdogan (2021) examined the democracy-environmental degradation nexus in 26 Organisation for Economic Co-operation and Development (OECD) countries from 1990 to 2015 and found that democracy has a negative effect on environmental quality.
Corruption was identified as an important determinant of environmental performance in 153 countries from 2002 to 2012 by Lisciandra and Migliardo (2017). Wang et al. (2018) revealed a significant moderating role of corruption in the relationship between economic growth and CO2 emissions. They found that control of corruption reduced pollution in a panel of BRICS countries from 1995 to 2015. Similar conclusions had the study of Ozturk and Al-Mulali (2015) in the case of Cambodia, for 1996–2012. Masron and Subramanian (2018) suggest that corruption exhibits a positive impact on pollution and the level of pollution tends to be higher in countries with a higher level of corruption. Control of corruption was found to have a positive effect on per capita emissions of CO2 in MENA countries during 1984–2012 by Sekrafi and Sghaier (2018). Balsalobre-Lorente et al. (2019) found that corruption reduced the positive effect of energy innovation in reducing environmental pollution in 16 selected countries during 1995–2016. Incidents of corruption is also found to be enhancing environmental degradation by reducing the positive impact of renewable energy consumption on environmental quality for BRICS countries (Sinha et al., 2019).
Sulemana and Kpienbaareh (2020) found a negative association between corruption and carbon dioxide emissions in 48 sub-Saharan African countries and 34 OECD countries during 1996–2014. Control of corruption is considered a critical factor in improving environmental quality in non-OECD countries, as noticed by Swain et al. (2020).
Environmental sustainability could be seen as being generated by the effectiveness of national policies managing several economic and social processes such as globalization and financial development, natural resources utilization, inflow of remittances, energy use, government expenditure and taxation or supporting technological innovation, and human capital development.
Globalization had a negative impact on the environment, mainly in the developing countries (i.e., America and Caribbean, Asia, and Africa) (Jahanger et al., 2022) and also in the Gulf Cooperation Council (GCC) countries (Yang et al., 2021) as well as in the Arctic countries (Usman et al., 2022a). Unlike these findings, Usman et al. (2022b) concluded that globalization reduced the ecological footprint in financially resource-rich countries. Similar conclusions were reported by Yang et al. (2020) for a sample of 97 countries and by Jahanger et al. (2020) in the case of 74 developing countries.
Some studies report that financial development reduced environmental degradation (i.e., Usman et al., 2021; Usman et al., 2022a). Moreover, there is a large number of studies concluding that financial development increased pollution. Some examples are Usman and Jahanger (2021) in a sample of 93 countries for 1990 to 2016; Kamal et al. (2021) and Jahanger et al. (2020; 2022) in the developing countries; Yang et al. (2021) for the GCC countries; Usman et al. (2022b) in financially resource-rich countries; Usman and Balsalobre-Lorente (2022) in newly industrialized countries; Ramzan et al. (2022) in Pakistan; Usman and Makhdum (2021) in the BRICS-T countries; and Khalid et al. (2021) in the South Asian Association for Regional Cooperation (SAARC) countries.
Natural resources are also found to be accountable for increasing greenhouse gas (GHG) emissions in the Arctic countries (Usman et al., 2022a). Similar findings were reported by Usman et al. (2022b) for 10 financially resource-rich countries during 1990–2018.
Even globalization can reduce CO2 emissions and promote environmental quality, and the inflow of remittances leads to pollution increase (Yang et al., 2020; Usman and Jahanger, 2021).
Energy consumption generates an increase in pollution in all countries (e.g., Jahanger et al., 2020; Yang et al., 2020; Khalid et al., 2021; Usman and Jahanger, 2021; Yang et al., 2021; Ramzan et al., 2022). Nonrenewable energy utilization expanded environmental degradation (e.g., Usman et al., 2022b), while developing renewable energy sources contribute to the environmental quality (Khalid et al., 2021; Usman et al., 2021; Usman and Makhdum, 2021; Usman et al., 2022a; Balsalobre-Lorente et al., 2022; Usman et al., 2022b; Huang et al., 2022; Usman and Balsalobre-Lorente, 2022).
The dependence of the industrial sector on fossil fuels is a threat for the environment. For example, the newly industrialized countries are facing high levels of pollution due to their intensive industrial activities (Usman and Balsalobre-Lorente, 2022). In this context, deployment of industrial activities with less pollutants (i.e., bioenergy) could be a solution to mitigate carbon emissions. The sustainability of the bioenergy industry was examined by Alsaleh et al. (2021) in selected European countries during 1996–2018. They revealed that this industry can significantly grow as a result of improving the quality of governance indicators. An example of governmental energy policy aiming at the reduction of pollutant emissions is the “double carbon” target adopted in 2020 by the Chinese authorities. Jiang et al. (2022) developed an input–output analysis for reduction in structural emissions within the power and heating industry in China under this goal. They found that the energy structure has a partial effect on decreasing pollution, the energy intensity influence has a limited positive effect, and the demand effect is responsible for emissions growth. They also suggested policy measures for developing a strong electric heating industry in order to decrease emissions from the energy supply side.
The fiscal policy (i.e., government spending and taxation) is found to be the contributor to the increase in pollution by Kamal et al. (2021) in a panel of 105 countries during 1990–2016. Their study suggests that two fiscal policy channels may be used. On the one hand, the fiscal spending on health, education, research, and development may lead to the environmental deterioration through the income channel of individuals. On the other hand, increasing levels of government expenditures for development accompanied by effectiveness of environmental regulations may activate the regulation channel and improve the environmental quality.
Technological innovation can reduce environmental degradation in the developing countries, according to Jahanger et al. (2022). Moreover, it has a moderating effect in reducing the environmental impact of natural resource use. Human capital development was found to be necessary for decreasing the expansion of environmental degradation in these countries (Jahanger et al., 2022). Labor force and urban population can improve environmental quality, according to the study developed by Kamal et al. (2021) for 105 countries during 1990–2016.
Studies Examining the Environmental Kuznets Curve Model
A consistent part of literature dedicated to the environmental Kuznets curve (EKC) in previous years has taken into consideration the role of institutional factors in the nonlinear relationship between per-capita income and environmental degradation. In the early stage of economic development, pollution increases and then, beyond a certain level of per-capita income, economic growth induces the decrease of pollution. The hypothesis of EKC does not depend much on the income levels but rather on institutional factors, considered critical for economic growth and development as well as for reducing environmental degradation. Therefore, a large number of studies are focused to examine the validity of the EKC model, including in the analysis several institutional factors.
Torras and Boyce (1998) analyzed air and water quality indicators in 42 countries and concluded that a more equitable distribution of power contributes positively to EKC relation also that literacy, political rights, and civil liberties have strong effects on environmental quality in low-income countries.
Tamazian and Rao (2010) confirmed the importance of institutional quality on environmental performance and found support for the EKC hypothesis for 24 transition economies for 1993–2014.
Rehman et al. (2012) found evidence in support of the validity of EKC hypothesis in four selected South Asian countries (Pakistan, India, Bangladesh, and Sri Lanka), but also that the presence of corruption delays the turning point of the curve.
Abid (2016) investigated the validity of the EKC model in the case of 26 sub-Saharan African economies during 1996–2010, and also the impact of institutional, economic, and financial factors on CO2 emissions. He found no evidence for EKC hypothesis, but it revealed that some dimensions of governance (political stability, government effectiveness, democracy, and control of corruption) negatively influenced CO2 emissions, while the rule of law and regulatory quality had a positive effect on CO2 emissions.
Masron and Subramanian (2018) found no evidence of EKC hypothesis in a panel of 64 developing countries, suggesting that corruption eliminates the effectiveness of income effect of environmental preservation, invalidating the presence of the U-inverted relationship between income and pollution.
You et al. (2020) identified the presence of the reverse U-inverted relationship between income and CO2 emissions in a panel data covering 41 Belt and Road initiative countries. Moreover, they found that democracy levels promote a nonlinear nexus between income inequality and carbon emissions and poor democratic institutions are conducing to higher levels of pollution.
Liu et al. (2020) provide empirical evidence in support of validation of the EKC model in five high carbon emission countries during 1996–2017 and found that measures of governance influence different emission levels. Overall, all dimensions of governance quality enhance and protect environmental quality.
The institutional quality is considered the moderating factor of the impact of energy consumption on carbon emissions in 39 developing countries for 1995–2017. The EKC hypothesis is confirmed in the presence of institutional quality (Haldar and Sethi, 2021).
Usman and Jahanger (2021) reported evidence in support of validation of the EKC model in a panel of 93 countries from 1990 to 2016, but found that institutional quality deteriorated the environmental quality expressed through the ecological footprint.
Studies Proposing the Renewable Energy Kuznets Curve Model
In recent studies, the share of renewable energy was introduced in the analysis of the energy consumption on environment using the EKC model and the increase of renewable sources in the energy mix is revealed as a contributor to decreasing pollution (e.g., Boluk and Mert, 2014; 2015).
The study of Yao et al. (2019) built a renewable energy consumption rate to express the energy structure of a country and proposed a U-shaped RKC (Renewable Energy Kuznets Curve). It is found that both hypotheses (EKC and RKC) are confirmed in 17 major developing and developed countries and six geo-economic regions of the world during 1990–2014. The RKC is required for equal EKC to reach its optimal level. It means that increasing level of renewable energy sources may lead the EKC to attain its turning point more rapidly.
Similar results were reported by Simionescu (2021), suggesting the U-shaped pattern in the RKC for total pollution and GHG emissions in agriculture in Bulgaria, Czech Republic, Hungary, Slovenia, Slovakia, and Romania while an inverted U-pattern for Poland for 1996–2019.
Naqvi et al. (2021) used the renewable energy share in the consumption mix to express the energy structure in the view of analyzing the EKC and RKC models. In their study across 155 countries of four different income groups during 1990–2017, they confirmed both the hypotheses. Moreover, the turning point of RKC takes place before that of EKC for high-income economies. It is suggested that promoting renewable energy sources could be considered a policy instrument to track the development of the inverted U-shaped EKC.
Simionescu et al. (2022) examined the impact of governance on pollution in the EKC and RKC model, respectively, in 10 Central and Eastern European (CEE) countries during 1990–2019. They found that the rule of law, regulatory quality, and control of corruption contributed in the long run to the environmental quality.
Data
Since this study assesses the impact of quality of governance on GHG emissions in the renewable Kuznets curve (RKC), three types of explanatory variables are used:
- the Worldwide Governance Indicators (World Bank database):
• government effectiveness (quality of public services and policies);
• political stability and absence of violence;
• voice and accountability (citizens’ recognized freedoms);
• control of corruption as public power used for personal benefits;
• regulatory quality as policies to support private environment; and
• rule of law as confidence in the rules that function in society.
- real gross domestic product (GDP) per capita and renewable energy consumption (REC) (World Bank, 2022a);
- control variables: labor productivity represents the output per worker in gross domestic product (GDP) (constant 2011 $ in PPP) (International Labour Organization, 2022) and domestic credit to the private sector (as % of GDP) (World Bank, 2022b).
GHG emission time series are extracted from the Eurostat database (European Union, 2022). The variable is expressed in 1,000 tones CO2 equivalent.
The logarithm was applied to all these time series to make interpretations in terms of elasticities. The descriptive statistics are presented in Table 1.
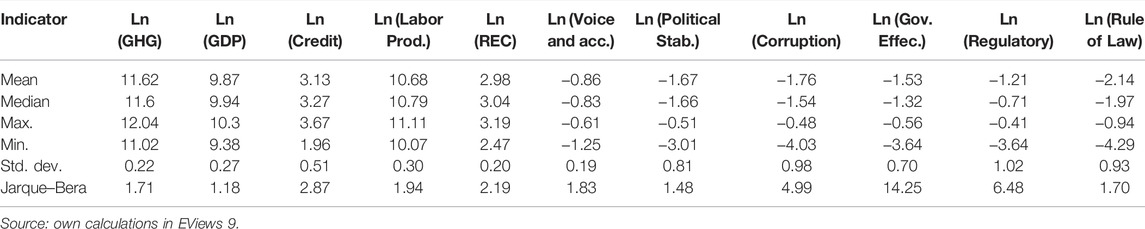
TABLE 1. Descriptive statistics.
According to the results in Table 1, the maximum level of pollution was achieved in 1996, at the beginning of the period, while the minimum was registered in 2019. This result suggests a progress in reducing pollution in Romania. The correlation matrix in Appendix 1 suggests a strong correlation between pollution, GDP, labor productivity, and renewable energy consumption.
Methodology
GHG emissions are explained starting from the renewable energy Kuznets Curve (RKC) as in Yao et al. (2019):
where GDP is the real gross domestic product per capita, GHG is the greenhouse gas emissions, REC denotes the renewable energy consumption, X expresses control variables (vector),
The estimation is made in the framework of the autoregressive distributed lag. The autoregressive distributed lag (ARDL) models describe the long-run and short-run relationships even between series with different orders of integration, with a maximum order of 2. Moreover, these models provide superior estimations even for small samples. In practice, the ARDL models present errors autocorrelation by the existence of endogenous variable among explanatory variables and multicollinearity when ordinary least squares (OLS) is used as estimation method (Kuma, 2018). Therefore, robust techniques of estimation are recommended to overcome these limits (for example, seemingly unrelated regression method).
The general form of ARDL (p,q) is
where Y denotes the dependent variable and X the independent variable;
If the equilibrium or long-run relationship is considered,
The time series for these variables can be stationary/integrated of the first order [I (1)]/one of them stationary and the other integrated of the first order.
These models can highlight the short-term and long-term dynamics of one or more explanatory variables on the dependent variable. In the case of cointegrated time series, the error correction model is used.
Before building ARDL models, stationarity is tested using unit root test. The Augmented Dickey–Fuller (ADF) test provides good results even in the case of serial correlated errors, the Zivot–Andrew (ZA) test is applied in case of series affected by regime changes, and the Phillips–Peron (PP) unit root test is also used for heteroskedastic errors. The Kwiatkowski–Phillips–Schmidt–Shin (KPSS) test is based on the null hypothesis of stationarity and decomposes the time series into the deterministic component, the random component, and the white noise.
If the series are integrated of different orders, the cointegration test of Pesaran et al. (2001) is used, also known as bounds test to cointegration. This test is used to verify the existence of the cointegration relationship (s) between the variables in the ARDL model. The model from which this test starts takes the form of an error correction model:
Specification (4) reflects the model (1) in the form of a vector error correction model based on the cointegration relationship between time series. Eq. 4 can be rewritten as follows:
where
After the estimation of the coefficients in model (4), we may conclude that there is a cointegration relationship between X and Y if and only if
Applying Pesaran’s cointegration test involves two steps:
a) Determining the optimal lag based on an information criterion:
To determine the optimal lag, the information criterion SIC (Schwarz), AIC (Akaike), or HQ (Hannan–Quinn) is used, selecting the model which corresponds to the lowest value for the used information criterion.
where
b) Fisher’s test to check the hypotheses:
The calculated values of type F-statistics are compared with the critical values [limits simulated by Pesaran et al. (2001) for several cases and several thresholds]. The critical values for the lower limit correspond to the values for which the series are stationary, and the critical values for the upper limit take the values for the integrated series of order I [I (1)] (Azam et al., 2021).
If
Toda and Yamamoto (1995) test for checking causality implies few steps:
- calculation of maximum order of integration for all time series using unit root tests
- computation of optimal lag starting from VAR specification for level series (k) or autoregressive polynomial using information criteria; and
- construction of extended VAR model for the level data of order
If the series is stationary, no lag is added to the VAR model. For integrated series I (1), a lag is added to the VAR model. The application of Toda–Yamamoto causality test for two series
The causality test applied to the extended VAR model supposes testing the constraints on the first k parameters, the other coefficients being zero (a possible cointegration relationship). The test uses Wald type W statistics distributed according to the chi-square distribution with r degrees of freedom (r = number of restrictions). This statistic does not depend on the order of integration or cointegration. The test is applied if
A nonlinear ARDL model was employed by Sohail et al. (2021) to assess the effects of air-railway transportation on pollution in Pakistan during 1991–2019. The results indicate positive impact of air-railway transportation on the quality of air in the long-run, but not in the short-run. For Romania and Bulgaria, Hatmanu et al. (2021) showed that growth enhanced CO2 during 1980–2019.
For robustness, other models were run during 2007–2019, after the moment when Romania joined the EU, since the quality of governance has improved. The sub-period is rather small and other types of models are recommended. In this study, Bayesian ridge regression models are employed on stationary data.
Considering a data set
where
If the prior distribution
The ridge regression model is a Bayesian model with normal prior distribution
Results and Discussion
According to the ADF test, the data series is cointegrated of order 1 I (1) for the following variables in logarithm: GHG emissions, GDP per capita, REC, and labor productivity (see Table 2). The data are stationary for the rest of the variables at 5% level of significance. Therefore, Pesaran’s test is recommended to check for cointegration.
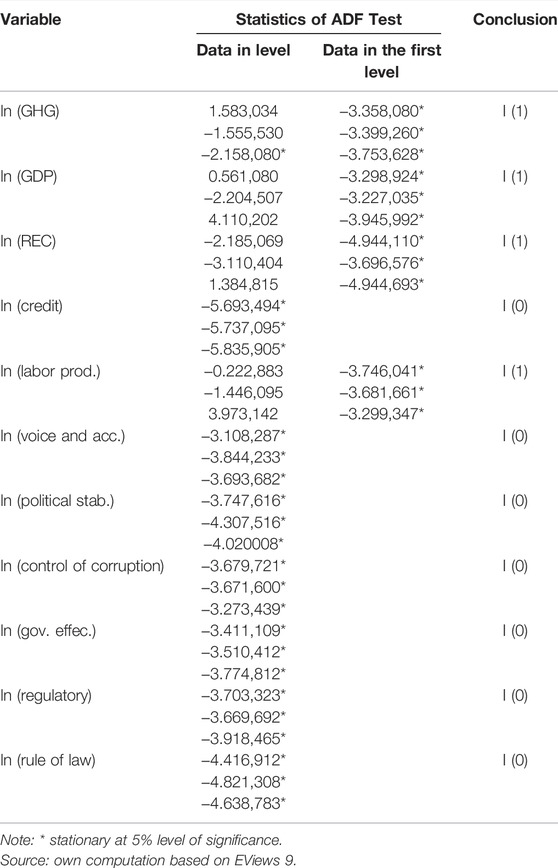
TABLE 2. The results of unit root tests.
Two valid models were selected:
- ARDL (1, 0, 1, 0, 1) model: it explains the GHG emissions using GHG in the previous period, GDP in the current period, and GDP-square in the current and previous period, control of corruption in the current and previous period, domestic credit to private sector;
- ARDL (1, 1, 0, 0, 1, 0) model: it explains the GHG emissions using GHG emissions in the previous period, GDP in the current and previous period, GDP-square in the current period, regulatory quality and political stability in the current period, voice and accountability in the current and previous period.
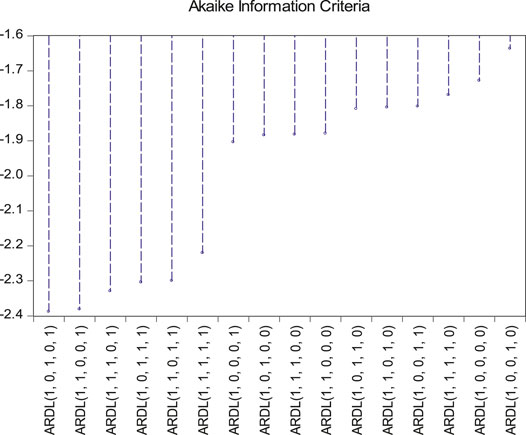
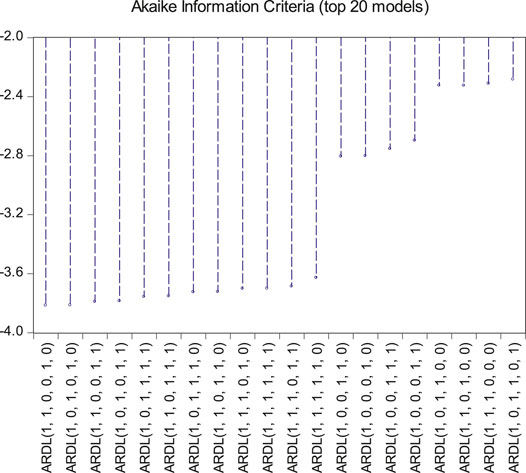
The model selection summaries for these models are presented in Appendix 2. We should note that labor production, renewable energy consumption (REC), rule of law, and government effectiveness do not have a significant impact on pollution. A similar result was also found by Taverdi (2018).
The result of our study presents particular interest for environmental policies since renewable energy consumption does not have the capacity to reduce pollution in Romania in the long- short-run. Therefore, the policies should support the increase in REC to achieve the European targets established in the European Green Deal. The quality of policies and the citizens’ confidence in these policies do not have significant impact in reducing pollution.
Schwartz criterion was used to select the models ARDL (1, 0, 1, 0, 1) and ARDL (1, 1, 0, 0, 1, 0), all the coefficients being significant at 5% level of significance. The superiority of these models on comparison with others is justified in the figures appearing in Appendix 2. The results of Ramsey Regression Equation Specification Error (RESET) test indicate that the models are correctly specified (the null hypothesis is not rejected, since p-value is higher than 0.05). The Breusch–Godfrey test for errors serial correlation of order 1, the White test and Jarque–Bera test indicate that the errors are independent, homoskedastic, and normally distributed (the null hypotheses are not rejected since p-values are higher than 0.05). The ARDL Bounds Test indicates a cointegration relationship between variables since the computed statistic of the test is higher than the critical values.
Based on data displayed in Table 3, an inverted-U pattern in the long-run is identified. The control of corruption had the capacity to reduce the pollution in Romania during 1996–2019. This finding is consistent with similar studies, such as: Gani (2012), Ozturk and Al-Mulali (2015), Wang et al. (2018) and Swain et al. (2020) regarding the impact of corruption control on CO2 emissions.
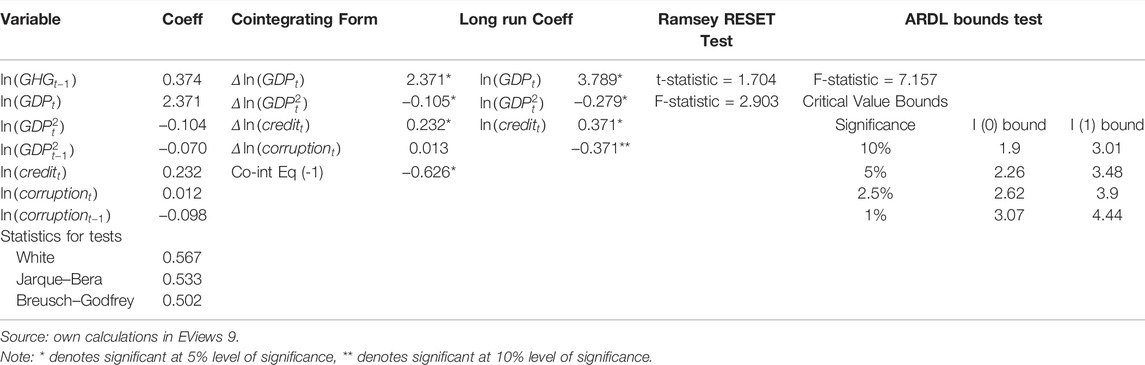
TABLE 3. ARDL (1, 0, 1, 0, 1) to explain GHG emissions in Romania (1996–2019).
According to Table 4, the inverted-U pattern is confirmed. The inverted-U pattern for Romania was previously obtained by Hatmanu et al. (2021) during 1980–2019 using a vector error correction model. The regulatory quality that supports private environment had the capacity to reduce corruption. Voice and accountability enhanced pollution since citizens feel free even to ignore the necessity to protect the environment. On the other hand, political stability reduces GHG emissions in the long-run. This result is similar to the conclusion of Gani (2012) in his study for developing countries. The result of our study suggests that, the citizens’ freedom should be accompanied by a better education for environmental protection. Political stability and support to business environment should be a priority for decision factors in Romania in the fight to mitigate climate challenges.
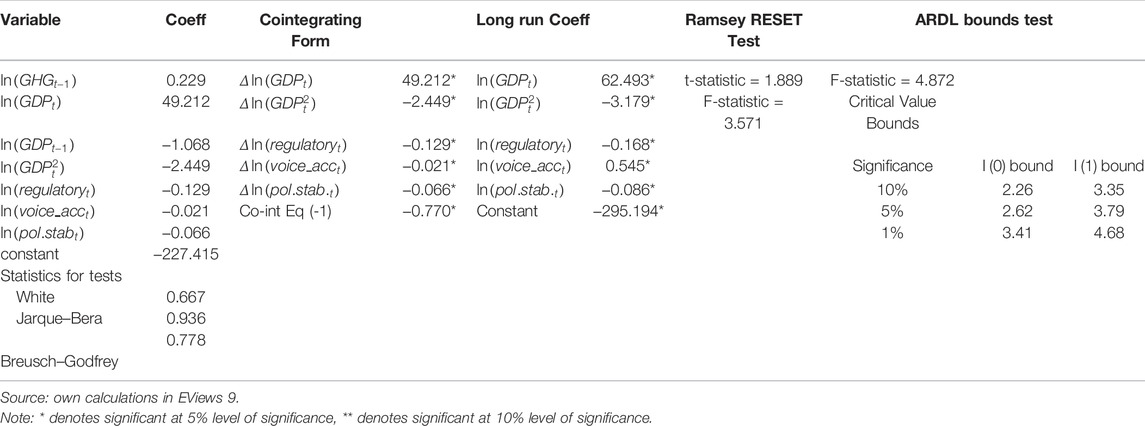
TABLE 4. ARDL (1, 1, 0, 0, 1, 0) to explain GHG emissions in Romania (1996–2019).
The optimal lag for VAR models is 2 and causality is tested in this framework. According to Toda–Yamamoto test, control of corruption is the cause for GHG emissions (computed statistic = 5.593, p-value = 0.061), and voice and accountability is also cause for pollution (computed statistic = 12.612, p-value = 0.0018) at 5% level of significance.
For robustness check after Romania joined the EU, ridge regression models in a Bayesian estimation framework were built and the results are presented in Table 5. PP1SD is the posterior probability that a standardized coefficient is at maximum a standard deviation of zero. An explanatory variable significantly influences the GHG emissions when PP1SD is lower than 0.5.
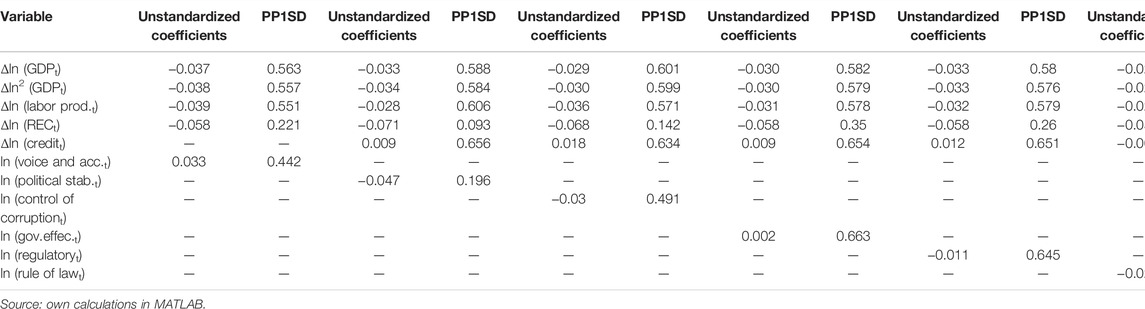
TABLE 5. Bayesian ridge regressions to explain changes in GHG emissions in Romania (2007–2019).
The results for 2007–2019 suggested that EKC is not validated. However, REC contributed to pollution reduction due to European regulations related to targets for renewable resource use. Romania exceeded the target for 2020 due to stimulation of renewable resources through various policy instruments. The role of REC in mitigating climate changes in Romania and other Eastern European countries is proved also in the study of Simionescu (2021). Only voice and accountability, political stability, and control of corruption influenced the GHG emissions in Romania during 2007–2019. A more stable political environment and control of corruption contributed to pollution reduction, which is in line with the study by Swain et al. (2020).
Conclusion
The political instabilities play an important role in the sustainable development, because these affect economic and social development and influence the quality of environment in an indirect way. This study covers the gap from literature related to the impact of quality of governance on pollution in Romania, a country strongly affected by political instabilities reflected in rather frequent changes of risk ratings.
Few main findings are relevant for this country in the period 1996–2019 and allow us to make recommendations to reduce pollution in the near future to be in accordance with the European Green Deal targets. Renewable energy consumption is not enough to support environment protection and more efforts should be made to encourage the use of renewable energy sources (more policy, laws and strategies to promote renewable energy, more incentives and support schemes, etc.). Romanian policy makers should give more attention to establish effective incentives mechanisms for accessible and affordable renewable energy. This can include opportunities for credits with lower interest rates for green business, tax reductions, a large cooperation between private and public entities that could stimulate adoption and implementation of “clean” technologies as well as the extension of the current subsidies for renewable energy use in households. More effective policy measures are required in order to involve citizens in actions for environmental sustainability (educational programs, greener production and consumption, campaigns and concrete actions for environmental protection, and promoting an environmental-protective and responsible behavior). On the other hand, control of corruption, regulatory quality, and political stability reduced GHG emissions, but Romania still has to make efforts to reduce corruption at all decision-making levels (mainly in areas of public procurements related to major infrastructure investments) and create a stable political environment. The COVID-19 pandemic has enhanced the political crisis and a new national strategy is necessary to increase the population confidence in political factors.
For robustness, a separate analysis was conducted during 2007–2019 when Romania was the EU member state. The results based on Bayesian ridge regression models suggest that control of corruption and political stability reduced environmental degradation. Moreover, renewable energy consumption also contributed to less pollution in Romania, but more efforts should be done to continue the use of renewable resources.
In addition to the importance of these results from economic, social, and environmental point of view, this study presents few limitations related to small set of data, the consideration of few variables in the models, and lack of comparisons for the same model with other countries in the Eastern and Central Europe. Therefore, in future studies, the analysis should be extended to other countries in the region, like Poland, Hungary, Czech Republic, Slovakia, Slovenia, and Bulgaria. A comparative analysis between these countries will bring more insights about this topic. Moreover, other explanatory and dependent variables should be considered in the models. For example, the level of pollution could be measured by the CO2 emissions and economic variables like foreign direct investment, economic freedom, export, and trade openness could be considered.
Data Availability Statement
Publicly available datasets were analyzed in this study. This data can be found here: https://databank.worldbank.org/source/worldwide-governance-indicators.
Author Contributions
MS designed the research, collected data, processed data in Stata 15 and Matlab, analyzed data, wrote and revised sections: Data, Methodology, Results and Discussion, Conclusion, ON wrote and revised Introduction and Literature Review, BG wrote and revised Introduction and Literature Review.
Funding
This research was supported by the Scientific Grant Agency of the Ministry of Education, Science, Research, and Sport of the Slovak Republic and the Slovak Academy Sciences as part of the research project VEGA No. 1/0590/22: Exploration of natural, social and economic potential of areas with environmental burdens in the Slovak Republic for the development of specific forms of domestic tourism and quantification of environmental risks.
Conflict of Interest
The authors declare that the research was conducted in the absence of any commercial or financial relationships that could be construed as a potential conflict of interest.
Publisher’s Note
All claims expressed in this article are solely those of the authors and do not necessarily represent those of their affiliated organizations, or those of the publisher, the editors and the reviewers. Any product that may be evaluated in this article, or claim that may be made by its manufacturer, is not guaranteed or endorsed by the publisher.
References
Abid, M., Schilling, J., Scheffran, J., and Zulfiqar, F. (2016). Climate Change Vulnerability, Adaptation and Risk Perceptions at Farm Level in Punjab, Pakistan. Science of the Total Environment 547, 447–460. doi:10.1016/j.scitotenv.2015.11.125
Adams, S., and Acheampong, A. O. (2019). Reducing Carbon Emissions: the Role of Renewable Energy and Democracy. J. Clean. Prod. 240, 118–245. doi:10.1016/j.jclepro.2019.118245
Adams, S., and Nsiah, C. (2019). Reducing Carbon Dioxide Emissions; Does Renewable Energy Matter? Sci. Total Environ. 693, 133288. doi:10.1016/j.scitotenv.2019.07.094
Adekoya, O. B., Ajayi, G. E., Suhrab, M., and Oliyide, J. A. (2022). How Critical Are Resource Rents, Agriculture, Growth, and Renewable Energy to Environmental Degradation in the Resource-Rich African Countries? the Role of Institutional Quality. Energy Policy 164, 112888. doi:10.1016/j.enpol.2022.112888
Akalin, G., and Erdogan, S. (2021). Does Democracy Help Reduce Environmental Degradation? Environ. Sci. Pollut. Res. 28, 7226–7235. doi:10.1007/s11356-020-11096-1
Alsaleh, M., Abdul-Rahim, A. S., and Abdulwakil, M. M. (2021). The Importance of Worldwide Governance Indicators for Transitions toward Sustainable Bioenergy Industry. J. Environ. Manage. 294, 112960. doi:10.1016/j.jenvman.2021.112960
Apergis, N., and Garćıa, C. (2019). Environmentalism in the EU-28 Context: the Impact of Governance Quality on Environmental Energy Efficiency. Environ. Sci. Pollut. Res. 26, 37012–37025. doi:10.1007/s11356-019-06600-1
Arwin, B. M., and Lew, B. (2011). Does Democracy Affect Environmental Quality in Developing Countries? Appl. Econ. 43 (9), 1151–1160. doi:10.1080/00036840802600277
Azam, A., Rafiq, M., Shafique, M., and Yuan, J. (2021). Renewable Electricity Generation and Economic Growth Nexus in Developing Countries: An ARDL Approach. Econ. Research-Ekonomska Istraživanja 34 (1), 2423–2446. doi:10.1080/1331677x.2020.1865180
Bali Swain, R., Kambhampati, U. S., and Karimu, A. (2020). Regulation, Governance and the Role of the Informal Sector in Influencing Environmental Quality? Ecol. Econ. 173, 106649. doi:10.1016/j.ecolecon.2020.106649
Baloch, M. A., and Wang, B. (2019). Analyzing the Role of Governance in CO2 Emissions Mitigation: the BRICS Experience. Struct. Change Econ. Dynam. 51, 119–125. doi:10.1016/j.strueco.2019.08.007
Balsalobre-Lorente, D., Ibáñez-Luzón, L., Usman, M., and Shahbaz, M. (2022). The Environmental Kuznets Curve, Based on the Economic Complexity, and the Pollution haven Hypothesis in PIIGS Countries. Renew. Energ. 185, 1441–1455. doi:10.1016/j.renene.2021.10.059
Balsalobre-Lorente, D., Shahbaz, M., Jabbour, C. J. C., and Driha, O. M. (2019). The Role of Energy Innovation and Corruption in Carbon Emissions: Evidence Based on the EKC Hypothesis. in: Energy and Environmental Strategies in the Era of Globalization. Cham: Springer, 271–304. doi:10.1007/978-3-030-06001-5_11
Bernauer, T., and Koubi, V. (2009). Effects of Political Institutions on Air Quality. Ecological Economics 68 (5), 1355–1365. doi:10.1016/j.ecolecon.2008.09.003
Bölük, G., and Mert, M. (2014). Fossil & Renewable Energy Consumption, GHGs (Greenhouse Gases) and Economic Growth: Evidence from a Panel of EU (European Union) Countries. Energy 74 (2014), 439–446. doi:10.1016/j.energy.2014.07.008
Bölük, G., and Mert, M. (2015). The Renewable Energy, Growth and Environmental Kuznets Curve in Turkey: an ARDL Approach. Renew. Sustain. Energ. Rev. 52, 587–595. doi:10.1016/j.rser.2015.07.138
Brännlund, R., Karimu, A., and Söderholm, P. (2017). Convergence in Carbon Dioxide Carbon Emissions and the Role of Growth and Institutions: a Parametric and Non-parametric Analysis. Environ. Econ. Pol. Stud, 19, 359–390. doi:10.1007/s10018-016-0162-5
Charfeddine, L., and Mrabet, Z. (2017). The Impact of Economic Development and Social-Political Factors on Ecological Footprint: a Panel Data Analysis for 15 MENA Countries. Renew.Sustain. Energ. Rev. 76, 138–154. doi:10.1016/j.rser.2017.03.031
Chen, Z., Hao, X., and Zhou, M. (2022). Does Institutional Quality Affect Air Pollution? Environ. Sci. Pollut. Res. 2022, 1–22. doi:10.1007/s11356-021-17934-0
Christoforidis, T., and Katrakilidis, C. (2021). The Dynamic Role of Institutional Quality, Renewable and Non-renewable Energy on the Ecological Footprint of OECD Countries: Do Institutions and Renewables Function as Leverage Points for Environmental Sustainability? Environ. Sci. Pollut. Res. 28, 53888–53907. doi:10.1007/s11356-021-13877-8
Clark, R., Zucker, N., and Urpelainen, J. (2019). Political Institutions and Pollution: Evidence from Coal‐Fired Power Generation. Rev. Pol. Res. 36 (5), 586–602. doi:10.1111/ropr.12356
Dhrifi, A. (2019). Does Environmental Degradation, Institutional Quality, and Economic Development Matter for Health? Evidence from African Countries. J. Knowl Econ. 10, 1098–1113. doi:10.1007/s13132-018-0525-1
Dupont, C., Oberthür, S., and von Homeyer, I. (2020). The Covid-19 Crisis: a Critical Juncture for EU Climate Policy Development? J. Eur. Integration 42 (8), 1095–1110. doi:10.1080/07036337.2020.1853117
European Union (2018). 2018 Renewable Energy Directive, European Union Information Website. Available at: https://ec.europa.eu/energy/en/topics/renewable-energy/.
European Union (2022). Eurostata Database. Available at: https://ec.europa.eu/eurostat/web/main/data/database.
EUROSTAT. (2021). Share of Energy from Renewable Sources (NRG_IND_REN_custom_1649472). Available at: https://ec.europa.eu/eurostat/databrowser/product/view/NRG_IND_REN.
Farzanegan, M. R., and Markwardt, G. (2018). Development and Pollution in the Middle East and North Africa: Democracy Matters. J. Pol. Model. 40, 350–374. doi:10.1016/j.jpolmod.2018.01.010
Farzin, H. Y., and Bond, C. A. (2006). Democracy and Environmental Quality. J. Develop. Econ. 81, 213–235. doi:10.1016/j.jdeveco.2005.04.003
Fraser Institute (2021). Economic Freedom. Available at: https://www.fraserinstitute.org/economic-freedom/approach.
Gani, A. A. (2012). The Relationship between Good Governance and Carbon Dioxide Emissions: Evidence from Developing Economies. J.Econ.Dev. 37 (1), 77–93. doi:10.35866/caujed.2012.37.1.004
Gholipour, H. F., and Farzanegan, M. R. (2018). Institutions and the Effectiveness of Expenditures on Environmental protection: Evidence from Middle Eastern Countries. Const Polit. Econ. 29, 20–39. doi:10.1007/s10602-017-9246-x
Gil, A. R., Vishwanathan, K. K., and Hassan, S. (2019). Effects of Governance on the Environmental Kuznets Curve (EKC) in South and South East Asian Countries. Pakistan J. Soc. Sci. 39 (3), 1101–1114. Available at: https://www.bzu.edu.pk/PJSS/Vol33No12013/PJSS-Vol39-No3/PJSS-Vol39-No3-32.pdf (Accessed January 7, 2022).
Gök, A., and Sodhi, N. (2021). The Environmental Impact of Governance: a System-Generalized Method of Moments Analysis. Environ. Sci. Pollut. Res. 28, 32995–33008. doi:10.1007/s11356-021-12903-z
Haldar, A., and Sethi, N. (2021). Effect of Institutional Quality and Renewable Energy Consumption on CO2 Emissions−an Empirical Investigation for Developing Countries. Environ. Sci. Pollut. Res. 28, 15485–15503. doi:10.1007/s11356-020-11532-2
Halkos, G. E., and Tzeremes, N. G. (2013). Carbon Dioxide Emissions and Governance: a Nonparametric Analysis for the G-20. Energ. Econ. 40, 110–118. doi:10.1016/j.eneco.2013.06.010
Hatmanu, M., Cautisanu, C., and Iacobuta, A. O. (2021). On the Relationships between CO2 Emissions and Their Determinants in Romania and Bulgaria. An ARDL Approach. Appl. Econ. 54, 1–14. doi:10.1080/00036846.2021.1998328
Heritage Foundation (1973). Think Tank. Available at: https://www.heritage.org/index/about.
Huang, Y., Haseeb, M., Usman, M., and Ozturk, I. (2022). Dynamic Association between ICT, Renewable Energy, Economic Complexity and Ecological Footprint: Is There Any Difference between E-7(developing) and G-7 (Developed) Countries? Technol. Soc. 68, 101853. doi:10.1016/j.techsoc.2021.101853
ICRG (2013). International Country Risk Guide (ICRG) Researchers Dataset, V8. Cambridge, MA, United States: Harvard Dataverse. doi:10.7910/DVN/4YHTPU
International Labour Organization (2022). Statistics and Databases. Available at: https://www.ilo.org/global/statistics-and-databases/lang–en/index.htm.
Jahanger, A., Usman, M., and Balsalobre-Lorente, D. (2020). Autocracy, Democracy, Globalization, and Environmental Pollution in Developing World: Fresh Evidence from STIRPAT Model. J. Public Aff. e2753. doi:10.1002/pa.2753
Jahanger, A., Usman, M., Murshed, M., Mahmood, H., and Balsalobre-Lorente, D. (2022). The Linkages between Natural Resources, Human Capital, Globalization, Economic Growth, Financial Development, and Ecological Footprint: The Moderating Role of Technological Innovations. Resour. Pol. 76, 102569. doi:10.1016/j.resourpol.2022.102569
Jamil, B., Yaping, S., Ud Din, N., Nazneen, S., and Mushtaq, A. (2021). Do governance Indicators Interact with Technological Innovation and Income Inequality in Mitigating CO2 Emissions in Belt and Road Initiative Countries? Environ. Sci. Pollut. Res. 28, 51278–51296. doi:10.1007/s11356-021-14096-x
Jiang, T., Yu, Y., Jahanger, A., and Balsalobre-Lorente, D. (2022). Structural Emissions Reduction of China's Power and Heating Industry under the Goal of "double Carbon": A Perspective from Input-Output Analysis. Sustainable Prod. Consumption 31, 346–356. doi:10.1016/j.spc.2022.03.003
Kamal, M., Usman, M., Jahanger, A., and Balsalobre-Lorente, D. (2021). Revisiting the Role of Fiscal Policy, Financial Development, and Foreign Direct Investment in Reducing Environmental Pollution during Globalization Mode: Evidence from Linear and Nonlinear Panel Data Approaches. Energies 14, 6968. doi:10.3390/en14216968
Kaufmann, D., Kraay, A., and Mastruzzi, M. (2010). The Worldwide Governance Indicators: Methodology and Analytical Issues, Policy Research Working paper No. 5430. Washington, D.C., United States: World Bank. Available at: http://papers.ssrn.com/sol3papers.cfm?abstract_id=1682130)
Kaufmann, D., Kraay, A., and Mastruzzi, M. (2004). Governance Matters III: Governance Indicators for 1996, 1998, 2000, and 2002. World Bank Econ. Rev. 18 (2), 253–287. doi:10.1093/wber/lhh041
Kaufmann, D., Kraay, A., and Mastruzzi, M. (2011). The Worldwide Governance Indicators: Methodology and Analytical Issues. Hague J. Rule L. 3, 220–246. doi:10.1017/s1876404511200046
Kaufmann, D., Kraay, A., and Zoido-Lobaton, P. (1999). Aggregating Governance Indicators, Policy Research Working paper No. 2196. Washington, D.C., United States: World Bank. Available at: http://www.worldbank.org/wbi/governance/working_papers.htm).
Khalid, K., Usman, M., and Mehdi, M. A. (2021). The Determinants of Environmental Quality in the SAARC Region: a Spatial Heterogeneous Panel Data Approach. Environ. Sci. Pollut. Res. 28, 6422–6436. doi:10.1007/s11356-020-10896-9
Khan, A. A., Khan, S. U., Ali, M. A. S., Safi, A., Gao, Y., Ali, M., et al. (2022). Role of Institutional Quality and Renewable Energy Consumption in Achieving Carbon Neutrality: Case Study of G-7 economiesRole of Institutional Quality and Renewable Energy Consumption in Achieving Carbon Neutrality: Case Study of G-7 Countries. Sci. Total Environ. 814, 152797. doi:10.1016/j.scitotenv.2021.152797
Kim, S., Baek, J., and Heo, E. (2019). A New Look at the Democracy–Environment Nexus: Evidence from Panel Data for High- and Low-Income Countries,. Sustainability 11, 1–14. doi:10.3390/su11082353
Kuma, J. K. (2018). Modélisation ARDL, Test de cointégration aux bornes et Approche de Toda-Yamamoto: éléments de théorie et pratiques sur logiciels. Available at: https://hal.archives-ouvertes.fr/cel-01766214 (accessed November 4, 2021).
Le, H. P., and Ozturk, I. (2020). The Impacts of Globalization, Financial Development, Government Expenditures, and Institutional Quality on CO2 Emissions in the Presence of Environmental Kuznets Curve. Environ. Sci. Pollut. Res. 27, 22680–22697. doi:10.1007/s11356-020-08812-2
Li, Q., and Reuveny, R. (2006). Democracy and Environmental Degradation. Internat.Stud. Q. 50 (4), 935–956. doi:10.1111/j.1468-2478.2006.00432.x
Lisciandra, M., and Migliardo, C. (2017). An Empirical Study of the Impact of Corruption on Environmental Performance: Evidence from Panel Data. Environ. Resource Econ. 68, 297–318. doi:10.1007/s10640-016-0019-1
Liu, X., Latif, K., Latif, Z., and Li, N. (2020). Relationship between Economic Growth and CO2 Emissions: Does Governance Matter? Environ. Sci. Pollut. Res. 27, 17221–17228. doi:10.1007/s11356-020-08142-3
Lv, Z. (2017). The Effect of Democracy on CO 2 Emissions in Emerging Countries: Does the Level of Income Matter? Renew. Sustain. Energ. Rev. 72, 900–906. doi:10.1016/j.rser.2017.01.096
Masron, T. A., and Subramaniam, Y. (2018). The Environmental Kuznets Curve in the Presence of Corruption in Developing Countries. Environ. Sci. Pollut. Res. 25, 12491–12506. doi:10.1007/s11356-018-1473-9
Navqi, S. A. A., Shah, S. A. R., Anwar, S., and Raza, H. (2021). Renewable Energy, Economic Development, and Ecological Footprint Nexus: Fresh Evidence of Renewable Energy Environment Kuznets Curve (RKC) from Income Groups. Environ. Sci. Pollut. Res. 28, 2031–2051. doi:10.1007/s11356-020-10485-w
Omri, A., Kahia, M., and Kahouli, B. (2021). Does Good Governance Moderate the Financial development-CO2 Emissions Relationship? Environ. Sci. Pollut. Res. 28, 47503–47516. doi:10.1007/s11356-021-14014-1
Ozturk, I., and Al-Mulali, U. (2015). Investigating the Validity of the Environmental Kuznets Curve Hypothesis in Cambodia. Ecol. Ind. 57, 324e30. doi:10.1016/j.ecolind.2015.05.018
Pesaran, M. H., Shin, Y., and Smith, R. J. (2001). Bounds Testing Approaches to the Analysis of Level Relationships. J. Appl. Econ. 16 (3), 289–326. doi:10.1002/jae.616
Policardo, L. (2017). Is Democracy Good for the Environment? Quasi-Experimental Evidence from Regime Transitions. Environ. Res. Econ. 64, 275–300. doi:10.1007/s10640-014-9870-0
Ramzan, M., Raza, S. A., Usman, M., Sharma, G. D., and Iqbal, H. A. (2022). Environmental Cost of Non-renewable Energy and Economic Progress: Do ICT and Financial Development Mitigate Some burden? J.Clean.Prod. 333, 130666. doi:10.1016/j.jclepro.2021.130066
Rehman, F. U., Nasir, M., and Kanwal, F. (2012). Nexus between Corruption and Regional Environmental Kuznets Curve: the Case of South Asian Countries. Environ. Dev. Sustain. 14, 827–841. doi:10.1007/s10668-012-9356-6
Ren, Y., Liu, L., Zhu, H., and Tang, R. (2020). The Direct and Indirect Effects of Democracy on Carbon Dioxide Emissions in BRICS Countries: Evidence from Panel Quantile Regression. Environ. Sci. Pollut. Res. 27, 33085–33102. doi:10.1007/s11356-020-09167-4
Ronaghi, M., Reed, M., and Saghaian, S. (2020). The Impact of Economic Factors and Governance on Greenhouse Gas Emission. Environ. Econ. Pol. Stud. 22, 153–172. doi:10.1007/s10018-019-00250-w
Rutherford, M. (2001). Institutional Economics: Then and Now. J. Econ. Perspect. 15 (3), 173–194. doi:10.1257/jep.15.3.173
Satrovic, E., Ahmad, M., and Muslija, A. (2021). Does Democracy Improve Environmental Quality of GCC Region? Analysis Robuts to Cross-Section Dependence and Slope Heterogeneity. Environ.l Sci.Pollut.Res. 28, 6297–62942. doi:10.1007/s11356-021-15020-z
Sekrafi, H., and Sghaier, A. (2018). Examining the Relationship between Corruption, Economic Growth, Environmental Degradation, and Energy Consumption: a Panel Analysis in MENA Region. J. Knowl Econ. 9, 963–979. doi:10.1007/s13132-016-0384-6
Simionescu, M., Strielkowski, W., and Gavurova, B. (2022). Could Quality of Governance Influence Pollution? Evidence from the Revised Environmental Kuznets Curve in Central and Eastern European Countries. Energ. Rep. 8, 809–819. doi:10.1016/j.egyr.2021.12.031
Simionescu, M. (2021). The Nexus between Economic Development and Pollution in the European Union New Member States. The Role of Renewable Energy Consumption. Renew. Energ. 179, 1767–1780. doi:10.1016/j.renene.2021.07.142
Sinha, A., Gupta, M., Shahbaz, M., and Sengupta, T. (2019). Impact of Corruption in Public Sector on Environmental Quality: Implications for Sustainability in BRICS and Next 11 Countries. J. Clean. Prod. 232, 1379–1393. doi:10.1016/j.jclepro.2019.06.066
Skjærseth, J. B. (2021). Towards a European green deal: The Evolution of EU Climate and Energy Policy Mixes,. Int. Environ. Agreem. Polit. L. Econ 21 (1), 25–41. doi:10.1007/s10784-021-09529-4
Sohail, M. T., Ullah, S., Majeed, M. T., and Usman, A. (2021). Pakistan Management of green Transportation and Environmental Pollution: a Nonlinear ARDL Analysis. Environ. Sci. Pollut. Res. 28 (23), 29046–29055. doi:10.1007/s11356-021-12654-x
Sulemana, I., and Kpienbaareh, D. (2020). Corruption and Air Pollution: a Comparative Study of African and OECD Countries. Air Qual. Atmos. Health 13, 1421–1429. doi:10.1007/s11869-020-00896-6
Tamazian, A., and Rao, B. B. (2010). Do economic, Financial and Institutional Developments Matter for Environmental Degradation? Evidence from Transitional Economies. Energ. Econ. 32, 137–145. doi:10.1016/j.eneco.2009.04.004
Taverdi, Y. (2018). Aspects of Governance and CO2 Emissions: a Nonlinear Panel Data Analysis. Environ. Res. Econ. 69, 167–194. doi:10.1007/s10640-016-0071-x
Toda, H. Y., and Yamamoto, T. (1995). Statistical Inference in Vector Autoregressions with Possibly Integrated Processes. J.Econom. 66 (1-2), 225–250. doi:10.1016/0304-4076(94)01616-8
Torras, M., and Boyce, J. K. (1998). Income, Inequality, and Pollution: a Reassessment of the Environmental Kuznets Curve. Ecol. Econ. 25 (2), 147–160. doi:10.1016/s0921-8009(97)00177-8
Usman, M., and Balsalobre-Lorente, D. (2022). Environmental Concern in the Era of Industrialization: Can Financial Development, Renewable Energy and Natural Resources Alleviate Some Load? Energy Policy 162, 112780. doi:10.1016/j.enpol.2022.112780
Usman, M., Balsalobre-Lorente, D., Jahanger, A., and Ahmad, P. (2022b). Pollution Concern during Globalization Mode in Financially Resource-Rich Countries: Do Financial Development, Natural Resources, and Renewable Energy Consumption Matter? Renew. Energ. 183, 90–102. doi:10.1016/j.renene.2021.10.067
Usman, M., and Jahanger, A. (2021). Heterogeneous Effects of Remittances and Institutional Quality in Reducing Environmental Deficit in the Presence of EKC Hypothesis: A Global Study with the Application of Panel Quantile Regression. Environ. Sci. Pollut. Res. 28, 37292–37310. doi:10.1007/s11356-021-13216-x
Usman, M., Jahanger, A., Makhdum, M. S. A., Balsalobre-Lorente, D., and Bashir, A. (2022a). How Do Financial Development, Energy Consumption, Natural Resources, and Globalization Affect Arctic Countries' Economic Growth and Environmental Quality? an Advanced Panel Data Simulation. Energy 241, 122515. doi:10.1016/j.energy.2021.122515
Usman, M., Makhdum, M. S. A., and Kousar, R. (2021). Does Financial Inclusion, Renewable and On-Renewable Energy Utilization Accelerate Ecological Footprints and Economic Growth? Fresh Evidence from 15 Highest Emitting Countries. Sustain. Cities Soc. 65, 102590. doi:10.1016/j.scs.2020.102590
Usman, M., and Makhdum, M. S. A. (2021). What Abates Ecological Footprint in BRICS-T Region? Exploring the Influence of Renewable Energy, Non-renewable Energy, Agriculture, forest Area and Financial Development. Renew. Energ. 179, 12–28. doi:10.1016/j.renene.2021.07.014
Usman, O., Olanipekun, I. O., Iorember, P. T., and Abu-Goodman, M. (2020). Modelling Environmental Degradation in South Africa: the Effects of Energy Consumption, Democracy, and Globalization Using Innovation Accounting Tests. Environ. Sci. Pollut. Res. 27 (8), 8334–8349. doi:10.1007/s11356-019-06687-6
Wang, Z., Danish, B., and Zhang, B. (2018). The Moderating Role of Corruption between Economic Growth and CO2 Emissions: Evidence from BRICS Economies. Energy 148, 506–513. doi:10.1016/j.energy.2018.01.167
World Bank (2022a). World Bank Open Data. https://data.worldbank.org/.
World Bank (2022b). Worldwide Governance Indicators. www.govindicators.org.
Yang, B., Jahanger, A., and Khan, M. A. (2020). Does the Inflow of Remittances and Energy Consumption Increase CO2 Emissions in the Era of Globalization? A Global Perspective. Air Qual. Atmos. Health 13, 1313–1328. doi:10.1007/s11869-020-00885-9
Yang, B., Jahanger, A., Usman, M., and Khan, M. A. (2021). The Dynamic Linkage between Globalization, Financial Development, Energy Utilization, and Environmental Sustainability in GCC Countries. Environ. Sci. Pollut. Res. 28, 16568–16588. doi:10.1007/s11356-020-11576-4
Yang, Y., and Khan, A. (2021). Exploring the Role of Finance, Natural Resources, and Governance on the Environment and Economic Growth in South Asian Countries. Environ. Sci. Pollut. Res. 28, 50447–50461. doi:10.1007/s11356-021-14208-7
Yao, S., Zhang, S., and Zhang, X. (2019). Renewable Energy, Carbon Emission and Economic Growth: A Revised Environmental Kuznets Curve Perspective. J. Clean. Prod. 235, 1338–1352. doi:10.1016/j.jclepro.2019.07.069
You, W.-H., Zhu, H.-M., Yu, K., and Peng, C. (2015). Democracy, Financial Openness, and Global Carbon Dioxide Emissions: Heterogeneity across Existing Emission Levels. World Develop. 66, 189–207. doi:10.1016/j.worlddev.2014.08.013
You, W., Li, Y., Guo, P., and Guo, Y. (2020). Income Inequality and CO2 Emissions in belt and Road Initiative Countries: the Role of Democracy. Environ. Sci. Pollut. Res. 27, 6278–6299. doi:10.1007/s11356-019-07242-z
Appendix 1
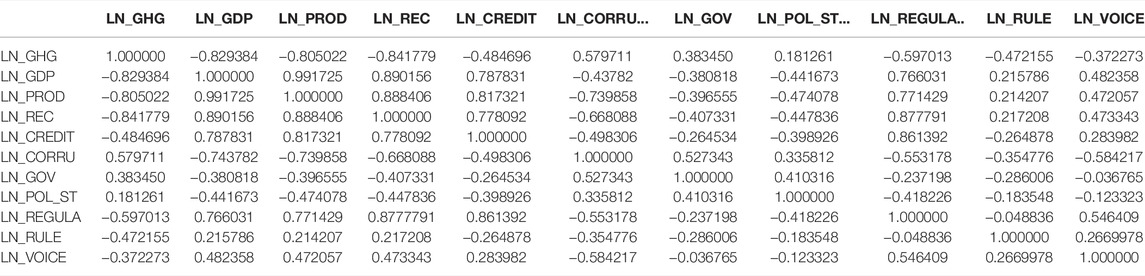
. Correlation matrix
Appendix 2
Model selection summaries
ARDL(1, 0, 1, 0, 1)
ARDL(1, 1, 0, 0, 1, 0)
Keywords: GHG emissions, pollution, ARDL model, governance, corruption
Citation: Simionescu M, Neagu O and Gavurova B (2022) The Role of Quality of Governance in Reducing Pollution in Romania: An ARDL and Nonparametric Bayesian Approach. Front. Environ. Sci. 10:892243. doi: 10.3389/fenvs.2022.892243
Received: 08 March 2022; Accepted: 18 March 2022;
Published: 21 April 2022.
Edited by:
Magdalena Radulescu, University of Pitesti, RomaniaCopyright © 2022 Simionescu, Neagu and Gavurova. This is an open-access article distributed under the terms of the Creative Commons Attribution License (CC BY). The use, distribution or reproduction in other forums is permitted, provided the original author(s) and the copyright owner(s) are credited and that the original publication in this journal is cited, in accordance with accepted academic practice. No use, distribution or reproduction is permitted which does not comply with these terms.
*Correspondence: Mihaela Simionescu, bWloYWVsYS5zaW1pb25lc2N1QGlwZS5ybw==