 Aarif Mohammad Khan1†
 Uzma Khan
 Muhammad Kamran Khan
- 1Department of Finance, College of Business Administration, Prince Sattam Bin Abdulaziz University, Alkharj, Saudi Arabia
- 2Management Studies Department, Bahria Business School, Bahria University, Islamabad, Pakistan
Travel and tourism have glimpsed a significant and promising implication for economic development. Despite the commendatory implication of tourism, it levies a stringent environmental cost such as environmental degeneration. Hence, this study will incorporate the 18 countries out of the top 20 travel and tourism contributors to economic growth to assess the progressive correlation between tourist arrival, economic growth, energy consumption, and oil consumption on carbon emission by applying panel ARDL spanning from 1995 to 2019. The outcome of the panel ARDL reveals that both periods have witnessed that the endogenous variables have a substantial and positive impact on environmental degradation except for tourism as it indicates −0.22 and −0.48% in the long and short run, having a rate of adjustment as −0.52 toward the equilibrium. The simultaneous quantile regression reveals that in the 50 and 75 percentiles, the effect of tourism has a negative impact, which contradicts the PMG findings. These determinations suggest that the policymakers look for more manageable and environmentally sound tourism and economic growth procedures to safeguard the sustainable environment in the studied countries.
Introduction
The early stage of economic progress is the prime cause of environmental quality deterioration. Almost both advanced and emerging economies find it hard to cope with environmental deterioration (Arslan et al., 2022). The environmentalist economist has reinterpreted the Kuznets theory with an upgradation by showing the concern toward the environment and termed the environmental Kuznets curve (EKC), intending to examine the affinity between economic growth and environmental degradation. It states that the initial stages of economic extension lead to CO2 emissions, but these emissions start to decline after a certain threshold level. Grossman and Krueger (1991) conducted the first EKC hypothesis testing. Later on, various researchers have examined it with different econometric techniques applied to different datasets and obtained mixed and inconclusive results (Taghizadeh-Hesary et al. (2022), Hassan et al. (2022), Dinda and Coondoo (2006), Ozturk and Acaravci (2010), Al-Mulali et al. (2015a), Apergis and Ozturk (2015), (Khan et al., 2022a), Shahbaz et al. (2015), and Al-Mulali et al. (2015b).
The present study probed the nexus between environmental degradation measured in carbon dioxide emissions and economic growth. In 1965, the CO2 emission was 11,207.7 million tonnes, which reached 34,169 million tonnes in 2019. Thus, there is an increase of 204.87% from 1965 to 2019 (BP stats 2020). As a result, international awareness has increased about climate change and global warming. In this reference, an agreement was introduced 1997 to control carbon dioxide emissions that cause greenhouse gas (GHG) emissions in advanced economies named the Kyoto Protocol agreement (Pao and Tsai, 2011; Apergis and Danuletiu, 2014), but these advanced economies led uncertainty toward it as it cost them less economic gain (Shahbaz et al., 2013a). However, again, in 2015, another treaty was signed by 196 countries, known as the Paris climate change agreement, with an ambition to bring all the nations under one roof of an agreement to resist climate change and the adoption of efficient technologies to lower the global temperature by 2°C (UN climate change 2020). Hence, emerging countries are facing the mission of enhancing the efficiency of their energy consumption to achieve sustainable economic growth.
In the contemporary epoch of globalization, tourism is a budding spot for GDP growth in advanced and emerging economies. The tourism sector has shown a resounding impact on economic growth and has become a fast-growing economic activity worldwide. It has arisen as a crucial driver in the process of economic expansion for both advanced and less advanced countries (Li and Lin, 2015; Cetin et al., 2018; Park et al., 2018; Cannonier and Burke, 2019; Chai et al., 2019; Kirikkaleli et al., 2021). In addition to these advantages, it has some unfavorable impacts on the ecosphere as economic activities escalate due to tourism leading to carbon emissions. As Paramati et al., 2017 portrayed, tourism had shown an incredible shift in previous decades despite the sociopolitical instability and economic crisis. Therefore, it is an influential economic sector as it donated 10.4% to global GDP and delivers 1 in 4 of all new jobs created across the world (WTTC, 2021). According to Lew (2011), international travel and tourism comprise a significant part of the global economy and are the most extensive service sector in international trade. As a result, it bumps economic development (Hossain 2011; Yu et al., 2012; Wang et al., 2016; Ouyang and Lin 2017; Zhang et al., 2018). Apart from these benefits, it also contributes about 8% of the world’s CO2 emissions (www.sustainabletravel.org), which is consecutively accountable for contributing to global carbon emissions. Tourism activities not only raise CO2 emission but also add to environmental degradation by developing the hotels and tourist facilities, consequently creeping the green belt (Gossling, 2002; Day and Cai, 2012).
Additionally, attracting travelers to their destinations will encourage economic growth, resulting in more energy consumption, leading to a higher CO2 emission (Dogru and Bulut 2018; Zhang and Zhang 2018; Akalpler and Hove 2019; Nie et al., 2019). Other researchers (Becken et al., 2001; Scott et al., 2010; Tsui et al., 2018) strongly advocated that the widening of tourism has unfavorable repercussions on the healthy environment due to the immoderate use of energy related to transportation, goods, food and beverage, lodging facility, boosting the architecture, wood-burning, timber cruiser, and other tourist development. According to sustainable travel, international transportation is tourism’s leading source of carbon emission. It accounts for 49%; on the whole, aircraft and cars spawn the most CO2 per passenger mile, followed by tour buses, ships, and trains. From 2005 to 2016, carbon emissions increased by more than 60 percent for transport-related tourism emissions (www.sustainabletravel.org). Thus, tourism transport is an energy- and carbon-based entity, yielding tourism an influential donor to climate change. Designating the future foresight of an ongoing 4% boost exceeding 2025, the successive observation and inspection of carbon emissions correlated with tourism are becoming more challenging (Lenzen et al., 2018). Hence, it is proved that tourism aspires to economic growth and energy consumption, adversely bashing the standard of the environment in countries that rely on tourism.
Katircioglu (2014) documented that the advancement in tourism enhances energy use and generates substantial ecological pollution in carbon emissions. Moreover, the same findings were revealed by Tsai et al. (2014), Tang et al. (2015), and Durbarry and Seetanah (2015). Still, the affinity between tourism advancement and carbon emission is not apparent.
It is sound evidence that its energy demand also grows as the nation grows. In contrast, if the energy demand becomes still, economic growth in GDP growth will fall. Thus, this has been the case seen since the dawn of the industrial revolution. However, this industrial revolution hit the environment as the world saw a significant increase in urban population, which, accompanied by an increase in living standards, led to having access to more modern appliances and more energy consumption on the grid to see more energy consumption, resulting in more carbon emission and depletion of flora and fauna. The use of chemicals and fuel in factories resulted in increased environmental pollutants and increased consumption of fossil fuels. Different researchers have thoroughly investigated relationships between GDP growth, energy consumption, tourism, financial development, trade openness, and environmental pollutants by utilizing econometric methodologies in different economies and regions. This study plugs a significant knowledge gap by comprehensively calculating the carbon emissions caused by the tourism sector’s economic growth and energy and oil consumption. This study for the first time incorporated the mentioned variables by incorporating the panel ARDL model to examine the long run and short impact, while the robustness is checked with simultaneous quantile regression and panel quantile regression.
Literature Review
Many scholars well documented that human activity harms the environment and leads to climate change which has many drawbacks. It can endanger wildlife and harm human health and, as a result, might pressure the medical sector (Root et al., 2005; AlRashidi et al., 2012; Reiter, 2013; Ebi and Hess, 2017). Sustainability and economic development have been comprehensively discussed by scholars (Samie et al., 2020; Nepal et al., 2021; Zhang et al., 2022; Yang et al., 2021; Zakari et al., 2022a). Tourism contributes significantly to the global gross domestic product as studies showed the blessings of tourism on economic growth; it is an economic activity that can increase employment, bring revenue to the country, and eliminate poverty. However, countries should be aware that tourism can be a double-edged sword. Being a popular tourist destination requires improved infrastructure, which might use land meant for agriculture. Whether they are an international or domestic tourist, they will need to use transportation and accommodation, which are energy-based and contribute to environmental pollution. Also, tourism might harm cultures (Bosak, 2010). Hence, countries should adopt developmental activities in line with sustainability, such as sustainable tourism and limiting carbon and environmental pollution. Governments should consider these variables when promoting the tourism sector without harming the environment to achieve sustainability (McCool and Bosak, 2016).
Kuo and Chen (2009), Zhang et al. (2021c), and Khan et al. (2022b) conducted a study to evaluate the economic activities based on tourism that results in a full range of environmental impacts by utilizing life cycle assessment (LCA) by exploring the environmental loads per tourist per trip on Penghu Island in Taiwan, revealing different features of tourism-linked activities such as the transportation, accommodation, and recreation. Furthermore, they revealed that each tourist per trip uses 607 L of water and 1606 MJ of energy, emitting 109,034 g of CO2, 2,660 g of CO, 597 g of HC, and 70 g of NOx. They also discharge 416 L of wastewater, 83.1 g of BOD, and 1.95 g of solid waste. In terms of energy use, transportation, especially the airplane sector, consumes the most considerable energy (67%). They revealed that the amount of solid waste discharged per tourist is 1.95 kg per day, while that per local people is 1.18 kg. In a crux, per Penghu tourist results in more environmental loads than local people.
A plethora of research work was available to investigate the pros and cons of tourism on carbon emission. For instance, Khan et al. (2022c), Zakari et al. (2022b), Tang et al. (2017), Tang et al. (2014), and Lee and Brahmasrene (2013), in their studies, reported that the tourism sector harms an ecosphere as it increases the carbon emissions levels, particularly the tourism transportation activities which constitute a notable amount of the total carbon emissions. Solarin (2014) explored the connection between tourism development and CO2 emission in Malaysia and revealed a long-run connection among the variables and found positive one-way causation between tourism development and the level of CO2 emission. Correspondingly, Durbarry and Seetanah (2015) realized that the immigration of Mauritius tourists strongly influences CO2 emission over a long-short period.
Furthermore, Dogan et al. (2017) diagnosed the long-run affiliation between tourism, CO2 emission, energy utilization, and GDP for OECD countries from 1995 to 2010. Their study saw a collaboration between tourism and CO2 emission, energy utilization, and economic growth. Likewise, Zaman et al. (2016) observed unidirectional causation among tourism to CO2 emission and energy utilization to CO2 emission in East Asia and the Pacific, The European Union, and the high-income OECD and non-OECD economies. Sharif et al. (2017) examined the association between CO2 emission and tourism growth in Pakistan and established a unidirectional causality that drives tourist arrival to CO2 emission.
León et al. (2014), Chen et al. (2020), and Chen et al. (2021) explored the association between carbon emissions and tourism for advanced and emerging economies by employing the STIRPAT technique on panel data on the countries for 1998–2006. They established that the tourism sector causes a significant rise in carbon emission levels for all nations, but the magnitude of carbon emissions is more significant in advanced countries than in emerging countries. Furthermore, their study identified a need for a sustainable approach that lower carbon emission levels in tourism sectors. Akadiri et al. (2017), Dai et al. (2022), and Gao et al. (2020) researched the influence of tourism on environmental pollution using the environmental Kuznets curve for seven small island states: Bahrain, Cuba, Cyprus, Dominican Republic, Haiti, Iceland, and Malta. They discovered that a rise in international tourists leads to increased energy usage and real GDP per capita, contributing negatively to the environment and increasing carbon dioxide emissions.
Multiple researchers tried to examine the impact of the arrival and departure of tourists and its associated effect on pollution specifically caused by tourist movement (Gossling, 2002; Byrnes and Warnken, 2006; Howitt et al., 2010). Gossling (2002) reported that the tourism makes the transportation sector alone contribute nearly 94% of greenhouse gas emissions. Similarly, Byrnes and Warnken (2006) uncovered that the tourist boat operated in Australia was responsible for 0.1% of the total greenhouse gas emitted by tourism water transportation. Moreover, Peeters et al. (2007) acknowledged that enhancing tourism transportation by air was primarily liable for air pollution. Perch-Nielsen et al. (2010) noticed that the rise in greenhouse gas emissions in Switzerland is due to air transportation, which witnessed a high percentage of tourists. Howitt et al. (2010) conducted a study in New Zealand to analyze the knock-on associated with CO2 emission and back and forth trips by cruise, and they discovered that ships emit more greenhouse gas than international travel by a flight. Lin (2010) and Gao et al. (2021) analyzed the carbon emission in five of Taiwan’s national parks and witnessed the high greenhouse gas emitted in the form of carbon emissions by the individual tourist vehicles. Likewise, Wei et al. (2012), Ma and Zhu (2022), and Ma et al. (2022) recorded that China’s tourism transport significantly contributed to carbon emissions, and it has been very high for the last 3 decades.
Lensen et al. (2018), Quan et al. (2022), and Wang and Luo (2022) tried to quantify the carbon emission associated with the tourism sector for 160 economies spanning 2009 to 2013. They discovered that the global carbon footprint by tourism has risen from 3.9 to 4.5 GtCO2e, recorded four times more than formerly estimated, and estimated an increase to about 8% of global greenhouse gas emissions. Hence, tourism associated with high carbon intensity and continuing growth will constitute a growing part of GHG emissions. Among tourism-related activities, transport, shopping, and food are notable patrons for carbon emission, where the majority of this carbon footprint is exerted by and in high-income nations. Therefore, this rapid increase in tourism demand is effectively outstripping the decarbonization of tourism-related technology. In line with this, Katircioglu et al. (2020) executed an investigation to estimate the consequence of tourism and environmental degradation spanning 1977 to 2015 for Cyprus and found a striking but inelastic effect on carbon emissions. Thus, tourism growth in Northern Cyprus will result in consequent surges in carbon dioxide emission levels. Therefore, they insinuate that tourism progression may root for environmental deprivation in Cyprus.
Very few studies employed the wavelet methodology to probe the causation of tourism, energy utilization, and carbon emissions. In this regard, Raza et al. (2017) used a wavelet approach to explore the causation betwixt tourism and carbon emission. They figured that tourists’ arrivals positively impact carbon outflow in the short-, medium-, and long-run periods. Likewise, they also suggested one-way causation between tourism development and carbon emissions in the US economy. Moreover, Mishra et al. (2019), Wu and Zhu (2021), and Yao et al. (2022) presented a study that explores and provides new insights into the strong alliance between tourist arrivals, transportation services, economic growth, and carbon effluence on the economy of the United States. They employed a unique Morlet wavelet technique to realize partial and multiple wavelet coherence techniques for the monthly dataset from 2001 to 2017. They revealed a remarkable wavelet coherence and substantial lead and lag connections from the frequency perspective. A firm comovement existed among the variables studied, which is not equal across the time scales. Likewise, Tiwari et al. (2019), Zhang et al. (2021a, 2021b) performed an analysis of emerging economies to examine how the geopolitical risks (GPRs) and economic policy uncertainties (EPUs) influence the appearances of tourists in India by utilizing the wavelet analysis and retrieved two exciting results. Initially, the adherence to GPR is more robust than that of EPU. Last, the GPR has long-run implications, whereas the EPU holds short-run consequences for the arrival of tourists. Overall, they found that the impact of GPR is more decisive and notable rather than EPU.
The literature review has illustrated the studies on the connection between tourism, energy use, and oil consumption as a proxy for transportation, economic growth, and carbon emissions. Moreover, our study employs the panel autoregressive distributed lag method to analyze the short- and long-run strategies for linking endogenous and exogenous variables in the studied economies of 18 countries. The study’s sustainable tourism policy design viewpoint contributes to the literature by addressing recent issues.
Data and Methodology
Our study incorporated 18 countries out of the top 20 travel and tourism contributors to economic growth to assess the dynamic relationship between tourist arrival, economic growth, energy consumption, and oil consumption on carbon emission from 1995 to 2019. Moreover, the reason is that these countries will provide a unique learning opportunity for the tourist economies that endure the environmental impacts of tourism in their regions. The tourist arrival data are missing for France and Saudi Arabia, so we dropped it and proceeded with the remaining 18 countries subdivided into three broad categories based on their geographical location. The first category comprises Canada, the United States of America, Mexico, and Brazil. The second category comprises Germany, Italy, Spain, Turkey, the United Kingdom, and Russia. Finally, the third group encompasses Australia, China, India, Indonesia, Japan, Philippines, South Korea, and Thailand. GDP was considered a proxy to economic growth at constant 2010 US$ and international tourist arrival as a proxy to tourism both collected from world bank indicator 2020. The energy and oil consumption and carbon emissions were collected from BP stats 2020. This analysis derives and initiates the following basic equation.
In the aforementioned equation, t indicates the time period from 1995 to 2019, and i indicates the eighteen (18) above-mentioned countries. In the aforementioned equation, COE demonstrates the carbon dioxide emission, ECG indicates the economic growth, TRM demonstrates tourism, ENGC shows energy consumption, and OLC indicates oil consumption.
This research studied the influences of economic growth, tourism, energy consumption, and oil consumption on carbon dioxide emission in 18 selected countries by utilizing the panel ARDL model while the robustness of the results was examined with simultaneous and panel quantile regressions, respectively.
Panel ARDL Approach
Based on the panel data set with time periods
In the above-mentioned panel ARDL (P, Q, Q …,Q1) model,
In the aforementioned equation,
Panel data mean group (MG) estimator was developed by Pesaran and Smith (1995) in which all the used intercept, slopes of the confidence of the variables, and finally, the error variation are different across the groups of countries. Another study (Pesaran, Shin, and Smith 1997, 1999) developed the pooled mean group estimator for panel data that associate both the average and the pool characteristics, respectively. The PMG method permits the intercepts and the coefficients of the short-run variables, and finally, the error variations are dissimilar across the groups of countries while the long-run coefficients of the regressors are similar in different groups of countries.
Furthermore, we used the panel quantile regression to examine the relationship between energy consumption and carbon intensity with export diversification, financial development, economic growth, urbanization, trade openness, and institutional quality variables. The following panel quantile regression equations are based on Equation 1.
In the aforementioned panel quantile regression equations, i and t show the 29 states and time duration from 1995 to 2019, respectively;
In Equation 17,
Results and Discussion
This study used Levin–Lin–Chu and Harris–Tzavalis unit root tests to investigate the stationary of the used series before applying panel ARDL in Table 1. The examined results of both unit root tests, i.e., Levin–Lin–Chu and Harris–Tzavalis, demonstrate that carbon dioxide emission, economic growth, tourism, energy consumption, and oil consumption are not stationary at level, but these series become stationary at the first difference that confirms that panel ARDL model can be applied with the mentioned variables.
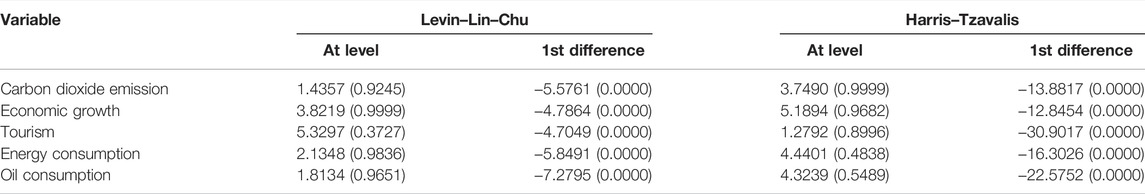
TABLE 1. Panel unit root tests.
Descriptive statistics is used to examine the mean, standard deviation, and minimum and maximum values of the variables in Table 2. The findings demonstrate that carbon dioxide emission has a mean value of 6.4, while the minimum and maximum values are 4.06 and 9.19, respectively. Furthermore, the findings of descriptive statistics indicate that economic growth has a mean value of 28 with a standard deviation value of 1.03. The mean values of tourism, energy consumption, and oil consumption are 16.80, 19.04, and 147.92, respectively. The minimum and maximum values of energy consumption are 0.90 and 141.69, respectively. The findings of descriptive statistics reveal that the maximum and minimum values of oil consumption are 13.19 and 926.77, respectively.
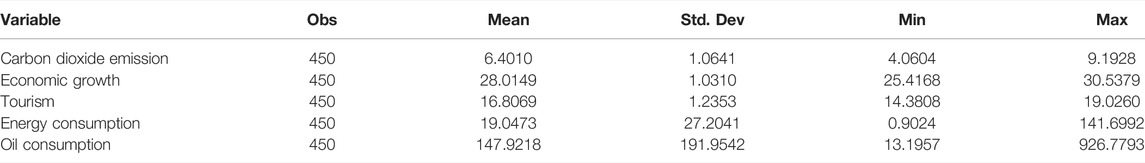
TABLE 2. Descriptive statistics.
Table 3 is used to examine the correlation in the study variables. The correlation matrix is used to examine the association among the study variables. The examined findings of the correlation demonstrate that carbon dioxide emission has a positive relationship with economic growth, tourism, energy consumption, and oil consumption, respectively. The positive relationship in the study variables confirms that economic growth, tourism, energy consumption, and oil consumption positively impact the environmental degradation in the study countries.
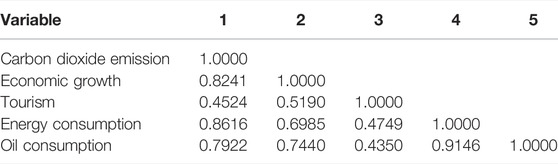
TABLE 3. Correlation.
Table 4 demonstrates the results of the panel cointegration tests, i.e., Kao, Pedroni, and Westerlund tests, respectively. The examined results of the Kao, Pedroni, and Westerlund tests indicate that cointegration exists in the study variables that confirm that long-run and short-run pooled mean groups (PMGs) can be applied with the used variables. In the next step, long-run PMG and short-run PMG are applied to examine the impact of economic growth, tourism, energy consumption, and oil prices on environmental degradation in the study countries.
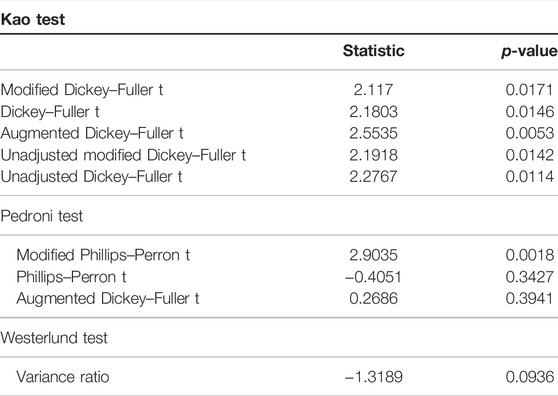
TABLE 4. Panel cointegration.
Table 5 reveals the results of the long-run pooled mean group (PMG) estimation. The examined findings of the PMG demonstrate that economic growth positively and significantly influence environmental degradation in the study countries in the long run. The findings indicate that a 1% increase in economic growth causes degradation of the environment in the study countries by about 0.26 percent. The findings of economic growth and environmental degradation are similar to those of Teng et al. (2021). Teng et al. (2021) demonstrated that economic development causes environmental degradation in OECD countries. OECD countries' economies are growing rapidly, which is harmful to the environment, and most OECD countries are facing a problem of environmental degradation.
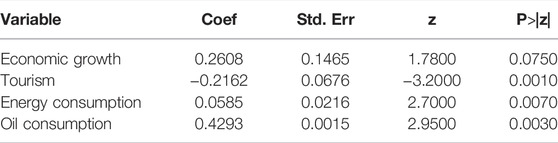
TABLE 5. PMG long-run results.
Tourism and environmental degradation findings demonstrate negative and significant influence. The findings reveal that educated tourists follow rules and regulations related to the environment in the host countries. The findings demonstrate that a 1% increase in tourism helps to reduce the environmental degradation in the study countries by about 0.21 percent. It is observed from the results that developing economies of the world need to encourage developed economies' citizens to explore nature, which will help the host countries’ economies to develop. The findings contradict those of Anser et al. (2021), Haseeb and Azam (2021), and Usman et al. (2021). The authors revealed that tourism inflow causes environmental degradation in the host countries. Furthermore, they demonstrated that tourism inflow boosts the economic growth that causes environmental degradation.
On the other hand, the findings of the long-run PMG demonstrate that energy consumption causes environmental degradation in the study countries; the results indicate that energy consumption positively and significantly impacts environmental degradation. Moreover, the findings reveal that a 1% increase in the use of energy consumption causes an increase in environmental degradation by about 0.058 percent. The finding on energy consumption and environmental degradation is similar to that of Khan et al. (2020) and Khan et al. (2021). They demonstrated that environmental degradation is mainly caused by the use of traditional energy resources for energy use.
Oil is considered an important factor for economic growth around the world. The findings reveal that oil consumption has a positive and statistically significant impact on environmental degradation around the world. The examined results indicate that a 1% increase in the use of oil causes boosting the environmental degradation in the study countries by about 0.42 percent. The examined findings on oil consumption and environmental degradation are in line with Khan et al. (2019). In a recent study, Khan et al. (2019) demonstrated that oil consumption in Pakistan causes environmental degradation.
Findings of the short-run PMG model demonstrate that economic development in the study countries positively and significantly influences environmental degradation; the examined results indicate that environmental degradation boosts about 2.93 percent with a 1% increase in economic growth in Table 6. The examined findings are the same as the recent research by Shokoohi et al. (2022) and Usman et al. (2022); they demonstrated that economic growth adversely influences environmental degradation. On the other hand, tourism has a negative and significant impact on the carbon dioxide emission in the study countries. Furthermore, this studies the impact of energy consumption and oil consumption on environmental degradation. The findings demonstrate that a 1% increase in energy consumption and oil consumption boosts environmental degradation in the short run by about 0.12 and 0.39%. The findings are similar to those by Adebayo et al. (2022), Magazzino et al. (2022), and Wang (2022); they demonstrated that the use of traditional energy sources for energy consumption and oil consumption causes environmental degradation. The error correction term (ECT) demonstrates the speed of adjustment to the equilibrium that is 0.52.
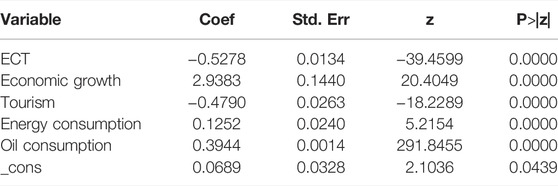
TABLE 6. PMG short-run results.
Furthermore, this study used quantile regression to check the robustness in Table 7. The findings of the simultaneous quantile regression and panel quantile regression demonstrate that energy consumption positively and significantly impacts environmental degradation, while the findings of the oil consumption contradict the pooled mean group estimator (PMG) results. The estimated findings of the oil consumption demonstrate a negative and statistical impression of the environmental degradation in the study countries. Furthermore, the estimated findings of the economic growth demonstrate a negative and significant impact on environmental degradation as per the simultaneous quantile regression (Q25), while Q50 to Q95 demonstrate no impact on environmental degradation. On the other hand, the findings of the panel quantile regression indicate a positive and statistically significant impact on the degradation of the environment in the study countries. The examined findings of the tourism inflow demonstrate a negative and significant impact on environmental degradation with Q50 and Q75, respectively, while the findings of the panel quantile regression indicate a negative impact on environmental degradation in the study countries.
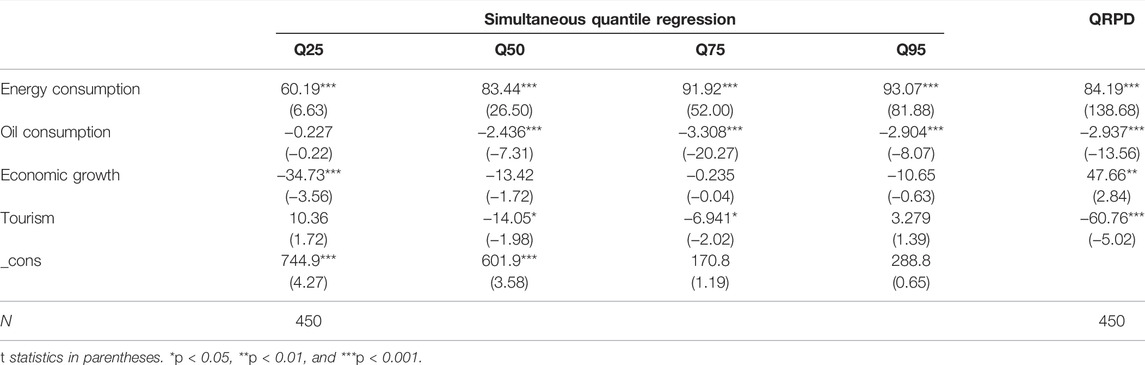
TABLE 7. Robustness check with quantile regression.
Conclusion
The study demonstrates the progressive correlation between carbon emission, economic growth, energy use, and oil consumption by the most prominent contributors to travel and tourism GDPs. The Levin–Lin–Chu and Harris–Tzavalis panel unit root indicates that these variables became stationary at the first difference. The correlation matrix shows the positive association among these endogenous variables to environmental degradation. Kao, Pedroni, and Westerlund laid the foundation for the pooled mean group (PMG) as they reveal both periods’ presence. The long-run PMG indicate a significant impact of these endogenous variables on the exogenous variable except the tourism, indicating that the tourist is well aware of their responsibilities toward the environment, reflecting their concerns about the rules and regulations related to the environmental laws of the host countries. The adjustment rate to the equilibrium is −0.52, and more or less similar outcomes are revealed for the short-run PMG.
Furthermore, we have gone through the robustness test using the simultaneous quantile regression to validate our results. Panel quantile regression findings demonstrate that economic growth negatively impacts environmental degradation as per the simultaneous quantile regression (Q25). In contrast, Q50 to Q95 demonstrate no impact on environmental depravity. On the other hand, the findings of the panel quantile regression indicate a positive and statistically significant impact on the degradation of the environment in the study countries. The examined findings of the tourism inflow demonstrate an adverse and influential consequence on the environmental degradation with Q50 and Q75, respectively. In contrast, the findings of the panel quantile regression indicate an unfavorable impact on the studied countries’ ecology.
In pursuance of achieving stable and endurable tourism in the studied countries, the first and foremost important step that the countries’ governments should take is to focus on expanding economic activities that promote sustainable tourism so that the natural resources in the studied countries can support and follow zero or carbon-neutralizing laws framed by UNWTO 2018.
Likewise, 1) they can enforce clear-cut ecological guidelines; for instance, tourist sites with more damaging results on the environment should assign adequate facelifts to preserve the environmental quality. 2) Transportation is the primary promoter of carbon emissions (Sharma and Ghoshal, 2015; Koçak et al., 2020). For that reason, the government’s first and foremost step is to educate the masses to use public transport and other alternative fuels, such as advanced hybrid technologies. 3) The government should stimulate viable and green energy production in the economy, specifically in tourist attractions employing grants and duty-free means. Implementing these tactics can considerably upgrade the ecosphere by curbing carbon emissions.
Data Availability Statement
The datasets presented in this study can be found in online repositories. The names of the repository/repositories and accession number(s) can be found below: https://databank.worldbank.org/source/world-development-indicators.
Author Contributions
AK: introduction; UK: literature review; MK: results estimation and interpretation; AB: proofreading and review.
Conflict of Interest
The authors declare that the research was conducted in the absence of any commercial or financial relationships that could be construed as a potential conflict of interest.
Publisher’s Note
All claims expressed in this article are solely those of the authors and do not necessarily represent those of their affiliated organizations or those of the publisher, the editors, and the reviewers. Any product that may be evaluated in this article, or claim that may be made by its manufacturer, is not guaranteed or endorsed by the publisher.
References
Adebayo, T. S., Rjoub, H., and Rjoub, H. (2022). A New Perspective into the Impact of Renewable and Nonrenewable Energy Consumption on Environmental Degradation in Argentina: a Time-Frequency Analysis. Environ. Sci. Pollut. Res. 29 (11), 16028–16044. doi:10.1007/s11356-021-16897-6
Adedoyin, F. F., and Bekun, F. V. (2020). Modelling the Interaction between Tourism, Energy Consumption, Pollutant Emissions and Urbanization: Renewed Evidence from Panel VAR. Environ. Sci. Pollut. Res. 27 (31), 38881–38900. doi:10.1007/s11356-020-09869-9
Akadiri, S. S., Akadiri, A. C., and Alola, U. V. (2017). Is There Growth Impact of Tourism? Evidence from Selected Small Island States. Curr. Issues Tour. 22 (12), 1480–1498. doi:10.1080/13683500.2017.1381947
Akalpler, E., and Hove, S. (2019). Carbon Emissions, Energy Use, Real GDP Per Capita and Trade Matrix in the Indian Economy-An ARDL Approach. Energy 168, 1081–1093. doi:10.1016/j.energy.2018.12.012
Al-Mulali, U., Saboori, B., and Ozturk, I. (2015a). Investigating the Environmental Kuznets Curve Hypothesis in Vietnam. Energy Policy 76, 123–131. doi:10.1016/j.enpol.2014.11.019
Al-Mulali, U., Sheau-Ting, L., and Ozturk, I. (2015b). The Global Move toward Internet Shopping and its Influence on Pollution: an Empirical Analysis. Environ. Sci. Pollut. Res. 22 (13), 9717–9727. doi:10.1007/s11356-015-4142-2
AlRashidi, M., Shobrak, M., Al-Eissa, M. S., and Székely, T. (2012). Integrating Spatial Data and Shorebird Nesting Locations to Predict the Potential Future Impact of Global Warming on Coastal Habitats: A Case Study on Farasan Islands, Saudi Arabia. Saudi J. Biol. Sci. 19 (3), 311–315. doi:10.1016/j.sjbs.2012.02.001
Anser, M. K., Khan, M. A., Nassani, A. A., Askar, S. E., Abro, M. M. Q., Zaman, K., et al. (2021). The Mediating Role of ICTs in the Relationship between International Tourism and Environmental Degradation: Fit as a Fiddle. Environ. Sci. Pollut. Res. 28 (45), 63769–63783. doi:10.1007/s11356-020-10954-2
Apergis, N., and Danuletiu, D. C. (2014). Renewable Energy and Economic Growth: Evidence from the Sign of Panel Long-Run Causality. Int. J. Energy Econ. Policy 4 (4), 578.
Apergis, N., and Ozturk, I. (2015). Testing Environmental Kuznets Curve Hypothesis in Asian Countries. Ecol. Indic. 52 (2), 16–22. doi:10.1016/j.ecolind.2014.11.026
Arslan, H. M., Khan, I., Latif, M. I., Komal, B., and Chen, S. (2022). Understanding the Dynamics of Natural Resources Rents, Environmental Sustainability, and Sustainable Economic Growth: New Insights from China. Environ. Sci. Pollut. Res., 1–16. doi:10.1007/s11356-022-19952-y
Byrnes, T. A., and Warnken, J. (2006). Greenhouse Gas Emissions from Marine Tours: A Case Study of Australian Tour Boat Operators. J. Sustain. Tour. 14, 255–270. doi:10.1080/09669580608669058
Cannonier, C., and Burke, M. G. (2019). The Economic Growth Impact of Tourism in Small Island Developing States-Evidence from the Caribbean. Tour. Econ. 25 (1), 85–108. doi:10.1177/1354816618792792
Cetin, M., Ecevit, E., and Yucel, A. G. (2018). The Impact of Economic Growth, Energy Consumption, Trade Openness, and Financial Development on Carbon Emissions: Empirical Evidence from Turkey. Environ. Sci. Pollut. Res. 25 (36), 36589–36603. doi:10.1007/s11356-018-3526-5
Chai, Y., Pardey, P. G., Chan-Kang, C., Huang, J., Lee, K., and Dong, W. (2019). Passing the Food and Agricultural R&D Buck? the United States and China. Food Policy 86, 101729. doi:10.1016/j.foodpol.2019.101729
Chen, D., Gao, H., and Ma, Y. (2020). Human Capital-Driven Acquisition: Evidence from the Inevitable Disclosure Doctrine. Manag. Sci., 1–19. doi:10.1287/mnsc.2020.3707
Chen, Y., Kumara, E. K., and Sivakumar, V. (2021). Investigation of Finance Industry on Risk Awareness Model and Digital Economic Growth. Ann. Operat. Res. doi:10.1007/s10479-021-04287-7
Dai, L., Wang, Z., Guo, T., Hu, L., Chen, Y., Chen, C., et al. (2022). Pollution Characteristics and Source Analysis of Microplastics in the Qiantang River in Southeastern China. Chemosphere (Oxford) 293, 133576. doi:10.1016/j.chemosphere.2022.133576
Day, J., and Cai, L. (2012). Environmental and Energy-Related Challenges to Sustainable Tourism in the United States and China. Int. J. Sustain. Dev. World Ecol. 19 (5), 379–388. doi:10.1080/13504509.2012.675600
Dinda, S., and Coondoo, D. (2006). Income and Emission: a Panel Data-Based Cointegration Analysis. Ecol. Econ. 57, 167–181. doi:10.1016/j.ecolecon.2005.03.028
Dogan, E., Seker, F., and Bulbul, S. (2017). Investigating the Impacts of Energy Consumption, Real GDP, Tourism and Trade on CO2 emissions by Accounting for Cross-Sectional Dependence: A Panel Study of OECD Countries. Curr. Issues Tour. 20 (16), 1701–1719. doi:10.1080/13683500.2015.1119103
Dogan, E., and Seker, F. (2016). Determinants of CO2 Emissions in the European Union: the Role of Renewable and Non-renewable Energy. Renew. Energy 94, 429–439. doi:10.1016/j.renene.2016.03.078
Dogan, E., and Turkekul, B. (2016). CO2 Emissions, Real Output, Energy Consumption, Trade, Urbanization and Financial Development: Testing the EKC Hypothesis for the USA. Environ. Sci. Pollut. Res. 23 (2), 1203–1213. doi:10.1007/s11356-015-5323-8
Dogan, E., Tzeremes, P., and Altinoz, B. (2020). Revisiting the Nexus Among Carbon Emissions, Energy Consumption and Total Factor Productivity in African Countries: New Evidence from Nonparametric Quantile Causality Approach. Heliyon 6 (3), e03566. doi:10.1016/j.heliyon.2020.e03566
Dogru, T., and Bulut, U. (2018). Is Tourism an Engine for Economic Recovery? Theory and Empirical Evidence. Tour. Manag. 67, 425–434. doi:10.1016/j.tourman.2017.06.014
Durbarry, R., and Seetanah, B. (2015). The Impact of Long Haul Destinations on Carbon Emissions: the Case of Mauritius. J. Hosp. Mark. Manag. 24 (4), 401–410. doi:10.1080/19368623.2014.914363
Ebi, K. L., and Hess, J. J. (2017). The Past and Future in Understanding the Health Risks of and Responses to Climate Variability and Change. Int. J. Biometeorol. 61 (S1), 71–80. doi:10.1007/s00484-017-1406-1
Ertugrul, H. M., Cetin, M., Seker, F., and Dogan, E. (2016). The Impact of Trade Openness on Global Carbon Dioxide Emissions: Evidence from the Top Ten Emitters Among Developing Countries. Ecol. Indic. 67, 543–555. doi:10.1016/j.ecolind.2016.03.027
Gao, H., Hsu, P., Li, K., and Zhang, J. (2020). The Real Effect of Smoking Bans: Evidence from Corporate Innovation. J. Finan. Quantitat. Analys. 55 (2), 387–427. doi:10.1017/S0022109018001564
Gao, H., Shi, D., and Zhao, B. (2021). Does Good Luck Make People Overconfident? Evidence from a Natural Experiment in the Stock Market. J. Corpor. Finan. 68, 101933. doi:10.1016/j.jcorpfin.2021.101933
Gössling, S. (2002). Global Environmental Consequences of Tourism. Glob. Environ. Change 12 (4), 283–302. doi:10.1016/s0959-3780(02)00044-4
Grossman, G., and Krueger, A. (1991). Environmental Impacts of a North American Free Trade Agreement. Washington DC: National Bureau of Economic Research. Working Paper No. 3914.
Haseeb, M., and Azam, M. (2021). Dynamic Nexus Among Tourism, Corruption, Democracy and Environmental Degradation: A Panel Data Investigation. Environ. Dev. Sustain 23 (4), 5557–5575. doi:10.1007/s10668-020-00832-9
Hassan, S. T., Batool, B., Zhu, B., and Khan, I. (2022). Environmental Complexity of Globalization, Education, and Income Inequalities: New Insights of Energy Poverty. J. Clean. Prod. 340, 130735. doi:10.1016/j.jclepro.2022.130735
Howitt, O. J. A., Revol, V. G. N., Smith, I. J., and Rodger, C. J. (2010). Carbon Emissions from International Cruise Ship Passengers' Travel to and from New Zealand. Energy Policy 38 (5), 2552–2560. doi:10.1016/j.enpol.2009.12.050
Inglesi-Lotz, R., and Dogan, E. (2018). The Role of Renewable versus Non-renewable Energy to the Level of CO2 Emissions a Panel Analysis of Sub- Saharan Africa's Βig 10 Electricity Generators. Renew. Energy 123, 36–43. doi:10.1016/j.renene.2018.02.041
Katircioglu, S., Saqib, N., Katircioglu, S., Kilinc, C. C., and Gul, H. (2020). Estimating the Effects of Tourism Growth on Emission Pollutants: Empirical Evidence from a Small Island, Cyprus. Air Qual. Atmos. Health 13, 391–397. doi:10.1007/s11869-020-00803-z
Katircioǧlu, S. T. (2014). Testing the Tourism-Induced EKC Hypothesis: the Case of Singapore. Econ. Model. 41, 383–391. doi:10.1016/j.econmod.2014.05.028
Khan, I., Tan, D., and Hassan, S. T. (2022a). Role of Alternative and Nuclear Energy in Stimulating Environmental Sustainability: Impact of Government Expenditures. Environ. Sci. Pollut. Res., 1–12. doi:10.1007/s11356-021-18306-4
Khan, I., Zakari, A., Dagar, V., and Singh, S. (2022b). World Energy Trilemma and Transformative Energy Developments as Determinants of Economic Growth amid Environmental Sustainability. Energy Econ. 108, 105884. doi:10.1016/j.eneco.2022.105884
Khan, I., Zakari, A., Zhang, J., Dagar, V., and Singh, S. (2022c). A Study of Trilemma Energy Balance, Clean Energy Transitions, and Economic Expansion in the Midst of Environmental Sustainability: New Insights from Three Trilemma Leadership. Energy 248, 123619. doi:10.1016/j.energy.2022.123619
Khan, M. I., Teng, J. Z. Teng, and Khan, M. K. (2020). The Impact of Macroeconomic and Financial Development on Carbon Dioxide Emissions in Pakistan: Evidence with a Novel Dynamic Simulated ARDL Approach. Environ. Sci. Pollut. Res. 27 (31), 39560–39571. doi:10.1007/s11356-020-09304-z
Khan, M. K., Abbas, F., Godil, D. I., Sharif, A., Ahmed, Z., and Anser, M. K. (2021). Moving towards Sustainability: How Do Natural Resources, Financial Development, and Economic Growth Interact with the Ecological Footprint in Malaysia? A Dynamic ARDL Approach. Environ. Sci. Pollut. Res. 28 (39), 55579–55591. doi:10.1007/s11356-021-14686-9
Khan, M. K., Teng, J.-Z., and Khan, M. I. (2019). Effect of Energy Consumption and Economic Growth on Carbon Dioxide Emissions in Pakistan with Dynamic ARDL Simulations Approach. Environ. Sci. Pollut. Res. 26 (23), 23480–23490. doi:10.1007/s11356-019-05640-x
Kirikkaleli, D., Güngör, H., and Adebayo, T. S. (2021). Consumption‐based Carbon Emissions, Renewable Energy Consumption, Financial Development and Economic Growth in Chile. Bus. Strategy Environ. doi:10.1002/bse.2945
Koçak, E., Ulucak, R., and Ulucak, Z. Ş. (2020). The Impact of Tourism Developments on CO2 Emissions: An Advanced Panel Data Estimation. Tour. Manage. Perspect. 33, 100611. doi:10.1016/j.tmp.2019.100611
Kuo, N.-W., and Chen, P.-H. (2009). Quantifying Energy Use, Carbon Dioxide Emission, and Other Environmental Loads from Island Tourism Based on a Life Cycle Assessment Approach. J. Clean. Prod. 17 (15), 1324–1330. doi:10.1016/j.jclepro.2009.04.012
Kyoto Protocol to the United Nations (1997). United Nations Framework Convention on Climate Change, 19. Kyoto: Kyoto Protocol.
Lee, J. W., and Brahmasrene, T. (2013). Investigating the Influence of Tourism on Economic Growth and Carbon Emissions: Evidence from Panel Analysis of the European Union. Tour. Manag. 38, 69–76. doi:10.1016/j.tourman.2013.02.016
Lensen, M., Sun, Y. Y., Faturay, F., Ting, Y. P., Geschke, A., and Malik, A. (2018). The Carbon Footprint of Global Tourism. Nat. Clim. Change 8, 522. doi:10.1038/s41558-018-0141-x
León, C. J., Arana, J. E., Alemán, A. H., León, C. J., Arana, J. E., and Alemán, A. H. (2014). CO2 Emissions and Tourism in Developed and Less Developed Countries. Appl. Econ. Lett. 21 (16), 1169. doi:10.1080/13504851.2014.916376
Lew, A. A. (2011). Tourism's Role in the Global Economy. Tour. Geogr. 13 (1), 148–151. doi:10.1080/14616688.2010.531046
Li, K., and Lin, B. (2015). Impacts of Urbanization and Industrialization on Energy consumption/CO2 Emissions: Does the Level of Development Matter? Renew. Sustain. Energy Rev. 52, 1107–1122. doi:10.1016/j.rser.2015.07.185
Lin, T.-P. (2010). Carbon Dioxide Emissions from Transport in Taiwan's National Parks. Tour. Manag. 31 (2), 285–290. doi:10.1016/j.tourman.2009.03.009
Ma, D., Zhang, C., Hui, Y., and Xu, B. (2022). Economic Uncertainty Spillover and Social Networks J. Business. Res. 145, 454–467. doi:10.1016/j.jbusres.2022.03.015
Ma, D., and Zhu, Q. (2022). Innovation in Emerging Economies: Research on the Digital Economy Driving High-Quality Green Development J. Business. Res. 145, 801–813. doi:10.1016/j.jbusres.2022.03.041
Magazzino, C., Mele, M., and Schneider, N. (2022). A New Artificial Neural Networks Algorithm to Analyze the Nexus Among Logistics Performance, Energy Demand, and Environmental Degradation. Struct. Change Econ. Dyn. 60, 315–328. doi:10.1016/j.strueco.2021.11.018
Mishra, S., Sinha, A., Sharif, A., and Suki, N. M. (2019). Dynamic Linkages between Tourism, Transportation, Growth and Carbon Emission in the USA: Evidence from Partial and Multiple Wavelet Coherence. Curr. Issues Tour. doi:10.1080/13683500.2019.1667965
Moutinho, V., Madaleno, M., Inglesi-Lotz, R., and Dogan, E. (2018). Factors Affecting CO2 Emissions in Top Countries on Renewable Energies: a LMDI Decomposition Application. Renew. Sustain. Energy Rev. 90, 605–622. doi:10.1016/j.rser.2018.02.009
Nepal, R., Paija, N., Tyagi, B., and Harvie, C. (2021). Energy Security, Economic Growth and Environmental Sustainability in India: Does FDI and Trade Openness Play a Role? J. Environ. Manag. 281, 111886. doi:10.1016/j.jenvman.2020.111886
Nie, Y., Li, Q., Wang, E., and Zhang, T. (2019). Study of the Nonlinear Relations between Economic Growth and Carbon Dioxide Emissions in the Eastern, Central and Western Regions of China. J. Clean. Prod. 219, 713–722. doi:10.1016/j.jclepro.2019.01.164
Ouyang, X., and Lin, B. (2017). Carbon Dioxide (CO2) Emissions during Urbanization: a Comparative Study between China and Japan. J. Clean. Prod. 143, 356–368. doi:10.1016/j.jclepro.2016.12.102
Ozturk, I., and Acaravci, A. (2010). CO2 Emissions, Energy Consumption and Economic Growth in Turkey. Renew. Sustain. Energy Rev. 14, 3220–3225. doi:10.1016/j.rser.2010.07.005
Pao, H.-T., and Tsai, C.-M. (2011). Multivariate Granger Causality between CO2 Emissions, Energy Consumption, FDI (Foreign Direct Investment) and GDP (Gross Domestic Product): Evidence from a Panel of BRIC (Brazil, Russian Federation, India, and China) Countries. Energy 36, 685–693. doi:10.1016/j.energy.2010.09.041
Paramati, S. R., Alam, M. S., and Chen, C.-F. (2017). The Effects of Tourism on Economic Growth and CO2 Emissions: a Comparison between Developed and Developing Economies. J. Travel Res. 56 (6), 712–724. doi:10.1177/0047287516667848
Park, Y., Meng, F., and Baloch, M. A. (2018). The Effect of ICT, Financial Development, Growth, and Trade Openness on CO2 Emissions: an Empirical Analysis. Environ. Sci. Pollut. Res. 25 (30), 30708–30719. doi:10.1007/s11356-018-3108-6
Peeters, P., Szimba, E., and Duijnisveld, M. (2007). Major Environmental Impacts of European Tourist Transport. J. Transp. Geogr. 15 (2), 83–93. doi:10.1016/j.jtrangeo.2006.12.007
Perch-Nielsen, S., Sesartic, A., and Stucki, M. (2010). The Greenhouse Gas Intensity of the Tourism Sector: The Case of Switzerland. Environ. Sci. Policy 13 (2), 131–140. doi:10.1016/j.envsci.2009.12.002
Quan, Q., Liang, W., Yan, D., and Lei, J. (2022). Influences of Joint Action of Natural and Social Factors on Atmospheric Process of Hydrological Cycle in Inner Mongolia, China. Urban Climate 41, 101043. doi:10.1016/j.uclim.2021.101043
Reiter, S. (2013). Energy Consumption: Impacts of Human Activity, Current and Future Challenges, Environmental and Socio-Economic Effects. USA, New York: Nova Science Publishers.
Root, T. L., MacMynowski, D. P., Mastrandrea, M. D., and Schneider, S. H. (2005). Human-modified Temperatures Induce Species Changes: Joint Attribution. Proc. Natl. Acad. Sci. U.S.A. 102 (21), 7465–7469. doi:10.1073/pnas.0502286102
Samie, A., Abbas, A., Azeem, M. M., Hamid, S., Iqbal, M. A., Hasan, S. S., et al. (2020). Examining the Impacts of Future Land Use/land Cover Changes on Climate in Punjab Province, Pakistan: Implications for Environmental Sustainability and Economic Growth. Environ. Sci. Pollut. Res. 27 (20), 25415–25433. doi:10.1007/s11356-020-08984-x
Shahbaz, M., Dube, S., Ozturk, I., and Jalil, A. (2015). Testing the Environmental Kuznets Curve Hypothesis in Portugal. Int. J. Energy Econ. Pol. 5 (2), 475–481.
Shahbaz, M., Kumar Tiwari, A., and Nasir, M. (2013a). The Effects of Financial Development, Economic Growth, Coal Consumption and Trade Openness on CO2 Emissions in South Africa. Energy Policy 61, 1452–1459. doi:10.1016/j.enpol.2013.07.006
Sharif, A., Afshan, S., and Nisha, N. (2017). Impact of Tourism on CO2 emission: Evidence from Pakistan. Asia Pac. J. Tour. Res. 22 (4), 408–421. doi:10.1080/10941665.2016.1273960
Sharif Hossain, M. (2011). Panel Estimation for CO2 Emissions, Energy Consumption, Economic Growth, Trade Openness and Urbanization of Newly Industrialized Countries. Energy Policy 39 (11), 6991–6999. doi:10.1016/j.enpol.2011.07.042
Sharma, S., and Ghoshal, S. K. (2015). Hydrogen the Future Transportation Fuel: from Production to Applications. Renew. Sustain. Energy Rev. 43, 1151–1158. doi:10.1016/j.rser.2014.11.093
Shokoohi, Z., Dehbidi, N. K., and Tarazkar, M. H. (2022). Energy Intensity, Economic Growth and Environmental Quality in Populous Middle East Countries. Energy 239, 122164. doi:10.1016/j.energy.2021.122164
Solarin, S. A. (2014). Tourist Arrivals and Macroeconomic Determinants of CO2 Emissions in Malaysia. Anatolia 25 (2), 228–241. doi:10.1080/13032917.2013.868364
Taghizadeh-Hesary, F., Zakari, A., Yoshino, N., and Khan, I. (2022). Leveraging on Energy Security to Alleviate Poverty in Asian Economies. Singap. Econ. Rev., 1–28. doi:10.1142/s0217590822440015
Tang, C., Zhong, L., and Ng, P. (2017). Factors that Influence the Tourism Industry's Carbon Emissions: A Tourism Area Life Cycle Model Perspective. Energy Policy 109, 704–718. doi:10.1016/j.enpol.2017.07.050
Tang, Q., Li, Y., and Xu, Y. (2015). Land Suitability Assessment for Post-earthquake Reconstruction: A Case Study of Lushan in Sichuan, China. J. Geogr. Sci. 25, 865–878. doi:10.1007/s11442-015-1207-6
Tang, Z., Shang, J., Shi, C., Liu, Z., and Bi, K. (2014). Decoupling Indicators of CO2 Emissions from the Tourism Industry in China: 1990-2012. Ecol. Indic. 46, 390–397. doi:10.1016/j.ecolind.2014.06.041
Teng, J.-Z., Khan, M. K., Khan, M. I., Chishti, M. Z., and Khan, M. O. (2021). Effect of Foreign Direct Investment on CO2 Emission with the Role of Globalization, Institutional Quality with Pooled Mean Group Panel ARDL. Environ. Sci. Pollut. Res. 28 (5), 5271–5282. doi:10.1007/s11356-020-10823-y
Tiwari, A. K., Das, D., and Dutta, A. (2019). Geopolitical Risk, Economic Policy Uncertainty and Tourist Arrivals: Evidence from a Developing Country. Tour. Manag. 75, 323–327. doi:10.1016/j.tourman.2019.06.002
Tsai, K.-T., Lin, T.-P., Hwang, R.-L., and Huang, Y.-J. (2014). Carbon Dioxide Emissions Generated by Energy Consumption of Hotels and Homestay Facilities in Taiwan. Tour. Manag. 42, 13–21. doi:10.1016/j.tourman.2013.08.017
UN Climate change (2020). Retrieved on: https://unfccc.int/process-and-meetings/the-paris-agreement/the-paris-agreement.
Usman, M., Jahanger, A., Makhdum, M. S. A., Balsalobre-Lorente, D., and Bashir, A. (2022). How Do Financial Development, Energy Consumption, Natural Resources, and Globalization Affect Arctic Countries' Economic Growth and Environmental Quality? an Advanced Panel Data Simulation. Energy 241, 122515. doi:10.1016/j.energy.2021.122515
Usman, M., Anwar, S., Yaseen, M., Kousar, R., and Jahanger, A. (2021). Unveiling the Dynamic Relationship between Agriculture Value Addition, Energy Utilization, Tourism and Environmental Degradation in South Asia. J. Public Aff., e2712. doi:10.1002/pa.2712
Wang, H. (2022). Role of Environmental Degradation and Energy Use for Agricultural Economic Growth: Sustainable Implications Based on ARDL Estimation. Environ. Technol. Innovation 25, 102028. doi:10.1016/j.eti.2021.102028
Wang, H., and Luo, Q. (2022). Can a Colonial Legacy Explain the Pollution Haven Hypothesis? A City-Level Panel Analysis Struct. Change Econ. Dynam. 60, 482–495. doi:10.1016/j.strueco.2022.01.004
Wang, Q., Wu, S.-d., Zeng, Y.-e., and Wu, B.-w. (2016). Exploring the Relationship between Urbanization, Energy Consumption, and CO 2 Emissions in Different Provinces of China. Renew. Sustain. Energy Rev. 54, 1563–1579. doi:10.1016/j.rser.2015.10.090
Wang, Y., Zhang, C., Lu, A., Li, L., He, Y., Tojo, J., et al. (2017). A Disaggregated Analysis of the Environmental Kuznets Curve for Industrial CO2 Emissions in China. Appl. Energy 190, 172–180. doi:10.1016/j.apenergy.2016.12.109
Wei, Y. X., Sun, G. N., and Ma, L. J. (2012). Estimating the Carbon Emissions and Regional Differences of Tourism Transport in China. J. Shanxi Normal Univ. 40 (2), 76.
Wen, L., and Shao, H. (2019). Analysis of Influencing Factors of the CO2 Emissions in China: Nonparametric Additive Regression Approach. Sci. Total Environ. 694, 133724. doi:10.1016/j.scitotenv.2019.133724
WTTC (2021). https://wttc.org/Research/Economic-Impact.
Wu, Y., and Zhu, W. (2021). The Role of CSR Engagement in Customer-Company Identification and Behavioral Intention During the COVID-19 Pandemic Front. Psychol. 12, 721410. doi:10.3389/fpsyg.2021.721410
Yang, B., Jahanger, A., Usman, M., and Khan, M. A. (2021). The Dynamic Linkage between Globalization, Financial Development, Energy Utilization, and Environmental Sustainability in GCC Countries. Environ. Sci. Pollut. Res. 28 (13), 16568–16588. doi:10.1007/s11356-020-11576-4
Yao, L., Li, X., Zheng, R., and Zhang, Y. (2022). The Impact of Air Pollution Perception on Urban Settlement Intentions of Young Talent in China Int. J. Environ. Res. Public Health 19 (3), 1080. doi:10.3390/ijerph19031080
Yasmeen, H., Wang, Y., Zameer, H., and Solangi, Y. A. (2020). Decomposing Factors Affecting CO2 Emissions in Pakistan: Insights from LMDI Decomposition Approach. Environ. Sci. Pollut. Res. Int. 27 (3), 3113–3123. doi:10.1007/s11356-019-07187-3
Yu, W., Pagani, R., and Huang, L. (2012). CO2 Emission Inventories for Chinese Cities in Highly Urbanized Areas Compared with European Cities. Energy Policy 47, 298–308. doi:10.1016/j.enpol.2012.04.071
Zakari, A., Khan, I., Tawiah, V., and Alvarado, R. (2022b). Reviewing the Ecological Footprints of Africa Top Carbon Consumer: a Quantile on Quantile Analysis. Int. J. Environ. Sci. Technol., 1–12. doi:10.1007/s13762-021-03904-z
Zakari, A., Li, G., Khan, I., Jindal, A., Tawiah, V., and Alvarado, R. (2022a). Are Abundant Energy Resources and Chinese Business a Solution to Environmental Prosperity in Africa? Energy Policy 163, 112829. doi:10.1016/j.enpol.2022.112829
Zaman, K., Shahbaz, M., Loganathan, N., and Raza, S. A. (2016). Tourism Development, Energy Consumption and Environmental Kuznets Curve: Trivariate Analysis in the Panel of Developed and Developing Countries. Tour. Manag. 54, 275–283. doi:10.1016/j.tourman.2015.12.001
Zameer, H., and Wang, Y. (2018). Energy Production System Optimization: Evidence from Pakistan. Renew. Sustain. Energy Rev. 82, 886–893. doi:10.1016/j.rser.2017.09.089
Zhang, G., Zhang, N., and Liao, W. (2018). How Do Population and Land Urbanization Affect CO2 Emissions under Gravity Center Change? A Spatial Econometric Analysis. J. Clean. Prod. 202, 510–523. doi:10.1016/j.jclepro.2018.08.146
Zhang, J., and Zhang, Y. (2018). Carbon Tax, Tourism CO2 Emissions and Economic Welfare. Ann. Tour. Res. 69 (December), 18–30. doi:10.1016/j.annals.2017.12.009
Zhang, L., Huang, M., Li, M., Lu, S., Yuan, X., and Li, J. (2021a). Experimental Study on Evolution of Fracture Network and Permeability Characteristics of Bituminous Coal Under Repeated Mining Effect Nat. Resour. Res. 31 (1), 463–486. doi:10.1007/s11053-021-09971-w
Zhang, L., Huang, M., Xue, J., Li, M., and Li, J. (2021b). Repetitive Mining Stress and Pore Pressure Effects on Permeability and Pore Pressure Sensitivity of Bituminous Coal Nat. Resour. Res. 30 (6), 4457–4476. doi:10.1007/s11053-021-09902-9
Keywords: economic growth, tourism, energy consumption, oil consumption, environmental degradation
Citation: Khan AM, Basit A, Khan U and Khan MK (2022) The Progressive Correlation Between Carbon Emission, Economic Growth, Energy Use, and Oil Consumption by the Most Prominent Contributors to Travel and Tourism GDPs. Front. Environ. Sci. 10:945648. doi: 10.3389/fenvs.2022.945648
Received: 16 May 2022; Accepted: 14 June 2022;
Published: 22 July 2022.
Edited by:
Vishal Dagar, Great Lakes Institute of Management, IndiaReviewed by:
Muhammad Sibt E. Ali, Zhengzhou University, ChinaIrfan Khan, Beijing Institute of Technology, China
Copyright © 2022 Khan, Basit, Khan and Khan. This is an open-access article distributed under the terms of the Creative Commons Attribution License (CC BY). The use, distribution or reproduction in other forums is permitted, provided the original author(s) and the copyright owner(s) are credited and that the original publication in this journal is cited, in accordance with accepted academic practice. No use, distribution or reproduction is permitted which does not comply with these terms.
*Correspondence: Muhammad Kamran Khan, bWtraGFuLmJ1aWNAYmFocmlhLmVkdS5waw==
†ORCID ID: Aarif Mohammad Khan orcid.org/0000-0002-7190-6518 Uzma Khan orcid.org/0000-0002-7248-090X Muhammad Kamran Khan orcid.org/0000-0002-7687-0382