 Na Xiong
 Bingteng Sun
 Linli Jiang
 Haitao Cui
- 1School of Management, Guangxi Minzu University, Nanning, China
- 2School of Economics, Guangxi Minzu University, Nanning, China
- 3School of Economics and Management, Wuyi University, Jiangmen, China
Tourism value chains is scattered across the economic fields. This paper seeks to carry out an empirical analysis of the relationship between climate change and tourism development in China. We used relevant data from 31 provinces in China, and analyzed the spatial effects of climate change on tourism development using a spatial Durbin model. In the development of tourism in Chinese provinces, the research results show that the high-high agglomeration areas of inbound overnight tourists are widely distributed in the coastal areas of eastern China, while the low-low agglomeration areas are mainly distributed in western China, showing an unreasonable bipolar distribution. In terms of climate change, the increase of annual precipitation contributes to the enhancement of the number of inbound overnight tourists in local areas, but reduces the number of inbound overnight tourists in adjacent areas; the increase of annual average temperature raises the number of inbound overnight tourists in local areas, but decreases the number of inbound overnight tourists in adjacent areas; which indicates that there is a spatial spillover effect of climate change on tourism development. Therefore, we propose that western China should receive further policy support, the positive spatial spillover effect of the number of inbound overnight visitors among provinces should be fully utilized, and the tourist attractions should be enriched and developed. However, there are some limitations in the construction of the spatial weight matrix, the consideration of sample size, and the selection of factors affecting tourism development.
1 Introduction
The COVID-19 pandemic has delivered a profound shock to the Global Value Chain (He, 2021). From the perspective of regional tourism development, the tourism value chain is a value creation process driven by government departments, private tourism service providers, non-governmental organizations and local residents (Khan and Banerjee, 2020). Since the middle and later 20th century, the global climate change characterized by climbing temperature has intensified day by day, shifting the natural and socio-economic conditions on which the development of tourism depends (WTTC, 2012). In multiple periods, the warming trend in China is prominent globally, with its average warming rate substantially higher than the global average warming rate during the same period (Ding et al., 2006). In this context, temporal and spatial changes in weather conditions and landscape quality within China have brought great uncertainty to tourism development. It is predicted that the annual average temperature in China will increase by 2.3–3.3°C in 2050, and by 3.9–6.0°C in 2,100 (Lin et al., 2006). It is apparent that climate change is bound to be one of the greatest challenges to be addressed in the development of tourism in China in the 21st century.
Tourism is a climate sensitive industry (Scott and Lemieux, 2010). Globally, the climate will be the main influencing factor on tourism (Smith, 2012). Climate change has an impact on countries (Agnew and Viner, 2001; Hamilton et al., 2005), tourist destinations (Staple and Wall, 1996; König, 1999), specific tourism activities or tourism sectors (e.g. ski industry) (Breiling and Charamza, 1999; Beniston, 2003). With global climate change, global warming presents good opportunities for tourism development in some countries or regions (Giles and Perry, 1998), the most popular destinations will shift to higher latitudes and higher altitudes (Hamilton et al., 2005). Climate change will reduce international tourist flows, and the warm climate will make residents of high-latitude countries spend more holidays in their own countries (Hamilton et al., 2005). In turn, climate change may make some tourist destinations less attractive and damage tourism resources and facilities, forcing a change in the type of tourism activity. Climate change can damage coastal tourism facilities, beaches, and have negative effects on marine ecosystems (Belle and Bramwell, 2005). Extreme weather can lead to infrastructure damage, flight cancellations, and traffic disruptions, which can make the area less safe and attractive for tourists, putting the tourism industry at great risk (Becken, 2005). Some islands will have continuous dry weather, the shortage of water resources may lead to the conflict between tourism development and local residents’ water use, and the deterioration of the environment further weakens the attraction of local tourism (Perry, 2006).
Climate is one of the factors affecting tourism decision-making. Climate is of internal importance to people’s travel decisions, including motivation, destination selection and travel timing (Scott and Lemieux, 2010). Climate change affects travelers’ participation levels in various tourism activities and travelers’ preference for destinations (Giles and Perry, 1998; Braun et al., 1999). According to the travel mode of British tourists, the maximum temperature for travel is 30.7°C, and a slight increase in temperature will reduce the number of tourists (Maddison, 2001). Climate change affects the spatial distribution and flow of tourists, the behavior of tourism activities in specific destination areas (Kent et al., 2002; Uyarra et al., 2005). Travel demand is related to daily temperature and precipitation, and travelers are willing to choose to travel to destinations with a more favorable climate (Maddison, 2001). Policies related to international air travel may affect tourists’ travel and choice of transport through increased transportation costs (Hares et al., 2010). Due to the implementation of mitigation measures such as carbon tax, the cost of long-distance air flights will increase, which may also reduce the attractiveness of some tourism destinations that rely on overseas long-distance tourist source markets (Frew and Winter 2009; Becken and Clapcott, 2011).
The above research analyzes the impact of climate change on the development of regional tourism from multiple perspectives, while there are few relevant studies on the impact of climate change on the coordinated development of cross regional tourism. At present, the trend of coordinated development of cross regional tourism is increasing. Climate change not only affects the development of local tourism, but also has an important impact on the coordinated development of cross regional tourism. Ignoring the impact of climate change on the coordinated development of cross regional tourism will underestimate the contribution of tourism to economic growth. Spatial econometric model is to incorporate spatial correlation into the traditional econometric model, which can not only improve the accuracy of model estimation, but also solve the problem of omitted variables of the model to a certain extent (Coughlin and Segev, 2010). Thus, we introduce spatial dependence into the traditional regression model to focus on the impact of climate change on tourism development. Based on the China’s provincial panel data, this paper takes climate change as the core factor, and focus on analyzing the spatial effect of annual average temperature and annual precipitation on inbound overnight tourists in China by using the spatial Durbin model.
2 Research method
2.1 Variable design
2.1.1 Explained variable
Inbound tourism is a good indicator to assess the competitiveness of regional tourism, as it is an important component of the local economic system (Mou et al., 2020). Inbound tourists refer to foreigners, Hong Kong, Macao, and Taiwan compatriots who come to China (mainland) for sightseeing, vacation, visiting relatives and friends, medical treatment, shopping, attending conferences or engaging in economic, cultural, sports and religious activities during the reporting period (i.e., the number of inbound tourists) (Liu and Li, 2019). Overnight tourists are those who stay in China at least 24 h. Besides sightseeing, they do eating, staying, traveling, shopping, and pleasuring, thus spending more and bringing about more tourist receipt, and reflecting more of the development level of inbound tourism (Sun et al., 2008). Therefore, we select inbound overnight tourists to measure the tourism development of a region.
2.1.2 Explanatory variables
Since climate change refers to the change in the average state of climate over time, climate is changing in real time. Climate variables such as temperature and precipitation play a crucial role on tourism flows worldwide (Pintassilgo et al., 2016). In order to better estimate the impact of climate change on inbound overnight tourists, we used the average annual temperature (temp) and annual precipitation (preci) to study their effects on inbound overnight tourists in different provinces of China.
2.1.3 Control variables
As far as the control variables are concerned, the level of economic development reflects the affluence of a region, the higher the level of economic development, the better the development of tourism (Rauf et al., 2018). Traffic accessibility is a prerequisite for tourists to travel, and it is also a tourist destination and tourist source market. Good tourism traffic accessibility is a necessary conditions for the development of tourism (Wang et al., 2021). As an important part of the accommodation industry, star hotels reflect the reception ability of urban tourism to a great extent (Ren et al., 2016). Therefore, we chose economic basis, transportation convenience and tourism reception capacity as control variables. The specific variable descriptions are shown in Table 1.
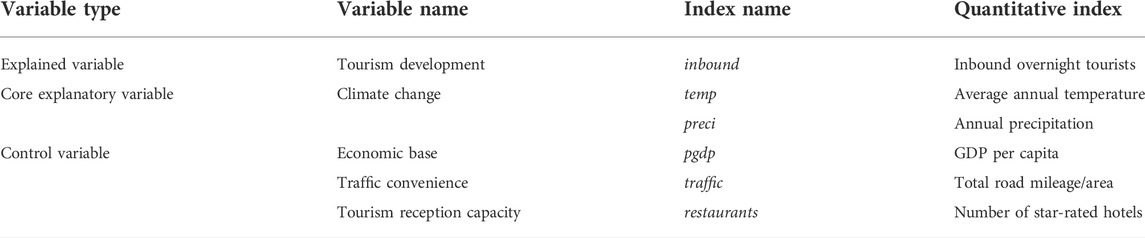
TABLE 1. Variable description.
2.2 Dataset sources
This paper uses data related to 31 provinces (municipalities and autonomous regions) in China. Specifically, the data of inbound overnight tourists from 2008 to 2017 are from “China Statistical Yearbook”. Data on annual precipitation and annual average temperature are from the statistical yearbooks of each province (municipality and autonomous region) in China as well as statistical bulletins. For provinces that cannot obtain climate data, the average value of climate data of prefecture level cities be used instead. The data of GDP per capita of each province are obtained from the “China Social Statistics Yearbook”. In addition, the data of total road mileage is obtained from the “China Traffic Yearbook,” and the data of the number of star-rated hotels is obtained from the “China Tourism Statistics Yearbook”.
2.3 Model
2.3.1 Model construction
The commonly used models for spatial econometrics are spatial lag model, spatial error model and spatial Durbin model. Before constructing the spatial econometric model, we first constructed the relationship between climate change and tourism development
In Eq. 1,
2.3.2 Spatial autocorrelation test
Whether to add spatial effects to the original model depends on the existence of spatial autocorrelation characteristics of inbound overnight tourists in 31 provinces (municipalities and autonomous regions) of China. Spatial autocorrelation tests (mainly Moran’s I, R-LM-lag, and LM-lag index, etc.) are required before constructing the model and are mainly hypothesis tests based on great likelihood estimation. The original hypothesis is
In Eq. 2,
In Eq. 3, E(I) is the expected value of Moran’s I, and Var(I) is the standard deviation of Moran’s I.
2.3.3 Spatial weight matrix selection
In calculating Moran’s I, the first step needs to construct the spatial weight matrix. There are three common methods to construct the spatial weight matrix. The first is to construct the spatial weight matrix based on the inverse of the geographical distance. The second is to construct the spatial adjacency matrix based on whether the spaces are adjacent or the distance among two regions. The third is to set the spatial weight matrix based on the inverse of the economic distance weight matrix. In this paper, the spatial weight matrix is constructed according to whether the spaces are adjacent or not (Xiao and Mao, 2021), and the spatial weight matrix is defined as follows.
In Eq. (4), Wij indicates the proximity relationship between region i and region j. When region i and region j have adjacent boundaries, Wij equals 1, no adjacent boundaries are 0, and all elements on the main diagonal are 0. Since Hainan province has no geographically adjacent provinces to it, it is set to be adjacent to Guangdong province here.
2.3.4 Spatial panel model setting
The spatial econometric model is considered to be invoked instead of the classical econometric model, and the expressions created by the specific model are as follows:
1) Spatial lag model
2) Spatial error model
where
3) Spatial Durbin model
In the above expression, C is constant term.
2.3.5 Spatial effect decomposition
According to the theory of spatial econometric models, the dependent variable of a region is affected not only by the independent variables of that region (i.e., direct effects), but also by the independent and dependent variables of other regions (i.e., indirect effects or overflow effects). In this paper, we refer to the existing literature on partial differencing (Lesage and Pace, 2008), and write the spatial econometric model in vector form:
In the above equation:
In the matrix on the right, the direct effect is represented as the mean of all elements on the main diagonal, the indirect effect is represented as the mean of all elements on the non-main diagonal, and the total effect is the sum of the direct and indirect effects.
3 Spatial correlation analysis
3.1 Global spatial autocorrelation analysis
The global Moran’s I for inbound overnight tourists in 31 provinces (cities, autonomous regions) of China was calculated and tested for significance by using STATA 16.0. The results are shown in Table 2.
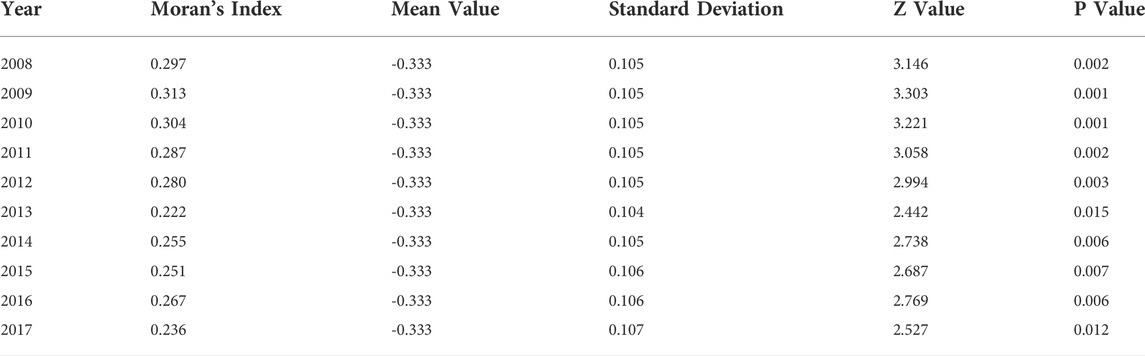
TABLE 2. Global Moran’s I and its significance test results of inbound overnight tourists in 31 provinces (cities, autonomous regions) of China from 2008 to 2017
Table 2 shows the results of Moran’s I calculation for inbound overnight tourists by regions in China from 2008 to 2017. The global Moran’s I of inbound overnight tourists in China all ranged from 0.222 to 0.313, and the p-values are all less than 0.05, passing the significance test at the 5% level. This indicates that the number of inbound overnight tourists has a significant positive spatial correlation (i.e., there is spatial dependence) among provinces in China. The provinces with a large number of inbound overnight tourists also have high number of inbound overnight tourists in the surrounding provinces. However, the number of inbound overnight tourists in the provinces with a low number of inbound overnight tourists is also low in the surrounding provinces. It can be seen that the number of inbound overnight tourists in a province will be affected by the neighboring provinces. In addition, the spatial correlation of inbound overnight tourists by province has an increasing trend from 2013 to 2017, indicating that the spatial agglomeration characteristics of the number of inbound overnight tourists among Chinese provinces are gradually increasing. Overall, China’s tourism development is characterized by spatial agglomeration, which highlights the importance of Supply Chain Management in the tourism industry (Hariharasudan et al., 2021).
3.2 Local spatial autocorrelation analysis
Since the global Moran’s I only reflected the average state of the overall condition of the study area with respect to the differences among neighboring regions, it failed to reflect the spatial heterogeneity of regional units, which makes it difficult to reveal the dynamic evolution characteristics of inbound overnight tourists within the regions. Therefore, Moran scatter plots were drawn for 4 years (2008, 2011, 2014, and 2017) by using STATA 16.0. In Figure 1, Quadrant I and III indicate high-high aggregation area and low-low aggregation area respectively, which implies that provinces with higher (lower) inbound overnight tourists also have higher (lower) inbound overnight tourists in the periphery, showing a spatial aggregation trend. Quadrant II and IV denote low-high agglomeration areas and high-low agglomeration areas respectively, meaning that provinces with higher (lower) inbound overnight tourists have lower (higher) inbound overnight tourists in their surroundings instead.
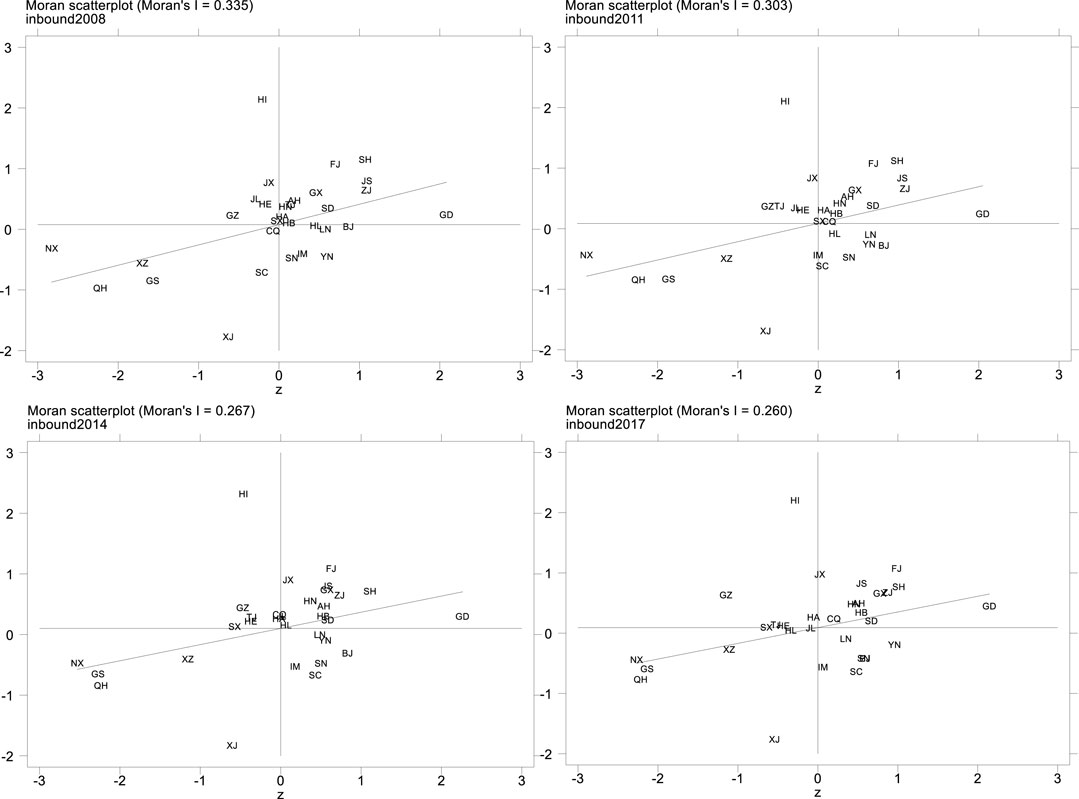
FIGURE 1. Moran scatter plot of inbound overnight tourists from 31 provinces in China in 2008, 2011, 2014, and 2017.
The provinces located in the quadrant I and III are significantly more than those in the quadrant II and IV. Furthermore, the high-high agglomeration areas are significantly more than the low-low agglomeration areas, indicating that inbound overnight tourists are not only correlation but also spatial heterogeneity among provinces. Among them, the number of provinces in quadrant II generally shows a decreasing trend. However, the number of provinces in the quadrant III increases from seven in 2008 to 10 in 2017, with an increasing trend. In the quadrant I, the number of provinces changes steadily, increasing from 11 in 2008 to 12 in 2017. The number of provinces in the quadrant IV has changed, Hubei and Heilongjiang drop out of the high-low aggregation area, and change to the high-high aggregation area and low-low aggregation area, respectively. In general, it indicates that the agglomeration characteristics of inbound overnight tourists are mainly distributed in high-high agglomeration areas and low-low agglomeration areas, which shows the spatial agglomeration dynamics of areas with relatively high or low numbers of inbound overnight tourists are increasing. The spatial differences in regional tourism development are increasingly narrowing, which is consistent with the results of the global spatial autocorrelation analysis in the previous section.
The number of regional units located in the quadrant II and IV decreased as a whole. It indicated that the phenomenon of spatial polarization in the process of tourism development is gradually decreasing. Furthermore, the high-level regions of tourism development have a certain “trickle-down effect” on backward regions, which has a positive impact on the change of the unbalanced pattern of tourism development. The more developed regions such as Shandong (SD), Jiangsu (JS), Shanghai (SH), Zhejiang (ZJ), Fujian (FJ), and Guangdong (GD) are always in the quadrant Ⅰ, showing high aggregation. However, the backward regions such as Xinjiang (XJ), Gansu (GS), Qinghai (QH), and Ningxia (NX) have been in the quadrant Ⅲ for a long time, showing a low aggregation. The result of local spatial autocorrelation analysis shows that although the overall spatial difference of China’s tourism development is narrowing, the coordinated development of regional tourism has not been realized.
Specifically, we analyzed the inbound overnight tourists in 2017 (Figure 2) by using ArcGIS 10.7. It shows that among the high-high aggregation areas, Shandong, Jiangsu, Shanghai, Zhejiang, Fujian, Guangdong, and other coastal regions of eastern China are distributed in an “arc shape”. Furthermore, coupled with the radiation driving effect of their own economic development, the tourism industry in Anhui, Jiangxi, and Guangxi have also become a hot development area, and the regional scenic spots in Chongqing, Hunan, and Hubei are connected together. The overall distribution characteristics of regional scenic spots shows that there are more inbound overnight tourists in each province, and there are also more inbound overnight tourists in its adjacent provinces. In the low-low aggregation areas, Ningxia, Gansu, Qinghai, Xinjiang, and Tibet are all located in western China. The neighboring provinces are spatially similar, with western provinces having fewer inbound overnight tourists and their neighboring provinces having fewer inbound overnight tourists. For low-high aggregation areas and high-low aggregation areas, Hainan, Guizhou, and Henan are far away from each other, and there is no significant spatial correlation in the number of inbound overnight tourists among them. Liaoning, Inner Mongolia, Yunnan, Beijing, Shaanxi, and Sichuan are distributed in eastern, western, and central China, and do not show high local spatial correlation.
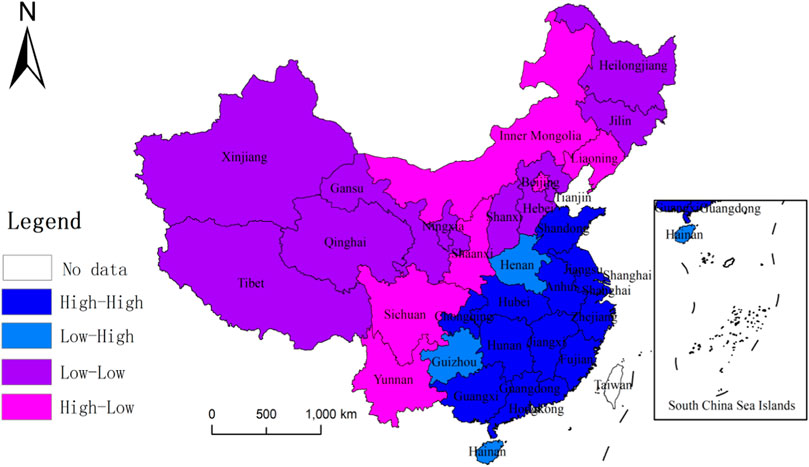
FIGURE 2. Moran scatter plot of inbound overnight tourists from 31 Chinese provinces in 2017.
Overall, there is a significant spatial distribution dependence and imbalance in the spatial distribution of inbound overnight tourists in China. The possible reason for this is that the development of tourism industry clusters requires higher tourism infrastructure and services, while the western region is an underdeveloped region with relatively backward development and in a disadvantageous position in the competition for tourism resources. Therefore, the tourism service facilities and tourism resources in the western region do not have an obvious role in driving tourism development. The eastern region is economically developed, the supporting services and facilities for tourism are more perfect, providing more convenience and high-quality tourism services to tourists. At the same time, the regional integration of tourism resources has brought cost advantages and agglomeration economic effects to the eastern region, promoting the linkage development of regional tourism.
3.3 Spatial measurement test
The presence of spatial effects made the relationship between climate change and tourism development more complex, and OLS estimation is no longer the optimal unbiased estimator. Therefore, this paper conducted a spatial econometric analysis using panel data of 31 Chinese provinces (municipalities and autonomous regions) from 2008–2017. The three spatial economic models including spatial Durbin model (SDM), spatial lag model (SLM) and spatial error model (SEM) have fixed effects and random effects, and the fixed effects specifically include time fixed effects, individual fixed effects, and spatio-temporal dual fixed effects. In this paper, we first conducted Lagrange multiplier (LM) test to prove whether the spatial econometric model considering spatial effect was better than the ordinary panel model. Then according to likelihood ratio (LR) test and Wald test, we could prove whether the SDM could degenerate into a SLM or a SEM (Elhorst, 2014). Finally, we conducted a Hausman test to determine whether there were individual effects or random effects in the model. The results of spatial econometric model correlation tests are shown in the following table.
Based on Table 3, the spatial error and spatial lag were tested using LM test to determine whether the spatial econometric model was used. From the LM test results, it can be seen that among the three tests for spatial error, R-LM-err rejects the original hypothesis of “no spatial autocorrelation”. In the two tests of spatial lag, both LM-lag and R-LM-lag tests reject the original hypothesis, indicating that spatial econometric analysis should be conducted. Further, the LR test and Wald test were used to analyze whether the SDM could degenerate into SEM or SLM. Two original hypotheses were set, one of which indicates that the SDM could degenerate into a SEM, and the other indicates that the SDM could degenerate into a SLM. As can be seen from Table 3, the LR test statistics all pass the 5% significance level, indicating that the SDM can not degenerate into SLM and SEM. The coefficients of the Wald test are greater than 0, and both reject the original hypotheses, also indicating that the SDM can not degenerate into a SEM or a SLM. Therefore, the SDM, combining SEM and SLM, should be selected for regression. To determine whether to use the SDM with fixed effects or the SDM with random effects, the Hausman test was used to discriminate. According to the inspection results, the chi-square statistic of SDM is 22.09, which passes the 1% significance test, and rejects the original hypothesis of accepting random effects, so the SDM with fixed effects should be selected.
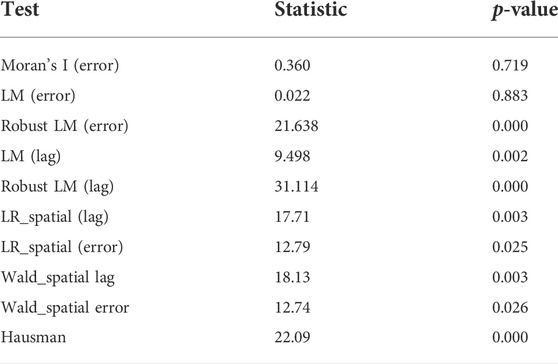
TABLE 3. Results of spatial econometric model correlation tests.
The regression results are shown in Table 4. Based on the magnitude of log-likelihood and dispersion (sigma2_e) of the three fixed-effect models, it can be seen that the fit of the SDM under the spatio-temporal dual fixed effect is significantly better than that of the SDM under the temporal fixed and spatial fixed effects. And the spatial autoregressive coefficient of the SDM with spatio-temporal dual fixed effects is significantly negative, indicating the increase of inbound overnight tourists from neighboring provinces will reduce the number of inbound overnight tourists from the central province. Finally, the spatial panel Durbin model with spatio-temporal dual fixed effects was chosen as the final model for analysis in this paper.
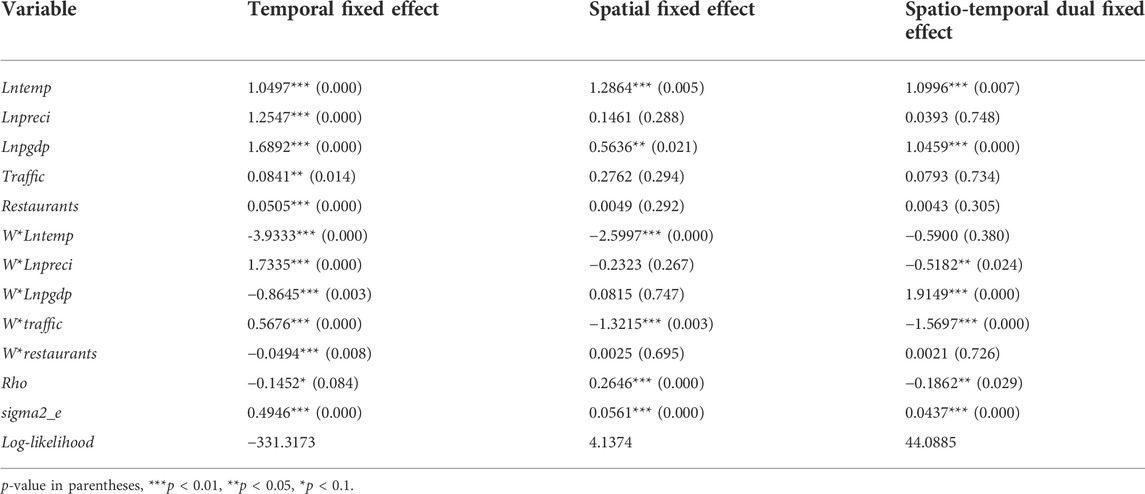
TABLE 4. Regression results of the SDM with different effects.
4 Model estimation results and analysis
The spatial econometric model regression coefficients does not effectively reflect the degree of influence of the explanatory variables on the dependent variable (Lesage and Pace, 2008). Therefore, the spillover effects were decomposed into direct, indirect and total effects using partial differencing. The results of SDM with spatio-temporal dual fixed effects are presented in Table 5.
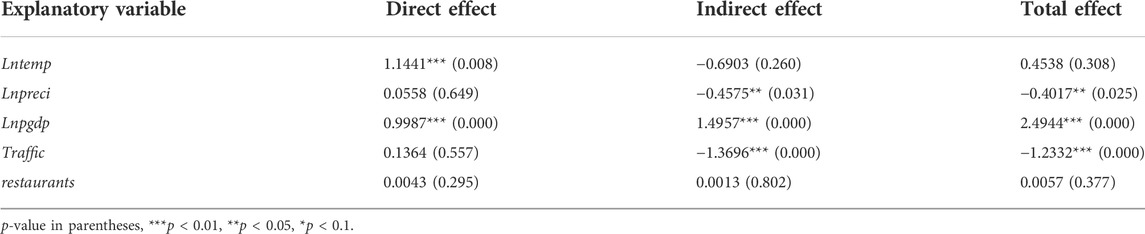
TABLE 5. Direct and indirect effects of explanatory variables on inbound overnight tourists.
According to the estimation results in Table 5, it could be seen that the regression coefficient of annual average temperature under the direct effect is 1.1441, which is significant at 1% significance level. The regression coefficient of indirect effect is -0.6903, which indicates that the increase of annual average temperature has a significant positive impact on the development of tourism in the local region, but has a hindering effect on the development of tourism in neighboring regions. The possible reason is under the influence of temperature change, the inbound overnight tourists have higher requirements for the perfection of tourism supporting services and facilities. This has strengthened the cooperation among tourism enterprises and effectively played the role of the supply chain of tourism products (Slusarczyk et al., 2016). In addition, innovation is an important factor for the development of an enterprise (Wall, 2021b), which inspires local tourism enterprises to improve their innovation ability to optimize their internal structure. In this dynamic process, the tourism ecological environment has been improved (Coombes and Jones, 2010), which plays a positive role in promoting the development of regional tourism in the local region. However, the increase of the annual average temperature is likely to cause the sea level rise, which destroys the tourism industry clusters and ecological environment, so that the spatial effect of inter-regional tourism industry clusters is disintegrated (Xu et al., 2019), thus hindering the development of tourism in the surrounding areas. The regression coefficient of the direct effect of annual precipitation is 0.0558 and the regression coefficient of the indirect effect is -0.4575, which is significant at the 5% significance level, indicating that the increase in annual precipitation promoted tourism in local region, but has a dampening effect on tourism development in neighboring regions. It also causes changes in the natural landscape and reduction of biodiversity, and results in direct changes in tourism resources and reduced sustainability (Becken, 2005), leading to the destruction of the tourism portfolio of the surrounding region.
In terms of control variables, the regression coefficient of GDP per capita is significantly positive under both direct and indirect effects, indicating that economic development promoted tourism development in local region and neighboring regions. That is because economic development leads to the improvement of tourism infrastructure and optimization of tourism support services (Eugenio-Martin et al., 2008), which in turn promotes the development of regional tourism. The coefficient of traffic convenience is 0.1364 in the direct effect, but it is -1.3696 in the indirect effect, which passes the 1% significance test, indicating that the convenient the transportation can contribute to an increase in local inbound overnight tourists and a decrease in inbound overnight tourists from neighboring regions. The regression coefficients of the number of star hotels in the direct and indirect effects are not significant, which may be due to the fact that the increase in the number of star hotels will drive tourism consumption and raise the price level, which will reduce the occupancy rate of tourists.
5 Conclusion and discussion
5.1 Conclusion
We used spatial autocorrelation theory and spatial econometric models to study the impact of climate change on the spatial distribution of tourism development in China. The following conclusions are drawn: 1) Through global and local spatial correlation analysis, it is found that there are notable spatial agglomeration characteristics of inbound overnight tourists in different provinces in China, and there are spatial proximity similarities in the number of inbound overnight tourists among provinces. The low-low agglomeration areas are mainly distributed in the western China, and the high-high agglomeration areas are mainly distributed in the eastern China, showing an unreasonable polarization distribution. 2) The spatial econometric model shows that the increase of inbound overnight tourists from neighboring provinces will reduce the number of inbound overnight tourists from the central province. The increase in annual average temperature significantly promotes the number of inbound overnight tourists in the local region, while decreases the number of inbound overnight tourists from neighboring provinces. The increase in annual precipitation significantly reduces the number of inbound overnight tourists from neighboring provinces. 3) Overall, the increase of GDP per capita will significantly enhance the development of tourism, and the increase of accessibility will significantly promote the development of tourism in the local region, but the promotion effect of the number of star-rated hotels is not yet significant. So there are different spatial spillover effects of different variables.
5.2 Discussion
Tourism is a kind of service industry, and information analysis is an important factor in the service industry (Wall, 2021a). Climate change has become a worldwide concern, research on climate change related to tourism has also gained rapid momentum. Therefore, the analysis of climate change information is very important for the development of tourism. To the best of our knowledge, there are few studies in the field of climate tourism that link climate change to tourism development in various regions of China. This paper contributes to enrich the research related to climate change and tourism development.
Value chains are the mainstream analytical framework for analyzing the development of economic organizations and backward regions, and tourism is an important tool for promoting economic development and poverty reduction in backward regions. Therefore, focusing on value chain issues can help us better understand the development mechanism of tourism places in the context of globalization, and explore a more balanced approach to economic development and resource use conservation (Song et al., 2013). The current research on climate change from the perspective of tourism has been intensifying, starting from the impact of climate change on the ski industry and seaside tourism (e.g. Scott and Mcboyle, 2007; Coombes and Jones, 2010), and later involving various related sectors of climate change and tourism, such as wetland tourism, urban tourism, national parks, etc. (Scott et al., 2002; Hamilton et al., 2005; Hall, 2010).
Unlike previous studies on climate change and tourism, this is a study on the spatial effects of different climate changes on tourism development in each region of China. We provide insight into the effects of climate change on tourism development and further elucidate the effects of changes in annual precipitation and mean annual temperature on inbound overnight visitors. In particular, we explore the spatial effects of annual precipitation and average annual temperature on regional inbound overnight visitors, which further expands the theoretical boundaries of climate change and tourism development theory. In addition, this paper also finds that tourism development across regions is spatially dependent, which provides new insights and ideas to promote cross-regional tourism linkage development.
5.3 Research recommendations
Our conclusions may provide scientific and effective policy implication for government to develop regional tourism. Therefore, we make the following recommendations: 1) The western region of China should be further supported by relevant policies. The further intensification of the phenomenon of low-low agglomeration in tourism development in the western region should be alerted. The government should increase policy support for the western region, which is conducive to improving regional tourism development and achieving spatially balanced tourism development. 2) The spatial spillover effect of the number of inbound overnight tourists among provinces should be fully utilized. In order to achieve mutual benefit and win-win situation, the sharing of climate resources among provinces should be strengthened. At the same time, each region should create a regional tourism community brand and form economies of scale. 3) Tourist attractions should be further enriched and developed. Weather is a very objective natural phenomenon, and regional government should enrich tourist climate attractions based on local climate change. In addition, they should further promote the development of regional tourism by increasing the economic base, improving the density of the transportation network, and developing the star hotel industry.
5.4 Limitations and prospects
In this paper, we provide an empirical verification and a new notion for the research of climate change and tourism development, as well as the references for countries around the world to formulate tourism development policies across regions. However, it is worth noting that this paper is limited by the objective conditions such as data and methods, and still has the following deficiencies to be further explored. Firstly, for the spatial weight matrix used in the empirical process analysis, we only consider whether the geographical location is adjacent, but fail to take into account the factors such as economic distance. Secondly, based on the availability of data, only 31 regions in China are selected as the research object. More specific regions could be selected for future studies, as it would provide more insight into the specific relationship between climate change and tourism development. Finally, the factors that influence tourism development are not limited to the explanatory variables used in the paper, and there are still other factors that have an impact on tourism development, such as environmental regulation, scientific and technological level, seasonal distribution, and so on.
In the future, the follow-up research should focus on the following aspects: 1) The empirical research on the spatial evolution of the impact of climate change on tourism development should be strengthen, and a scientific basis for the regional linkage development of global tourism should be provided. 2) In dealing with climate change, the tourism industry urgently needs to explore proactive and forward-looking coping strategies, and the policies and actions to deal with climate change should be synchronized in time. 3) The evolution trend of tourism and climate change should be paid close attention to. On the basis of studying the interactive relationship between climate change and tourism development, multi-dimensional comprehensive research should be further carried out.
Data availability statement
The original contributions presented in the study are included in the article/Supplementary Material, further inquiries can be directed to the corresponding authors.
Author contributions
NX conceived and designed this study. BS performed the empirical analysis of data, and contributed significantly to manuscript preparation. LJ contributed to revising the manuscript critically for important intellectual content. HC put forward valuable idea, and participated in writing the manuscript.
Funding
The work described in this paper is supported by the [National Natural Science Foundation of China #1] under Grant [number 72003051] [Ministry of Education of Humanities and Social Science Project of China #2] under Grant [number 19YJC790048] [Graduate Education Innovation Program of Guangxi Minzu University #3] under Grant [number gxun-chxs2021089]; and [Project of Training Plan for Young and Middle-aged Backbone Teachers in Guangxi #4] under Grant [number 2020QGRW012].
Conflict of interest
The authors declare that the research was conducted in the absence of any commercial or financial relationships that could be construed as a potential conflict of interest.
Publisher’s note
All claims expressed in this article are solely those of the authors and do not necessarily represent those of their affiliated organizations, or those of the publisher, the editors and the reviewers. Any product that may be evaluated in this article, or claim that may be made by its manufacturer, is not guaranteed or endorsed by the publisher.
References
Agnew, M. D., and Viner, D. (2001). Potential impacts of climate change on international tourism. Tour. Hosp. Res. 3 (1), 37–60. doi:10.1177/146735840100300104
Becken, S., and Clapcott, R. (2011). National tourism policy for climate change. J. Policy Res. Tour. Leis. Events 3 (1), 1–17. doi:10.1080/19407963.2011.539378
Becken, S. (2005). Harmonising climate change adaptation and mitigation: The case of tourist resorts in Fiji. Glob. Environ. Change 15 (4), 381–393. doi:10.1016/j.gloenvcha.2005.08.001
Bekti, R. D., and Sutikno, (2012). Spatial Durbin model to identify influential factors of diarrhea. J. Math. Stat. 8 (3), 396–402. doi:10.3844/jmssp.2012.396.402
Belle, N., and Bramwell, B. (2005). Climate change and small island tourism: policy maker and industry perspectives in Barbados. J. Travel Res. 44 (1), 32–41. doi:10.1177/0047287505276589
Beniston, M. (2003). Climatic change in mountain regions: a review of possible impacts. Clim. Change 59 (1-2), 5–31. doi:10.1023/A:1024458411589
Braun, O. L., Lohmann, M., Maksimovic, O., Meyer, M., Merkovic, A., Messerschmidt, E., et al. (1999). Potential impact of climate change effects on preferences for tourism destinations. a psychological pilot study. Clim. Res. 11 (3), 247–254. doi:10.3354/cr011247
Breiling, M., and Charamza, P. (1999). The impact of global warming on winter tourism and skiing: a regionalised model for Austrian snow conditions. Reg. Environ. Change 1 (1), 4–14. doi:10.1007/s101130050003
Coombes, E. G., and Jones, A. P. (2010). Assessing the impact of climate change on visitor behaviour and habitat use at the coast: a UK case study. Glob. Environ. Change 20 (2), 303–313. doi:10.1016/j.gloenvcha.2009.12.004
Coughlin, C. C., and Segev, E. (2010). Foreign direct investment in China: a spatial econometric study. World Econ. 23 (1), 1–23. doi:10.1111/1467-9701.t01-1-00260
Ding, Y., Ren, G., and Shi, G. (2006). National assessment report of climate change (I): climate change in China and its future trend. Adv. Clim. Change Res. 2 (3), 115–128. doi:10.1016/0360-1285(76)90008-3
Elhorst, J. P. (2014). Matlab software for spatial panels. Int. Regional Sci. Rev. 37 (3), 389–405. doi:10.1177/0160017612452429
Eugenio-Martin, J. L., Martín-Morales, N., and Sinclair, M. T. (2008). The role of economic development in tourism demand. Tour. Econ. 14 (4), 673–690. doi:10.5367/000000008786440111
Frew, E., and Winter, C. (2009). Tourist response to climate change: regional and metropolitan diversity. Tour. Rev. Int. 13 (4), 237–246. doi:10.3727/154427210X12741079930515
Giles, A. R., and Perry, A. H. (1998). The use of a temporal analogue to investigate the possible impact of projected global warming on the UK tourist industry. Tour. Manag. 19 (1), 75–80. doi:10.1016/S0261-5177(97)00093-9
Hall, C. M. (2010). Tourism and biodiversity: more significant than climate change? J. Herit. Tour. 5 (4), 253–266. doi:10.1080/1743873X.2010.517843
Hamilton, J. M., Maddison, D. J., and Tol, R. (2005). Climate change and international tourism: a simulation study. Glob. Environ. Change 15 (3), 253–266. doi:10.1016/j.gloenvcha.2004.12.009
Hares, A., Dickinson, J., and Wilkes, K. (2010). Climate change and the air travel decisions of UK tourists. J. Transp. Geogr. 18 (3), 466–473. doi:10.1016/j.jtrangeo.2009.06.018
Hariharasudan, A., Kot, S., and Sangeetha, J. (2021). The decades of research on SCM and its advancements: comprehensive framework. Acta Logist. 8 (4), 455–477. doi:10.22306/al.v8i4.264
He, M. (2021). Global value chain in the post-COVID era: implications for regional cooperation of ASEAN and China. Open J. Polit. Sci. 11 (4), 739–751. doi:10.4236/ojps.2021.114047
Huang, C., Wang, J. W., Wang, C. M., Cheng, J. H., and Dai, J. (2021). Does tourism industry agglomeration reduce carbon emissions? Environ. Sci. Pollut. Res. Int. 28, 30278–30293. doi:10.1007/s11356-021-12706-2
Kent, M., Newnham, R., and Essex, S. (2002). Tourism and sustainable water supply in mallorca: a geographical analysis. Appl. Geogr. 22 (4), 351–374. doi:10.1016/s0143-6228(02)00050-4
Khan, D., and Banerjee, S. (2020). Value chain mapping of tourism in birbhum. Int. J. Tour. Hosp. Manag. Digital Age 4 (2), 23–33. doi:10.4018/IJTHMDA.2020070103
König, U. (1999). Climate change and snow tourism in Australia. Geogr. Helv. 54 (3), 147–157. doi:10.5194/gh-54-147-1999
Lesage, J. P., and Pace, R. K. (2008). Spatial econometric modeling of origin-destination flows. J. Reg. Sci. 48 (5), 941–967. doi:10.1111/j.1467-9787.2008.00573.x
Lin, E., Xu, Y., and Jiang, J. (2006). National assessment report of climate change (Ⅱ): Climate change impacts and adaptation. Adv. Clim. Change Res. 2, 51–56. 1673-1719 (2007)Suppl.-0006-06.
Liu, X., and Li, Z. (2019). Grouping tourist complaints: what are inbound visitors’ problems with Chinese destinations? Asia Pac. J. Tour. Res. 24 (4), 348–364. doi:10.1080/10941665.2018.1564682
Maddison, D. (2001). In search of warmer climates? The impact of climate change on flows of British tourists. Clim. Change 49 (1-2), 193–208. doi:10.1023/A:1010742511380
Mou, N., Yuan, R., Yang, T., Zhang, H., Tang, J. J., Makkonen, T., et al. (2020). Exploring spatio-temporal changes of city inbound tourism flow: the case of Shanghai, China. Tour. Manag. 76, 103955. doi:10.1016/j.tourman.2019.103955
Perry, A. (2006). Will predicted climate change compromise the sustainability of mediterranean tourism? J. Sustain. Tour. 14 (4), 367–375. doi:10.2167/jost545.0
Pintassilgo, P., Rosselló, J., Santana-Gallego, M., and Valle, E. (2016). The economic dimension of climate change impacts on tourism: the case of Portugal. Tour. Econ. 22 (4), 685–698. doi:10.1177/1354816616654242
Rauf, A., Draz, M., Su, L., and Ozturk, I. (2018). Tourism and environmental pollution: evidence from the one belt one road provinces of western China. Sustainability 10 (10), 3520. doi:10.3390/su10103520
Ren, Q., Jing, H. U., Chen, X., and Wen, J. (2016). A study on the evolution of the spatial mismatch of inbound tourism flows, scenic spots and star hotels in Zhejiang Province. J. Central China Normal Univ. Sci. 50 (01), 151–157. doi:10.19603/j.cnki.1000-1190.2016.01.027
Scott, D., and Lemieux, C. (2010). Weather and climate information for tourism. Procedia Environ. Sci. 1 (1), 146–183. doi:10.1016/j.proenv.2010.09.011
Scott, D., Malcolm, J. R., and Lemieux, C. (2002). Climate change and modelled biome representation in Canada's national park system: implications for system planning and park mandates. Glob. Ecol. Biogeogr. 11 (6), 475–484. doi:10.1046/j.1466-822X.2002.00308.x
Scott, D., and Mcboyle, G. (2007). Climate change adaptation in the ski industry. Mitig. Adapt. Strateg. Glob. Chang. 12 (8), 1411–1431. doi:10.1007/s11027-006-9071-4
Slusarczyk, B., Smolag, K., and Kot, S. (2016). The supply chain of a tourism product. Actual Problems Econ. 179 (5), 197–207.
Smith, K. (2012). The influence of weather and climate on recreation and tourism. Weather 48 (12), 398–404. doi:10.1002/j.1477-8696.1993.tb05828.x
Song, H., Liu, J., and Chen, G. (2013). Tourism value chain governance review and prospects. J. Travel Res. 52 (1), 15–28. doi:10.1177/0047287512457264
Staple, T., and Wall, G. (1996). Climate change and recreation in nahanni national park reserve. Can. Geogr. 40 (2), 109–120. doi:10.1111/j.1541-0064.1996.tb00439.x
Sun, G., Han, Y., and Yu, L. (2008). A study on relationship between foreign openness degree and inbound tourism development in China. Int. J. Bus. Manag. 3 (1, 62–69. doi:10.5539/ijbm.v3n1p62
Uyarra, M. C., Isabelle, M., Viner, D., Gill, J. A., Tinch, R. R. T., and Watkinson, A. R. (2005). Island-specific preferences of tourists for environmental features: implications of climate change for tourism-dependent states. Environ. Conserv. 32 (1), 11–19. doi:10.1017/S0376892904001808
Wall, W. P. (2021b). Determinants of SEMs’s performance-from business strategy to innovation. Pol. J. Manag. Stud. 23 (2), 537–554. doi:10.17512/pjms.2021.23.2.32
Wall, W. P. (2021a). The comparison of the TQM practices and quality performance between manufacturing & service sectors. Pol. J. Manag. Stud. 23, 436–452. doi:10.17512/pjms.2021.23.1.27
Wang, Y., Wang, M., Li, K., and Zhao, J. (2021). Analysis of the relationships between tourism efficiency and transport accessibility—a case study in Hubei province, China. Sustainability 13 (15), 8649. doi:10.3390/su13158649
Xiao, H., and Mao, J. (2021). Effects of postgraduate education on technological innovation: a study based on the spatial Durbin model. Asia Pac. Educ. Rev. 22 (1), 89–99. doi:10.1007/s12564-020-09652-y
Keywords: climate change, tourism development, spatial spillover effect, tourism value chain, Chinese tourism
Citation: Xiong N, Sun B, Jiang L and Cui H (2022) Spatial effects of climate change on tourism development in china: An analysis of tourism value chains. Front. Environ. Sci. 10:952395. doi: 10.3389/fenvs.2022.952395
Received: 25 May 2022; Accepted: 27 June 2022;
Published: 19 July 2022.
Edited by:
Shuhong Wang, Shandong University of Finance and Economics, ChinaReviewed by:
William Wall, Stamford International University, ThailandSebastian Kot, Częstochowa University of Technology, Poland
Copyright © 2022 Xiong, Sun, Jiang and Cui. This is an open-access article distributed under the terms of the Creative Commons Attribution License (CC BY). The use, distribution or reproduction in other forums is permitted, provided the original author(s) and the copyright owner(s) are credited and that the original publication in this journal is cited, in accordance with accepted academic practice. No use, distribution or reproduction is permitted which does not comply with these terms.
*Correspondence: Linli Jiang, amlhbmdsaW5saTEyMjVAMTI2LmNvbQ==; Haitao Cui, Mzk3MjMyNzY1cXEuY29t
†These authors have contributed equally to this work and share first authorship