 Shang Gao
 Fanchen Meng2,3*
- 1Beijing Institute of Technology, Beijing, China
- 2School of Management and Economics, Beijing Institute of Technology, Beijing, China
- 3Shenzhen MSU-BIT University, Shenzhen, China
- 4ESSEC Business School, Cergy, Île-de-France, France
In this study, drawing on firm life cycle theory, we focus on the corporate performance of Environmental, Social, and Governance (ESG) engagement via financial stress and consider the moderate effect of transparency, financial slack, and environmental uncertainty. The industry-year fixed effects panel regression analysis is executed based on the data including 11,742 firm-year observations for 1,486 Chinese A-share listed companies from 2010 to 2020. The results show that ESG performance can significantly improve corporate performance at all life cycle stages, especially when the corporate is in the growth stage. Moreover, the mechanism analysis shows that the financial risk mediates the relation between ESG performance and corporate performance for the corporates in the growth and maturity stages. The association between ESG and corporate performance is more pronounced when corporate information disclosure quality is high. Moreover, financial slack moderates and undermine the association between ESG and corporate performance in the maturity stages. Similarly, for the maturity and decline stages of corporate, environmental uncertainty moderates and undermines the association between ESG and corporate performance. Besides offering scientific evidence for the role of ESG ratings in relieving financial pressure and promoting corporate performance in growth and maturity stages, the results can also inform the regulators and/or investors of the benefit of engaging in corporates sustainability transition, which has implications for both the success of the regulatory regime and the advancement of long-term investment philosophy.
1 Introduction
The economic outcome of corporates’ Environmental, Social, and Governance performance (ESGP) has become one of the hottest research aspects in the current global management and financial fields (Friede et al., 2015; Yu et al., 2018; Kim and Lyon, 2015; Skarmeas and Leonidou, 2013; Huang, 2021; Bruna et al., 2022). Through ESG practice, corporates involve environmental, social, and governance factors into their management and operation processes. By improving ESGP, companies can effectively alleviate information asymmetry (Siew et al., 2016; Cui and Liu, 2018), build their reputation (Jeffrey et al., 2019), gain support from stakeholders (Weber, 2014; Huang, 2021), and promote corporate performance (Friede et al., 2015; Gao and Han, 2020). However, scholars who take the opposite view on corporate ESG construction argue that corporate investment in ESG activities may not make profits in the short term but instead restrict the flexibility of the corporate operating capital (Skarmeas and Leonidou, 2013), then expanding the exposure to financial risks, and ultimately damages the interests of shareholders (Kim and Lyon, 2015). Besides, as a corporate strategy, the role of ESG in different life cycle stages of a firm has received inadequate attention in the literature.
Firm life cycle theory suggests that the firm is like a living organism, which also goes through different stages such as birth, growth, maturity, and decline (Miller and Friesen, 1984; Adizes, 1990; Dickinson, 2011). Prior studies show that corporates have disparate operating environments and financial conditions to differ across the life cycle stages, corporates require to adopt corresponding business strategies (Anthony and Ramesh, 1992; Atif et al., 2022), and strategies of ESG practices and ESG disclosure are no exception. Corporates need to dynamically adjust the relationship between input of ESG practices and financial outcomes according to their firm life cycle, therefore they can adapt to the current trend of sustainable development transformation, meanwhile meet the cash flow requirements for their development strategy. This study attempts to fill this gap in the literature by investigating the relationship between ESGP, financial risk, and corporate performance throughout the three stages of the life cycle.
Corporations in the growth stage are in the face of more market competition pressure, and have fewer resources at their disposal and not fully standardized management systems (Jawahar and McLaughlin, 2001), and their main development goal is to improve profitability. In contrast, corporates that are entering the maturity stage are usually relatively well positioned in the market and have the willingness and ability to engage in ESG activities more than only pursue profit. Conversely, corporates entering a decline stage have less organizational flexibility (Adizes, 1979), and shareholders will focus more on safeguarding their interests and less on the stakeholders’ interests. It is more relevant to study the relationship between ESGP and corporate performance at the dynamic level than at the static level, i.e., whether ESG activities will cause financial stress in different life cycle stage; does ESGP always enhance the performance of corporates at different life cycles?
Therefore, based on the theory of firm life cycle, this study explores the differences between ESGP, financial risks, and corporate performance in different life cycles and the reasons for their existence. The industry-year fixed effects panel regression analysis is executed based on the data including 11,742 firm-year observations for 1,486 Chinese A-share listed companies from 2010 to 2020. To control for heteroscedasticity, we correct the standard errors for the clustering of residuals at the firm level. Besides, considering the endogeneity that may bias our results, we adopt lagged regression and an instrumental variable (IV) approach that uses two-stage least squares (2SLS) regression analysis. The rest of the paper is organized as follows: Section 2 is the literature review and research hypothesis; Section 3 is the research design; Section 4 is the empirical analysis and hypothesis testing; Section 5 is the research conclusion and discussion of this study.
2 Literature review and hypotheses development
2.1 ESG and corporate performance
The existing literature has not reached a consensus regarding the relationship between ESG and corporate performance; in general, the current academic community believes that adverse ESG events in corporates will harm their performance (Krüger, 2015). Through ESG disclosure, companies can effectively enhance the transparency, reduce the degree of corporate information asymmetry, and further enhance investors’ long-term investment interests in companies (Cui et al., 2018). According to the signal theory, the active disclosure of information by listed companies reflects their ability of operation, which clearly sending positive signals to the capital market. Also, through ESG information disclosure, corporates can effectively built their reputation among relevant stakeholder groups, and release their strategic intentions for sustainable development to the outside world (Jeffrey et al., 2019). In addition, ESG activities can also improve the organizational and management capabilities of corporates. Companies with better ESGP are also more attractive to employees, and employees have a higher sense of identity and belonging to that company (Weber, 2014; Huang, 2021). The research of Zhu and Tan, (2022) shows that ESG rating can significantly improve the green innovation ability of corporates by reducing financing constraints and improving managers’ environmental awareness (Ali et al., 2022; Hussain et al., 2022). Therefore, this leads us to the first hypotheses as follows:
Hypothesis 1:. There is a negative relationship between ESGP and corporate performance.
2.2 ESG and corporate financial risk
The impact of ESG on corporate financial risks can be mainly explained via corporate governance and financing capacity. On one hand, the ESG governance concept can promote the dispersion of corporate stock equity and gender balance in management, and diversifying corporate equity can effectively improve the risk-taking level of the company (Faccio et al., 2011), and an excellent organizational structure can ensure scientific corporate decision-making. Meanwhile, management diversification can also improve corporate risk management. Companies led by male CEOs are usually willing to invest in projects with higher risks (Faccio et al., 2016), while a higher proportion of female board members can effectively promote the inhibitory effect of ESGP on corporate financial risks (Shakil, 2021). In addition, ESG disclosure by corporates can effectively reduce the risk of financial irregularities (Yuan et al., 2022). Corporates that attach importance to ESG activities can also reduce possible business contingencies, such as a lower probability of being prosecuted (Hong and Liskovich, 2015), a stronger adaptive capacity, and lower chance to face stock price crash (Andersson et al., 2012; Lins et al., 2017; Broadstock et al., 2020).
On the other hand, improving their ESGP, corporates can effectively enhance their attractiveness in the capital market. Higher ESGP would lead to lower both corporate equity financing costs (El Ghoul et al., 2011) and debt financing cost (Raimo et al., 2021). Due to the environmental protection and green financial concept, banks are more inclined to issue loans to corporates that disclose CSR information (Xu et al., 2021; Fu et al., 2022), the quality of non-financial information disclosed by corporates is positively correlated with the actual value of corporates. Also, considering the legitimacy of corporates (Hong and Kacperczyk, 2009), especially in European and American capital markets, institutional investors are keener to invest in companies with better CSR performance (Graves and Waddock, 1994; Mahoney and Roberts, 2007). Moreover, corporates’ participation in ESG activities is positively related to the issuance of green bonds and their own credit ratings (Flammer, 2021). The less attention a corporate pays to ecological protection, the lower its credit rating will be, and the higher its debt financing cost will be (Zerbib, 2019). This leads us to the second hypothesis:
Hypothesis 2:. Financial risk mediates the relation between ESGP and corporate performance.
2.3 ESG, financial risk, corporate performance, and firm life cycle
The firm life cycle theory holds that for corporates in different life cycle stages, their environment, structure, strategy formulation, and decision-making methods are different (Miller and Friesen, 1984; Adizes, 1990; Dickinson, 2011). With their continuous development, corporates’ earning capacity gradually decreases, while the probability of business changes gradually increases (Lev and Zarowin, 1999). There are more than 20 definitions and determinants standards of firm life cycle now (Miller and Friesen, 1984; Adizes, 1990), scholars such as Drazin and Kazanjian. (1990) believe that using three-level (growth, maturity, and decline) or four-level (start-up, growth, maturity, and decline) classification criteria can more accurately measure the life cycle of a corporate (Drazin and Kazanjian, 1990). For the listed corporates, the start-up stage is usually combined with the growth stage, and therefore they go through only three stages: growth, maturity, and decline. Considering the distribution hypothesis problems caused by using the single indicator method and comprehensive indicator method, as well as the possible errors caused by profitability indicators (Spence, 1981; Wernerfelt, 1985; Anthony and Ramesh, 1992), Dickinson (2011) adopts operating cash flow, investment cash flow, and financing cash flow to comprehensively judge the firm life cycle perspective (Dickinson, 2011). As a vital issue in corporates’ current long-term development strategy, ESG also requires a detailed analysis of different life cycles (Anthony and Ramesh, 1992).
There are few studies on the ESGP of growing companies. Although growing corporates have the advantages of higher development flexibility and faster operating income growth, meanwhile, their low market negotiation ability and low policy influence also limit their development. Due to the lack of a sound management mechanism and resources, corporations in the growth and growth stages focus more on solving current development problems and rarely take the initiative to fulfill corporate social responsibility (Retolaza et al., 2009). On the other hand, Desa and Basu’s research shows that obtaining financing is critical for corporates in the growth stage to grow and develop (Desa and Basu, 2013). Corporates in the growth stage have a higher degree of information asymmetry in the capital market due to their novel technology or profitability model, making it more difficult to raise external financing (Vogt, 1994), and making ESG disclosures can enhance investors’ interest in the Corporates, which in turn can lead to a relatively stable financial position.
Corporates at maturity stage have the characteristics of large production scale and diversified business scope, and have already occupied a certain position in the market (Edwards, 1955; Hoskisson et al., 1993). Compared with growth stage companies, mature companies are usually under more pressure from society and need to improve their legitimacy by disclosing non-financial information (Dorfleitner et al., 2015; Drempetic et al., 2020). At the same time, mature companies are more willing to invest capital in ESG activities to obtain long-term benefits in the future. Research by Drempetic et al. (2020) also shows that firm size is positively correlated with firm ESGP (Drempetic et al., 2020). However, according to the free cash flow theory, mature companies are prone to over-investment when their financial conditions are relatively relaxed (Jensen, 1986; Triantis, 1994; Saravia, 2014), and the ESG disclosure of corporates may alleviate the agency problem faced by mature corporates.
Corporates in the decline stage usually experience a decrease in sales and a decline in market share. Due to the lack of new profit growth points, corporate cash flow shrinks. Compared with companies in the growth and mature stages, companies in decline stage are more likely to face financial distress (Ang and Smedema, 2011). However, to find new profitability, companies in decline stage are urgently required to invest a lot of money to develop new products and conduct operational promotion (Mourdoukoutas and Stefanidis, 2021). The expanding capital demands on the expenditure side of corporates and the obstacles faced by the financing side will make them more cautious in choosing investment targets. ESG activities will bring greater capital pressure on them, and corporates facing increasing survival pressure may not be able to undertake social responsibilities.
In general, we believe that corporates have different business objectives and encounter different risks at different life cycle stages, the impact of ESG in different life cycle stages has not been fully discussed. Therefore, the following hypotheses are proposed in this paper:
Hypothesis 3a:. For corporates at the growth stage, financial risk cannot mediate the relation between ESGP and corporate performance.
Hypothesis 3b:. For corporates at the maturity stage, financial risk mediates the relation between ESGP and corporate performance.
Hypothesis 3c:. For corporates at the decline stage, financial risk cannot mediate the relation between ESGP and corporate performance.
3 Research design
3.1 Data collection
Based on data availability, this study uses the annual panel data of Chinese A-share listed companies from 2010 to 2020 as the study sample. Except for the Huazheng ESG data from the Wind database, we obtain all other financial data from China Stock Market & Accounting Research database (CSMAR). To ensure the validity of data, samples are screened according to the following principles: (1) samples of corporates with irregular transactions were excluded; (2) samples of corporates in the financial industry and real estate industry are excluded; (3) samples of corporates with asset-liability ratio greater than 1 were excluded; (4) samples with missing values on regression variables were excluded. Therefore, a total of 11,742 firm-year observations for 1,486 firms were finally obtained. In addition, to reduce the influence of outliers on the empirical results, all continuous variables in the paper are winsorized at the 1% and 99% quantiles.
3.2 Measurements
3.2.1 Corporate performance
Table 1 shows the definition of all variables in this study. Following previous study, we use Tobin’s Q ratio as the proxy to measure corporate performance (Uotila et al., 2009; Horváthová, 2010). Tobin’s Q ratio reflects the investor-to-business comprehensive evaluation of development prospects. Since stock market value changes are forward-looking and relatively difficult to be controlled by managers, Tobin’s Q index, based on market expectations, is robust in measuring corporate performance.

TABLE 1. Definition of variable.
3.2.2 ESGP
In this study, we use the Huazheng ESG rating index to measure the ESGP of Chinese list corporates. Huazheng ESG rating system is one of the widely used ESG rating systems during academic research and for investing in China. Compared with other Chinese ESG rating systems, the Huazheng ESG rating has the advantages of wide coverage, early rating time, and high update frequency. By collecting data from various sources such as social responsibility reports, ESG reports, regulatory websites, and media information, Huazheng has divided the ESGP of Chinese corporates into 9 grades from C to AAA, and we assigned the 9 grades of C ∼ AAA as 1–9 in order in the empirical test of this study.
3.2.3 Corporate financial risk
We use the Altman Z-Score (Z-Score) calculated based on accounting data proposed by Altman (1,698)as a proxy to quantify the corporate financial risk (Altman, 1968). The Z-Score are widely used in the assessment of corporate financial risk of listed companies (Laeven and Levine, 2009; Gang et al., 2019). The smaller the Z-score of the sample firms, the greater the financial risk of the firms, and conversely the smaller the financial risk. The Z-Score model for public firms is as follows:
Z = 1.2 (Working capital/Total assets) +1.4 (Retained earnings/Total assets) +3.3 (EBIT/Total assets) +0.6 (Market value of equity/Book value of total liabilities) +0.999 (Sales/Total assets).
3.2.4 Firm life cycle
In this study, we use cash flow patterns developed by Dickinson, (2011), which utilize three cash flow types (operating, investing, financing) as a proxy to divide the firm life cycle into 5 stages, which are introduction, growth, mature, shake-out, and decline. Three cash flow types can take a positive or negative sign which results in 8 possible combinations, and each cash flow combinations represent the corporate status. For example, when a corporate with a negative operating cash flow, positive investment cash flow, and positive financing cash flow, that means the corporate relies on borrowing money to maintain production and operation, and its financial condition may have deteriorated, which belongs to the decline stage. In addition, considering that China’s A-share listed companies have passed the introduction stage, following previous research, this paper incorporated the introduction stage into the growth stage, meanwhile incorporating the shake-out stage into the decline stage, thus dividing the listed companies into three stages: growth stage, mature stage, and decline stage. The cash flow characteristics of each stage are shown in Table 2.

TABLE 2. Cash flow patterns of firm at different life cycle stages.
3.2.5 Control variables
The link between ESG and corporate performance may be influenced by several other variables that we need to control for. Following previous research, we included several control variables, which are related to corporate characteristics, financial status, and corporate governance, including (1) Size of firm (Size); (2) The nature of the corporate (SOE); (3) Age of firm (Age); (4) Leverage (Lev); (5) Growth of business (Grow); (6) Institutional investor shareholding ratio (INST); (7) Equity concentration (TTH). In addition, year-fixed effects and industry-fixed effects are added to the model.
3.3 Research methodology
To test the mediation effect of financial risk on the relationship between ESGP and corporate performance, this study refers to the approach provided by Baron and Kenny (1986), the following steps establishing the mediation test:
Firstly, we conduct the regression model between ESG and corporate performance below:
Secondly, we conduct the regression model between ESG and financial risk below:
Thirdly, we conduct the regression model between ESG、financial risk, and corporate performance below:
Moreover, for test moderate effect, we conduct the modified regression model below:
Among these formulas, the subscript t represents the year, i represents the corporate. This study focuses on the coefficient
4 Empirical result and discussion
4.1 Estimation method
We carry out F-test, unit root test (Fisher test), Wald and Wooldridge test on panel data respectively, and the results in Tables 3, 4 show that the data of sample has strong individual effect, autocorrelation, and heteroscedasticity. After the Hausman test on the data, we choose to use the fixed effect model to estimate the data, and use the company level clustering robust standard error to reduce the impact of the variance of the disturbance term on the empirical results.
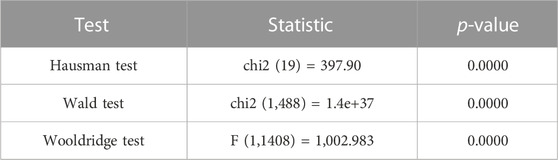
TABLE 3. Autocorrelation and heteroscedasticity test.
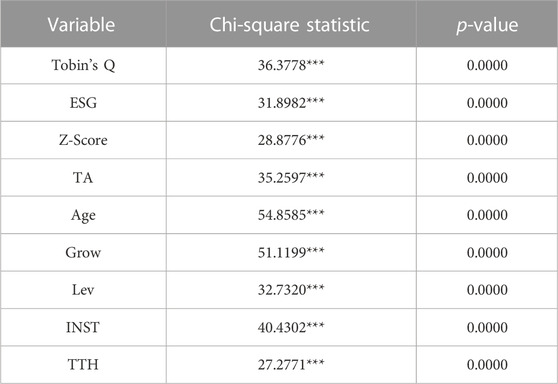
TABLE 4. Stability test.
4.2 Descriptive statistics
Table 5 reports the descriptive statistical results of the main variables. The Tobin’s Q mean value of the sample corporates is 2.295, the variance is 1.884, and the median is 1.747, indicating that the overall value level of the sample corporates in the financial market is high. The average ESG rating of the sample corporates is 6.299, the standard deviation is 1.057, and the median is 6, which proves that the ESG rating of the sample corporates is between BB-AA. At the same time, we divide the samples into three groups: growth stage, maturity stage, and decline stage according to the division standard of corporate life cycle stages, and test the significance of the mean difference between the groups on the main variables. As shown in Table 6, the ESG rating of corporates in the maturity stage is the highest, followed by the growth stage and the decline stage. Financial risk is significantly higher for corporates in the growth stage relative to corporates in the maturity and decline stages. In addition, corporates in the maturity and decline stages have higher corporate performance relative to corporates in the growth stage.
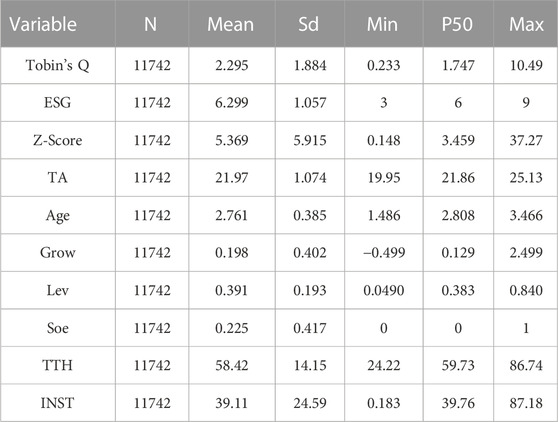
TABLE 5. Descriptive statistics.

TABLE 6. Descriptive statistics at different life cycle stages.
4.3 Analysis of main regression results
4.3.1 ESG and corporate performance
Table 7 shows the regression results between ESGP and corporate performance. Column (1) in Table 7 uses the full sample data for the regression formula, and columns (2), (3) and (4) use the data of three sub-samples: growth stage, maturity stage and decline stage. It can be seen from Table 7 that the regression coefficient between ESGP and corporate performance is 0.150 under the full sample data, and it is significant at 1% level. Thus, this result rejects Hypothesis 1, which shows that ESGP is positively relate to corporate performance, which is consistent with previous research (G Friede et al., 2015; Yu et al., 2018; Ali et al., 2019). In addition, the regression results of the models in columns (2) (3) and (4) show that the regression coefficients of ESGP and corporate performance of corporates in different life cycles are positive, and significant at 1% level. By further distinguishing the regression results of samples in different life cycle stages, it can be found that there is a significant positive correlation between ESGP and corporate performance in both growth, maturity, and decline stages of the firm, and the positive promotion of ESGP in the growth stage are the largest. Although growth corporates face high financing constraints and weak customer base (Basu and Parker, 2001; Wu et al., 2008), they are usually more innovative and flexible. Investors are more willing to provide financial support to growing corporates to make profits as soon as possible (Saravia, 2014). The ESGP of corporates in the growth stage enhances investors’ confidence in them (Hong and Kacperczyk, 2009), and the positive effect of ESGP on the financing ability of corporates is further amplified, which is consistent with the previous study results of Gangi et al., (2020).
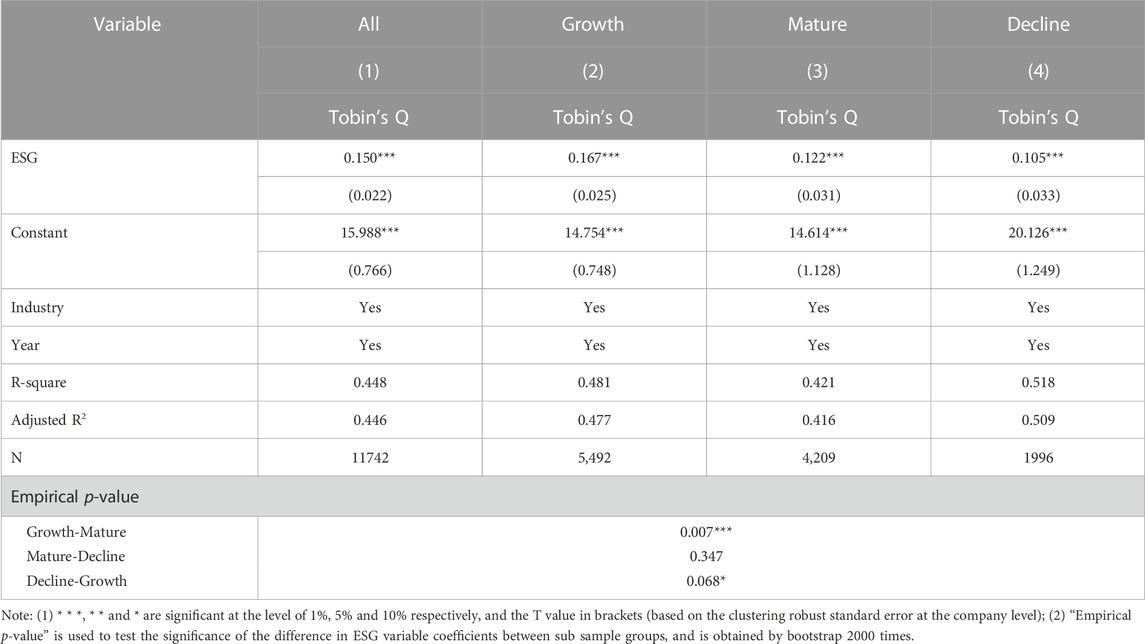
TABLE 7. Basic regression results.
4.3.2 The mediation effect of corporate financial risk
We refer to Baron and Kenny’s (1986) method to test the intermediary mechanism of corporate financial risk. Table 8 shows the regression results using the full sample data. The regression results in column (2) show that the regression coefficient of ESGP on corporate financial risk (Z-score) is 0.325, which is significantly positive at the 1% level, indicating that ESGP significantly reduces corporate financial risk. At the same time, in the regression results in column (3), the regression coefficient between corporate financial risk (Z-score) and corporate performance is significantly positive at 1% level, which indicates that reducing corporate financial risk has a positive effect on corporate performance. Since the regression coefficients of
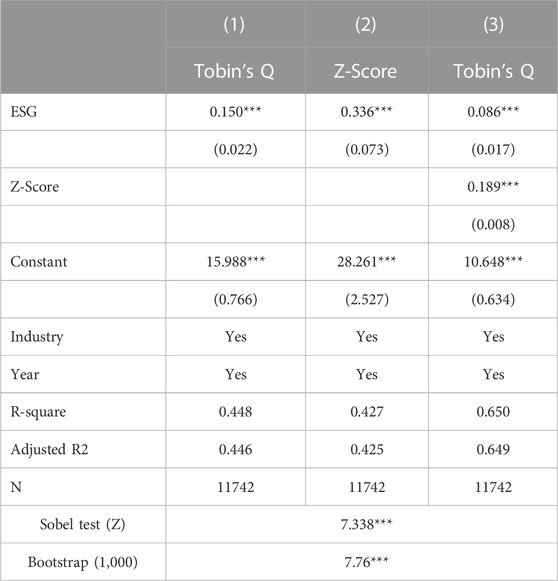
TABLE 8. The mediation effect of corporate financial risk.
4.3.3 The mediation effect of corporate financial risk in different life cycles
In this section, we test whether corporate financial risk can play a mediating role in the process of affecting corporate performance by ESGP under different life cycles. Table 9 presents the results of mediation test, only the coefficient of ESG and Z-Score in columns (8) is not significant. This shows that the mediating effect of corporate financial risk is only exist for the corporates at the growth and maturity stages, meanwhile, the results of the Sobel test and Bootstrap test also verify this conclusion, therefore Hypotheses 3b, Hypotheses 3C are accepted and Hypothesis 3a is rejected. The reason for this phenomenon may be that corporates in the decline stage are usually less competitive in the market (Loderer et al., 2017), and their reduced profitability leads to a deterioration of their financial situation (Roe, 2021), and investing the ESG project with poor short-term return rate of expenditure may elevate the financial pressure on corporates (Kim and Lyon, 2015; Bruna et al., 2022). Also, corporates in the decline stage usually do not conform to the investment propensity of institutional investors because of low efficiency, and the contribution of ESGP to the enhancement of their financing ability is diminished (Dahlquist and Robertsson, 2001; Cumming and Johan, 2010).
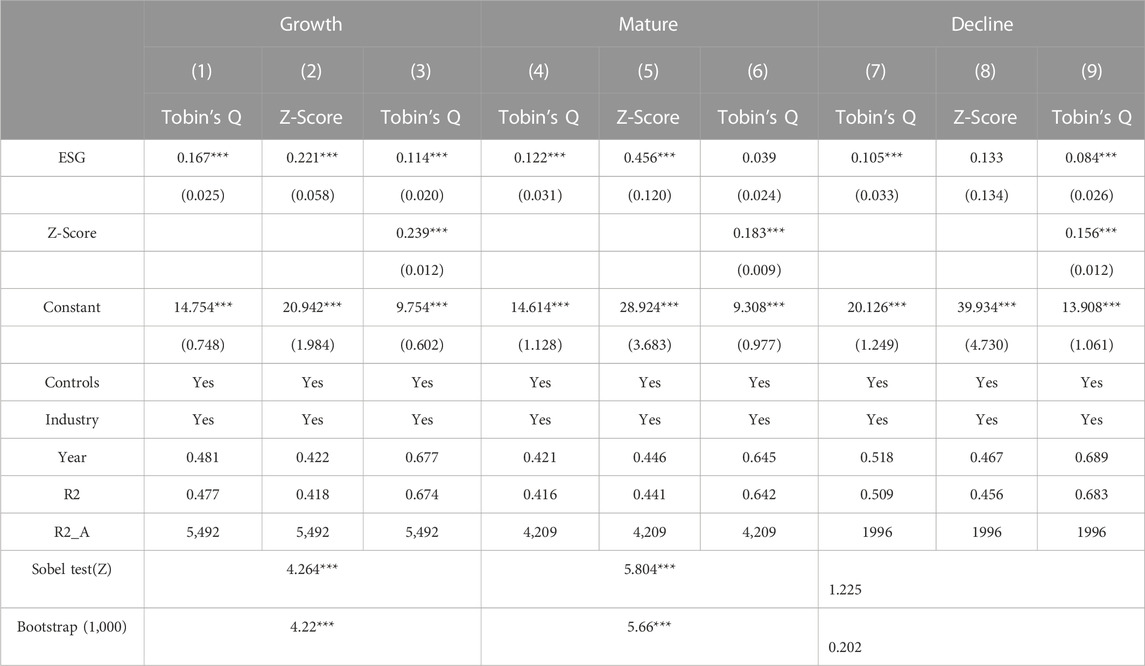
TABLE 9. The mediation effect of corporate financial risk in different life cycles stages.
4.3.4 Endogenous check
Further, we use lagged regression as well as an instrumental variable (IV) approach to avoid the bias from endogeneity.
Firstly, we regress independent variables by using one-, three-, and five-period lagged ESG variables to test the impact of changes in ESGP on a corporate’s future performance. Test results in Table 10 shows that there is a significant positive relationship between ESG lagged variables still and corporate performance, which is consistent with the benchmark regression. It indicates that corporate performance is affected by past ESGP and ESGP has a long-term contributory effect.
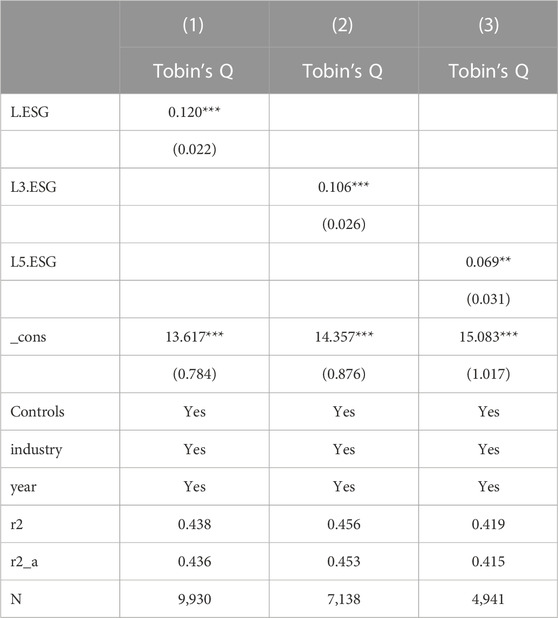
TABLE 10. Lagged effect results.
Secondly, high-performance corporate may have more disposable capital to invest in ESG activities, thereby causing a two-way causal problem. This paper according to the research by Benlemlih and Bitar, 2018, and uses the mean of ESG ratings of all listed firms within the province where the corporate is incorporated (ESG_IV1) and the mean of ESG ratings of firms in the same industry (ESG_IV2) as instrumental variables. The reasons for selecting both as instrumental variables are that: First, firms in close geographical proximity may be influenced by the same policies and regulations and develop similar ESG management preferences due to their similar economic, political, and competitive environments, however, the means of ESG rating of corporates across the province are not related to individual corporate performance; Second, corporates in the same industry have strong similarities in production and operation, and the industry own attributes affect the attitude of corporates in that industry toward ESG, but the means of ESG rating of all corporates in the industry are not related to the performance of individual corporate. Therefore, we use the two-stage least squares (2SLS) to test the instrumental variables ESG_IV1 and ESG_IV2. In Table 11, column (1) shows the first-stage regression results, and column (2) shows the second-stage regression results, which indicates that the hypothesis that instrumental variables are unidentified and weak instrumental variables can be rejected, and the instrumental variables are exogenous. Meanwhile, the regression results of the second stage show that ESGP is significantly positively correlated with corporate performance, which is consistent with the above conclusions.
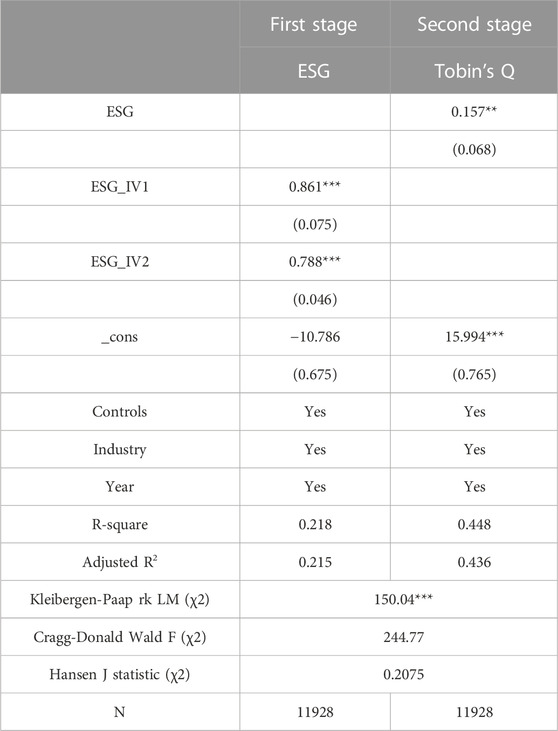
TABLE 11. Test results of IV.
4.3.5 Robustness check
We conduct two additional tests to improve the robustness of the obtained results. First, considering that there may be a misestimate in using a single indicator to reflect corporate performance, this part uses two corporate financial performance indicators: return on assets (ROA) and return on net assets (ROE), to replace Tobin’s Q as the measurement of corporate performance. The results in Table 12 show that the coefficients of ESG on ROA and ROE are significantly positive at the 1% level, indicating that ESGP can still improve corporate performance.
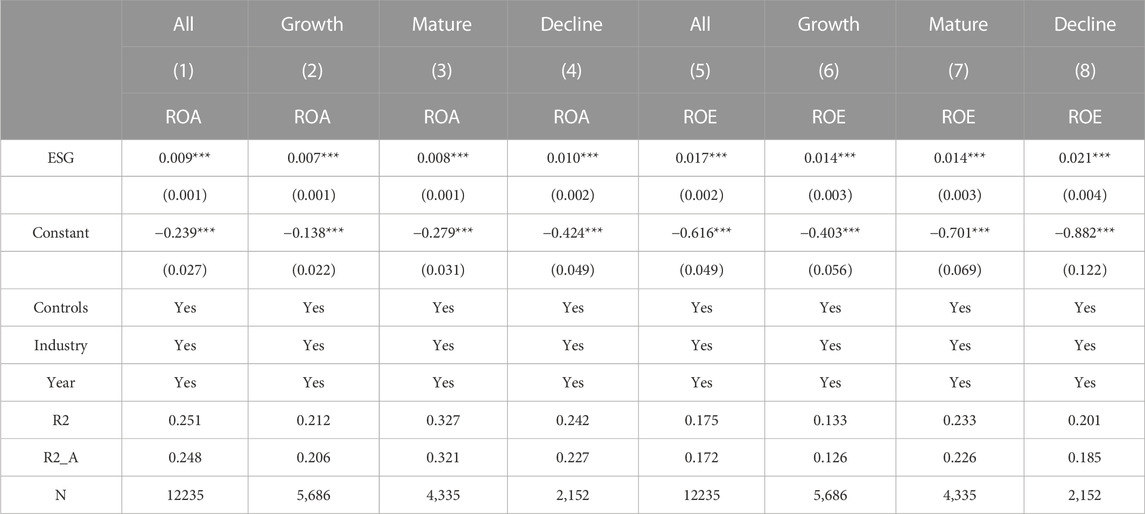
TABLE 12. Replacement of independent variables.
Second, to avoid the controversy of using a single agency to compile the index, we use the Rankins ESG rating (ESG_H) to measure the company’s ESGP. This rating system is widely used for CSR rating and ESG rating in China. It uses the nine-level evaluation index of C-AAA to measure the ESGP of Chinese A-share listed companies. We assign the rating results as 1-9 in turn. Table 13 reports the regression results between ESG_H and corporate performance at different firm life stages. Except for the recession stage (only 84 samples), the ESG_H coefficients of the regression of the whole sample and the sub-samples of the growth stage and the mature stage are significantly positive at least at the 5% level, which is consistent with the above conclusions too.
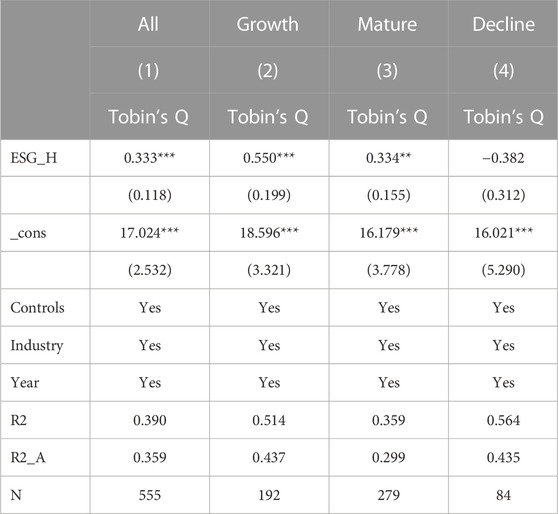
TABLE 13. Replacement of dependent variables.
5 Additional test
5.1 Analysis of non-linear relationship between ESG and corporate performance
To further explore the non-linear relationship between ESGP and corporate performance, this part adds the quadratic term (ESG2) of ESGP to formula (1) for regression. The Table 14 shows that the regression using the full sample data reveals that after adding the quadratic term, ESGP is still significantly positively correlated at 1% level. The coefficient on ESG2 is significantly positive at the 1% level, which indicates that there is a U-shaped relationship between ESG and corporate performance implying there is an extreme value for the promotion of corporate performance by ESG. When the ESG rating exceeds this extreme value, corporate performance increases more with the improvement of ESG rating. At the same time, columns (2), (3) and (4) show the regression results using different life cycle sub samples. The coefficients on ESG and ESG2 are least significant at the 5% level, which also proves that there is a non-linear relationship between ESGP and corporate performance at any stage of the firm life cycle.
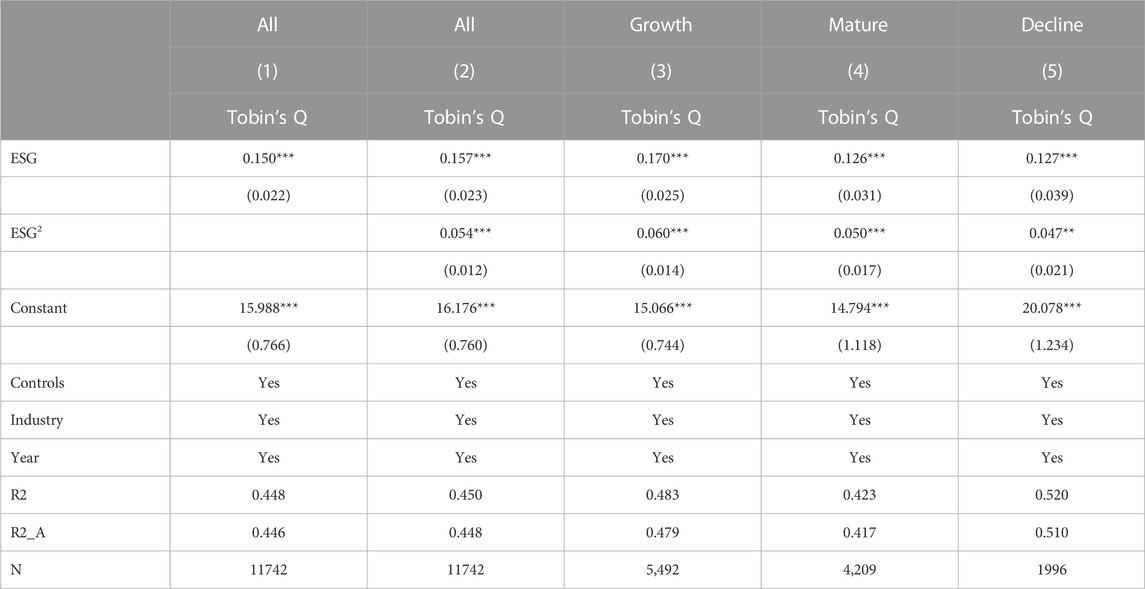
TABLE 14. Non-linear test results.
5.2 The moderate effect of corporate information disclosure quality
At present, Chinese corporates’ ESG ratings greatly rely on the corporates’ ESG and CSR reports disclosed by corporates themselves, meanwhile the China Securities Regulatory Commission (CSRC) has not yet issued a unified ESG information disclosure standard. Therefore, the quality of corporate information disclosure will greatly affect the trust of stakeholders in the ESG rating of corporates which then impacts the investment interest of investors. To test the moderate effect of the quality of corporate information disclosure, we use the four-grade rating index of the Shanghai Stock Exchange and Shenzhen Stock Exchange on the quality of information disclosure of listed companies as the proxy variable (DQ) of the quality of corporate information disclosure (A = excellent, B = good, C = pass, D = fail). Also, considering the heterogeneity of the firm life cycle, data of three sub samples of growth, maturity, and decline are used for regression. The results in Table 15 show that the higher the degree of truthful, accurate, complete, timely, and fair disclosure of information by listed companies, the more acceptable the ESGP by relevant stakeholders. Adequate corporate information transparency represents good internal management (Forker, 1992) and it also compensates for the disadvantaged position of investors due to information asymmetry (Luo et al., 2019). The higher the degree of investors’ trust in corporate ESG disclosure, the greater the improvement of ESGP on corporate performance.
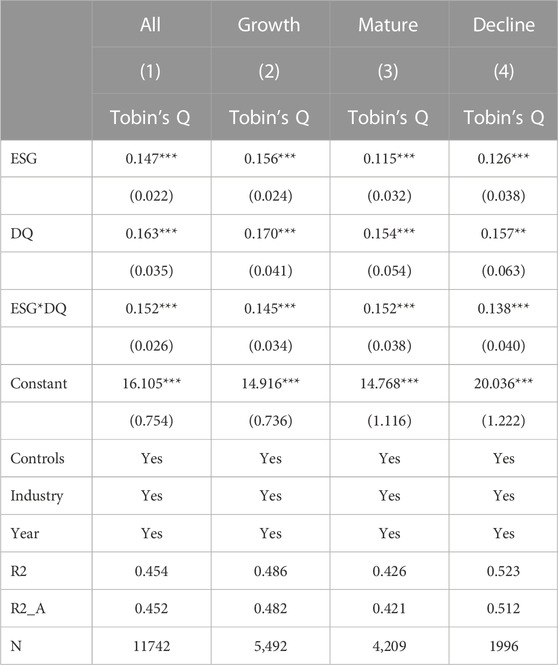
TABLE 15. The moderate effect of corporate information disclosure quality.
5.3 The moderate effect of corporate financial slack
Previous research has found that in the face of the complex and changeable external business environment, corporates often adopt conservative financial policies and retain certain excess financial resources to deal with risks (Guo et al., 2020). We use the equity liability ratio divided by the current ratio to measure the financial slack (Xiaofang, 2017). The degree of financial slack of a corporate reflects its financial flexibility, which is the ability of a corporate to meet its capital needs with low risk. Table 16 shows that the coefficient of the interaction term (ESG*FS) between ESG and financial slack in the full sample regression is significantly negative, which indicates that the impact of corporate financial slack on the relationship between ESG and corporate performance has a significant negative moderate effect. In other words, for corporates with low financial freedom and weak ability to meet their own capital needs, ESG has a greater role in promoting corporate performance. ESG can effectively improve the ability of corporates with low financial freedom to raise funds from outside, thus reducing the dependence of corporates on internal financing. Further distinguishing between different life cycle stages, for the mature corporates, financial slack has a significant negative moderate effect which might imply that although mature corporates have a strong ability to obtain capital (Brody and Ehrlich, 1998), excessive levels of corporate financial flexibility lead to slack management and increased agency costs (Triantis, 2000). However, at the growth and decline stages, the situation of high financing constraints and poor financial liquidity, corporates be compelled to execute relatively conservative financial policies to keep redundant financial resources which can buffer the risks caused by sudden changes in the external environment.
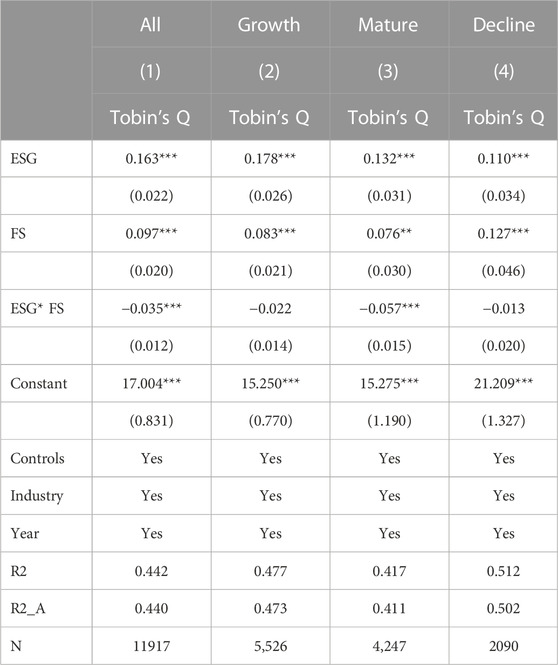
TABLE 16. The moderate effect of corporate financial slack.
5.4 The moderate effect of environmental uncertainty
Previous studies have shown that business strategies are closely related to the market environment in which the corporate is operate (Ward and Lewandowska, 2008). When the business environment is order and stable, the corporate is usually better able to confirm the current market situation and make correct business decisions. Otherwise, the corporate will pay more adaptation cost. We use the fluctuation of corporate sales as the proxy of environmental uncertainty (EU), which is the standard deviation of the sales revenue of the sample corporates in the past five years after excluding the normal growth part and industry adjustment (Ghosh and Olsen, 2009; Shen and Yu Peng, 2012). The higher the EU value, the stronger the environmental uncertainty faced by the corporate. Table 17 shows that environmental uncertainty has a significant weakening and restraining effect on the impact of ESG on corporate performance. For corporates with low operating environment uncertainty, ESG has a greater role in promoting corporate performance. This indicates that when the business environment is uncertain, the competition among corporates is more intense, which makes them reduce their investment in ESG, loosening the close connection between the corporate and relevant stakeholders, which eventually affects the corporate performance. On the contrary, when the business environment is stable, the competitive pressure on the corporate is less, and has the spare power to invest in the ESG field to improve the corporate image. For growth stage corporates, due to the higher flexibility in business strategies, corporate can better adjust the direction of operation in complex business environments.
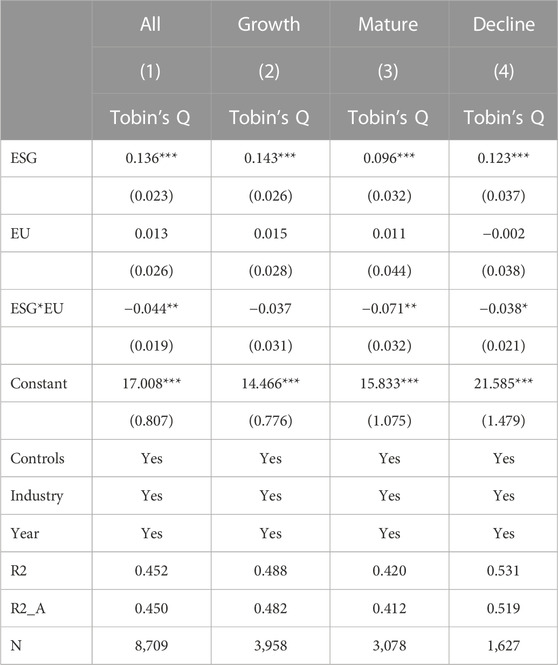
TABLE 17. The moderate effect of environmental uncertainty.
6 Conclusion
Under the comprehensive green and low-carbon transformation, Chinese corporates’ promotion of ESG construction is one of the most vital ways to achieve high-quality and sustainable development. Based on firm life-cycle perspective, and using the data of 1,486 Chinese A-share listed companies from 2010 to 2020, we analyze the dynamic relationship among ESGP, corporate financial risk, and corporate performance at different life cycle stages, and consider the moderating effect of internal and external factors. The results of the study passed the robustness test (substitution variable method) and endogenous test (lagged regression and IV method).
Overall, this finding provides several contributions to the literature. First, this study diverse the economic consequences of ESGP literature with firm life cycle theory, which provides new evidence to support ESGP on promoting corporate performance in both growth, mature, and decline stages. But we also find that, for the corporate at the decline stage, investing in ESG activities or ESG practices might take up internal resources and increase financial pressure. Second, this study focuses on the economic consequences of Chinese corporates’ ESGP, which enriches the research on ESGP in developing countries. Third, this paper also analyzes the heterogeneity of corporate ESGP with different internal and external conditions, including the extent of information disclosure quality, financial slack, and environmental uncertainty, which extend the strands of ESG literature.
This study also offers several practical implications. First, this study provides evidence of shift in business managers’ view of ESG, establishes ESG awareness in the early stage of development, and then realizes “profit with meaning”. Second, the regulatory authorities should strengthen the guidance on the ESG practice and information disclosure of corporates. While further improving the ESG disclosure system of listed companies, regulators should also launch the ESG information disclosure management opinions of SMEs, thereby cultivating the concept of sustainable development at the initial stage of corporate construction. Third, investors should establish a sustainable investment philosophy as early as possible, compared with financial return, the performance for corporate fulfillment of consumer, environmental and social responsibilities is supposed to have a greater proportion of impact on the investment decisions making. Especially for the growth corporates with a high information asymmetry, ESGP could show the potential for the development of corporates in the capital market.
This study also has some limitations. First, this paper uses the Huazheng ESG rating to measure the ESG performance of corporates, although this study has conducted robustness tests with Rankins ESG rating, there still exists rating divergence from different rating agencies on the same corporate. In future research, we will further consider the moderating effect of ESG rating divergence on ESG rating. Second, considering the difficulties of data collection, this paper chooses China’s A-share listed companies as the research samples, the empirical results may nevertheless be affected by selection bias. Therefore, it is necessary to expand the study samples to SMEs, and further explore the ESG cognition, performance, and economic consequences of SMEs.
Data availability statement
The data analyzed in this study is subject to the following licenses/restrictions: This data that support the findings of this study are available from the corresponding author upon reasonable request. Requests to access these datasets should be directed to Shang Gao, MTkwODc2NTk3NUBxcS5jb20=.
Author contributions
SG: Conceptualization, Methodology, Writing—Original Draft FM: Supervision, Funding acquisition WW: Data Curation WC: Software.
Funding
This research is financially supported by National Natural Science Foundation of China (Grant. 71972013) and Educational Commission of Guangdong Province, China (Grant. 2022WCXTD022).
Conflict of interest
The authors declare that the research was conducted in the absence of any commercial or financial relationships that could be construed as a potential conflict of interest.
Publisher’s note
All claims expressed in this article are solely those of the authors and do not necessarily represent those of their affiliated organizations, or those of the publisher, the editors and the reviewers. Any product that may be evaluated in this article, or claim that may be made by its manufacturer, is not guaranteed or endorsed by the publisher.
References
Adizes, I. (1990). Corporate lifecycles: How and why corporations grow and die and what to do about it. Hoboken, New Jersey, U.S: Prentice-Hall.
Adizes, I. (1979). Organizational passages-Diagnosing and treating lifecycle problems of organizations. Organ. Dyn. 8 (1), 3–25. doi:10.1016/0090-2616(79)90001-9
Ali, S., Jiang, J., Ahmad, M., Usman, O., and Ahmed, Z. (2022). A path towards carbon mitigation amidst economic policy uncertainty in BRICS: An advanced panel analysis. Environ. Sci. Pollut. Res. 29 (41), 62579–62591. doi:10.1007/s11356-022-20004-8
Ali, S., Zhang, J., Usman, M., Khan, F. U., Ikram, A., and Anwar, B. (2019). Sub-national institutional contingencies and corporate social responsibility performance: Evidence from China. Sustainability 11 (19), 5478. doi:10.3390/su11195478
Altman, E. I. (1968). Financial ratios, discriminant analysis and the prediction of corporate bankruptcy. J. Finance 23 (4), 589–609. doi:10.1111/j.1540-6261.1968.tb00843.x
Andersson, M., Baltzopoulos, A., and Lööf, H. (2012). R&D strategies and entrepreneurial spawning. Res. Policy 41 (1), 54–68. doi:10.1016/j.respol.2011.08.005
Ang, J., and Smedema, A. (2011). Financial flexibility: Do firms prepare for recession? J. Corp. Finance 17 (3), 774–787. doi:10.1016/j.jcorpfin.2011.02.001
Anthony, J. H., and Ramesh, K. (1992). Association between accounting performance measures and stock prices: A test of the life cycle hypothesis. J. Account. Econ. 15 (2–3), 203–227. doi:10.1016/0165-4101(92)90018-w
Atif, M., Liu, B., and Nadarajah, S. (2022). The effect of corporate environmental, social and governance disclosure on cash holdings: Life-cycle perspective. Bus. Strategy Environ. 31, 2193–2212. doi:10.1002/bse.3016
Baron, R. M., and Kenny, D. A. (1986). The moderator-mediator variable distinction in social psychological research: Conceptual, strategic, and statistical considerations. J. Personality Soc. Psychol. 51 (6), 1173–1182. doi:10.1037/0022-3514.51.6.1173
Basu, A., and Parker, S. C. (2001). Family finance and new business start-ups. Oxf. Bull. Econ. Statistics 63 (3), 333–358. doi:10.1111/1468-0084.00224
Benlemlih, M., and Bitar, M. (2018). Corporate social responsibility and investment efficiency. J. Bus. Ethics 148 (3), 647–671. doi:10.1007/s10551-016-3020-2
Broadstock, D. C., Chan, K., Cheng, L. T. W., and Wang, X. (2021). The role of ESG performance during times of financial crisis: Evidence from COVID-19 in China. Finance Res. Lett. 38, 101716. doi:10.1016/j.frl.2020.101716
Brody, P., and Ehrlich, D. (1998). Can big companies become successful venture capitalists? New York: The McKinsey Quarterly, McKinsey & Company, Inc., 50.
Bruna, M. G., Loprevite, S., Raucci, D., Ricca, B., and Rupo, D. (2022). Investigating the marginal impact of ESG results on corporate financial performance. Finance Res. Lett. 47, 102828. doi:10.1016/j.frl.2022.102828
Cui, J., Jo, H., and Na, H. (2018). Does corporate social responsibility affect information asymmetry? J. Bus. Ethics 148 (3), 549–572. doi:10.1007/s10551-015-3003-8
Cui, Y., and Liu, B. (2018). Manufacturing servitisation and duration of exports in China. World Econ. 41 (6), 1695–1721. doi:10.1111/twec.12614
Cumming, D., and Johan, S. (2010). Venture capital investment duration. J. Small Bus. Manag. 48 (2), 228–257. doi:10.1111/j.1540-627x.2010.00293.x
Dahlquist, M., and Robertsson, G. (2001). Direct foreign ownership, institutional investors, and firm characteristics. J. Financial Econ. 59 (3), 413–440. doi:10.1016/s0304-405x(00)00092-1
Desa, G., and Basu, S. (2013). Optimization or bricolage? Overcoming resource constraints in global social entrepreneurship. Strategic Entrepreneursh. J. 7 (1), 26–49. doi:10.1002/sej.1150
Dickinson, V. (2011). Cash flow patterns as a proxy for firm life cycle. Account. Rev. 86, 1969–1994. doi:10.2139/ssrn.1268509
Dorfleitner, G., Halbritter, G., and Nguyen, M. (2015). Measuring the level and risk of corporate responsibility - an empirical comparison of different ESG rating approaches. J. Asset Manag. 16 (7), 450–466. doi:10.1057/jam.2015.31
Drazin, R., and Kazanjian, R. K. (1990). A reanalysis of miller and friesen's life cycle data. Strat. Mgmt. J. 11 (4), 319–325. doi:10.1002/smj.4250110407
Drempetic, S., Klein, C., and Zwergel, B. (2020). The influence of firm size on the ESG score: Corporate sustainability ratings under review. J. Bus. Ethics 167 (2), 333–360. doi:10.1007/s10551-019-04164-1
Edwards, C. D. (1955). Conglomerate bigness as a source of power”, business Concentration and price policy. New Jersey, United States: Princeton University Press, 331–359.
El Ghoul, S., Guedhami, O., Kwok, C. C. Y., and Mishra, D. R. (2011). Does corporate social responsibility affect the cost of capital? J. Bank. Finance 35 (9), 2388–2406. doi:10.1016/j.jbankfin.2011.02.007
Faccio, M., Marchica, M.-T., and Mura, R. (2016). CEO gender, corporate risk-taking, and the efficiency of capital allocation. J. Corp. Finance 39, 193–209. doi:10.1016/j.jcorpfin.2016.02.008
Faccio, M., Marchica, M.-T., and Mura, R. (2011). Large shareholder diversification and corporate risk-taking. Rev. Financ. Stud. 24 (11), 3601–3641. doi:10.1093/rfs/hhr065
Flammer, C. (2021). Corporate green bonds. J. Financial Econ. 142 (2), 499–516. doi:10.1016/j.jfineco.2021.01.010
Forker, J. J. (1992). Corporate governance and disclosure quality. Account. Bus. Res. 22 (86), 111–124. doi:10.1080/00014788.1992.9729426
Friede, G., Busch, T., and Bassen, A. (2015). ESG and financial performance: Aggregated evidence from more than 2000 empirical studies. J. Sustain. Finance Invest. 5, 210–233. doi:10.1080/20430795.2015.1118917
Fu, W., Abbass, K., Niazi, A. A. K., Zhang, H., Basit, A., and Qazi, T. F. (2022). Assessment of sustainable green financial environment: The underlying structure of monetary seismic aftershocks of the COVID-19 pandemic. Environ. Sci. Pollut. Res. 2022, 0123456789. doi:10.1007/s11356-022-20178-1
Gang, H., Xiao, C., Xiao, Y., Yan, W., Bai, R., Ding, R., et al. (2019). Proteomic analysis of the reduction and resistance mechanisms of Shewanella oneidensis MR-1 under long-term hexavalent chromium stress. Environ. Int. 127, 94–102. doi:10.1016/j.envint.2019.03.016
Gangi, F., Meles, A., Monferrà, S., and Mustilli, M. (2020). Does corporate social responsibility help the survivorship of SMEs and large firms? Glob. Finance J. 43, 100402. doi:10.1016/j.gfj.2018.01.006
Gao, Y., and Han, K.-S. (2020). Managerial overconfidence, CSR and firm value. Asia-Pacific J. Account. Econ. 29, 1600–1618. doi:10.1080/16081625.2020.1830558
Ghosh, D., and Olsen, L. (2009). Environmental uncertainty and managers' use of discretionary accruals. Account. Organ. Soc. 34 (2), 188–205. doi:10.1016/j.aos.2008.07.001
Graves, S. B., and Waddock, S. A. (1994). Institutional owners and corporate social performance. Acad. Manag. J. 37 (4), 1034–1046. doi:10.2307/256611
Guo, F., Zou, B., Zhang, X., Bo, Q., and Li, K. (2020). Financial slack and firm performance of SMMEs in China: Moderating effects of government subsidies and market-supporting institutions. Int. J. Prod. Econ. 223, 107530. doi:10.1016/j.ijpe.2019.107530
Hong, H., and Kacperczyk, M. (2009). The price of sin: The effects of social norms on markets. J. Financial Econ. 93 (1), 15–36. doi:10.1016/j.jfineco.2008.09.001
Hong, H., and Liskovich, I. (2015). Crime, punishment and the halo effect of corporate social responsibility. National Bureau of Economic Research. doi:10.2139/ssrn.2492202
Horváthová, E. (2010). Does environmental performance affect financial performance? A meta-analysis. Ecol. Econ. 70 (1), 52–59. doi:10.1016/j.ecolecon.2010.04.004
Hoskisson, R. E., Hitt, M. A., and Hill, C. W. L. (1993). Managerial incentives and investment in R&D in large multiproduct firmsOrganization Science. Organ. Sci. 4 (2), 325–341. doi:10.1287/orsc.4.2.325
Huang, D. Z. X. (2021). Environmental, social and governance (ESG) activity and firm performance: A review and consolidation. Acc. Finance 61 (1), 335–360. doi:10.1111/acfi.12569
Hussain, Y., Abbass, K., Usman, M., Rehan, M., and Asif, M. (2022). Exploring the mediating role of environmental strategy, green innovations, and transformational leadership: The impact of corporate social responsibility on environmental performance. Environ. Sci. Pollut. Res. 29 (51), 76864–76880. doi:10.1007/s11356-022-20922-7
Jawahar, I. M., and Mclaughlin, G. L. (2001). Toward a descriptive stakeholder theory: An organizational life cycle approach. Amr 26 (3), 397–414. doi:10.5465/amr.2001.4845803
Jeffrey, S., Rosenberg, S., and McCabe, B. (2019). Corporate social responsibility behaviors and corporate reputation. Srj 15 (3), 395–408. doi:10.1108/srj-11-2017-0255
Jensen, M. C. (1986). Agency costs of free cash flow, corporate finance, and takeovers. Am. Econ. Rev. 76 (2), 323–329.
Kim, E.-H., and Lyon, T. P. (2015). Greenwash vs. brownwash: Exaggeration and undue modesty in corporate sustainability disclosure. Organ. Sci. 26 (3), 705–723. doi:10.1287/orsc.2014.0949
Krüger, F. (2015). Corporate storytelling: Theorie und empirie narrativer public relations in der unternehmenskommunikation. Berlin, Germany: Springer-Verlag.
Laeven, L., and Levine, R. (2009). Bank governance, regulation and risk taking. J. Financial Econ. 93 (2), 259–275. doi:10.1016/j.jfineco.2008.09.003
Lev, B., and Zarowin, P. (1999). The boundaries of financial reporting and how to extend them. J. Account. Res. 37 (2), 353–385. doi:10.2307/2491413
Lins, K. V., Servaes, H., and Tamayo, A. (2017). Social capital, trust, and firm performance: The value of corporate social responsibility during the financial crisis. J. Finance 72 (4), 1785–1824. doi:10.1111/jofi.12505
Loderer, C., Stulz, R., and Waelchli, U. (2017). Firm rigidities and the decline in growth opportunities. Manag. Sci. 63 (9), 3000–3020. doi:10.1287/mnsc.2016.2478
Luo, W., Guo, X., Zhong, S., and Wang, J. (2019). Environmental information disclosure quality, media attention and debt financing costs: Evidence from Chinese heavy polluting listed companies. J. Clean. Prod. 231, 268–277. doi:10.1016/j.jclepro.2019.05.237
Mahoney, L., and Roberts, R. W. (2007). Corporate social performance, financial performance and institutional ownership in Canadian firms. Account. Forum 31, 233–253. doi:10.1016/j.accfor.2007.05.001
Mallinckrodt, B., Abraham, W. T., Wei, M., and Russell, D. W. (2006). Advances in testing the statistical significance of mediation effects. J. Couns. Psychol. 53 (3), 372–378. doi:10.1037/0022-0167.53.3.372
Miller, D., and Friesen, P. H. (1984). A longitudinal study of the corporate life cycle. Manag. Sci. 30 (10), 1161–1183. doi:10.1287/mnsc.30.10.1161
Mourdoukoutas, P., and Stefanidis, A. (2021). Why companies succeed or fail: Corporate cycles and firm function in tandem. J. Bus. Strategy. doi:10.1108/jbs-09-2021-0164
Raimo, N., Caragnano, A., Zito, M., Vitolla, F., and Mariani, M. (2021). Extending the benefits of ESG disclosure: The effect on the cost of debt financing. Corp. Soc. Responsib. Env. 28 (4), 1412–1421. doi:10.1002/csr.2134
Retolaza, J. L., Ruiz, M., and San-Jose, L. (2009). CSR in business start-ups: An application method for stakeholder engagement. Corp. Soc. Responsib. Environ. Mgmt 16 (6), 324–336. doi:10.1002/csr.191
Roe, M. J. (2021). Corporate purpose and corporate competition. Wash. UL Rev. 99, 223. doi:10.2139/ssrn.3817788
Saravia, J. A. (2014). The lifecycle of the firm, corporate governance and investment performance. Corp. Ownersh. Control 11 (2), 224–238. doi:10.22495/cocv11i2c1p6
Shakil, M. H. (2021). Environmental, social and governance performance and financial risk: Moderating role of ESG controversies and board gender diversity. Resour. Policy 72, 102144. doi:10.1016/j.resourpol.2021.102144
Shen, H., and Yu Peng, W. L. (2012). State ownership, environmental uncertainty and investment efficiency. Econ. Res. 07, 114–127.
Siew, R. Y. J., Balatbat, M. C. A., and Carmichael, D. G. (2016). The impact of ESG disclosures and institutional ownership on market information asymmetry. Asia-Pacific J. Account. Econ. 23 (4), 432–448. doi:10.1080/16081625.2016.1170100
Skarmeas, D., and Leonidou, C. N. (2013). When consumers doubt, watch out! the role of CSR skepticism. J. Bus. Res. 66 (10), 1831–1838. doi:10.1016/j.jbusres.2013.02.004
Sobel, M. E. (1982). Asymptotic confidence intervals for indirect effects in structural equation models. Sociol. Methodol. 13, 290–312. doi:10.2307/270723
Spence, A. M. (1981). The learning curve and competition. Bell J. Econ. 12, 49–70. doi:10.2307/3003508
Triantis, G. G. (1994). A free-cash-flow theory of secured debt and creditor priorities. Va. Law Rev. 80, 2155–2168. doi:10.2307/1073555
Triantis, G. G. (2000). Financial slack policy and the laws of secured transactions. J. Leg. Stud. 29 (1), 35–69. doi:10.1086/468063
Uotila, J., Maula, M., Keil, T., and Zahra, S. A. (2009). Exploration, exploitation, and financial performance: Analysis of S&P 500 corporations. Strat. Mgmt. J. 30 (2), 221–231. doi:10.1002/smj.738
Vogt, S. C. (1994). The cash flow/investment relationship: Evidence from U.S. Manufacturing firms. Financ. Manag. 23, 3–20. doi:10.2307/3665735
Ward, S., and Lewandowska, A. (2008). Is the marketing concept always necessary? The effectiveness of customer, competitor and societal strategies in business environment types. Eur. J. Mark. 42, 222. doi:10.1108/03090560810840989
Weber, O. (2014). Environmental, social and governance reporting in China. Bus. Strat. Env. 23 (5), 303–317. doi:10.1002/bse.1785
Wernerfelt, B. (1985). The dynamics of prices and market shares over the product life cycle. Manag. Sci. 31 (8), 928–939. doi:10.1287/mnsc.31.8.928
Wu, J., Song, J., and Zeng, C. (2008). An empirical evidence of small business financing in China. Manag. Res. News 31 (12), 959–975. doi:10.1108/01409170810920666
Xiaofang, B. (2017). Government Subsidies,Financial slack and ambidextrous innovation. Account. Res. 01, 46–52+95.
Xu, H., Xu, X., and Yu, J. (2021). The impact of mandatory CSR disclosure on the cost of debt financing: Evidence from China. Emerg. Mark. Finance Trade 57 (8), 2191–2205. doi:10.1080/1540496x.2019.1657401
Yu, E. P.-Y., Guo, C. Q., and Luu, B. V. (2018). Environmental, social and governance transparency and firm value. Bus. Strat. Env. 27 (7), 987–1004. doi:10.1002/bse.2047
Yuan, X., Li, Z., Xu, J., and Shang, L. (2022). ESG disclosure and corporate financial irregularities - evidence from Chinese listed firms. J. Clean. Prod. 332, 129992. doi:10.1016/j.jclepro.2021.129992
Zerbib, O. D. (2019). The effect of pro-environmental preferences on bond prices: Evidence from green bonds. J. Bank. Finance 98, 39–60. doi:10.1016/j.jbankfin.2018.10.012
Keywords: ESG, CSR, firm life cycle, financial risk, corporate performance
Citation: Gao S, Meng F, Wang W and Chen W (2023) Does ESG always improve corporate performance? Evidence from firm life cycle perspective. Front. Environ. Sci. 11:1105077. doi: 10.3389/fenvs.2023.1105077
Received: 23 November 2022; Accepted: 18 January 2023;
Published: 30 January 2023.
Edited by:
Shigeyuki Hamori, Kobe University, JapanReviewed by:
Shahid Ali, Nanjing University of Information Science and Technology, ChinaUzma Bashir, National University of Modern Languages, Pakistan
Copyright © 2023 Gao, Meng, Wang and Chen. This is an open-access article distributed under the terms of the Creative Commons Attribution License (CC BY). The use, distribution or reproduction in other forums is permitted, provided the original author(s) and the copyright owner(s) are credited and that the original publication in this journal is cited, in accordance with accepted academic practice. No use, distribution or reproduction is permitted which does not comply with these terms.
*Correspondence: Shang Gao, MTkwODc2NTk3NUBxcS5jb20=; Fanchen Meng, bWVuZ0BiaXQuZWR1LmNu