 Yiran Yan
 Xingping Wang1*
- 1School of Architecture, Southeast University, Nanjing, China
- 2Key Laboratory of Spatial Intelligent Planning Technology, Ministry of Natural Resources, Shanghai, China
COVID-19 has driven the formation of regional supply chains. In addition, cities became the basic units of intra-regional supply chain organization under urban administrative economies. Based on the data mining of the buyer-supplier relationship of listed manufacturing firms, this study explores the spatial characteristics of city supply networks within Shandong by the indexes of degree centrality, closeness centrality, betweenness centrality, eigenvector centrality, and a community detection algorithm using the social network analysis (SNA) method and ArcGIS software. It investigates the influencing factors of city supply networks by the correlation and regression of the quadratic assignment procedure (QAP). The results show the following: 1) Shandong has formed a multi-center city supply network with Jinan, Qingdao, Yantai-Weihai, and the distribution pattern of city centrality measured by different centrality indicators shows differences. 2) Cities belonging to the same network community show a coexistence of spatial proximity and “enclave” distribution. 3) Geographic proximity, convenient transportation links, administrative district economy, similarity of business environments represented by development zones, export-oriented or domestic market-oriented division of labor between cities, value chain division of labor between cities, and land price differences between cities promote the formation of regional city supply networks. Conversely, differences in local market size and wage levels between cities hinder the formation of city supply networks. This study attempts to apply the analysis results to regional planning from the perspective of regional industrial synergy development. Additionally, as it is based on typical Chinese provinces, it can provide policy references for national administrative regions and countries/regions at similar spatial scales for manufacturing supply chains, as well as for regional spatial layout decisions of manufacturing enterprises.
1 Introduction
1.1 Background
COVID-19 has led to the rise of logistics costs (Liu et al., 2022), stagnation of logistics (Singh et al., 2021), and growing international trade protectionism (Hobbs, 2020), restricting the frequent flow of production factors among cities worldwide and making partial disruptions to the global supply chain. In this context, the importance of regional and local supply chains comes to the fore (Thilmany et al., 2021). Due to cities being where consumer demand, suppliers, and manufacturers converge (Nagurney, 2015), especially in China and other countries with distinctive features of economic operation such as local district economy, cities are the basic unit of organization of regional supply chains. Taking China as an example, due to the difficult situation of the COVID-19 epidemic in April 2022, the lockdown of Shanghai has led to the stagnation of the supply chain of technology and auto industries in the Yangtze River Delta region and even across China (Zhang et al., 2022). Thus, it becomes increasingly important to focus on the organizational characteristics of regional supply chains from the perspective of inter-city network linkages. In addition, the study of supply and sales logistics networks of manufacturing firms in typical development zones in Shandong, based on the context of the widespread COVID-19, provides evidence of the network contraction from the global to the regional scale of manufacturing firms (Yan and Wang, 2021), Considering the importance of the manufacturing sector in the national economy, focusing on the manufacturing sector to study the supply chain cooperation relationship among cities is vital for the region’s sustainable development.
1.2 Literature review
The mainstream path of city network research is to study the linkages between cities in terms of inter-city enterprise cooperation or factor mobility. Earlier studies of city networks through corporate relationships can be traced back to the world city network (WCN) studies of Taylor et al. (2002), which made a shift from corporate linkages to city relations by the inter-locking network model based on the inheritance of Sassen’s emphasis on advanced producer services (APS) (Sassen, 2001). Another group of researchers, based on the theory of Hymer (1982) and Friedmann (1986) that states that cities gathering multinational headquarters have “urban control” of the world economy, focus on industry-wide or industry-specific corporate networks, such as those based on linkages between the financial sector (Zhao et al., 2018), advanced logistics services (Antoine et al., 2017), and the branches of multinational corporations (Alderson and Beckfield, 2004). Some scholars expanded the study of WCN with a focus on inter-enterprise venture capital (VC) (Pan et al., 2016), advanced producer service relationships in corporate public offerings (IPOs) (Pan et al., 2017), and project cooperation between enterprises in the film industry (Hoyler and Watson, 2019). Based on the space of flow theory (Castells, 1996), city network research from the perspective of factor flow has gradually become one of the important paths in city network research, as the availability of data has increased. Related research focuses on studies on city networks in terms of innovation based on patent collaboration (Li and Phelps, 2019), patent licensing (Seo and Sonn, 2019), paper co-authorship (Zhao et al., 2015), taxi travel data (Liu et al., 2015), mobile phone data, and Baidu Migration Data (Zhang et al., 2022). Comparative perspectives of high-speed rail and intercity buses are emerging (Wang et al., 2020), while the perspectives of city network-related studies have been diversified. Admittedly, a few city network studies have focused directly on supply chain cooperation between cities in specific industry sectors. These include the city network research based on the inter-enterprise supply chain of the auto manufacturing industry (Chen et al., 2020) and mobile phone manufacturing industry (Kang et al., 2021), which are of great significance to understanding the geographical characteristics of the cooperation of manufacturing supply chains among cities within a region. Some studies use data from inter-city patent transfer (Duan et al., 2019) and urban innovation networks (Jin et al., 2021) to explore the network pattern of the inter-city technology supply chains. A few studies, based on the results of such analyses, have proposed the optimization of regional planning. One example is the study by Wang et al. (2020a), which proposed the optimization of regional transportation planning based on city network research from the perspective of traffic flow but did not discuss the application path specifically. Luo et al. (2010) emphasized the importance of the city network perspective on the importance of the institutional building of regional planning in China from the perspective of theoretical analysis.
In addition to research on city networks, traditional supply chain management focuses on the linear relationship between buyers and suppliers (Zhu and Sarkis, 2004), which has limitations in understanding the strategies and behaviors of firms (Choi and Kim, 2008), so some scholars have started to introduce a networked perspective to optimize the traditional linear supply chain research. For example, studies on supply network structure based on the social network analysis (SNA) approach (Kim et al., 2011), supply chain relationship between ports (Lee and Ieee, 2006), and marine food supply chain management (Pedroza-Gutiérrez and Hernández, 2020). These studies have expanded the research dimension of linear supply chains and deepened the knowledge of the operational characteristics of the participating subjects in the supply chain through indicators such as centrality in the SNA method. However, the related studies are still relatively few in dissecting the spatial characteristics of supply chains compared with city network studies.
In general, considering its origin, city network research from the perspective of corporate networks mainly focuses on the hierarchical organization within enterprises. Although the network linkage dimension has been expanded in later studies, APS-, TNC-, and enterprise-led studies are still mainstream (Jacobs et al., 2011). It is undeniable that studies have started to focus on the linking role of manufacturing firms in city networks in recent years, but the spatial scale of related studies is still global (Kratke, 2014), lacking attention to the regional spatial scale. The research on city networks from the perspective of factor flow often blurs the microeconomic agents in network formation. For the relevant studies in the field of supply chain management from the network perspective, attention to the spatial dimension is slightly lacking. In addition, both city network studies and supply chain management studies are less concerned with the direct application value of the analysis results to public policies.
Based on the above literature, the study proposes to establish a regional inter-city supply chain partnership based on the buyer-supplier linkage between manufacturing enterprises and their suppliers, using manufacturing enterprises as an entry point. Considering that the supply chain is a linear relationship between purchasers and suppliers, and supply networks of enterprises focus on the flow of raw materials, intermediate products, etc., between multiple enterprises on this basis (Lamming et al., 2000), and the concept of supply networks is the reliance on purchase-supply relationships between multiple enterprises to build up network structure. Therefore, this study adopts Cooper et al.’s (1997) concept of “supply networks” and applies it to the inter-city level. This study focuses on the spatial characteristics and influencing factors of regional city supply networks in the manufacturing sector and examines the possible application of the results to the example of regional planning as an important public policy.
2 Materials and Methods
2.1 Research area
China is a major manufacturing country. In the last three decades, a large number of quality manufacturing enterprises have emerged in China. According to southmoney.com, the total operating income of China’s top 500 manufacturing enterprises accounted for 36.84% of the total GDP of the whole nation in 2020. Major manufacturing enterprises represent regional manufacturing industry development. In addition, provinces are relatively independent units in terms of trade flows (Poncet, 2003) due to provincial protectionism (Ding and Niu, 2019). Therefore, China’s typical province is suitable as a case to study regional city supply networks.
Shandong is a representative strong manufacturing province in China. More than 70 of the top 100 companies in Shandong in terms of business revenue are engaged in manufacturing (Zong, 2018). As of the end of 2019, Shandong had 16 prefecture-level cities, including 57 municipal districts, 27 county-level cities, and 53 counties, with a total of 137 county-level administrative units (Figure 1). This study takes county-level administrative units as basic research units.
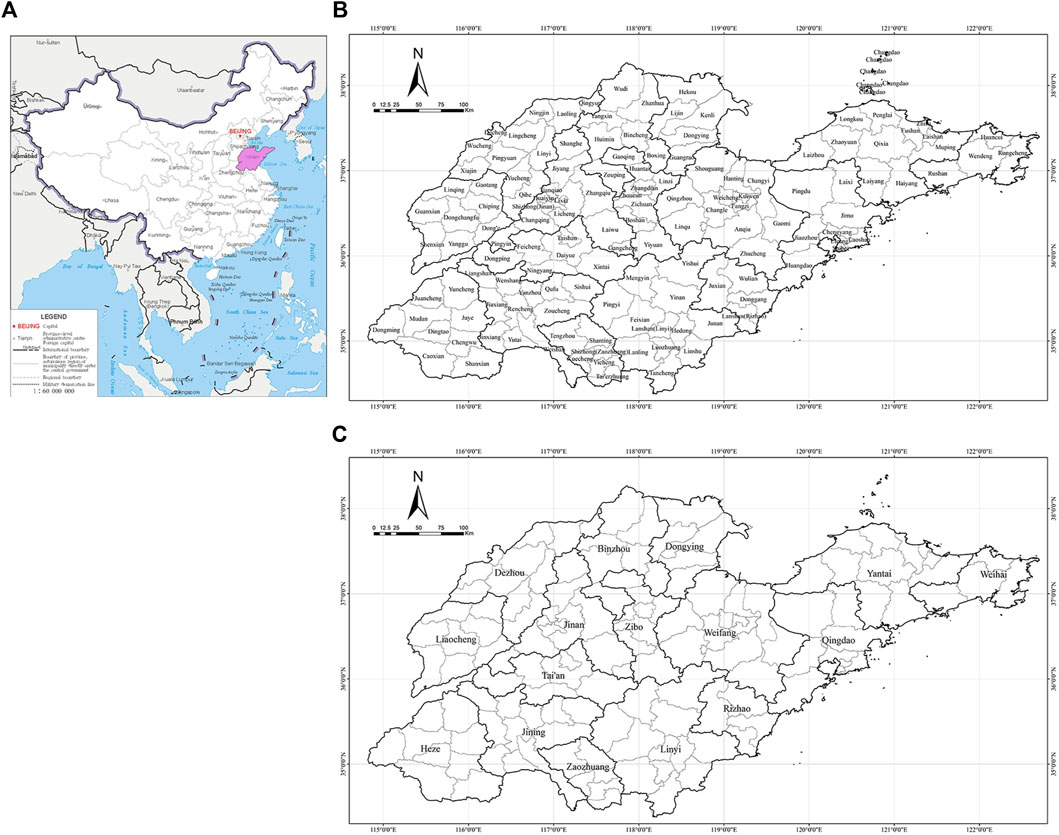
FIGURE 1. Study area: (A) the location of Shandong province in China; (B) Distribution of Prefecture-Level Cities in Shandong; (C) Distribution of County-Level Administrative Units (“city/cities” in this study) in Shandong.
2.2 Data and research steps
A supply network is composed of relationships between buyers and suppliers among firms (Cooper et al., 1997), and buyer-supplier linkage is one of the types of the inter-firm formal linkage which received attention from research of cluster network (Turkina et al., 2016). As the use of listed firms is a common practice in city network research (Li and Feng, 2020), this research selected listed firms due to their strong supply chain domination power and the highest degree of supplier information disclosure, and these firms are listed in A Stocks, Chinese stocks listed in the U.S., Hong Kong Stocks, Sci-Tech Innovation Board, and National Equities Exchange and Quotations. Suppliers of listed manufacturing firms since 2016 (including 2016) are selected as the time span includes a complete Five-Year Plan period in China.
The empirical research was conducted in three steps (Figure 2). The first step was data mining of the linkage between manufacturing firms and their suppliers. Setting the query condition “national industry” as “manufacturing industry,” “province” as “Shandong,” and “registration status” as “normal,” a name list of listed manufacturing enterprises registered in Shandong was acquired from the function of advanced query in QCC (https://www.qcc.com/) (Appendix A). Then, we manually identified the dominant business of the enterprises and eliminated the enterprises that do not belong to the manufacturing industry. By screening 379 selected listed manufacturing enterprises in Shandong (Query time was 7 April 2020) and searching suppliers of listed manufacturing enterprises in Shandong by the API interface of QCC (https://openapi.qcc.com/data), we acquired the name list of suppliers and a total of 10,847 connections between manufacturers and their domestic suppliers, including 5,353 connections within Shandong. The second step was data processing. By batch-searching the name list of buyer-supplier linkage in QCC, we acquired the addresses, including the name of county-level administrative units, of these companies. After proofreading and correcting erroneous spatial information, we transformed the relationships between listed manufacturing firms and their suppliers that we acquired in the previous step into a matrix of linkage between cities (Appendix B). The third step was data analysis. Based on the matrix of linkage between cities, we analyzed and visualized the data using software from UCINET, Gephi, and ArcGIS. Specifically, we explored the characteristics of city supply networks in Shandong by indexes of degree centrality, closeness centrality, betweenness centrality, and eigenvector centrality based on the “community detection” algorithm in UCINET; studied the influencing factors of city supply networks by the quadratic assignment procedure (QAP) in UCINET; presented the topological relationship characteristics of the networks by Fruchterman Reingold and Force Atlas layout in Gephi; and visualized the spatial characteristics of node centralities of city supply networks by ArcGIS.
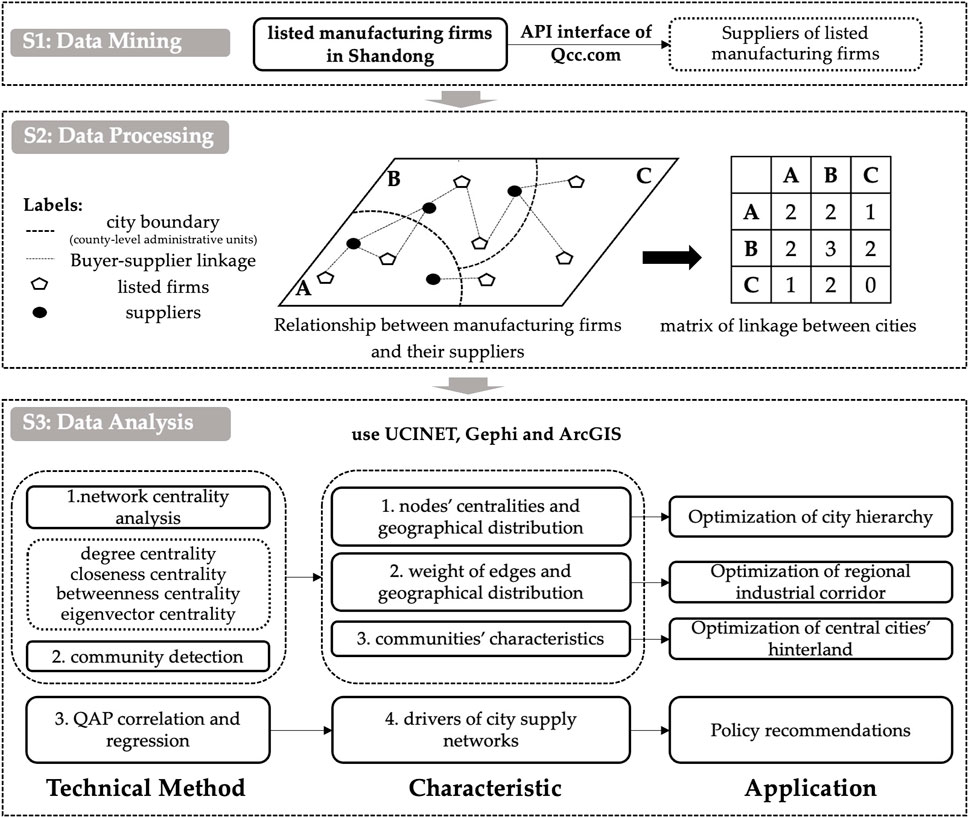
FIGURE 2. Research steps.
2.3 Research methods
2.3.1 Social network analysis
SNA is a common method in both city network studies and supply chain management studies. This study also adopts the SNA method to study the characteristics of city supply networks. Most WCN studies concluded that cities close to the central location in the network have more influence on the flow of resources (Alderson and Beckfield, 2004).
2.3.1.1 Network centrality
SNA is widely used in city network research, and this study explored the status of nodes in city networks in Shandong based on the indexes of degree centrality, closeness centrality, betweenness centrality, and eigenvector centrality.
a. Degree Centrality
Degree centrality measures the node’s ability to cluster and radiate in the network. For city supply networks, degree centrality represents the number of cities directly associated with the city. Its calculation equation is as follows:
Where:
b. Closeness Centrality
Closeness centrality shows the closeness of the linkage between a node and other nodes by the reciprocal of the sum of the shortest distance, and thus reveals their position in the network. For city supply networks, closeness centrality indicates how easy it is for a city to interconnect with others. It is calculated by the following equation:
Where:
c. Betweenness Centrality
Betweenness centrality is the proportion of all shortest paths in the network that pass through the point. It is used to measure the degree of control or dependence of a node on others and the criticality of a node acting as an intermediary between other “node pairs.” For city supply networks, the degree of betweenness centrality indicates to what extent the city is at the bridge position of networks, that is, betweenness degree. It is calculated by the equation as follows:
Where:
d. Eigenvector Centrality
Eigenvector centrality measures the magnitude of interactions between different nodes by an iterative algorithm (Newman, 2018), which measures the number of connections and emphasizes the importance of the connected nodes, to show the variability of influence between different nodes more accurately and comprehensively. For a city supply network, the eigenvector centrality takes into account the number and importance of other cities that are in direct association with the city.
Where:
2.3.1.2 Community detection
Community detection, a method of network clustering, is a technique used to reveal the aggregation of networks. In a complex network structure, the most important quality of a subset (community) formed by some nodes that have strong ties with each other is characterized by the high density of connections within the community but low with nodes outside the community.
The main current community detection algorithms include Modularity (Girvan and Newman, 2002), Infomap (Rosvall and Bergstrom, 2008), and Fast Unfolding (Blondel et al., 2008). In this paper, the Fast Unfolding clustering algorithm is employed to divide the community of city networks in Shandong, that is, a small group with strong internal ties but few weak inter-regional ties. The principle of Fast Unfolding clustering is to divide the network by iterative operations so that the overall modularity of the divided network continues to increase until the network structure no longer changes. With the help of Gephi software, the modularity is maximized, with a larger modularity value indicating a better result regarding community division (Rosvall and Bergstrom, 2008). We used the Modularity command in Gephi software and set the Resolution to 1.1. The Force Atlas layout was used to show the network topology and the Geo Layout was used to present the spatial characteristics of city supply networks.
2.3.2 Spatial autocorrelation
The spatial aggregation of elements with similar characteristics is known as spatial autocorrelation. A binary symmetric spatial weights matrix was usually used to express the proximity of geospatial objects. For a region with
There are various methods to measure proximity. In this paper, GeoDa software is used to generate the spatial weight matrix based on the Queen coefficients, i.e., a common edge or point is a spatial neighbor, and the rank of the spatial neighbor is assigned to 1. Spatial autocorrelation includes global and local types.
Global spatial autocorrelation is a description of the characteristics of an attribute over the entire region, reflecting the overall trend of spatial correlation of the observed variables over the entire study area. The most commonly used coefficient is Moran’s I coefficient, which is in the range of [-1,1]. When Moran’s I is greater than zero, the region and its surrounding areas do not have significant spatial differences, i.e., regions with similar characteristic values aggregate, and the more the value tends to 1, the smaller the spatial differences. When Moran’s I is less than zero, the region and its surrounding areas have significant spatial characteristics, and the more the value tends to −1, the larger the overall spatial differences, i.e., regions with non-similar characteristic values aggregate. When the Moran’s I index is zero, there is no spatial aggregation. When Moran’s I is used to analyze the spatial pattern of observed variables, a significance test is used to ensure the correctness of the conclusions with a certain probability. The judgment of accepting or rejecting the null hypothesis at a set significance level is made according to the p-value and Z-test.
Local spatial autocorrelation can specifically measure the degree of local spatial association and spatial differences between each region and its surrounding areas, and the Local Moran’s I is generally used as a local indicator of spatial association (LISA). It is calculated by the following equation:
In the equation,
2.3.3 QAP correlation and regression
QAP correlation and regression methods are adopted to analyze the influencing factors of city supply networks. QAP was originally an important method for studying social relationships, a method for comparing the similarity between two matrices. QAP is introduced to study the relationship between the dependent variable matrix and independent variable matrices, while traditional multiple regression statistical tests require the independence of independent variables to avoid multicollinearity and do not work for testing relational data in networks. QAP correlation is used to test the correlation between the independent variable matrices and the dependent variable matrix, and QAP regression analysis is the study of the influence of the independent variable matrices on the dependent variable matrix (Hubert and Schultz, 1976).
We use the matrix of linkage strength between cities in Shandong as the dependent variable matrix
Based on the above indexes, the independent variable matrices are constructed by the following method and basic assumptions (Table 1). The economic development indexes of cities in Shandong were obtained from the China County Statistical Yearbook (2020); the travel distance between any two cities was acquired in bulk through the API interface of AMAP (https://lbs.amap.com/) based on the coordinates of the city government locations; the minimum price standards for the transfer of industrial land were from the Announcement of National Minimum Price Standards for the Transfer of Land for Industrial Use published on the website of the Ministry of Land and Resources of the People’s Republic of China (Ministry of Land and Resources of the People’s Republic of China, 2017); and the minimum wage standards came from the Notice of the People’s Government of Shandong on the Announcement of the Provincial Minimum Wage Standards (Shandong Provincial Department of Justice, 2021).
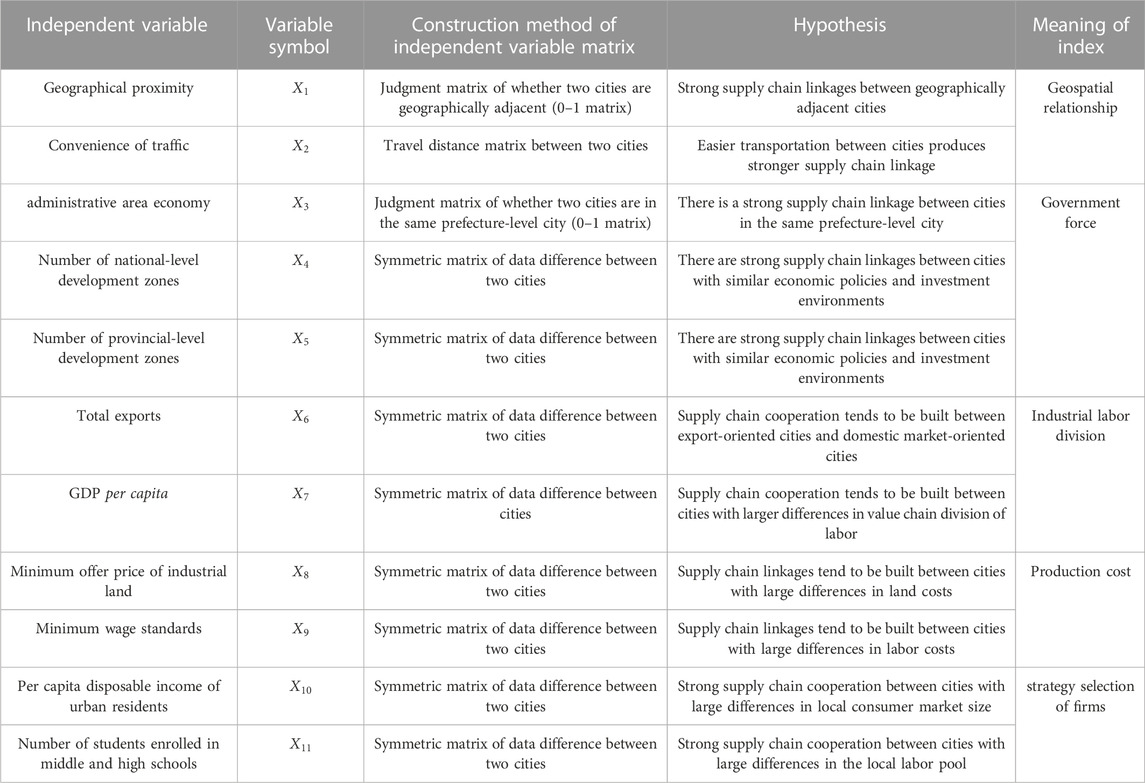
TABLE 1. Research hypothesis, meaning of indexes, and construction of independent variable matrix.
Based on the above indexes, the econometric model is as follows:
Where:
3 Results
3.1 Characteristics of city supply networks
3.1.1 Nodes’ centralities and geographical distribution
The node degree centrality of city supply networks in Shandong is characterized by grade and spatial cluster. Based on the standardized node degree centrality, the cities in Shandong can be classified into four levels, with seven core nodes at the first level, all municipal districts; 26 critical nodes at the second level, including 17 municipal district units and nine county (county-level city) administrative units; 41 and 63 cities at the third and fourth levels, respectively (Table 2).

TABLE 2. Node levels of city supply networks in Shandong.
There are differences in the grades and spatial distribution of degree centrality, closeness centrality, betweenness centrality, and eigenvector centrality. The study focused on nodes with higher centrality, and we found that degree centrality and closeness centrality were at a similar grade, but both significantly different from betweenness centrality and eigenvector centrality. For example, Huangdao District in Qingdao ranked 10th in degree centrality, 10th in closeness centrality, and sixth in eigenvector centrality, while ranked 34th in betweenness centrality only, indicating that this node had many external connections and maintained close relationships with other important nodes, but had a low criticality as an intermediary; however, Kuiwen District in Weifang ranked eighth in betweenness centrality, while ranked poorly in all other centralities, indicating that this node played an important intermediary role and was in the critical channel of the provincial city supply networks (Figure 3). Dongchangfu District of Liaocheng had a high degree of linkage and importance as an intermediary, but had a low level of eigenvector centrality, indicating that the node connected with it was generally not so important and it lay in the gateway position of the provincial sub-region in the city supply network.
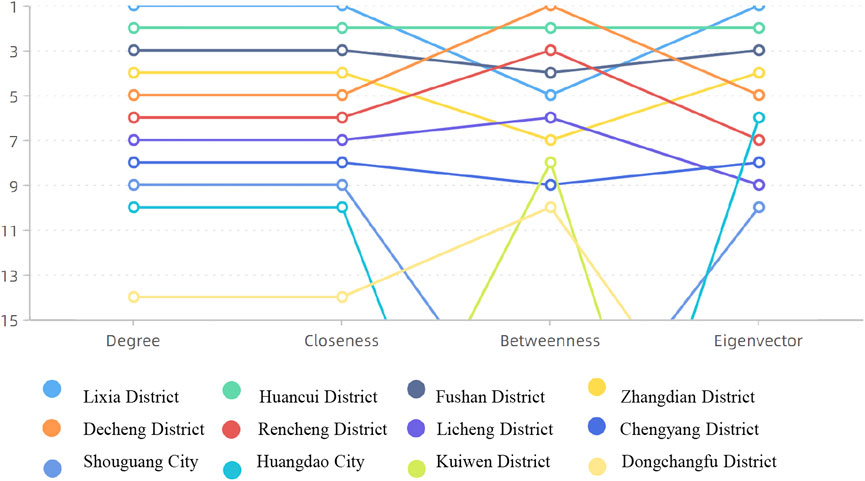
FIGURE 3. Centrality ranking of core and key nodes of city supply networks in Shandong.
The study further explores the differences in the spatial distribution of cities with different node centralities in networks using spatial autocorrelation methods. The cities in Shandong have significant agglomeration in all four kinds of centralities, and the values of global Moran’s I are positive with all the p-values less than 0.01 and Z-scores greater than 2.58, Moran’s I values are statistically significant (Table 3).
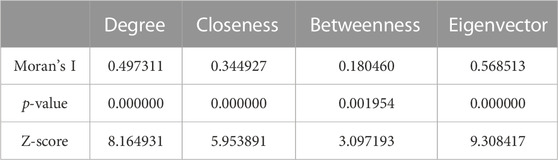
TABLE 3. Node centralities of cities and the result of global spatial autocorrelation.
The natural breaks (Jenks) method is used to classify the four node centrality degrees respectively into five levels and visualize them by ArcGIS, and the spatial distribution of the four node centrality degrees differs in partial areas. For the analysis results of local spatial autocorrelation, the high-high clusters in Shandong are mainly in Qingdao, Yantai, and Weihai in the eastern coastal region, as well as Jinan and its neighboring regions; the low-low clusters are mainly in the northwestern and southern regions of Shandong. By comparing the spatial distribution of four node centrality indexes, it is found that there are differences in the spatial distribution pattern of different centrality indexes. For example, cities in Qingdao belonged to high-high clusters for degree centrality and eigenvector centrality, but not for betweenness centrality. For all four centrality degrees, a spatial association pattern of low-high clusters emerges around Jinan; for degree centrality and betweenness centrality, a spatial association pattern of high-low clusters of cities emerges in Liaocheng and Zaozhuang (Figure 4).
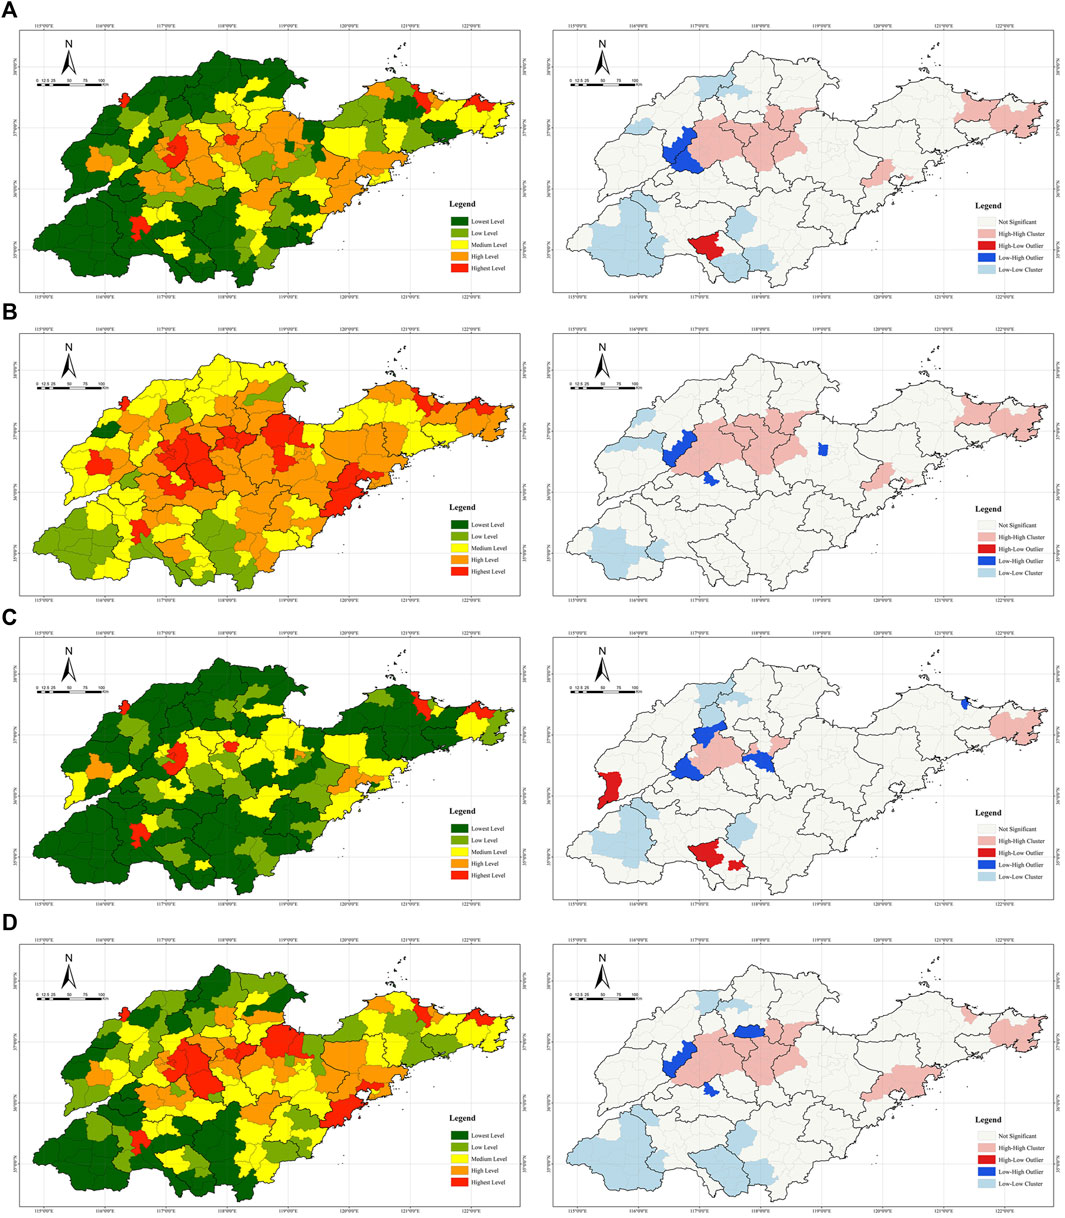
FIGURE 4. (A) Degree centrality of cities and spatial autocorrelation; (B) closeness centrality of cities and spatial autocorrelation; (C) betweenness centrality of cities and spatial autocorrelation; (D) eigenvector centrality of cities and spatial autocorrelation.
3.1.2 Edge weights and geographical distribution
The edge weights of city supply networks in Shandong show a hierarchical distribution, and cities within the prefecture-level are strongly connected. The edges with high linkage strength mainly fall within the prefecture-level cities and the county-level administrative units with a well-developed manufacturing sector. The edge with the highest linkage strength is Fushan District–Zhifu District, the edges with higher linkage strength are mainly located within the municipalities of Yantai, Weihai, Zibo, Jinan, and other prefecture-level cities. The edge with the highest linkage strength between cross-prefecture-level cities is that of Rencheng District–Yuncheng County, which are in Jining and Heze, respectively. However, the edge weight is 44, at a medium level (Table 4; Figure 5).
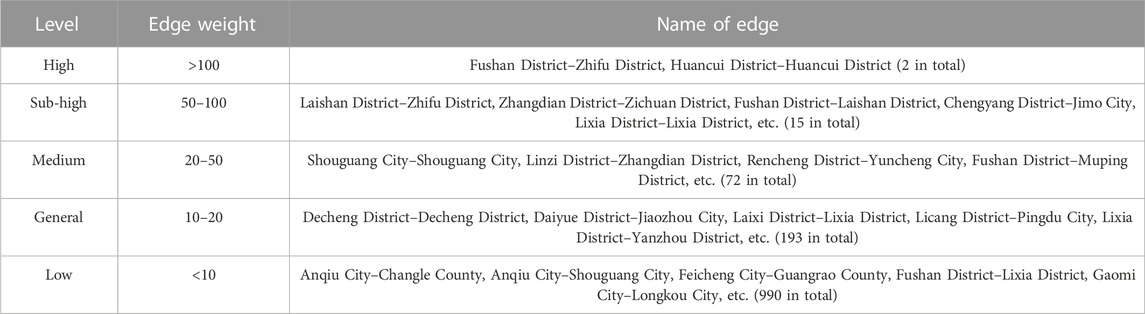
TABLE 4. Edge weights classification of city supply network in Shandong.
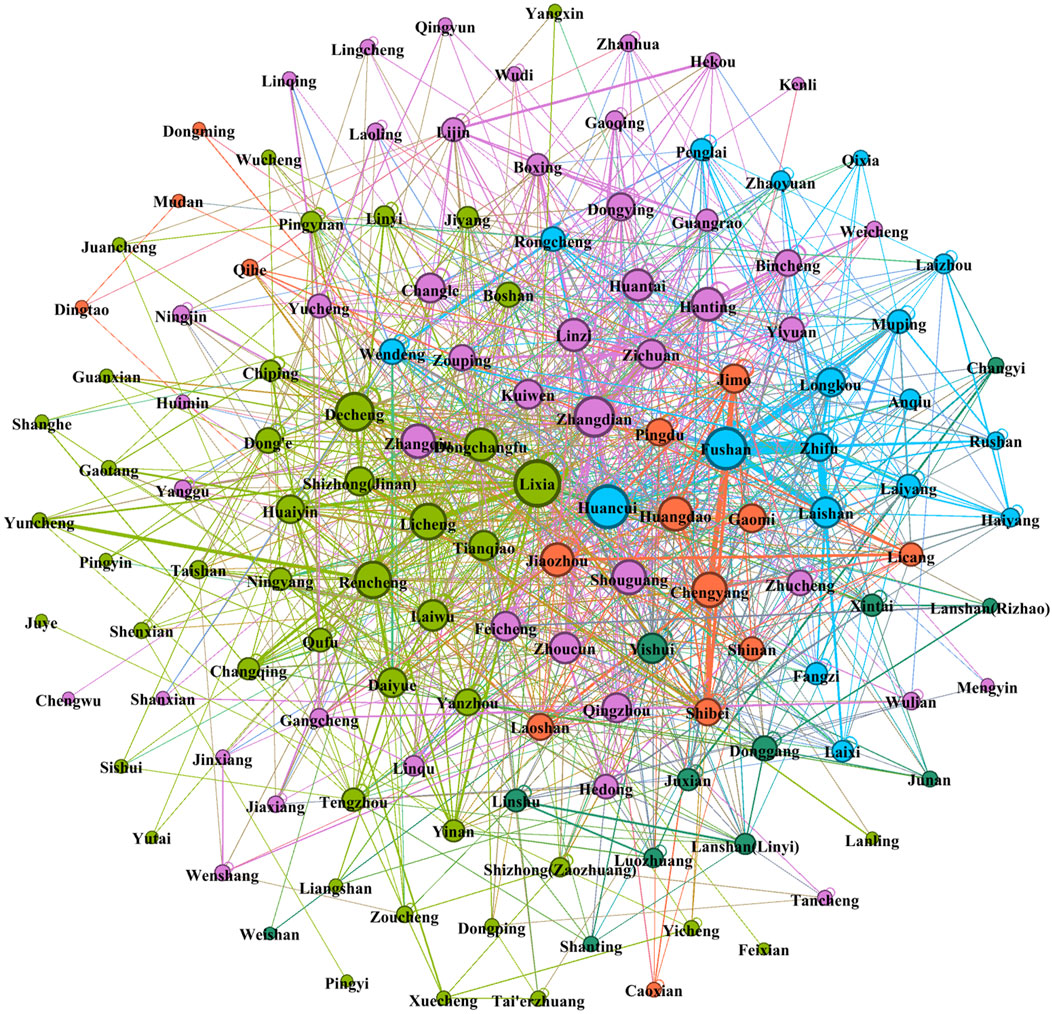
FIGURE 5. City Supply Network Pattern of Shandong (Fruchterman Reingold Layout).
3.1.3 Characteristics of network communities
Each network community in city supply networks in Shandong has core nodes. The spatial distribution of cities in the same community is characterized by geographical proximity distribution along with “enclave” cities apart from the main plate. For example, the community with an area under Qingdao’s jurisdiction as the core includes some cities of Heze, while some cities of Yantai, Weihai, and Weifang are in the same community (Figure 6). From the perspective of all communities, Community 1 is made up of Zibo, Weifang, and the Zhangqiu District of Jinan. It covers 45 nodes, including some in Dezhou, Dongying, and Binzhou with a large geographical range. Community 2 has core nodes including some municipal districts in Jinan, Jining, Liaocheng, and Dezhou among its 45 network nodes, but these core nodes are scattered in geographical distribution and the “community” is characterized by multiple cores. Community 3 has 18 network nodes, and its core nodes are the Huancui District of Weihai and the Fushan and Laishan Districts of Yantai, which extend their reach into most parts of the Jiaodong Peninsula as well as the Fangzi District and Anqiu of Weifang. Community 4 has 15 network nodes, mainly the cities of Qingdao and Gaomi City of Weifang, and some cities in the west of the province, such as Mudan and Dingtao Districts of Heze, which are the edge nodes of the community. Community 5 has the least number of nodes in Shandong, its main nodes are Rizhao and Linyi, and there is no node with high centrality in the community.
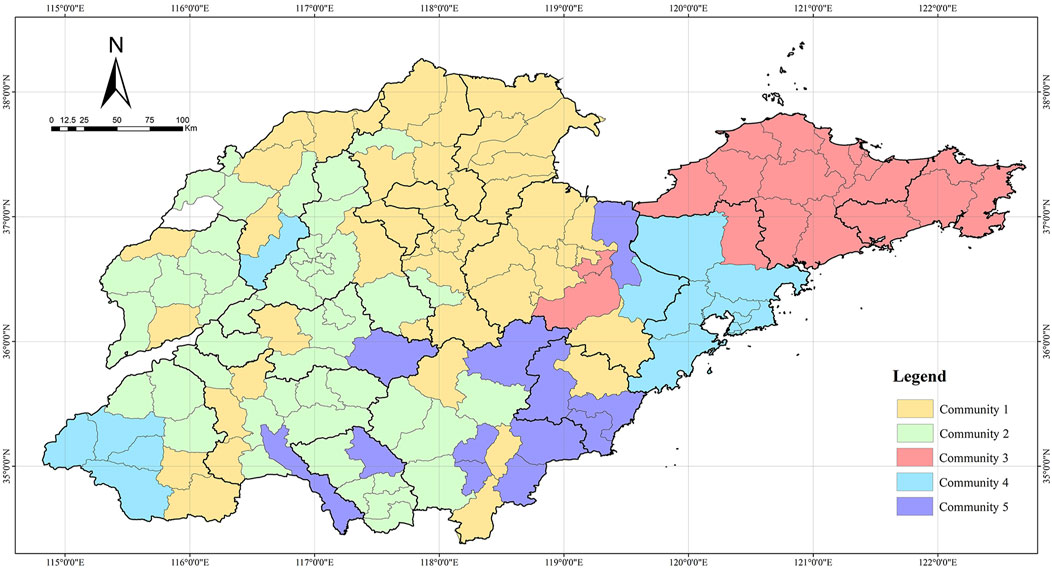
FIGURE 6. Distribution of Network Community of City Supply Networks in Shandong.
3.2 Influencing factors of city supply networks
The QAP results obtained by UCINET with 5,000 random permutations showed (Table 5) that all independent variables are significant at 90% and above confidence intervals. The independent variable of administrative area economy (
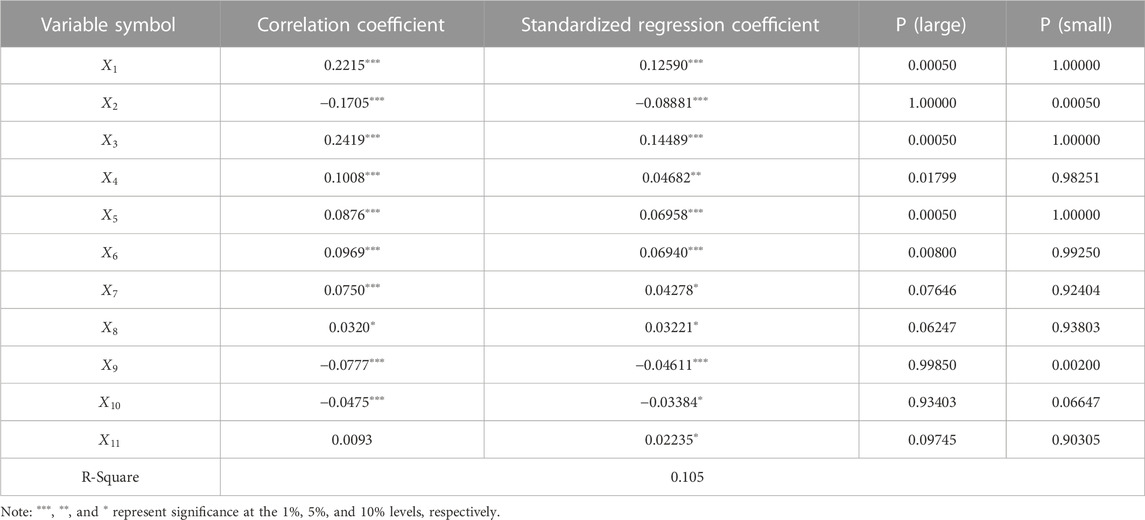
TABLE 5. Analysis results of QAP correlation and regression.
4 Discussion
4.1 Implications in the optimization of regional planning
Since the COVID-19, global governments have generally strengthened their involvement in the public domain, and regional planning is one of the policy tools of government in organizing local economic development. Regional planning is a public policy tool common to both developed and developing countries (Beloto, 2020; Davis, 2004; Li and Wu, 2013). China’s regional planning aims to achieve a coordinated layout of regional economic and innovation factors based on the geographical location of cities in the region (Xu et al., 2021). As urban system planning is a type of regional planning in China, this study uses the Urban System planning of Shandong Province (2011–2030) case to illustrate the specific application of the results of a city supply network study in optimizing regional planning.
4.1.1 Community division and the optimization of major cities’ hinterland
Network connections among cities are the development trend in urban areas (Wang et al., 2022). With the improvement of information and communication technology and transportation infrastructure, the rigid “major city-hinterland” spatial hierarchy dominated by the central place theory is gradually dissipating. In this study, this phenomenon is also found. Whereas the Urban System Plan of Shandong Province (2011–2030) leads the linkage and division of labor of cities in the region with the designation of a dense area of cities (Figure 7) and divides Shandong into six complete dense areas of cities with no geographical overlapping between each area.
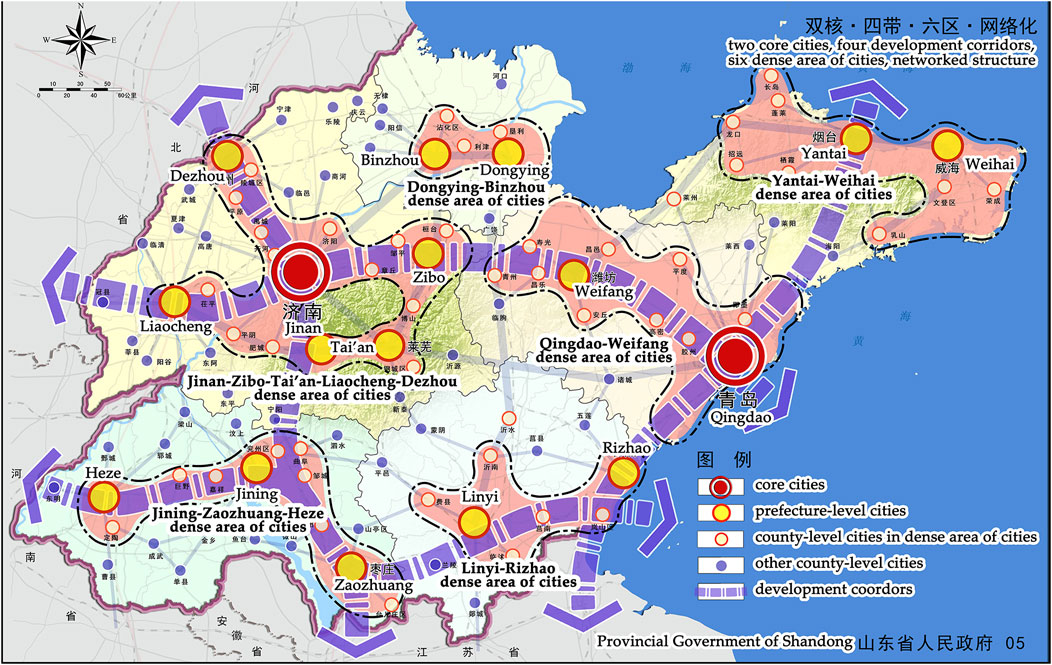
FIGURE 7. Spatial layout of cities in Urban System Planning of Shandong Province (2011–2030).
The spatial distribution of network communities can provide a basis for the identification of the scope of the hinterland of major cities. According to the research results, in terms of the inter-city factor flow of production, some of the dense areas of cities in the Urban System Plan of Shandong Province (2011–2030) have not been formed, such as the Ji-Zao-He city dense area and Lin-Ri city dense area in southern Shandong, and a relatively complete spatial structure of these dense areas of cities has not been formed due to the lack of leading core cities. At the same time, the industrial factor flow in some of the dense areas of cities has obvious characteristics of cross-regional cooperation, such as the industrial cooperation between Qingdao and cities in western Shandong in Community 4 of city supply networks. The delineation of dense areas of cities in future regional planning should consider “enclave cities” outside the main region of dense areas of cities and promote the synergy of industrial factors in a larger spatial scope through the construction of “partner cities”.
4.1.2 Node centralities and the optimization of city hierarchy
The Urban System Planning of Shandong Province (2011–2030) proposes the construction of a four-level urban system and stipulates the population and land scale of different levels of cities. However, this study finds that different cities differ in the order of different node centralities, with some cities having high degree centrality, while some cities having low degree centrality but strong betweenness centrality, indicating that they act as a “bridge” of connecting cities’ local firms into the flow of regional industrial factors. In addition, the study finds a mismatch between administrative hierarchy and city supply network centrality, as well as inter-city cooperation based on industrial value chain division of labor and export-oriented or domestic market-oriented division of labor. In that, the study applies the results of node centralities in city network research to the optimization of city hierarchy in regional planning, which should not only emphasize the correlation between the administrative level and city scale but also focus on the network position of cities in the regional industrial factor flow and improve the intermediary centers in the network by the construction of logistics bases and transportation infrastructure in specific cities, such as some city nodes in Jinan, Weihai, and Zibo, through which the “bridge” role of cities with high betweenness centrality in city networks can be improved.
4.1.3 Edge weights and the optimization of regional industrial corridors
Reference can be made to the dense areas of the high level of city network edges to guide the formation of industrial corridors and accordingly strengthen the regional transportation system along the industrial corridors, such as strengthening the construction of highways, and increasing the frequency of freight trains, and strengthening the construction of industrial parks and logistics parks in cities along the route.
According to the spatial structure (Figure 8) and the line density analysis of edges in city supply networks (Figure 9), it was found that “Jinan-Zibo-Weifang-Qingdao,” “Jinan-Zibo-Yantai-Weihai,” and “Yantai-Weihai-Qingdao” supply corridors in manufacturing industry have been formed, and the corridor of “Jinan-Tai’an-Jining” has taken shape. As for the optimization of development corridors delineated in the Urban System Planning of Shandong Province (2011–2030), the development corridors along the Bohai Sea in northern Shandong which is the “Jinan-Zibo-Yantai-Weihai” corridor should be highlighted according to the research results; the formation of the east-west development corridor in southern Shandong is still not possible in the short term, due to a lack of support of the core cities.
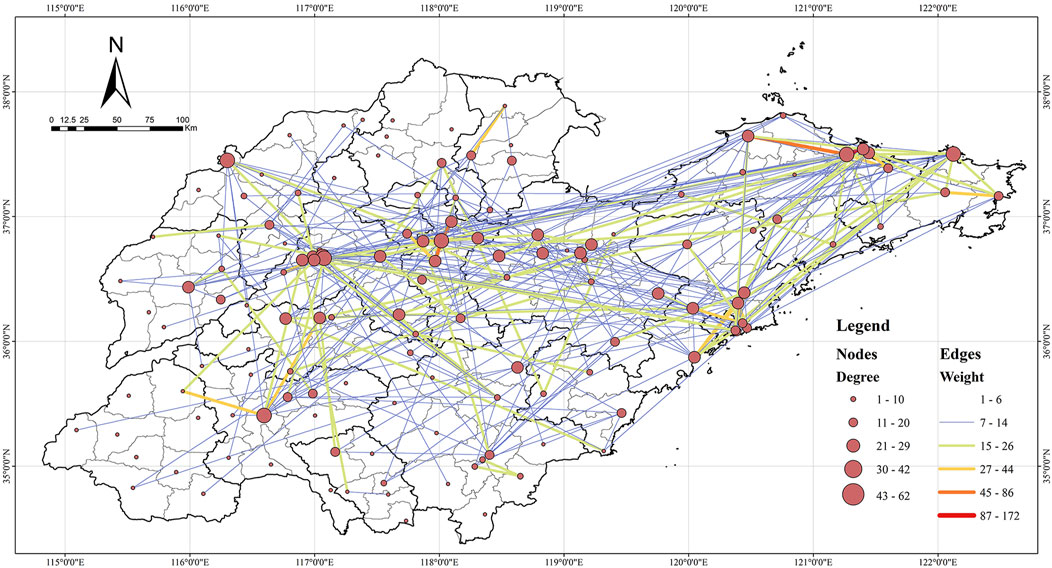
FIGURE 8. Spatial Pattern of City Supply Networks in Shandong.
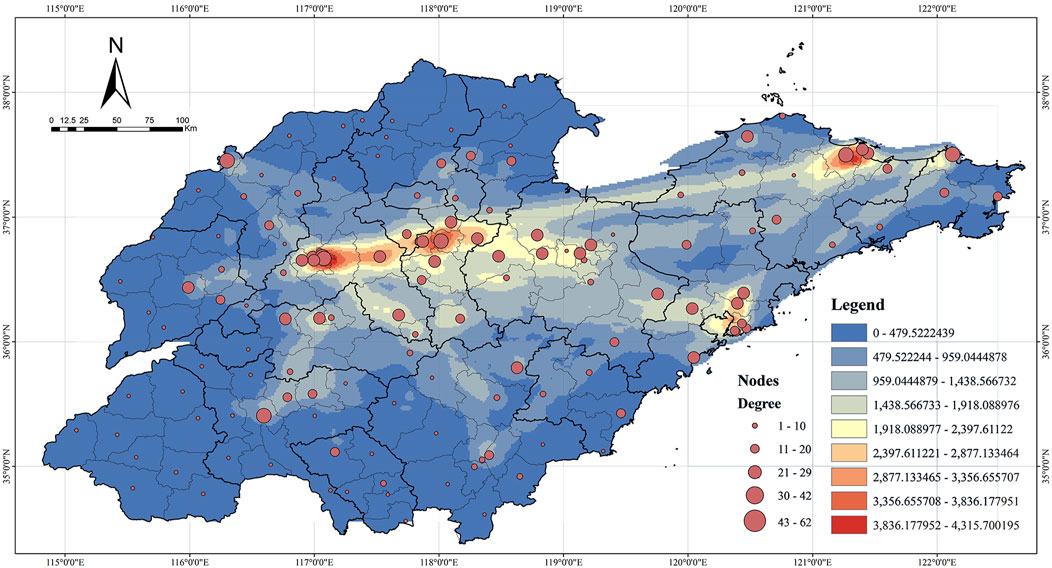
FIGURE 9. Line Density Analysis of City Supply Network Edges of Shandong.
4.2 Influencing factors of regional production factor flow and industrial cooperation
The “factor flow” in the buyer-supplier linkage between enterprises forms the factor flow between cities, related studies have explored the network characteristics and influencing factors of various factor flows among regional cities.
Innovation factors are an important aspect of factor mobility between cities in the region. The formation mechanisms of city innovation networks differ from city supply networks, with formal innovation collaboration alliance relationships at the region being less influenced by geographic proximity (Cao et al., 2019), social and organizational proximity weigh higher than geographical proximity in the innovation networks from the patent and paper collaboration perspective in China (Li et al., 2015). However, spatial distance is a decisive factor in inter-city technology transfer (Liu et al., 2019), and the city networks from a regional highway traffic flow perspective are also significantly influenced by geographic proximity, which is manifested as the relative integrity of the spatial distribution of the city network communities (Ke et al., 2017). Interregional trade is a more integrated flow of factors that a significant impact of trade complementarity on bilateral trade has been found in the case of West African countries (Osabuohien et al., 2019), which is in line with the results of our study that city supply networks tend to be established between export-oriented cities and internal market-oriented cities, and between cities with a large gap in value chain labor of division, indicating the formation of the industrial division of labor between cities in the region.
The study for the Chengdu-Chongqing urban agglomeration in China finds that administrative boundaries have significant hindering effects on inter-city factor flows, and the degree of hindrance varies for the movement of people, investment, and patent transfer (Zhang et al., 2022). The study for the Yangtze River Delta region of China as a case study finds that inter-city factor flows in three dimensions: infrastructure network, business exchanges of producer service firms, and leisure trips are all influenced by geographical distance and administrative boundaries (Zhang et al., 2020). This study also finds the hindering effects of the ease of transportation links and administrative boundaries of prefecture-level cities on inter-city supply networks. In addition, the case based on the Yangtze River Delta in China differs from the findings of this study, which finds that wage differences between cities are the guiding factor of population flow and migration networks (Wang et al., 2020b). This study, together with those cited, deepens the knowledge of inter-city industrial factor flows.
It has been almost 30 years since the rise of Justin-Time (JIT) techniques and the outsourcing of non-core activities. In this context, geographic proximity between manufacturing firms and suppliers has become increasingly important (Holl et al., 2010). This study also verifies the importance of geographical proximity for manufacturing firms in the establishment of supplier partnerships. International industrial investment studies show that firms’ direct industrial investment is influenced by factors of cheap local labor and local markets of investment destinations (Heonsoo, 2021). However, this study finds that the differences in market size and labor cost between cities at the regional scale have a negative impact on supply chain cooperation instead. The study suggests that the geographical scale of China’s provinces is relatively small and the districts/counties do not have complete urban functions, so the flow of production factors between some districts/counties and neighboring districts/counties is very frequent, and there is the phenomenon of production and life in a different place of factory workers. In that, enterprises can also transfer their production parts in the border area between target market cities and neighboring cities, which in turn makes the impact of these two indicators conflicts with theoretical expectations. Similarly, the difference in the number of junior and senior high school populations between cities does not pass the significance test of the QAP correlation. Development zones, as the major spatial carriers for the development of the manufacturing sector in China (Wang et al., 2017), are often used as a policy tool to promote inter-city industrial cooperation (Luo, 2010). This study verifies the role of similarity in conditions of development zones among cities in promoting inter-city industrial cooperation.
4.3 Policy enlightenments to regional industrial coordinated development
The level of trade barriers between China’s provincial administrative regions are close to the level of sovereign states and significantly higher than the level within sovereign states (Poncet, 2003). Both from the perspective of the spatial scale of China’s provinces and the boundary effects of industrial factor flow, the study of city supply networks in manufacturing industry with typical Chinese provinces can provide policy guidance for other countries at similar geographic scales (e.g., Cambodia, Uruguay, Tunisia, South Korea, Portugal) or administrative regions within large countries.
First, for cities that are marginalized in the regional city supply network, their city governments should reverse the idea of simply attracting investment from outside firms with low-priced industrial land and low-priced labor, and instead integrate into the regional supply system by building standardized industrial parks. Second, higher-level governments in the region should pay attention to establishing more unobstructed channels of logistics, information, and personnel between export-oriented cities and domestic market-oriented cities, to better utilize the industrial synergy effect between cities. Cities with better industrial development in a region should be encouraged to establish “economic enclaves,” such as industrial parks, in other cities of the region. Finally, the differences in local market size and local labor pool between cities have a limited impact on the buyer-supplier relationship between enterprises in different cities, and manufacturing enterprises should focus on balancing the saving of logistics time and costs of local production with the advantage of cross-city production in the regional production layout according to their industrial characteristics. The distribution pattern of the centralities can provide a reference for enterprises to develop markets and choose partners so that enterprises can select partners in cities with high closeness centrality to maintain a “shortcut” to the regional market. Enterprises can also choose cities with high eigenvector centrality to maintain a more convenient supply network relationship with the important cities (nodes) in the network.
5 Conclusion
Based on the relationship between listed manufacturing enterprises and their suppliers, this study introduces the centrality index and the community detection algorithm in the SNA method to investigate the spatial characteristics and influencing factors of city supply networks in Shandong. The main findings are as follows.
(1) The node centralities and edge weights of city supply networks within Shandong conform to graded distribution, and nodes with different types of centralities vary in the grade structure and spatial distribution. The geospatial distribution of cities belonging to the same network community is characterized by both geographic proximity and “enclave” distribution.
(2) Geographical proximity, convenient transportation links, administrative district economy, similarity of business environment represented by development zones, export-oriented/domestic market-oriented division of labor between cities, value chain division of labor between cities, and land price differences between cities promote the formation of regional city supply networks, while differences in local market size and wage levels between cities hinder their formation.
(3) This study explores a technical framework for applying the results of characteristics of nodes, edges, and network communities of city supply networks to the optimization of regional planning for regional city hierarchies, industrial corridors, and hinterlands of core cities, respectively.
The main contributions are as follows. Based on the relationship between listed manufacturing enterprises and their suppliers, this study expands the research perspective of city networks. Besides, regional planning as an important policy tool for the government, this study applies the research results to the optimization of regional planning and establishes a technical framework for regional planning optimization.
However, there are limitations to this study. First, the study is based on the context of the manufacturing supply chain crisis brought on by COVID-19 and aims to reveal the general characteristics of regional city supply networks, without involving the comparison of the changes in network characteristics before and after the epidemic. Second, this study does not address the directional characteristics of the city supply networks, directed networks can be introduced to investigate the trade flow of city supply networks in manufacturing in the future study.
Data availability statement
The original contributions presented in the study are included in the article/Supplementary Material, further inquiries can be directed to the corresponding author.
Author contributions
YY: conceptualization, methodology and writing. XW: writing—review and editing, project administration, and funding acquisition. SZ: writing—original draft preparation, writing-review and editing. YZ: writing—review and editing.
Funding
This research was funded by the National Natural Science Foundation of China, grant number 52078115.
Conflict of interest
The authors declare that the research was conducted in the absence of any commercial or financial relationships that could be construed as a potential conflict of interest.
Publisher’s note
All claims expressed in this article are solely those of the authors and do not necessarily represent those of their affiliated organizations, or those of the publisher, the editors and the reviewers. Any product that may be evaluated in this article, or claim that may be made by its manufacturer, is not guaranteed or endorsed by the publisher.
References
Alderson, A. S., and Beckfield, J. (2004). Power and position in the world city system. American Journal of Sociology 109, 811–851.
Antoine, S., Sillig, C., and Ghiara, H. (2017). Advanced logistics in Italy: A city network analysis. Tijdschrift voor Economische en Sociale Geografie 108, 753–767.
Beloto, G. E. (2020). Regional cities International references in Brazilian regional planning in the 1950s and 1960s. Plan Perspect 35, 457–476.
Blondel, V. D., Guillaume, J. L., Lambiotte, R., and Lefebvre, E. (2008). 2008, Fast unfolding of communities in large networks. Journal of Statistical Mechanics: Theory and Experiment.
Cao, X. Z., Zeng, G., and Ye, L. (2019). The structure and proximity mechanism of formal innovation networks Evidence from Shanghai high-tech ITISAs. Growth Change 50, 569–586.
Castells, M. (1996). Rise of the network society: The information age: Economy. Sociology Culture 1.
Chen, S. Y., Wei, S. Q., Huang, G. Z., and Zhang, H. G. (2021). Value chain organization models of Taiwanese electronic information enterprises in Mainland China and their spatiotemporal evolution processes. Plos One 16.
Chen, X., Yang, J., Wang, E., and Miao, C. (2020). The characteristics of China's urban network based on the supply chain system of automobile industry. Geographical Research 39, 370–383.
Choi, T. Y., and Kim, Y. (2008). Structural embeddedness and supplier management: A network perspective. Journal of Supply Chain Management 44, 5–13.
Cooper, M. C., Lambert, D. M., and Pagh, J. D. (1997). Supply chain management: More than a new name for logistics. International Journal of Logistics Management 8, 1–14.
Davis, B. C. (2004). Regional planning in the US coastal zone: A comparative analysis of 15 special area plans. Ocean Coast. Manag 47, 79–94.
Ding, C. R., and Niu, Y. (2019). Market size, competition, and firm productivity for manufacturing in China. Regional Science and Urban Economics 74, 81–98.
Duan, D. Z., Zhang, Y., Chen, Y., and Du, D. B. (2019). Regional integration in the inter-city technology transfer system of the Yangtze River Delta, China. Sustainability 11.
Gao, S., Liu, Y., Wang, Y. L., and Ma, X. J. (2013). Discovering spatial interaction communities from mobile phone data. Trans Gis 17, 463–481.
Gaulier, G., Lemoine, F., and Ünal-Kesenci, D. (2007). China’s integration in east asia:production sharing. FDI High-Tech Trade 40, 27–63.
Girvan, M., and Newman, M. E. J. (2002). Community structure in social and biological networks. Proceedings of the National Academy of Sciences of the United States of America 99, 7821–7826.
Heonsoo, C. (2021). A study on determinants of Korean SMEs’ foreign direct investment in gaeseong industrial complex and vietnam. Asia-Pacific J Bus. Ventur Entrepreneursh. 16, 167–178.
Hobbs, J. E. (2020). Food supply chains during the COVID-19 pandemic. Can J Agric Economics-Revue Can D Agroeconomie 68, 171–176.
Holl, A., Pardo, R., and Rama, R. (2010). Just-in-Time manufacturing systems, subcontracting and geographic proximity. Reg. Stud. 44, 519–533.
Hoyler, M., and Watson, A. (2019). Framing city networks through temporary projects: (Trans)national film production beyond "global hollywood. Urban Stud. 56, 943–959.
Hubert, L., and Schultz, J. (1976). Quadratic assignment as a general data-analysis strategy. British Journal of Mathematical and Statistical Psychology, 29, 190–241.
Hymer, S. (1982). The multinational corporation and the law of uneven development., Int. Econ. Policies Their Theor. Found., 325–352.
Jacobs, W., Koster, H., and Hall, P. (2011). The location and global network structure of maritime advanced producer services. Urban Stud 48, 2749–2769.
Jin, P. Z., Wu, H. Y., Yin, D. S., and Zhang, Y. P. (2021). Macroeconomic uncertainty and the spatiotemporal evolution of innovation networks: Evidence from China's urban technology supply chain. Journal of Enterprise Information Management 34, 598–623.
Kang, J., Lin, B., and Ning, Y. (2021). Spatial organization and influencing factors of apple's component supply chain in China. Econmy Geogr 41, 138–145.
Ke, W. Q., Chen, W., and Yu, Z. Y. (2017). Uncovering spatial structures of regional city networks from expressway traffic flow data: A case study from jiangsu province, China. Sustainability 9.
Kim, Y., Choi, T. Y., Yan, T., and Dooley, K. (2011). Structural investigation of supply networks: A social network analysis approach. Journal Operations Management 29, 194–211.
Kratke, S. (2014). How manufacturing industries connect cities across the world: Extending research on 'multiple globalizations. Glob Networks-a J Transnatl. Aff. 14, 121–147.
Lamming, R., Johnsen, T., Zheng, J. R., and Harland, C. (2000). An initial classification of supply networks. Int J Operations Prod Manag 20, 675–691.
Lee, P. D., and Ieee, (2006). “Port supply chains as social networks,” in Proceedings of the IEEE International Conference on Service Operations and Logistics and Informatics, Shanghai, China, June 2006.
Li, D. D., Wei, Y. D., and Wang, T. (2015). Spatial and temporal evolution of urban innovation network in China. Habitat Int 49, 484–496.
Li, Y. C., and Phelps, N. A. (2019). Megalopolitan glocalization: The evolving relational economic geography of intercity knowledge linkages within and beyond China's Yangtze River Delta region, 2004-2014. Urban Geogr 40, 1310–1334.
Li, Y., and Wu, F. L. (2013). The emergence of centrally initiated regional plan in China: A case study of Yangtze River Delta regional plan. Habitat Int. 39, 137–147.
Li, Z., and Feng, Z. (2020). Mapping urban networks through inter-firm investment linkages: The case of listed companies in jiangsu, China. Sustainability 12, 89.
Liu, C. L., Niu, C. C., and Han, J. (2019). Spatial dynamics of intercity technology transfer networks in China's three urban agglomerations: A patent transaction perspective. Sustainability 11.
Liu, W. H., Liang, Y. J., Bao, X., Qin, J. J., and Lim, M. K. (2022). China's logistics development trends in the post COVID-19 era. Int J Logistics-Research Appl 25, 965–976.
Liu, X., Gong, L., Gong, Y. X., and Liu, Y. (2015). Revealing travel patterns and city structure with taxi trip data. J Transp. Geogr. 43, 78–90.
Luo, X. (2010). Growth politics in urban China: A case study of jiangsu's jiangyin-jingjiang industrial park. China Review-an Interdiscip. J Gt China 10, 39–62.
Luo, X., Shen, J., and Chen, W. (2010). Urban networks and governance in city-region planing: State-led region building in nanjing city-region, China. Geogr Ann Ser B-Human Geogr 92B, 311–326.
Meyer, D. R. (2003). The challenges of research on the global network of cities. Urban Geogr 24, 301–313.
Ministry of Land and Resources of the People’s Republic of China, (2017). Announcement of national minimum price standards for the transfer of industrial land. [Online]. Available: http://g.mnr.gov.cn/201701/t20170123_1428145.html (Accessed November 20, 2021).
Nagurney, A. (2015). Design of sustainable supply chains for sustainable cities. Environ Plan. B-Planning Des 42, 40–57.
Osabuohien, E. S., Efobi, U. R., Odebiyi, J. T., Fayomi, O. O., and Salami, A. O. (2019). Bilateral trade performance in west africa: A gravity model estimation. Afr Dev Review-Revue Afr De Dev 31, 1–14.
Pan, F. H., Bi, W. K., Lenzer, J., and Zhao, S. M. (2017). Mapping urban networks through inter-firm service relationships: The case of China. Urban Stud. 54, 3639–3654.
Pan, F. H., Zhao, S. X. B., and Wojcik, D. (2016). The rise of venture capital centres in China: A spatial and network analysis. Geoforum 75, 148–158.
Pedroza-Gutiérrez, C., and Hernández, J. M. (2020). Social networks and supply chain management in fish trade. SAGE Open 10, 2158244020931815.
Poncet, S. (2003). Measuring Chinese domestic and international integration. China Econ. Rev. 14, 1–21.
Rosvall, M., and Bergstrom, C. T. (2008). Maps of random walks on complex networks reveal community structure. Proc. Natl. Acad. Sci. U. S. A. 105, 1118–1123.
Sassen, S. (2001). “The global city. New york, london, tokyo,” in Political science quarterly (Princeton, NJ, USA: Princeton University)–107.
Seo, I., and Sonn, J. W. (2019). The persistence of inter-regional hierarchy in technology transfer networks: An analysis of Chinese patent licensing data. Growth Change 50, 145–163.
Shandong Provincial Department of Justice, (2021). Notice of the People’s government of Shandong on the announcement of the provincial minimum wage standards. [Online]. Available: http://sft.shandong.gov.cn/articles/ch04359/202109/817d20eb-1509-4aa9-8e54-3ab011cca7c8.shtml (Accessed November 20, 2021).
Singh, S., Kumar, R., Panchal, R., and Tiwari, M. K. (2021). Impact of COVID-19 on logistics systems and disruptions in food supply chain. Int J Prod Res 59, 1993–2008.
Taylor, P. J., Catalano, G., and Walker, D. R. F. (2002). Measurement of the world city network. Urban Stud 39, 2367–2376.
Thilmany, D., Canales, E., Low, S. A., and Boys, K. (2021). Local food supply chain dynamics and resilience during COVID-19jel codes. Appl Econ Perspect Policy 43, 86–104.
Turkina, E., Van Assche, A., and Kali, R. (2016). Structure and evolution of global cluster networks: Evidence from the aerospace industry. J Econ. Geogr 16, 1211–1234.
Wang, J., Du, D., and Huang, J. (2020a). Inter-city connections in China: High-speed train vs. inter-city coach. J Transp Geogr. 82.
Wang, L., Zhang, F., Zang, Y., and Duan, J. (2022). Understanding the regional integration process from the perspective of agglomeration and urban networks: Case study in central China. Int J Environ Res Public Health 19.
Wang, X., Ding, S., Cao, W., Fan, D., and Tang, B. (2020b). Research on network patterns and influencing factors of population flow and migration in the Yangtze River Delta urban agglomeration, China. Sustainability 12.
Wang, X. P., Zhu, K., Li, Y. C., and Xu, J. B. (2017). Applicability and prospect of China's development zone model in Africa. Chin Geogr Sci 27, 860–874.
Xu, H., Qiu, L., Liu, B. Z., Liu, B., Wang, H., and Lin, W. F. (2021). Does regional planning policy of Yangtze River Delta improve green technology innovation? Evidence from a quasi-natural experiment in China. Environ Sci Pollut Res, 28, 62321–62337.
Yan, Y. R., and Wang, X. P. (2021). Global contraction and local strengthening of firms' supply and sales logistics networks in the context of COVID-19: Evidence from the development zones in Weifang, China. Isprs Int Journal Geo-Information 10.
Zhang, E. C., Yu, C., and Han, W. (2022). China’s auto industry may grind to a halt amid Shanghai lockdown. Caixin global. [cited 2022 June 29]. Available from: https://www.caixinglobal.com/2022-04-16/chinas-auto-industry-may-grind-to-a-halt-amid-shanghai-lockdown-101871150.html.
Zhang, W. Y., Derudder, B., Wang, J. H., and Witlox, F. (2020). An analysis of the determinants of the multiplex urban networks in the Yangtze River Delta. Tijdschr Voor Econ En Soc Geogr 111, 117–133.
Zhang, Y., Wang, X., Ji, M., Chen, Y., and Yan, F. (2022). Evaluating the barrier of typical production factor flow in the Chengdu-Chongqing Urban Agglomeration based on multi-source big data. Front Environ Sci. 10.
Zhao, M. X., Wu, K., Liu, X. J., and Derudder, B. (2015). A novel method for approximating intercity networks: An empirical comparison for validating the city networks in two Chinese city-regions. Journal Geogr Sci 25, 337–354.
Zhao, Y. L., and Ni, J. L. (2018). The border effects of domestic trade in transitional China: Local governments' preference and protectionism. China Econmy 51, 413–431.
Zhu, Q. H., and Sarkis, J. (2004). Relationships between operational practices and performance among early adopters of green supply chain management practices in Chinese manufacturing enterprises. Journal Operations Management 22, 265–289.
Zong, G. (2018). More than 70% of Shandong’s top 100 enterprises are engaged in manufacturing. [Online]. Dazhong Daily. Available: http://www.shandong.gov.cn/art/2018/7/17/art_97564_341583.html?from=singlemessage (Accessed November 20, 2021).
APPENDIX A
QCC is a leading enterprise credit information inquiry platform in China. According to the information provided by the official website of QCC, the list of manufacturers’ suppliers was mainly acquired from the prospectus, bidding announcements, customer announcements, corporate annual reports, semi-annual reports, supplier announcements, and judicial data.
APPENDIX B
The city network established by the partnership of listed manufacturers and their suppliers covered 135 out of 137 county-level administrative units in Shandong, as there were no listed manufacturers and their suppliers in Changdao County, Yantai, or Xiajin County, Dezhou.
Keywords: city supply network, supply chain, spatial characteristic, influencing factor, manufacturing, quadratic assignment procedure (QAP), regional planning, social network analysis (SNA)
Citation: Yan Y, Wang X, Zhao S and Zhang Y (2023) Spatial structure and influencing factors of regional city supply networks in manufacturing: A case study of Shandong, China. Front. Environ. Sci. 11:1107835. doi: 10.3389/fenvs.2023.1107835
Received: 25 November 2022; Accepted: 23 January 2023;
Published: 02 February 2023.
Edited by:
Alireza Goli, University of Isfahan, IranReviewed by:
Roberto Alonso González-Lezcano, CEU San Pablo University, SpainBaogui Xin, Shandong University of Science and Technology, China
Copyright © 2023 Yan, Wang, Zhao and Zhang. This is an open-access article distributed under the terms of the Creative Commons Attribution License (CC BY). The use, distribution or reproduction in other forums is permitted, provided the original author(s) and the copyright owner(s) are credited and that the original publication in this journal is cited, in accordance with accepted academic practice. No use, distribution or reproduction is permitted which does not comply with these terms.
*Correspondence: Xingping Wang, d3hwc3hAc2V1LmVkdS5jbg==