 Miaomiao Ma1
 Bo Huang
 Yuyu Li
- 1College of Economics and Business Administration, Chongqing University, Chongqing, China
- 2College of Computer and Information Science, Chongqing Normal University, Chongqing, China
The adoption of new energy vehicles (NEVs) can effectively reduce vehicle exhaust emissions and achieve carbon peaking and carbon neutrality goals in the transportation sector. To facilitate the development of NEVs, the Chinese government issued the dual credit policy (DCP). However, whether the DCP can promote the technological innovation of NEVs and effectively reduce carbon emissions in the transportation sector remains to be studied. This study constructed the decision-making model of NEVs under the DCP and obtained the optimal strategy to study the impact of the DCP on carbon emissions. Furthermore, we constructed a bargaining game model based on an alliance strategy to demonstrate the coordination of the NEV supply chain. The results showed that implementing the DCP can effectively reduce carbon emissions in the transportation field. The higher the technological innovation credit coefficient or credit price, the more significant the DCP’s incentive effect on reducing carbon emissions. Decentralized decision-making weakens the DCP’s incentive effect on reducing carbon emissions. The bargaining game based on alliance negotiation can enable independent companies to achieve carbon emission reduction when making centralized decisions so that the DCP’s incentive effect on reducing carbon emissions is optimized. The alliance between manufacturers is not to increase profits but to enhance their product advantages. However, suppliers can gain higher profits by participating in the alliance, which provides a theoretical reference for the alliance’s cooperation in decision-making.
1 Introduction
According to the BP World Energy Statistical Yearbook, China is the world’s highest carbon emitter. China’s carbon emissions increased at an average annual rate of 1.2% from 2016 to 2019, exceeding the global average annual growth rate of 0.8% (Statistical, 2020). China announced, at the 75th session of the United Nations General Assembly, that it aims to peak carbon dioxide emissions before 2030 and achieve carbon neutrality before 2060 (Chen and Chao, 2021). With the rapid development of motor vehicles, carbon emissions in the transportation field account for 15% of the country’s terminal carbon emissions and the average annual growth rate in the transportation field has remained above 5% (Yang et al., 2014). Therefore, reducing the exhaust emissions of motor vehicles is extremely important to achieve carbon peaking and carbon neutrality goals in the transportation sector.
With low-carbon advantages, such as no petroleum fuel consumption and exhaust emissions, new energy vehicles (NEVs) have become the automotive industry’s leading choice in achieving carbon peaking and neutrality (Jenn et al., 2019; Bonsu, 2020; Zhao et al., 2021). However, NEVs are currently unable to achieve mass uptake—the low level of technology is the key factor that restricts the continuous growth in the sales of NEVs. To support NEV companies in increasing technological innovation investment and to promote the development of NEVs, the Ministry of Industry and Information Technology and five other ministries and commissions jointly issued the dual credit policy (DCP) (Ministry of Industry and Information Technology, 2020). Under the DCP, each NEV can receive a certain amount of credits, and manufacturers sell credits in the credit market to receive credit revenue. Moreover, the higher the NEVs’ technical level, the higher the credits. However, the NEVs’ technology improvement depends on technological breakthroughs in parts and components, and therefore, suppliers are required to bear the burden of investment in technological innovation. Facing high technological innovation investment and high risk, suppliers’ willingness to innovate is not strong and their enthusiasm is not high. Therefore, how to effectively motivate suppliers to invest in technological innovation under the DCP, improve the NEVs’ technological level, and reduce carbon emissions in the transportation sector are urgent problems to resolve.
Under the development concept of coordination, openness, and sharing, the formation of alliances has become an essential method of enterprise cooperation. In the NEV supply chain, Mercedes-Benz and CATL have reached a strategic partnership, in which CATL provides module-less battery packs for Mercedes-Benz passenger car products. Module-less battery packs directly integrate battery cells into the battery pack, saving the traditional module link. The integrated advanced battery system gives Mercedes-Benz cars better range, charging speed, safety, and sustainability (CATL, 2020). BMW Group and Envision Power have reached a long-term cooperation agreement. The next-generation lithium-ion battery cells developed by Envision Power can enable BMW Group’s new models to show outstanding performance with high performance, high safety, and zero carbon emissions (BMW Group, 2022). Enterprise alliances and cooperation help secure the resources needed in the global market and help enhance the market competitiveness of enterprises. However, alliance cooperation between enterprises will cause changes in the NEV supply chain structure, which will usually affect the interests of multiple subjects.
Therefore, this paper constructs a technological innovation decision-making model and a bargaining game model based on an alliance strategy under the DCP in order to study the DCP’s impact on technological innovation and carbon emissions. We need to solve three problems: first, whether the DCP can promote the NEVs’ technological innovation and effectively reduce carbon emissions in transportation, and how can the policy be adjusted to prompt this effect? Second, how can suppliers be effectively motivated to invest in technological innovation and reduce carbon emissions in transportation, realizing the optimal incentive effect? Third, what impact does alliance cooperation in the NEV supply chain have on enterprises?
There are three main contributions to this paper. First, we develop a game model of the NEV supply chain and demonstrate the DCP’s positive incentive effect on reducing carbon emissions in the transportation field through rigorous theoretical deduction, which provides a theoretical basis for the government to achieve carbon peaking and carbon neutrality goals in the transportation sector by adjusting the DCP. Second, we demonstrate that the supplier can be effectively incentivized to increase its investment in technological innovation by centralizing decision-making and profit-sharing mechanisms, making the incentive effect of the DCP on technological innovation and reducing carbon emissions in transportation optimal. Third, we demonstrate that an alliance between the manufacturer and supplier is not to increase profits but to enhance their product advantages, and suppliers can gain higher profits by participating in the alliance, providing a theoretical reference for decision-making.
The rest of this paper is as follows: Section 2 reviews the related literature, Section 3 introduces the studied problem and builds the model, Section 4 solves the model and analyzes the optimal solution, Section 5 presents the coordination strategy, Section 6 discusses the numerical example and sensitivity analysis, Section 7 is the discussion, and Section 8 outlines the conclusion.
2 Literature review
This research involves two streams of the literature, namely, on dual credit policy and supply chain coordination.
2.1 Dual credit policy
Given that China’s implementation of the DCP is only recent, research on the DCP is still in its infancy and has inconsistent conclusions.
Some scholars believe that the DCP can positively stimulate the development of NEVs. For example, Dong and Zheng studied the impact of DCP on enterprises’ total factor productivity and believed that the policy could significantly improve the technological productivity of enterprises (Dong and Zheng, 2022). Wang et al. (2020) concluded that the DCP could increase the willingness of enterprises to innovate green technology. Yang et al. (2021) believed that the DCP could positively stimulate NEVs’ development, and a moderate credit price could improve the NEVs’ technical level. Zhou et al. (2019) found that the DCP raises the green technology threshold for NEVs. Li et al. (2020) studied the impact of DCP on manufacturers’ R&D decisions and proved that DCP could effectively replace the subsidy policy to promote NEVs’ development. Ma et al. (2021) found that implementing the DCP could significantly increase the supply chain investment in the NEVs’ R&D and improve the NEVs’ technical level. Zhou and Shen believed that the DCP incentivizes automakers to develop more NEV modes and improve manufacturers’ production capacity (Zhou and Shen, 2020).
Some scholars believe that the DCP cannot achieve the expected incentive effect and needs further revision. For instance, Lou et al. (2020) found that the DCP might not help manufacturers improve NEVs’ technical level. He et al. (2021) believed that the gradual tightening of the DCP would effectively promote electric vehicle R&D intensity. Kong et al. (2022) believed that the DCP could promote the sustainable development of the automobile industry, but the incentive effect on NEVs is limited. Cheng and Fan pointed out that a higher credit price is more conducive to promoting the expansion of NEVs than setting a higher proportion of NEV production (Cheng and Fan, 2021). Zhao et al. (2019) believed that the DCP could promote the technological innovation of NEVs but would lose its role in promoting technological innovation in 2025 or earlier. Meng et al. (2022) found that the DCP promotes the development of the NEV industry, whereas the capital constraints weaken the incentive effect of the DCP. Ma et al. (2023) found that when there is information asymmetry in the supply chain, the incentive effect of the DCP is weakened.
Throughout the literature, scholars have not studied much on the impact of the DCP on the NEVs’ technological innovation, and the research conclusions are inconsistent. Moreover, there is almost no research on the impact of the DCP on carbon emissions in transportation. Therefore, the impact of the DCP on technological innovation and carbon emission reduction needs to be explored further. Considering the background of the DCP, it combines technology innovation with carbon emission reduction in transportation and provides a new research idea for future research.
2.2 Supply chain coordination
Coordination between manufacturers and suppliers is a crucial issue in supply chain management, and many scholars have studied supply chain coordination by designing a series of contracts. For example, Li et al. (2019) introduced an incentive compatibility mechanism, studied a low-carbon supply chain’s emission reduction cooperation mechanism, and explored the impact of cooperative decision-making contracts on supply chain performance. He et al. (2019) studied the online shopping supply chain containing a single online retailer and a third-party logistics enterprise and adopted a bilateral effort cost-sharing contract to realize coordination. Wang et al. (2017) considered consumers’ low-carbon preferences and studied the supply chains’ coordination under wholesale price contracts and cost-sharing contracts. Cachon and Lariviere believed that revenue-sharing contracts could coordinate supply chains with a single retailer and distribute supply chain profits arbitrarily (Cachon and Lariviere, 2005). He et al. studied the coordination by various contract types when supply and demand are uncertain, such as the contract of supplier management inventory partnership plus production subsidy, the revenue-sharing contract with advance purchase discount, the contract combining the return policy and wholesale price, and the return policy and sales discount and penalty contract (He et al., 2009; He and Zhao, 2012; He and Zhao, 2016). Dai studied the supply chain coordination contract in the context of retailers’ financial constraints (Dai, 2020).
The bargaining model is most commonly used to analyze cooperation between firms (Nash, 1953). For example, Guo and Iyer analyzed the multilateral bargaining problem between manufacturers and retailers, and believed that when the difference in retailer’s sales price is insignificant, the manufacturer will choose to negotiate the price simultaneously. When the price difference is significant, the manufacturer will negotiate the price sequentially (Guo and Iyer, 2013). Feng and Lu analyzed outsourcing decisions and contract choices in the supply chain based on a bargaining model (Feng and Lu, 2013a; Feng and Lu, 2013b). Basak (2017) compared and analyzed the competitive model and competitive enterprises that can be used to obtain optimal profits, applying the bargaining model (Basak, 2017). Zhang et al. (2017) demonstrated the impact of enterprises’ bargaining power and centralized procurement efficiency on enterprises’ willingness to participate in centralized procurement efficiency on enterprises’ willingness to participate in centralized procurement in China’s pharmaceutical market. Escapa and Gutierrez quantitatively studied the distribution of the potential benefits between countries based on bargaining models (Escapa and Maria, 1997).
Scholars have studied the supply chain’s coordination mechanism from different perspectives, providing a solid theoretical and methodological reference for analyzing the coordination of the NEV supply chain. However, existing research mainly focuses on enterprises’ one-on-one cooperation and competition, lacking consideration of reality. In the NEV supply chain, it is common for a manufacturer to cooperate with multiple suppliers, in which case, how the manufacturer incentivizes multiple suppliers to cooperate in technological innovation, realizing supply chain coordination? This paper designs centralized decision-making and profit-sharing mechanisms, which effectively motivate suppliers to increase investment in NEVs’ technological innovation, which provides a theoretical frame for future research.
3 Problem description and model
3.1 Problem description
Most of the carbon emissions in the transportation sector come from the exhaust emissions caused by fossil energy such as gasoline and diesel consumed during the operation and use phase of automobiles. In contrast, NEVs do not rely on fossil fuels, significantly reduce vehicle exhaust emissions, and alleviate environmental pollution; therefore, developing NEVs is an effective way to achieve carbon peaking and carbon neutrality goals in transportation. According to statistics, the market share of NEVs will increase by 1% and carbon emissions will reduce by 1.29 million tons. A 1% reduction in the electricity consumption coefficient of pure electric vehicles will reduce carbon emissions by 510,000 tons; however, whether the NEVs’ market share increases or the power consumption coefficient of electric vehicles is reduced depends on improvement in NEVs’ technical level and investment in technological innovation.
A NEV supply chain consists of one manufacturer and multiple parts suppliers. Suppliers are responsible for investment in the technological innovation of parts, and the technological innovation level determines the technical level of NEVs. The manufacturer procures parts from suppliers and sells the NEVs to customers after the manufacturer completes production.
Under the DCP, each NEV will receive a specific amount of credit and manufacturers sell NEV credits in the credit market to obtain credit revenue. At the same time, the number of credits is related to NEV’s technical level, and the higher the technical level, the higher the NEV credits per vehicle. Thus, the DCP will significantly affect the technological innovation investment decisions of the NEV supply chain.
The NEV supply chain companies can choose decentralized and centralized decision-making modes to decide on technological innovation investment. When the NEV supply chain chooses to make decentralized decisions, the manufacturer and supplier determine technological innovation investments and prices through the Stackelberg game to maximize their profits. When the NEV supply chain chooses to make centralized decisions, supply chain companies decide NEVs’ technological innovation investments and sales prices together to maximize supply chain profits.
Furthermore, the manufacturer may form alliances with suppliers to participate in profit distribution negotiations. The decision-making process is as follows: the manufacturer decides to align with the supplier. Manufacturers and suppliers then make decisions to maximize total profit, including decisions on technological innovation, sales prices, and negotiation sequence. If the manufacturer does not align with the supplier, the manufacturer bargains with the supplier sequentially, determines the supplier’s profit, and signs a contract. If the manufacturer and a supplier ally, the alliance first negotiates with the supplier sequentially, then the alliance will determine the parties’ profits and a contract will be signed according to the agreed profit distribution rules. Finally, the NEV supply chain will conduct technological innovation, procurement, production, and sales based on the cooperation contract to achieve their respective profits.
3.2 Model
The NEV market demand function is
Under the DCP, the profits of NEV manufacturers are affected by the revenue from NEV credit trading. Each NEV at the current level of technology
Suppose the credit price is
Considering that the technological innovation investment of the component supplier is
The NEVs’ carbon emission reduction comes from two aspects: the replacement of fuel vehicles by NEVs and the reduction of carbon emissions brought about by the technological innovation of NEVs, such as the lower electric energy consumption. Considering each fuel vehicle’s carbon emissions is
Thus, the profit function of the supplier
The manufacturer’s profit consists of NEV sales revenue and credit revenue, and the profit function is
where
4 Model solving and analysis
4.1 Optimal strategy for the NEV supply chain under the DCP
4.1.1 Optimal solution for decentralized decision-making
Under the DCP, when the NEV supply chain makes decentralized decisions (labeled
We adopt the reverse induction method in this section to solve the optimal solution.
First, suppliers decide the technological innovation investment and parts price to maximize their profits.
Derive Eq. 1 from
Then, the manufacturer decides on NEV sales prices intending to maximize its profits. Substituting
Furthermore, we obtain the optimal strategy under decentralized decision-making:
4.1.2 Optimal solution for centralized decision-making
Under the DCP, the NEV supply chain makes centralized decisions (marked
Therefore, the profit of the NEV supply chain is
Equation 3 is derived from
Furthermore, we obtain the optimal strategy under centralized decision-making
4.2 Optimal decision-making without the DCP
4.2.1 Optimal solution for decentralized decision-making
Without the DCP,
The profit function of the supplier
The profit function of the manufacturer is
If the NEV supply chain makes decentralized decisions (labeled
By solving via reverse induction, we can obtain the optimal strategy
4.2.2 Optimal solution for centralized decision-making
Without the DCP,
If the NEV supply chain makes centralized decisions (labeled
Solving Eq. 6, we get the optimal strategy
Proposition 1. The DCP can stimulate the NEV supply chain to increase technological innovation investment, raise the technical level and sales of NEVs, and effectively reduce carbon emissions in the transportation field.Proof. The optimal strategy with and without a DCP is compared. First, let us compare the optimal strategy under decentralized decision-making. Substituting
.Q.E.D.
Compared to the scenario without the DCP, implementing the DCP stimulates the NEV supply chain to increase technological innovation investment and enhance NEVs’ technical level. The DCP will promote the transformation of the NEV supply chain in “relying on technology” to obtain core competitiveness.Moreover, the continuous improvement of NEVs’ technical level, the increasing number of NEVs, and the continuous increase in the NEVs’ market share will help the energy upgrading and transformation of the transportation industry, thereby significantly reducing the total carbon emissions from the transportation sector and enabling the carbon peaking and carbon neutrality goals of this sector to be achieved quickly.
Proposition 2. Under the DCP, the higher the technological innovation credit coefficient or credit price, the higher the NEVs’ technical level, the higher the NEV sales, and the more significant the incentive effect of the DCP on reducing carbon emissions in the transportation industry.Proof. Deriving
Q.E.D.
Proposition 2 shows that the DCP always affects the optimal strategy. With the increase of the credit price or technological innovation credit coefficient, the higher the NEVs’ technical level, the higher the sales. Moreover, by improving their technical level and sales of NEVs, carbon emissions in the transportation field can be reduced more effectively. Therefore, the DCP can not only encourage NEV companies to continuously improve the technological innovation of NEVs and enhance the industry’s rapid development but also promote carbon emission reduction in the transportation sector, allowing this sector to achieve its carbon peaking and carbon neutrality goals faster.The government can promote healthy development of the NEV industry by adjusting the technological innovation credit coefficient or credit price, and reduce carbon emissions in the transportation field by adjusting the DCP.
Proposition 3. The higher the carbon emissions of fuel vehicles, the higher the replacement rate of fuel vehicles by NEVs and the more significant the incentive effect of the DCP on reducing carbon emissions. The higher the emission reduction coefficient of NEV technology innovation, the more significant the incentive effect of DCP on reducing carbon emissions.Proof. Deriving
Q.E.D.
Proposition 3 shows that the DCP can motivate NEV companies to increase investment in technological innovation, improve the technical level of NEVs, and increase consumers’ intention to purchase them, thereby increasing the replacement rate of fuel vehicles by NEVs and effectively reducing carbon emissions in the transportation field. Moreover, the higher the replacement rate of fuel vehicles by NEVs, the more significant the emission reduction effect.Meanwhile, the higher the carbon emissions of fuel vehicles, the more significant the incentive effect of the NEVs’ development on carbon emission reduction in transportation. Moreover, the higher the emission reduction coefficient of technological innovation of NEVs, the stronger the effect of the DCP on reducing carbon emissions in the transportation field.
Proposition 4. Decentralized decision-making harms the DCP’s incentive effect and weakens the DCP’s incentive effect on emission reduction in the transportation field.
Proof. We compare and analyze the optimal solution for decentralized and centralized decision-making. Substituting
Q.E.D.
Compared to centralized decision-making, under decentralized decision-making, the investment in technological innovation of NEVs is reduced, NEVs’ technical level decreases, and the impact of the NEVs’ development on carbon emission reduction weakens. Decentralized decision-making harms the DCP’s incentive effect, and decentralized decision-making weakens the DCP’s incentive effect on emission reduction in the transportation field.Therefore, it is essential to implement a coordinated strategy to enable independent companies to achieve the optimal strategy under centralized decision-making, encourage the NEV supply chain to increase investment in technological innovation, improve the NEVs’ technical level, strengthen the DCP’s incentive effect on emission reduction in the transportation field, significantly reduce pollutant emissions in the transportation field, and achieve carbon peaking and carbon neutrality goals in the transportation field faster.
5 The NEV supply chain coordination strategy
Compared to decentralized decision-making, the profit increase is
Therefore, the next step will be to discuss distributing the profit increase
Considering that manufacturers and suppliers negotiate the allocation of the increased profit
There are
where
5.1 Non-alignment between the supplier and manufacturer
Considering that component suppliers provide complementary parts to manufacturers, the importance of these parts is roughly the same and the negotiating power of component suppliers does not differ much. Without losing generality, we further assume that the manufacturer has the same negotiating power for suppliers
When the supplier participates in the
Therefore, when suppliers and manufacturers negotiate sequentially, component suppliers’ profits are affected by both negotiation power and the negotiation sequence. Negotiating earlier allows the supplier to obtain more profits. Similarly, delays in the sequence of negotiations can also result in a loss of supplier profits. However, when manufacturers participate in the
Proposition 5. When the manufacturer does not align with the supplier, the supplier
Proof. Suppose the supplier participates in the
Q.E.D.
After the supplier gives the manufacturer a concession, regardless of which negotiations the supplier participates in, it can only obtain the profit from participating in the final round of negotiations, which is the minimum profit the supplier can obtain by participating in the negotiations. The manufacturer’s profit is the total of its negotiated profit and the concession of all suppliers, and the manufacturer obtains a higher profit because of their right to decide the negotiation sequence.However, compared to decentralized decision-making, a profit distribution strategy can increase the profits of suppliers
5.2 Alliances between the manufacturer and supplier
Consider that in an alliance between a manufacturer and a supplier,
When the supplier
Proposition 6. When the manufacturer participates in negotiations after allying with the supplier and reaches equilibrium, the profit of the supplier who does not participate in the alliance is
Proof. It can be seen from the proof of Proposition 5 that when the supplier
Q.E.D.
When the manufacturer allies with a supplier, the alliance receives excess profits due to the right to decide the negotiation sequence. The manufacturer and supplier share the alliance profits through bargaining negotiations, and suppliers receive higher profits by participating in the alliance. Suppliers who do not participate in the alliance cooperation can only receive the final round of negotiations’ profit and the minimum profit suppliers can obtain by participating in negotiations.
Proposition 7. When the manufacturer allies with a supplier, the profit of all suppliers increases. The supplier who participates in the alliance receives more profit than the supplier who does not. However, the profit of the manufacturer decreases due to the alliance.
Proof. Substituting
Q.E.D.
When the manufacturer and supplier form alliances, the profits of all suppliers are improved, suppliers who participate in cooperation can obtain more profits than those who do not participate in cooperation, suppliers will actively cooperate with manufacturers, and manufacturers have the initiative to choose partners.However, the manufacturer has aligned themselves with the supplier, resulting in lower profits. Therefore, for manufacturers, alliances do not increase profits, although they enhance their products’ competitive advantage, and it is necessary to choose partners carefully. The research also explains why the manufacturer partners with component suppliers with advanced technology advantages.
6 Numerical analysis and sensitivity analysis
6.1 Numerical analysis
The following analysis is carried out through an example to visually demonstrate the influence of different parameter values on optimal strategies. For example, we use four suppliers of parts to perform numerical analysis. The parameters are as follows:
We can obtain the optimal strategy by substituting parameters, as shown in Table 1.

TABLE 1. Optimal strategies for the NEV supply chain.
After implementing the DCP, the technical level and sales of NEVs have increased and the carbon emissions in the transportation field have significantly reduced. The DCP can promote the NEV industry’s development and reduce carbon emissions.
However, we found that the incentive effect of the DCP on NEV technology innovation, sales, and carbon emission reduction is much lower than that under centralized decision-making. Decentralized decision-making weakens the incentive effect of the DCP. Only by making centralized decisions by NEV supply chain companies can the DCP’s incentive effect be optimized.
Therefore, it is essential to design an incentive mechanism to coordinate the NEV supply chain so that independent and decentralized companies can achieve centralized decision-making.
As seen from Table 2, if the supply chain makes centralized decisions, the profits are significantly improved compared to those under the decentralized decision-making. For NEV companies that seek to maximize profits, it is easy to achieve cooperation as long as this can improve profits. By bargaining for the distribution of incremental profits, both suppliers and manufacturers gain more profits than under decentralized decisions. Therefore, the incentive system based on the bargaining game achieves coordination of the NEV supply chain and promotes centralized decision-making by NEV companies.

TABLE 2. Profits of suppliers and the manufacturer.
As seen from Table 2, when suppliers individually negotiate on a one-on-one basis with manufacturers in the order of negotiation, the profits of all suppliers are improved, and all suppliers’ profits increase by the same amount. When a given supplier and the manufacturer are aligned to negotiate, all suppliers’ profits increase and the given supplier’s profits increase by much more than those of other suppliers. Therefore, forming alliances with manufacturers is the best choice for suppliers to obtain more profits. However, manufacturers’ profits decline after the formation of such an alliance. Therefore, the purpose of the alliance of manufacturers is different from that for suppliers, i.e., not to increase profits but to cooperate with suppliers with technological advantages to enhance product competitiveness.
6.2 Sensitivity analysis
6.2.1 Influence of the DCP
① The impact of the technological innovation credit coefficient
As seen in Figures 1A, B, NEV technology has improved, regardless of the decision-making mode after implementing the DCP compared to without the DCP. Moreover, the higher the technological innovation credit coefficient, the higher the NEVs’ technology level. As seen from Figures 1C, D, implementing the DCP has increased NEV sales under decentralized and centralized decision-making. Moreover, the higher the technological innovation credit coefficient, the higher the NEV sales. As seen from Figures 1E, F, after the implementation of the DCP, regardless of the decision-making mode, the supplier’s technological innovation investment increases, and the higher the technological innovation credit coefficient, the higher the supplier’s technological innovation investment. As seen from Figures 1G, H, after implementing the DCP, carbon emissions in the transportation field are reduced under decentralized and centralized decision-making. With the improved credit coefficient of technological innovation, the impact of the DCP on carbon emission reduction in the transportation field is more significant.
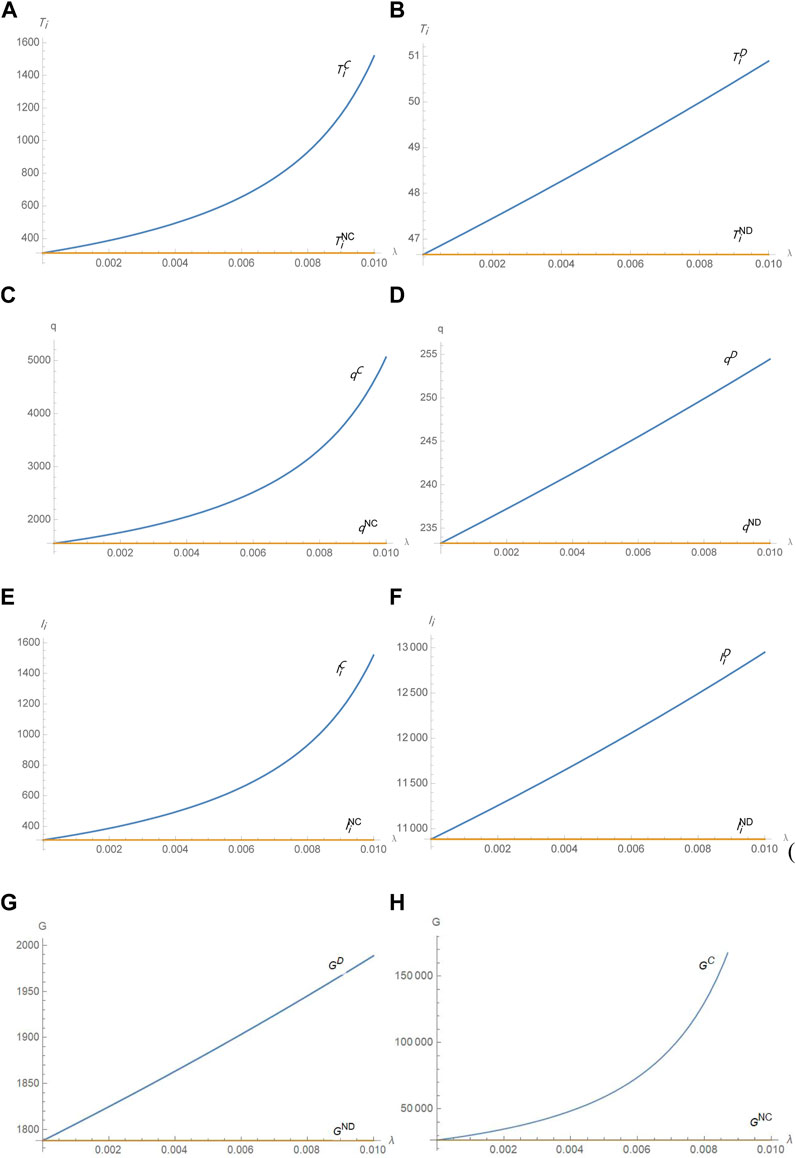
FIGURE 1. Impact of the technological innovation credit coefficient on the optimal strategy.
② The impact of credit prices
As seen from Figures 2A, B, after the DCP’s implementation, the NEVs’ technology level improves, regardless of the decision-making mode. Moreover, the higher the credit price, the higher the NEVs’ technology level. As seen from Figures 2C, D, NEV sales increased after implementing the DCP. Moreover, the higher the credit price, the higher the NEV sales. According to Figures 2E, F, after the implementation of the DCP, regardless of the decision-making mode, the supplier’s technological innovation investment increases, and with the increase in the credit price, the higher the technological innovation investment. As seen from Figures 2G, H, carbon emissions in the transportation sector reduce after the implementation of the DCP. With the increase in credit prices, the impact of the DCP on carbon emission reduction in the transportation field is more significant.
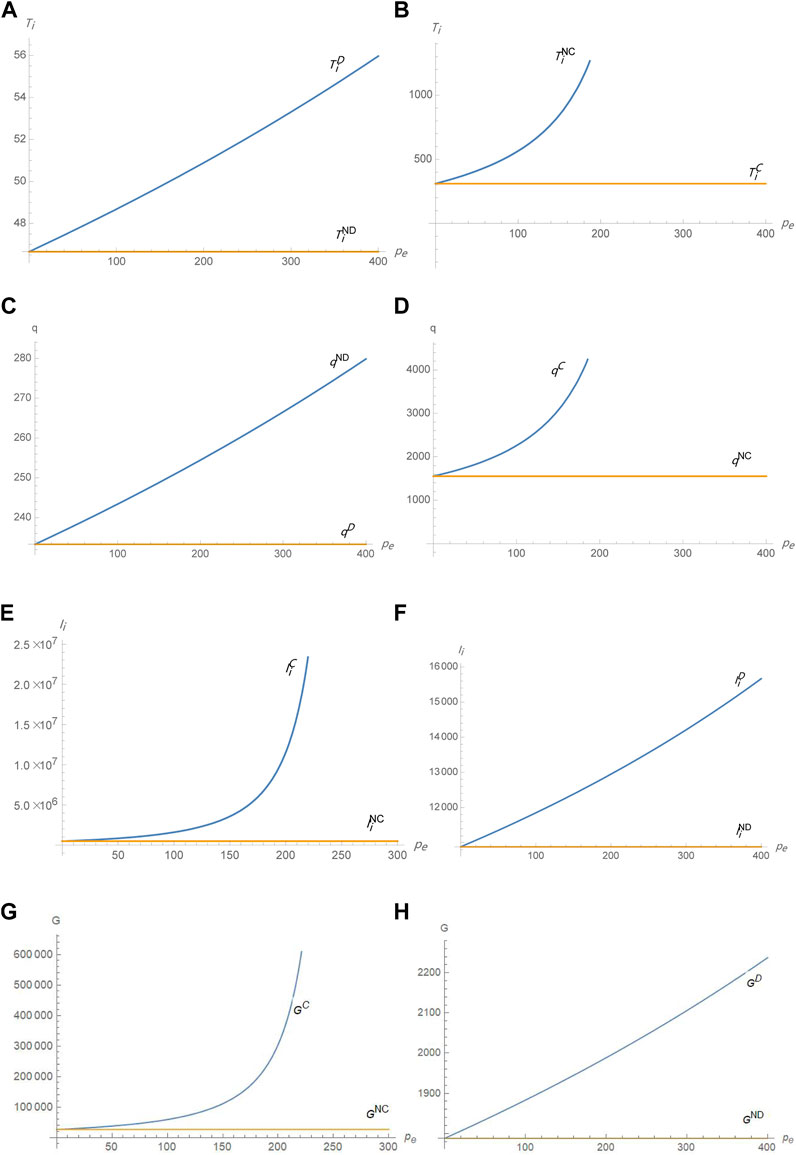
FIGURE 2. Impact of credit prices on the optimal strategy.
6.2.2 Impact of decision-making methods
As seen from Figures 3A, C, F, G, compared to the decentralized decision-making, the investment in NEV technology innovation increases, the technical level of NEVs increases, NEV sales increase, and carbon emission reduction increases under the centralized decision-making. Moreover, the higher the credit coefficient of technological innovation, the more significant the advantages of centralized decision-making.
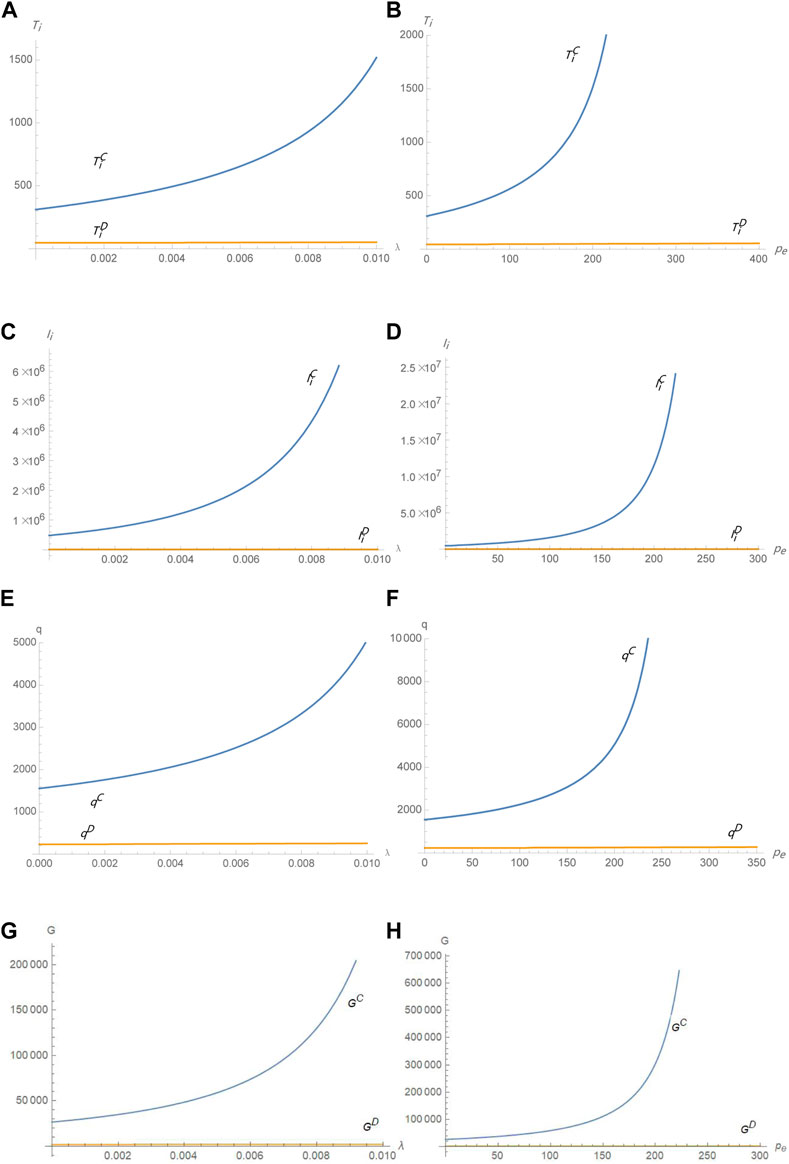
FIGURE 3. Impact of decision-making on the optimal strategy.
As seen from Figures 3B, D, E, H, compared to the decentralized decision-making, the investment in NEV technology innovation increases, NEVs’ technical level increases, NEV sales increase, and carbon emission reduction increases under the centralized decision-making. Moreover, the higher the credit price, the more significant the advantages of centralized decision-making.
6.2.3 Impact of alliance negotiations
As seen from Figures 4A, B, the manufacturer and supplier are more profitable under the centralized decision-making than under the decentralized decision-making and obtain incremental profits based on bargaining negotiations. Therefore, the coordination strategy is the optimal strategy for centralized decision-making, improving the technological innovation investment and technical level of NEVs, reducing carbon emissions in the transportation field, and increasing the profits of all companies, thus representing a win–-win situation.

FIGURE 4. Impact of alliance cooperation on corporate profits.
As seen from Figure 4C, when a manufacturer engages in alliances with a supplier, all suppliers are profitable, all suppliers benefit from alliances, and the suppliers who participate in cooperation earn more margins than suppliers who do not. As seen from Figure 4D, the manufacturer’s profits decrease, proving that the manufacturer is not aligned to improve profits.
7 Discussion
The Chinese government issued the DCP intending to promote the development of NEVs through market incentives. Some researchers believe that the DCP could achieve China’s goals in this regard. The DCP can stimulate manufacturers and suppliers to increase investment in NEVs’ technological innovation, improve NEVs’ technology level, and promote NEVs’ large-scale promotion (Zhou and Shen, 2020; Ma et al., 2021; Yang et al., 2021). Our research confirms this view.
Next, we discuss the essential parameters involved in the proposed models.
Under the DCP, as the technological innovation credit coefficient or credit price increases, the DCP’s incentive effect on the development of the NEV industry and the reduction of carbon emissions in transportation become more significant. Therefore, the government can set and adjust the technological innovation credit coefficient to prompt the NEV industry’s healthy and sustainable development and achieve the transportation sector’s carbon peak and carbon neutrality goals.
The decentralized decision-making weakens the incentive effect of the DCP on technological innovation investment, carbon emission reduction, technology level, and NEV production. With the increase of the technological innovation credit coefficient or credit price, the weakening of the incentive effect of the DCP is more significant. However, the NEV supply chain can achieve one-to-many cooperation through the centralized decision-making and profit-sharing mechanism and could effectively motivate suppliers to increase NEVs’ technological innovation investment and optimize the incentive effect of the DCP.
We found that the impact of alliance negotiations on the profits of manufacturers and suppliers differs. Through bargaining negotiations, both manufacturers and suppliers have obtained more profits than under decentralized decision-making. Moreover, as the manufacturer’s bargaining power increases, the manufacturer’s profit and supplier’s profit decreases. Nevertheless, compared to no alliance, when the manufacturer and a supplier form an alliance, the manufacturer’s profits decrease and the suppliers’ profits increase. The results indicate that the manufacturer’s primary purpose in allying is to enhance their products’ competitiveness rather than to increase their profits, while suppliers could gain more profits by allying.
8 Conclusion
8.1 Main findings
This paper considers the NEV supply chain consisting of one manufacturer and multiple suppliers, constructs a technological innovation decision-making model under the DCP, and studies the optimal technological innovation strategy and the impact of the DCP on carbon emissions. Furthermore, this paper constructs a bargaining game model based on an alliance strategy to study the coordination of the NEV supply chain. Finally, it verifies the DCP’s incentive effect on NEV technology innovation and carbon emission reduction in the transportation field through a numerical example analysis. The main findings of the research are as follows:
① Implementing the DCP can stimulate the NEV supply chain to increase technological innovation investment, improve the technological level and sales of NEVs, and effectively reduce carbon emissions in the transportation sector. Moreover, with the increase of the technological innovation credit coefficient or credit price, the DCP has a significant incentive effect on the technological innovation of NEVs and the reduction of carbon emissions in the transportation sector.
② The decentralized decision-making weakens the incentive effect of the DCP on reducing carbon emissions, and the bargaining game based on alliance negotiation can enable independent enterprises to achieve the optimal strategy for centralized decision-making so that the incentive effect of the DCP on reducing carbon emissions can be optimized.
③ The purpose of an alliance between manufacturers and suppliers is different. For manufacturers, it is not to increase profits but to enhance their product advantages. However, suppliers can profit more by participating in the alliance, providing a theoretical reference for decision-making.
8.2 Theoretical implications
This study bridges the concepts of the DCP, carbon emission reduction, and NEVs’ technological innovation cooperation. The contributions to the existing literature are as follows:
① This paper theoretically further enriched the research content in policy incentive (especially DCP), carbon emission reduction, and technological innovation cooperation of the NEV supply chain, considering the background of the DCP, and combines NEV technological innovation with carbon emission reduction, which provides a new research idea for future research.
② This paper constructs a technological innovation game model of the NEV supply chain under the dual credit policy and a bargaining model considering the alliance. The results show that the NEV supply chain can achieve one-to-many cooperation through centralized decision-making and profit-sharing mechanisms, and could effectively motivate suppliers to increase NEVs’ technological innovation investment and optimize the incentive effect of the DCP, which provides a theoretical reference for future research.
8.3 Practical implications
Based on the main findings, we put forward policy implications as follows:
① The DCP can encourage enterprises to increase investment in NEV technological innovation and significantly reduce carbon emissions in transportation. Moreover, the higher the technology innovation credit coefficient or credit price, the more is invested in technology innovation for NEVs and the more significant the effect on reducing carbon emissions in the transportation sector. Therefore, the government can regulate the NEV industry by setting or adjusting the credit coefficient of technological innovation or credit price, promoting the NEV industry’s healthy and sustainable development, and realizing the carbon peaking and carbon neutrality goals.
② The alliance cooperation between manufacturers and suppliers can improve the suppliers’ profits, enhance the manufacturers’ competitiveness, and achieve a win-win scenario for all parties. The government should encourage alliances among companies to rapidly upgrade NEVs and achieve more quickly the carbon peaking and carbon neutrality goals in transportation.
8.4 Future work
This study has some limitations. First, the demand function is linear and random or other demand function forms deserve further investigation. Second, it is assumed that there is only one supplier for one component. However, there may be different suppliers of the same component; therefore, supplier competition should be considered.
Data availability statement
The original contributions presented in the study are included in the article/Supplementary Material; further inquiries can be directed to the corresponding authors.
Author contributions
BH and YL conceived the original idea for the research and established the model. MM and WM performed the model analyses. MM performed the numerical analyses. All authors drafted and revised the draft.
Funding
This study is supported by the National Social Science Foundation of China (No. 17XGL008), the Fundamental Research Funds for the Central Universities (No. 2020CDJSK02PT12), and the Natural Science Foundation of Chongqing (No. cstc2019jcyj-msxmX0616).
Conflict of interest
The authors declare that the research was conducted in the absence of any commercial or financial relationships that could be construed as a potential conflict of interest.
Publisher’s note
All claims expressed in this article are solely those of the authors and do not necessarily represent those of their affiliated organizations, or those of the publisher, the editors, and the reviewers. Any product that may be evaluated in this article, or claim that may be made by its manufacturer, is not guaranteed or endorsed by the publisher.
References
Basak, D. (2017). Cournot vs. Bertrand under centralised bargaining. Econ. Lett. 154, 124–127. doi:10.1016/j.econlet.2017.02.031
BMW Group (2022). Envision Power Strategy and BMW Group to empower the next generation of electric vehicle platforms with innovative technologies. Available at: https://www.163.com/dy/article/HK8E4E5S0514C30V.html (Accessed 22 10, 2022).
Bonsu, N. O. (2020). Towards a circular and low-carbon economy: Insights from the transitioning to electric vehicles and net zero economy. Clean. Prod. 256 (256), 120659. doi:10.1016/j.jclepro.2020.120659
CachonLariviere, G. P. M. A. (2005). Supply chain coordination with revenue-sharing contracts: Strengths and limitations. Manag. Sci. 51 (1), 30–44. doi:10.1287/mnsc.1040.0215
Cao, X. Y., and Wu, X. Z. (2020). The collaborative strategy for carbon reduction technology innovation on dual-channel supply chain under the carbon tax policy[J]. J. Central China Normal Univ. Nat. Sci. 54 (5), 898–909.
CATL (2020), Deepening cooperation and leading the future, CATL has become a leading supplier in the field of Mercedes-Benz batteries. Available at: https://www.catl.com/news/422.html (Accessed 8 5, 2020).
Chen, Y., and Chao, Q. C. (2021). Carbon peak, carbon neutrality 100Q. Beijing: People’s Daily Press.
Cheng, Y., and Fan, T. (2021). Production coopetition strategies for an FV automaker and a competitive NEV automaker under the dual-credit policy. Omega 103, 102391. doi:10.1016/j.omega.2020.102391
Dai, J. S. (2020). Analysis of the impact of retailers’ financial constraints on coordination contracts[J]. China J. Manag. 28 (10), 98–108.
Dong, F., and Zheng, L. (2022). The impact of market-incentive environmental regulation on the development of the new energy vehicle industry: A quasi-natural experiment based on China's dual-credit policy. Environ. Sci. Pollut. Res. 29 (4), 5863–5880. doi:10.1007/s11356-021-16036-1
Escapa, M., and Maria, J. G. (1997). Distribution of potential gains from international environmental agreements: The case of the greenhouse effect. J. Environ. Econ. Manag. 33 (1), 1–16. doi:10.1006/jeem.1996.0974
Feng, Q., and Lu, L. X. (2013). Supply chain contracting under competition: Bilateral bargaining vs. Stackelberg. Prod. Operations Manag. 22 (3), 661–675. doi:10.1111/j.1937-5956.2012.01417.x
Feng, Q., and Lu, L. X. (2013). The role of contract negotiation and industry structure in production outsourcing[J]. Prod. Operations Manag. 22 (5), 1299–1319.
Guo, L., and Iyer, G. (2013). Multilateral bargaining and downstream competition. Soc. Sci. Electron. Publ. 32 (3), 411–430. doi:10.1287/mksc.1120.0766
Gurnani, H., and Erkoc, M. (2008). Supply contracts in manufacturer-retailer interactions with manufacturer-quality and retailer effort-induced demand. Nav. Res. Logist. 55 (3), 200–217. doi:10.1002/nav.20277
Hao, X., and Li, B. (2020). Research on collaborative innovation among enterprises in green supply chain based on carbon emission trading. Sci. Prog. 103 (2), 003685042091632. doi:10.1177/0036850420916329
He, H., Li, S., Wang, S., Chen, Z., Zhang, J., Zhao, J., et al. (2021). Electrification decisions of traditional automakers under the dual-credit policy regime. Transp. Res. Part D Transp. Environ. 98, 102956. doi:10.1016/j.trd.2021.102956
He, Y. D., Wang, X., and Zhou, F. L. (2019). Research on the online shopping supply chain coordination based on bilateral efforts[J]. J. Manag. Sci. 27 (2), 83–92.
He, Y., and Zhao, X. (2016). Contracts and coordination: Supply chains with uncertain demand and supply. Nav. Res. Logist. 63 (4), 305–319. doi:10.1002/nav.21695
He, Y., and Zhao, X. (2012). Coordination in multi-echelon supply chain under supply and demand uncertainty. Int. J. Prod. Econ. 139 (1), 106–115. doi:10.1016/j.ijpe.2011.04.021
He, Y., Zhao, X., Zhao, L. D., and He, J. (2009). Coordinating a supply chain with effort and price dependent stochastic demand. Appl. Math. Model. 33 (6), 2777–2790. doi:10.1016/j.apm.2008.08.016
Jenn, A., Azevedo, I. L., and Michalek, J. J. (2019). Alternative-fuel-vehicle policy interactions increase U.S. greenhouse gas emissions. Transp. Res. Pollut. Pract. 124 (124), 396–407. doi:10.1016/j.tra.2019.04.003
Kong, Y., Ma, S. J., Tang, W. C., and Xue, Y. X. (2022). The policy effect on automobile industry considering the relationship between technology,market and production: The dual-credit policy as an example. Transp. Lett. 2022 (2), 1–15. doi:10.1080/19427867.2022.2040280
Li, J., Ku, Y., Liu, C., and Zhou, Y. (2020). Dual credit policy: Promoting new energy vehicles with battery recycling in a competitive environment?[J]. J. Clean. Prod. 243, 118456. doi:10.1016/j.jclepro.2019.118456
Li, Y. D., Xia, L. J., and Wang, F. Z. (2019). Game and coordination model of low-carbon supply chain based on product substitution[J]. J. Manag. Sci. 27 (10), 66–76. doi:10.16381/j.cnki.issn1003-207x.2019.10.007
Liu, C., Liu, J., and Shao, L. L. (2022). Research on contract selection of new energy vehicle manufacturers to encourage supplier innovation under “dual credit” policy[J]. Chin. J. Manag. 19 (6), 928–937.
Lou, G., Ma, H., Fan, T., and Chan, H. K. (2020). Impact of the dual-credit policy on improvements in fuel economy and the production of internal combustion engine vehicles. Resour. Conservation Recycl. 156, 104712. doi:10.1016/j.resconrec.2020.104712
Ma, L., Zhong, W. J., and Mei, S. H. (2018). Research on Subsidy strategy of new energy vehicle industry chain based on endurance demand[J]. Syst. Eng. Theory & Pract. 38 (7), 1759–1767.
Ma, M. M., Meng, W. D., Li, Y. Y., and Huang, B. (2023). New energy vehicle R&D strategy with supplier capital constraints under China’s dual credit policy[J]. Appl. Energy 2023 (2), 120524. doi:10.1016/j.enpol.2022.113099
Ma, M. M., Meng, W. D., Li, Y. Y., and Huang, B. (2021). Supply chain coordination strategy for NEVs based on supplier alliance under dual-credit policy[J]. Plos One 16 (10), 0257505. doi:10.1371/journal.pone.0257505
Meng, W. D., Ma, M. M., Li, Y. Y., and Huang, B. (2022). New energy vehicle R&D strategy with supplier capital constraints under China’s dual credit policy[J]. Energy Policy 2022 (9), 113099. doi:10.1016/j.enpol.2022.113099
Ministry of Industry and Information Technology (2020). The parallel management method of average fuel consumption and new energy vehicle credits of passenger vehicle enterprises. Available at: https://www.miit.gov.cn/jgsj/zfs/bmgz/art/2020/art_4dd5db1cc927478e94764ce903fe8718.html (Accessed 6 15, 2020).
Statistical, B. P. (2020). Review of world energy. Available at: https://www.bp.com/content/dam/bp/business-sites/en/global/corporate/pdfs/energy-economics/statistical-review/bp-stats-review-2020-full-report.pdf (Accessed 10 9, 2020).
Wang, J. B., and Huang, L. F. (2021). A game-theoretic analytical approach for fostering energy-saving innovation in the electric vehicle supply chain. SAGE Open 11 (2), 215824402110215. doi:10.1177/21582440211021581
Wang, Y. L., Zhu, Q. H., and Xia, X. Q. (2017). Game model of upstream and downstream joint emission reduction coordination contract in the supply chain based on consumption preference[J]. J. Syst. Eng. 32 (2), 188–198.
Wang, Z., Zhang, J., and Zhao, H. (2020). The selection of green technology innovations under dual-credit policy. Sustainability 12 (16), 6343. doi:10.3390/su12166343
Yang, T., Xing, C., and Li, X. (2021). Evaluation and analysis of new-energy vehicle industry policies in the context of technical innovation in China. J. Clean. Prod. 281, 125126. doi:10.1016/j.jclepro.2020.125126
Yang, W. H., Chu, J. F., Wu, Z., and Meng, H. Y. (2014). Calculating carbon emission reduction of new energy vehicles and analysis of its influencing factors[J]. Environ. Eng. 32 (12), 148–152.
Zhang, X. X., Hou, W. H., and Shen, C. L. (2017). Willingness to participate in centralized procurement, bargaining power of pharmaceutical enterprises and drug market performance[J]. Chin. J. Manag. Sci. 2017 (7), 159–162.
Zhao, F., Chen, K., Hao, H., Wang, S., and Liu, Z. (2019). Technology development for electric vehicles under new energy vehicle credit regulation in China: Scenarios through 2030. Clean Technol. Environ. Policy 21 (2), 275–289. doi:10.1007/s10098-018-1635-y
Zhao, M., Sun, T., and Feng, Q. (2021). A study on evaluation and influencing factors of carbon emission performance in China’s new energy vehicle enterprises. Environ. Sci. Pollut. Res. 28 (40), 57334–57347. doi:10.1007/s11356-021-14730-8
Zheng, J. C., Zhao, H., and Li, Z. G. (2019). Research on R&D subsidies of new energy vehicle industry under double credits policy [J]. Sci. Res. Manag. 2019 (2), 126–133.
Zhou, D. Q., Yu, Y., Wang, Q., and Zha, D. (2019). Effects of a generalized dual-credit system on green technology investments and pricing decisions in a supply chain. J. Environ. Manag. 247, 269–280. doi:10.1016/j.jenvman.2019.06.058
Zhou, Z., and Shen, L. (2020). Function mechanism and effect evaluation of Passenger Car dual-points Industrial Policy-Based on the dual perspectives of policy and market of new energy automobile industry development [J]. Price Theory Pract. 2020 (8), 168–171.
Nomenclature
Abbreviations
NEVs new energy vehicles
DCP dual credit policy
Superscripts
Subscripts
Parameters
Keywords: carbon peaking and carbon neutrality goals, carbon emission reduction, dual credit policy, alliance cooperation, new energy vehicles
Citation: Ma M, Meng W, Huang B and Li Y (2023) Optimal wholesale price and technological innovation under dual credit policy on carbon emission reduction in a supply chain. Front. Environ. Sci. 11:1129547. doi: 10.3389/fenvs.2023.1129547
Received: 22 December 2022; Accepted: 21 March 2023;
Published: 06 April 2023.
Edited by:
Rongrong Li, China University of Petroleum (East China), ChinaReviewed by:
Baogui Xin, Shandong University of Science and Technology, ChinaHui Li, Guangxi Minzu University, China
Hong-Xing Wen, Guangdong University of Finance and Economics, China
Copyright © 2023 Ma, Meng, Huang and Li. This is an open-access article distributed under the terms of the Creative Commons Attribution License (CC BY). The use, distribution or reproduction in other forums is permitted, provided the original author(s) and the copyright owner(s) are credited and that the original publication in this journal is cited, in accordance with accepted academic practice. No use, distribution or reproduction is permitted which does not comply with these terms.
*Correspondence: Bo Huang, aHVhbmdib0BjcXUuZWR1LmNu; Yuyu Li, bHl5amFtZUAxNjMuY29t