 Wenyu Li1
 Wei Shan
- 1School of Economics and Management, Beihang University, Beijing, China
- 2Key Laboratory of Complex System Analysis and Management Decision, Ministry of Education, Beijing, China
- 3Business School, Beijing Technology and Business University, Beijing, China
In 2015, China revised its Environmental Protection Law to strengthen regulations on firms’ pollution discharge. However, the efficacy of this law in protecting the environment remains unclear. Using panel data from China’s listed firms spanning from 2010 to 2020, this paper applies the continuous difference model to analyze the impact of the Environmental Protection Law on firms’ pollutant emissions. The results demonstrate a significant and consistent reduction in both total pollutant emissions and pollutant emissions per outcome for firms due to the implementation of the Environmental Protection Law. Additionally, the study indicates a significant reduction in pollutant emissions among firms that did not receive environmental protection subsidies, state-owned enterprises, and firms without prior environmental pollution behaviors. The findings also suggest a two-year lag for the Environmental Protection Law to impact firms’ pollution emissions per outcome. These results carry important practical implications for the government’s efforts to transform environmental protection policies and for firms seeking to enhance their environmental performance.
1 Introduction
Various types of pollutants, including carbon, solid waste, dust emission, sulfide, and nitrogen oxide, are discharged by firms during production (Zhang and Vigne, 2021). The excessive discharge of pollutants can damage the ecological environment and human health, leading to negative externalities (Huang et al., 2020). To address this issue, local governments must develop laws and regulations to restrain firms’ discharge behavior. The most common method for encouraging firms to reduce their pollutant discharge is through the implementation of pollutant discharge fees (Ren et al., 2018). These fees serve as a constraint mechanism to minimize pollutant discharge within society (Hockenstein et al., 1997; Majumdar and Marcus, 2001; Hahn, 2018; Ramanathan et al., 2018). Furthermore, favorable and flexible environmental protection policies can also enhance the competitiveness, technological innovation (Porter and Van der Linde, 1995), and performance (Jaffe and Palmer, 1997) of firms.
Despite numerous studies on the subject, the existing literature does not provide a clear consensus on the impact of environmental regulations on firms’ pollutant emissions. Studies conducted in the context of the United States regulatory environment have found that environmental monitoring and law enforcement activities can reduce firms’ future violation behaviors and significantly decrease emissions (Gray and Shimshack, 2011). Consequently, ecological protection regulations can improve the environmental performance of firms, industries, and regions by reducing air pollutants (Ouyang et al., 2019; Wang et al., 2019; Zhu et al., 2019). However, other studies have shown that environmental regulations may increase firms’ pollutant emissions if laws and regulations are not adaptable (Chen et al., 2018; Hao et al., 2018).
Furthermore, research on the impact of environmental regulations on pollutant discharge has primarily focused on specific types of pollutants and regulations within certain industries. For example, Poumanyvong and Zhao have suggested that environmental regulations can reduce carbon dioxide emissions from power generation (Poumanyvong and Kaneko, 2010; Zhao et al., 2015), while Tang has shown that market-based regulations, government subsidies, and ultra-low emissions standards can help decrease carbon dioxide emissions from coal power plants (Tang et al., 2019). Liu has found that mandatory control of terminal emissions has a positive effect on reducing the emission of single pollutant types in the steel industry (Liu et al., 2014), and Zeng has confirmed that provincial emission reduction policies have a positive impact on reducing air pollutants (Zeng et al., 2019). Wang and Yang focused on laws and regulations related to water environment protection and discussed how these regulations have reduced the total amount of pollutants discharged from industrial wastewater, thereby improving the health status of Chinese citizens (Wang and Yang, 2016). In addition, Tang proposed that the tradable discharge permit system can reduce pollution discharge (Tang et al., 2021), and several researchers have demonstrated that the environmental accountability system encourages firms to reduce pollution emissions (Yu et al., 2022).
It is worth noting that previous studies have mainly focused on investigating the effects of environmental regulations on the emission of single pollutants. However, it is essential to acknowledge that firms often discharge multiple pollutants (Zhang and Vigne, 2021), which means that regulating one type of pollutant may inadvertently affect the discharge of other pollutants, potentially leading to significant environmental impacts. Therefore, to gain a more comprehensive and accurate understanding of a firm’s environmental impact, it is crucial to develop a variable that measures all pollutants discharged by a firm. This would enable researchers to analyze the relationship between environmental regulations and firms’ emissions costs more effectively.
Moreover, while the existing literature has primarily focused on the macro-level impacts of environmental regulations on firms’ emission costs (Zhang et al., 2016), it is important to also consider the micro-level impacts of regulations on individual firms. Studies such as those by Pereira et al. (2016), Annicchiarico et al. (2017), and Ayu (2018) have used total carbon emissions to investigate carbon tax policy and economic policy. While macro-level data provides valuable insights into the relationship between environmental regulations and firms’ emissions costs, micro-level analysis can offer a more detailed understanding of how firms respond to regulations, how their costs change, and the factors that influence their decisions. Therefore, to achieve a comprehensive and nuanced understanding of the relationship between environmental regulations and firms’ emission costs, it is necessary to consider the multiple pollutants discharged by firms and their micro-level impacts. The main contributions of this paper compared to previous studies are:
First, the extant literature has introduced various variables to measure the pollutant emissions of firms, including those proposed by Demailly and Quirion (2006), Forslid et al. (2011), Kreickemeier and Richter (2014), Forslid et al. (2018), and Barrows and Ollivier (2021). However, these variables have limitations in comprehensively reflecting the impact of environmental regulations on firms’ pollutant emissions. This paper proposes a new explanatory variable, the pollutant discharge fee per outcome for firms, which provides a more comprehensive perspective on the effects of environmental regulation on firms. While the total emissions of an area can reflect how environmental regulations reduce firms’ emissions, they may be influenced by firm-level factors, such as size and emissions reduction technology. Therefore, the new explanatory variable introduced in this article can capture the impact of environmental regulations on firms more effectively by taking into account the differences in firm size and production levels. This contribution has the potential to enrich research on the effects of environmental regulation on firms and help policymakers design more effective and efficient regulations that achieve the desired environmental outcomes while minimizing negative impacts on firms and the economy.
Secondly, the standard DID model has limitations in accurately selecting control and treatment groups, especially for policies that are widely effective and synchronized. This poses a challenge to policymakers and researchers seeking to evaluate policy impacts. To overcome this limitation, this paper proposes a reformulated equation that draws on relevant literature on the impact of sudden occurrences, such as the introduction of species (Nunn and Qian, 2011). The reformulated equation aims to reduce estimation deviation caused by subjective factors, providing a more reliable and accurate evaluation of the policy’s impact. This paper’s method has broader implications beyond the specific policy evaluated in the study and can be applied to other situations where accurately dividing control and treatment groups is challenging. For example, it can be used to evaluate the impact of sudden events or natural disasters, providing policymakers and researchers with a more robust evaluation method.
Third, this paper takes a unique and innovative approach by examining the impact of Environment Protection Law at the firm level. As firms are the primary agents responsible for implementing pollutant emission reduction measures, analyzing the impact of environmental regulations at this level can provide more detailed insights into their effectiveness. By focusing on the implementation of pollutant emission reduction measures by firms, this study sheds light on how they are affected by these regulations and how they respond to them. The insights gained from this approach can help policymakers better design and optimize environmental regulations. The conclusions drawn from this study contribute significantly to the existing literature by providing detailed and nuanced information on the impact of environmental regulations on firms.
Fourth, the institutional context and economic development level in China differ significantly from those of most Western developed countries. Therefore, using China as the research context provides a unique perspective on the impact of environmental regulations in a developing country. The findings of this study can serve as a valuable reference for policymakers in other developing countries who are considering implementing similar regulations. Additionally, researchers interested in the effectiveness of environmental policies in non-Western contexts can benefit from the insights gained in this study. In this way, the study enriches the existing literature on the impact of environmental regulations by providing a case study that is not commonly studied.
In summary, this paper aims to analyze the impact of the Environmental Protection Law on firms’ pollutant emissions, using the variable of pollutant discharge fee per outcome for firms and the continuous DID method. This study seeks to provide policy insights to optimize China’s environmental protection regulations by taking the characteristics of firms into account. The article is structured as follows: Section 2 provides background information on environmental protection and relevant literature on the impact of the Environmental Protection Law in China, along with proposed hypotheses. Section 3 describes the methodology and data used in the analysis. Section 4 presents the main regression results, while Section 5 discusses the robustness tests performed. Finally, Section 6 concludes the study and discusses its implications.
2 Background and research hypotheses
China’s rapid economic growth has impacted environmental pollution significantly. However, prior to 2003, the Chinese government prioritized economic growth over environmental protection (Sun et al., 2019), which impeded its ability to control environmental quality. Despite the existence of environmental protection departments, their role within the government system was weak (Zhang et al., 2012), leading to pollution problems in various regions and cities (Guo et al., 2017; Liu et al., 2019). This, in turn, resulted in severe adverse chain reactions (Lu et al., 2015; Shi et al., 2018), such as a substantial increase in environmental health expenditure (Zhang et al., 2017). However, the Chinese government has taken steps to improve the situation by implementing reforms to the supervision and management system, setting emission targets, and upgrading technology and emission standards (Dan et al., 2018; Siping et al., 2019).
The implementation of the Environmental Protection Law (EPL) in 2015 was a pivotal milestone in China’s pursuit of environmental protection and sustainable development. It highlights China’s commitment to constructing an ecological civilization and developing a sustainable economy. This comprehensive law has augmented governance and institutional systems and has strengthened local governments’ responsibilities and obligations toward environmental protection. With its strict regulations, the EPL is deemed to be the most rigorous environmental protection law in Chinese history (Lv, 2014), as it empowers environmental protection departments to restrain or halt production activities of polluting firms, while also integrating ecological protection assessments into the official evaluation system, thereby directly impacting officials’ political careers. The promotion of these regulations and standards, combined with enhanced public awareness of environmental protection (Cantuaria et al., 2017), has resulted in a noticeable reduction in China’s environmental issues in recent years (Siping et al., 2019). The evaluation of emission reduction targets in the "Five-Year Plan" after 2010 indicates significant reductions in pollutant emissions (Ji et al., 2021), highlighting the positive impact of the EPL on the environment.
Based on a multitude of research targets, scholars have put forward various reasons for the improvement of the ecological environment in China. Some researchers have argued that the mandatory disclosure of corporate environmental information by the government has played a pivotal role in reducing waste emissions. In terms of water pollution, different methods have been proposed by researchers to curb it. Guo has suggested that sewage permits can effectively reduce water pollution caused by the pesticide industry (Guo et al., 2022). Additionally, Hu and Cheng have demonstrated that advancements in the economy, technology, and policy can lead to improved water quality (Hu and Cheng, 2013). Similarly, Lu has found that upgrading the discharge standards for sewage treatment plants can also reduce water pollution (Lu et al., 2017). Moreover, the conclusions of studies have varied depending on the research time window. For instance, using urban panel data from 2003 to 2010, Hao found no evidence to support the effectiveness of environmental regulation (Hao et al., 2018). However, studies based on provincial panel data from 2000 to 2013 and urban panel data from 2003 to 2014 have found that environmental regulation can effectively reduce firms’ emissions (Liu et al., 2017; Ren et al., 2018).
Similarly, studies have found that firms’ reactions to the same environmental regulations are heterogeneous due to their specific characteristics. For instance, different forms of firm ownership can lead to differences in pollutant discharge fees, with state-owned and non-state-owned companies facing significant differences in these fees (Huang et al., 2020; Kuang and Xiong, 2022). Environmental subsidies can provide financial assistance to firms that implement environmental innovations, resulting in reduced pollutant emissions (Liu et al., 2020; Liao and Zhu, 2022). Therefore, environmental protection subsidies may impact firms’ pollutant emissions. Meanwhile, the effect of environmental violations on firms’ environmental performance is ambiguous (Liao, 2018; Shevchenko, 2021). Drawing on the aforementioned literature, this study aims to examine whether the three characteristics of firms impact their performance under environmental protection policies. This novel perspective investigates the effects of environmental protection regulations on firms. Specifically, we test the following hypothesis:
Hypothesis 1. The implementation of the Environmental Protection Law has resulted in a considerable reduction in the volume of pollutants discharged by firms.
Hypothesis 2. The effect of the Environmental Protection Law on firms’ pollutants discharge is heterogeneous, with various firms reacting differently to the same environmental regulations.
Hypothesis 3. A time lag exists in the influence of the Environmental Protection Law on firms’ pollution discharge fee per outcome, as the effects may take time to manifest.
3 Model and data
3.1 Identification strategies and model building
The primary assessment strategy employed in this study is similar to the standard difference in difference (DID) model. We compare the relative changes in total PD and EPD before and after the implementation of the Environmental Protection Law in 2015. However, the difference between our estimation model and the standard DID model is that our method can analyze the impact of external shocks on the explained variables under the background of continuously changing variables. This approach has been utilized in other research fields (Nunn and Qian, 2011). In this study, we use the continuous measurement of environmental constraint intensity, which is the number of environmental protection laws and regulations implemented each year, to capture more variation, with 2010-2014 as the period before the policy impact and the years after 2015-2020 as the period after the policy impact. This distinction is based on when the law was officially implemented (Xinhua-News, 2014).
To verify the effects of this law on reducing firm pollutants emissions, we need to examine the effects at the firm level. It is assumed that the total PD and EPD of firms decreased significantly following the implementation of the Environmental Protection Law in 2015, and the central estimated effects of the law on these variables are shown in Eq. 1.
In this equation, denoted as (1), the firm
Charging firms for pollutant discharge through tax is a widely implemented approach to promote environmental protection worldwide (Huang et al., 2020). In China, a well-established system for collecting pollutant discharge fees has been put in place (Xie et al., 2017), and we use firms’ annual pollutant discharge fees as a proxy variable for the number of pollutants discharged by firms each year (Li and Ramanathan, 2018). During the selected research periods, there was a reform of the cost of pollution discharge, resulting in an increase in sewage discharge fees (Wang et al., 2018). Although this change might lead to an underestimation of the Environmental Protection Law’s impact on reducing pollutant discharge, it does not affect our ability to observe trends in pollution discharge charge trends.
The measurement of environmental regulation intensity is a critical variable in our model, but there is no consensus on how to measure it. Some studies use the ratio of waste utilization value to GDP (Hao et al., 2018), while others use individual waste emissions or weighted emissions (Zhu et al., 2011; Marin, 2014; Costa-Campi et al., 2017). Given the applicability and research characteristics of the index, this study refers to relevant literature (Acemoglu et al., 2012) and adopts the number of applicable environmental laws and regulations (NDRR) each year as the intensity of environmental constraints. To test the possible endogeneity between NDRR and PD, we use the GMM method. The control variables in the model include firm size (Wang et al., 2017; Ouyang et al., 2020), ownership structure (Ouyang et al., 2020), Tobin Q, income growth rate (Mbanyele and Wang, 2022), asset-liability ratio, profit of total assets (Horbach, 2008), and total asset turnover rate (Table 1).
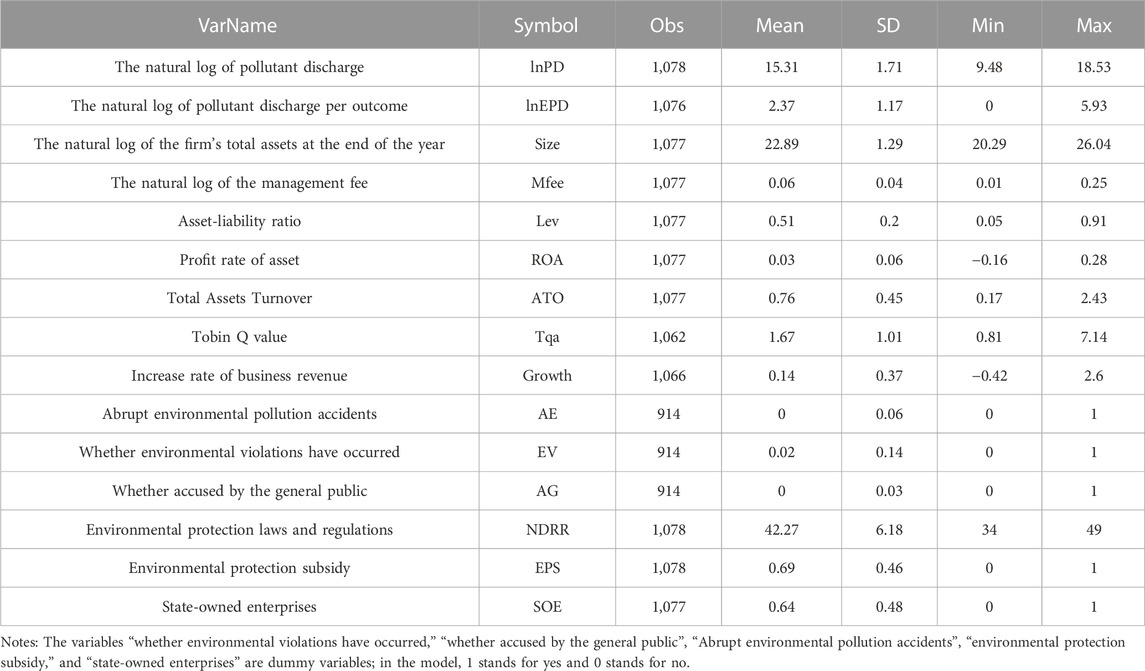
TABLE 1. Descriptive statistics.
We primarily focus on the coefficient
3.2 Data sources and descriptive statistics
The industrial sectors in China are known to be the main sources of environmental pollutant emissions, with waste gas, wastewater, and waste residue being among the highest contributors in the economic sectors (Ouyang et al., 2020). To study the impact of the Environmental Protection Law of 2015 on pollutant discharge, we have chosen a sample of listed companies in the secondary industry, covering the period from 2010 to 2020.
In this study, we have used a combination of data sources for empirical analysis. Firstly, we obtained firm-specific annual operational data from the Wind Economic Database (Wind, 2021), which provides comprehensive information on the firm’s characteristics. Additionally, we manually searched for the emission expenditure of each company over the eleven-year study period, as well as the number of environmental protection laws and regulations that were in effect each year. The number of environmental laws and regulations in force each year is based on when they came into force and when they were repealed. Finally, we extracted the cost of pollutant discharge for each firm from their annual and social responsibility reports. To mitigate the impact of extreme values on the results, we applied tail contraction to the collected data before conducting the regression analysis, The data collected manually was used to conduct a preliminary analysis of the changes in firms’ annual PD and EPD. The natural logarithms of these two variables were calculated, and their mean values from 2010 to 2020 are illustrated in Figure 1, which clearly shows the changes in PD and EPD over time. Prior to 2015, there was little variation in PD and EPD. However, a significant downward trend was observed after 2015, with a slight increase in 2018. This slight increase may be attributed to the replacement of the pollutant discharge fee with the environmental protection tax in 2018. During the replacement process, the critical content of charges remained unchanged (Ji et al., 2021), and the price of the pollutant discharge fee per unit increased (Wang et al., 2018). Based on these observations, this article investigates the reasons for this phenomenon and further analyzes the heterogeneity of the impact of environmental regulations on firms’ pollutant emissions.
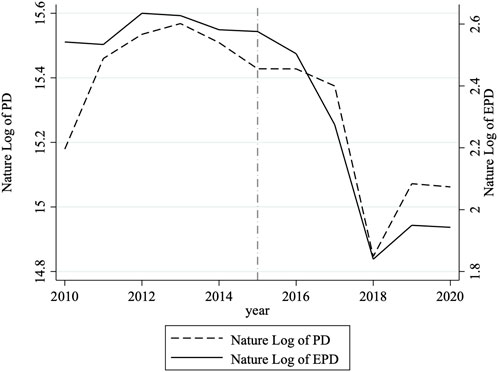
FIGURE 1. Mean nature log of PD and EPD.
Table 1 includes variables that capture the fundamental characteristics of firms and variables that differentiate firms based on their characteristics. For example, we distinguish between firms that receive environmental protection subsidies (EPS), firms that are state-owned (SOE), and firms that engage in environmental pollution behavior during the production process (SEE). To measure environmental pollution behavior, we use three variables: whether the firm had any significant environmental pollution incidents in year
where
It is worth noting that we also tested for collinearity among the control variables selected in our study. Our results show that the correlation coefficient between these variables is below 0.8, which indicates that their use is acceptable. Additionally, we conducted a VIF analysis, which revealed a VIF value of 1.70 for the variables. This value is below the commonly accepted threshold of 10, indicating that collinearity is not a significant concern in our model.
4 Main results and heterogeneity analysis
In Table 3 and Table 4, the main regression results of the model are presented. Table 3 displays the impact of the implementation of the Environmental Protection Law in 2015 on pollutant emissions for the entire sample and for firms with different characteristics and attributes. Table 4 shows the impact of the Environmental Protection Law on pollutant emissions per outcome for firms with different characteristics and attributes. All models were estimated using OLS, and standard errors were calculated at the firm level. Column (1) of both tables presents the model results with firm and year fixed effects. Columns (2) and (3) include a control variable for receiving environmental protection subsidies. Columns (4) and (5) include a control variable for whether the firm is state-owned. In Columns (6, 7), we add control variables to determine whether there has ever been an environmental pollution behavior.
The results of regression analysis in Table 3, Column 1 indicate that the implementation of the Environmental Protection Law in 2015 had a statistically significant negative impact on firms’ pollutant emissions, with a 1% level significance. This suggests that the Law led to a reduction in firms’ pollutant discharge, resulting in an average decrease of 1.28% in pollutant emissions. To further explore the heterogeneous impact of the Law on firms with different characteristics and attributes, we conducted additional regression analyses by dividing the firms into groups based on environmental protection subsidies, state ownership, and environmental pollution behaviors. This allowed us to draw more specific and nuanced conclusions regarding the impact of the Environmental Protection Law on firms with different profiles.
The results presented in Table 2 and Table 3 suggest that the Environmental Protection Law had a significant impact on reducing pollutant emissions in firms that do not receive environmental protection subsidies and state-owned enterprises. Specifically, the pollutant emissions of non-subsidized firms decreased by 2.5%, while state-owned enterprises reduced their emissions by 1.56%. However, there was no significant impact on the pollutant emissions of firms that receive environmental protection subsidies or non-state-owned enterprises. Additionally, the impact of the Environmental Protection Law varies depending on whether firms have a history of environmental pollution behavior. Firms without such behavior significantly decreased their pollutant emissions at the 10% level, while the result for firms with a history of environmental pollution behavior was negative but not significant. These findings suggest that the effectiveness of the Environmental Protection Law in reducing pollutant emissions may be influenced by certain firm characteristics and behaviors.
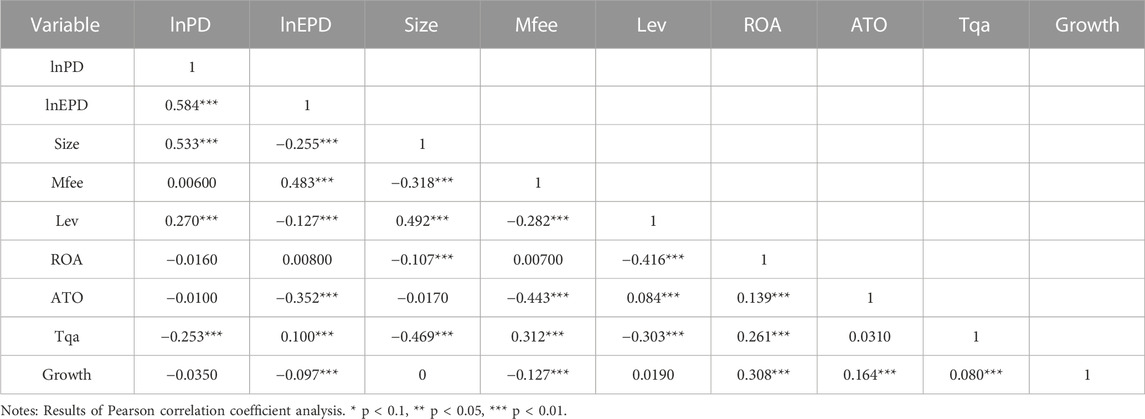
TABLE 2. Collinearity tests.
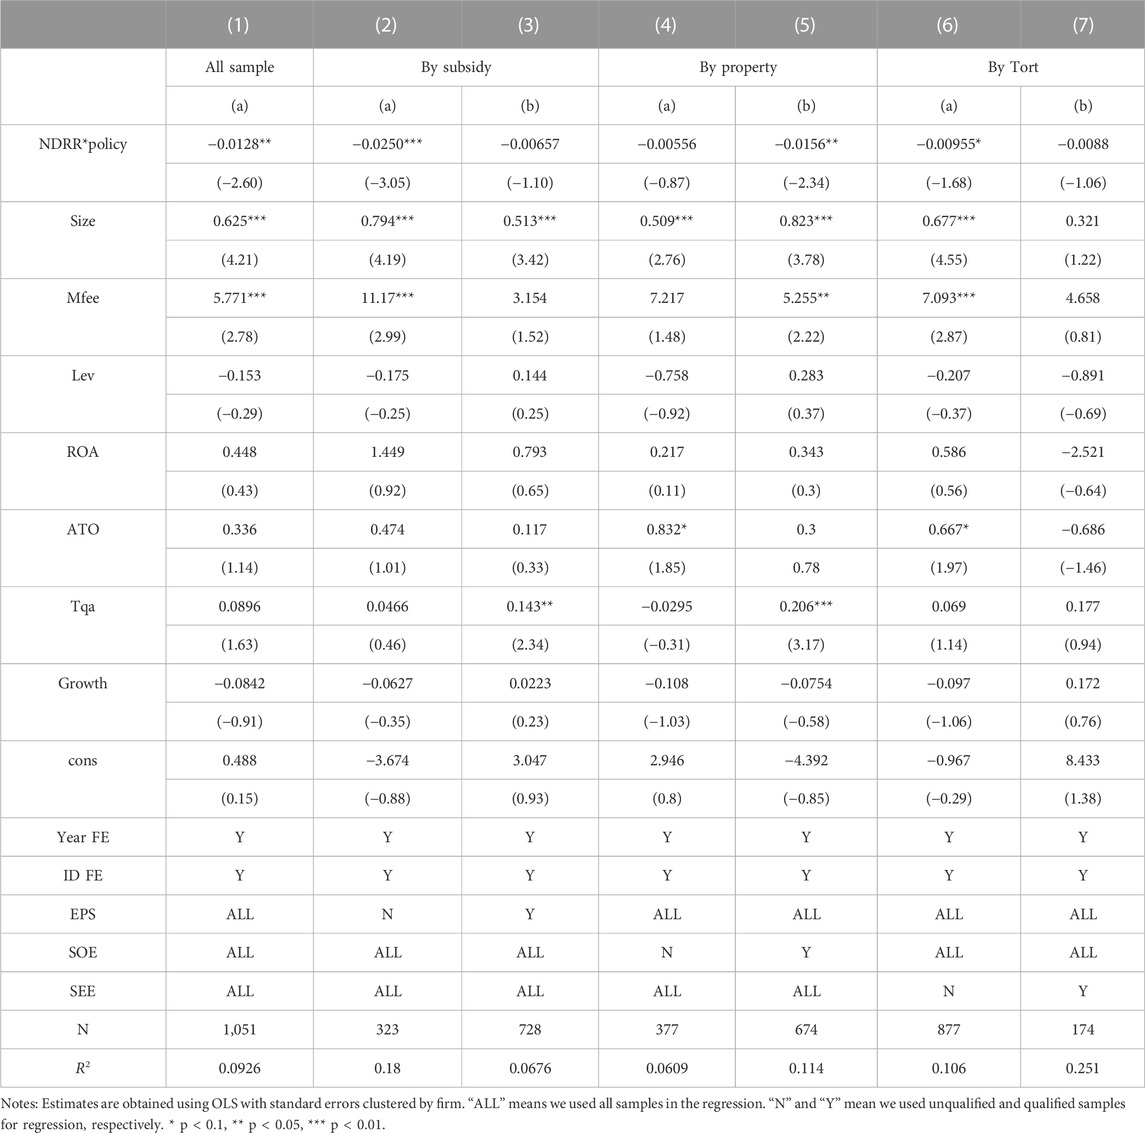
TABLE 3. The impact on pollutant discharge (PD).
Table 4 shows the results of the impact of the Environmental Protection Law on pollutant emissions per outcome for firms. The findings indicate that the Environmental Protection Law had a significant impact on reducing pollutant emissions per outcome for firms without environmental protection subsidies and state-owned firms. Specifically, pollutant emissions per outcome for firms without environmental protection subsidies decreased by 1.78%, while state-owned enterprises reduced their emissions by an average of 1.01%. However, no significant impact was observed on pollutant emissions per outcome for firms that receive environmental protection subsidies or non-state-owned enterprises.

TABLE 4. The impact on PD per outcome
In summary, Table 3 and Table 4 provide evidence that the Environmental Protection Law can significantly reduce firms’ pollutant emissions, with a reduction of 1.28% in total pollutant emissions and 0.8% in pollutant emissions per outcome, both of which are statistically significant at the 5% level. The heterogeneity analysis indicates that the impact of the Law varies across different types of firms. The Environmental Protection Law has a more significant impact on firms without environmental production subsidies and state-owned enterprises, while no significant impact was found on firms that receive environmental protection subsidies or non-state-owned enterprises. Furthermore, the law has a more significant impact on firms without environmental violation behaviors compared to those with such behaviors.
Overall, these results suggest that the Environmental Protection Law can be an effective tool for reducing firms’ pollutant emissions, especially for firms without environmental protection subsidies and state-owned enterprises. However, policymakers need to consider the characteristics of firms to design effective environmental policies as the impact may vary across different types of firms.
5 Robust tests
5.1 Parallelism analysis
The model of this study is based on the standard DID model. To establish the validity of the DID model, it is necessary to ensure that the explained variable did not significantly differ before the implementation of the Environmental Protection Law. This is referred to as the parallelism assumption, and it is crucial for accurately estimating the causal effect of the law on pollutant emissions. In this study, we have verified this assumption by examining the trend of the outcome variables before the implementation of the law.
Eq. 1 examines the average impact of the implementation of the Environmental Protection Law on total PD and EPD. As the law was formally implemented in 2015, the estimated coefficient
The only difference between Eq. 4 and 1 is that in Eq. 4, we interact the annual environmental protection constraint intensity with the fixed effect for each period, instead of with the index variables after implementing the EPL. The meaning of other terms is the same as that in Eq. 1.
The estimation results of Eq. 4 are shown in Table 5. Column (1) displays the regression results for total pollutant emissions, while Column (2) reports the estimated coefficient of pollutant emissions per outcome. The findings in Table 5 indicate that the regression coefficient for the cross-multiplication was not significant prior to 2015 for total pollutant discharge. However, the results were significant and negative after 2015, which is consistent with our expectations.
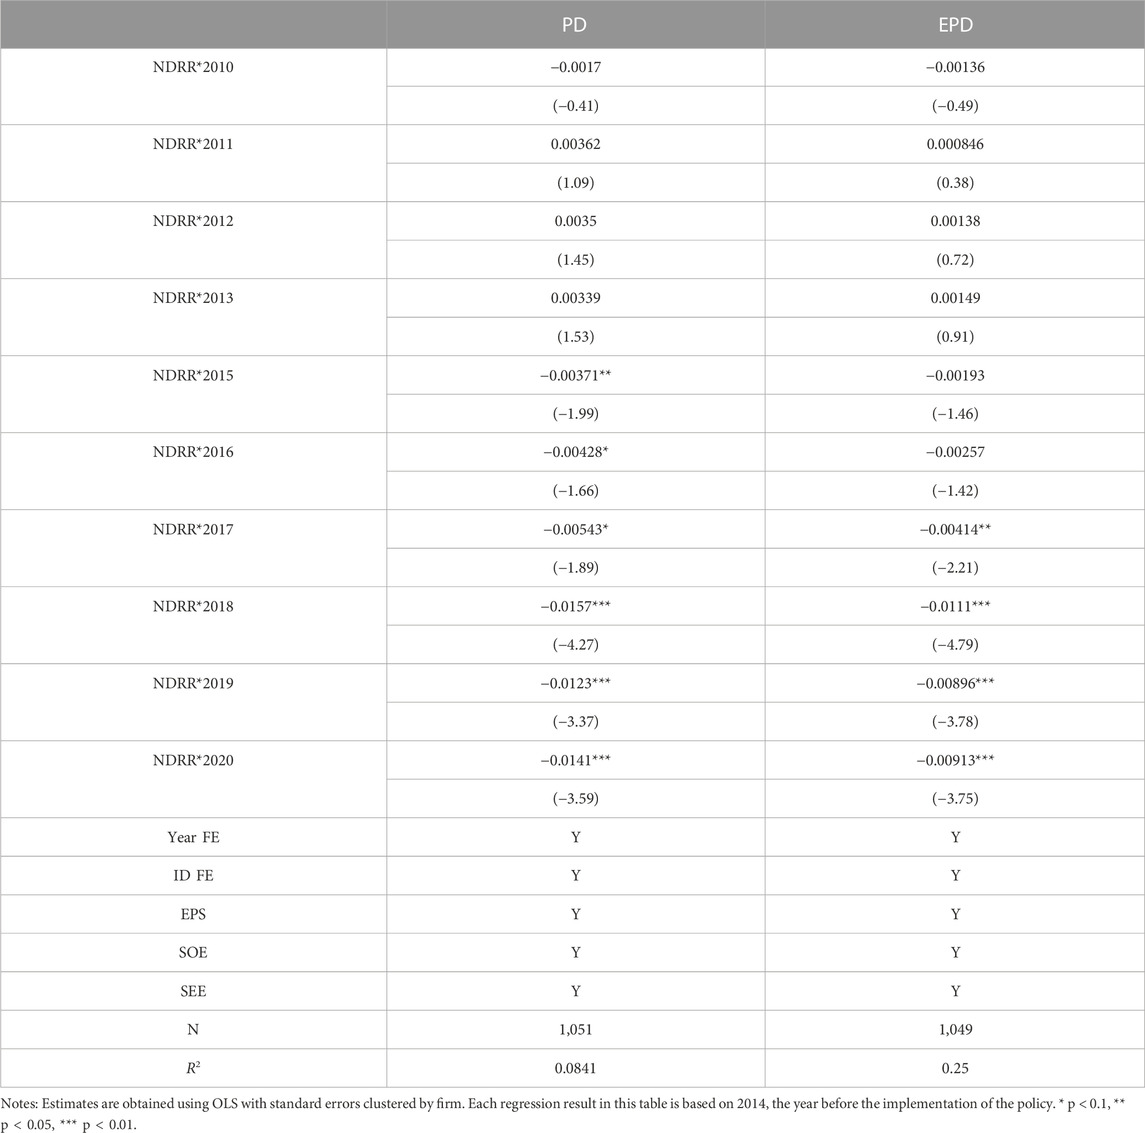
TABLE 5. Parallelism test.
The estimated coefficient
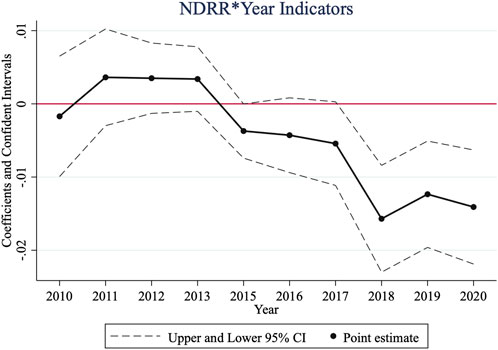
FIGURE 2. Flexible estimates of the relationship between NDRR and PD.
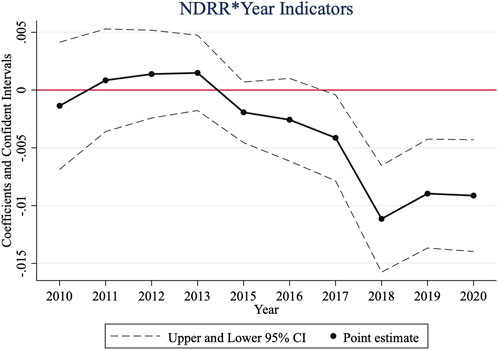
FIGURE 3. Flexible estimates of the relationship between NDRR and EPD.
Based on these results, we can conclude that the implementation of the Environmental Protection Law had a significant and negative impact on both total pollutant emissions and pollutant emissions per outcome for firms. However, the impact on EPD may take some time to become apparent, as there is a two-year lag observed in the data.
The parallelism test results indicate that the parallelism hypothesis was generally satisfied for PD (Figure 2). Before the implementation of the new Environmental Protection Law in 2015, the 95% confidence interval of the regression coefficient included zero. After 2015, the regression coefficient began to show significant negative effects. The test for EPD was similar, indicating that, overall, there was no significant change for both PD and EPD before the implementation of the Environmental Protection Law in 2015. However, after the implementation of the EPL, the coefficients for all subsequent years were significantly different from zero, indicating that the tendency of PD and EPD prior to the implementation of the EPL met the hypothesis of the parallel trend of DID (Figure 2 and Figure 3).
5.2 Placebo analysis
To test the impact period, we analyzed at least five-year time windows from 2010 to 2018 and estimated Eq. 1 for each window. We defined the period before impact, the benchmark period, and the period after impact for each test window. The benchmark period is the period before the impact we want to check. We expected that the change in total pollutant emissions and pollutant emissions per outcome for firms is caused by the implementation of the Environmental Protection Law in 2015. We found that when the policy impact was placed before 2015, the regression coefficient
Table 6 presents the regression results of the estimated coefficient
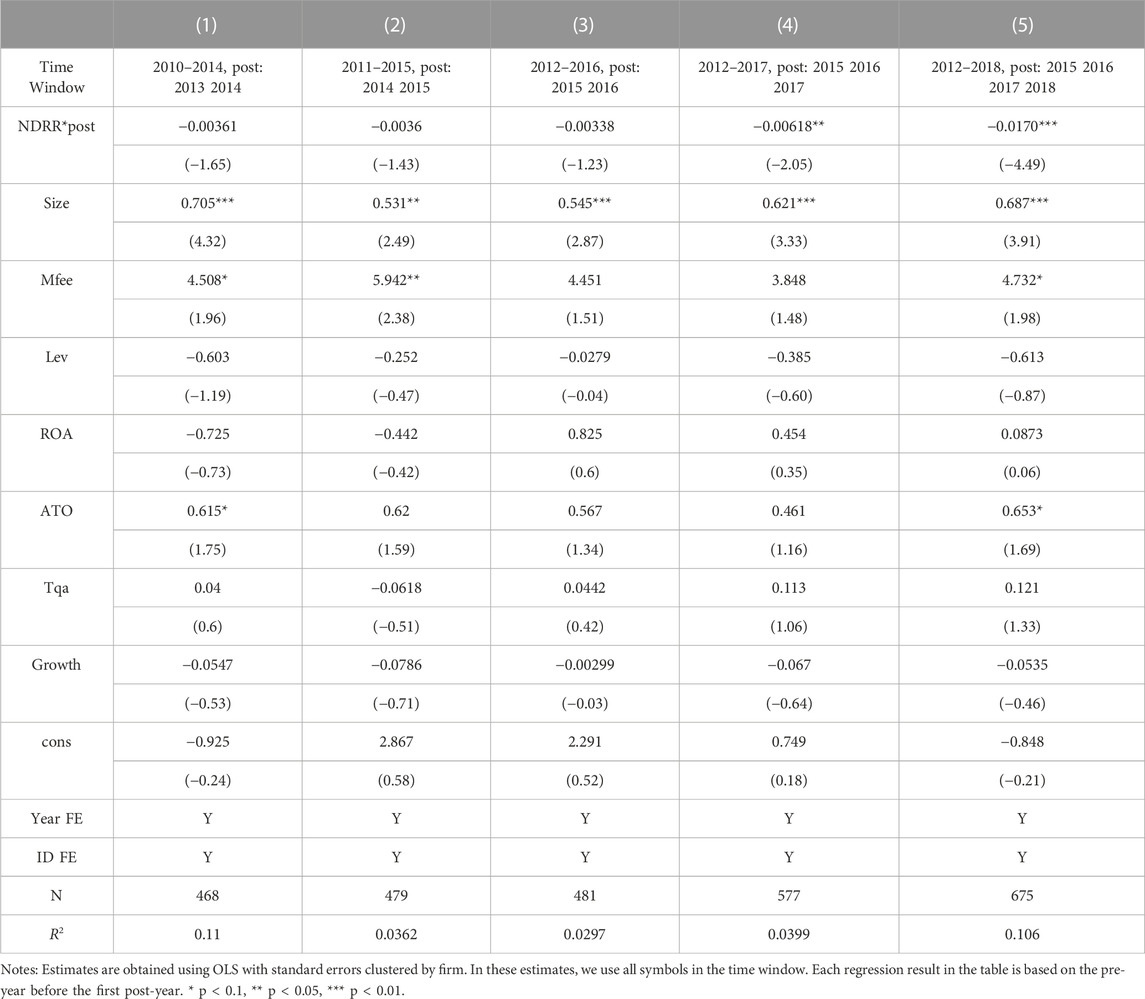
TABLE 6. PD placebo analysis.
Table 7 presents the regression results of the estimated coefficient
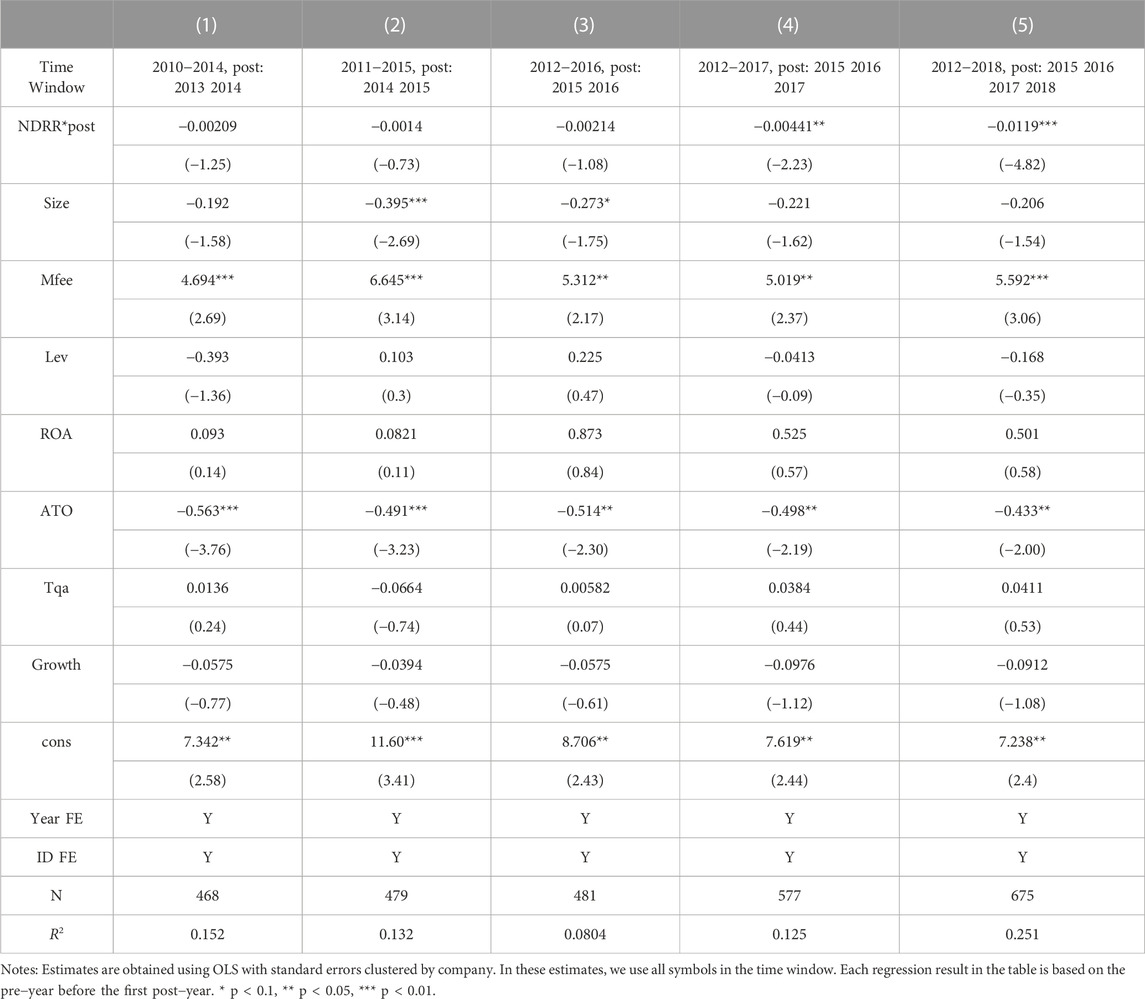
TABLE 7. EPD placebo analysis.
5.3 Endogenous analysis
Another potential limitation of this study is the possible endogeneity between the core explanatory variable and the explained variable. To ensure the experimental results, we used the two-step Generalized Method of Moments (GMM) and both DIF-GMM and SYS-GMM for the regression.
Table 8 presents the regression results of the dynamic panel model, with Columns (1) and (2) showing the DIF-GMM regression results. The P values of the AR (1) are all less than 0.1, rejecting the original hypothesis and indicating that the residual term has first-order autocorrelation. Although the P values of the AR (2) test in Columns (2) and (4) are less than 0.05, the value of AR (3) is greater than 0.1, which means the original hypothesis is accepted. The P values of the Hansen test are all greater than 0.1, which means the instrument selection is reasonable. These test results verify the model’s rationality, and the regression coefficient of the multiplicative term remains significantly negative. This indicates that the benchmark regression results are not dependent on a specific measurement model, and the conclusion of this paper is robust.
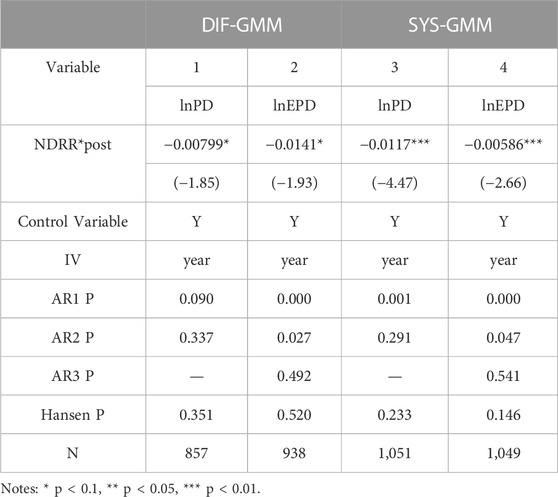
TABLE 8. Endogenous Analysis.
In summary, the robust tests confirm our prediction that both the reduction of firms’ pollutant emissions after 2015 and the significant reduction of pollutant emissions per outcome for firms are caused by the Environmental Protection Law of 2015.
6 Conclusion and discussion
6.1 Conclusion
The primary objective of this study is to conduct a systematic empirical analysis of the impact of the Environmental Protection Law on firms’ pollutant emissions. Firstly, the study provides a theoretical analysis that highlights how environmental protection regulations can affect a firm’s pollutant emissions. Secondly, using the continuous DID method, this paper examines changes in total pollutant emissions and pollutant emissions per outcome for firms under the Environmental Protection Law. Additionally, this study investigates the impact of the law on firms with distinct characteristics.
The results of the study demonstrate that the implementation of the Environmental Protection Law has effectively reduced firms’ pollutant emissions, as evidenced by both the total pollutant emissions and pollutant emissions per outcome. Moreover, the study reveals that the impact of the law on a firm’s pollution emissions per outcome is delayed by two years. Furthermore, the analysis of heterogeneity indicates that the impact of the Environmental Protection Law on a firm’s pollution discharge varies significantly depending on the firm’s ownership structure and whether or not the firm receives environmental protection subsidies.
In summary, the study provides compelling empirical evidence that stricter environmental protection regulations can serve as an effective tool to promote sustainable development and environmental protection. The findings emphasize the importance of taking into account the characteristics of firms when designing environmental policies, as different types of firms may respond differently to such policies. The study’s results have significant implications for policymakers and businesses seeking to balance economic growth with environmental protection.
6.2 Policy Implications
The findings of the study have meaningful implications for governmental departments optimizing environmental policies in the future.
First, environmental protection policies can effectively encourage firms to reduce their pollutant emissions. Therefore, the government should continuously improve environmental protection policies to align with its development needs and environmental protection goals. In the short term, the government should enhance the pertinence and diversity of environmental protection policies to raise firms’ awareness and enthusiasm for environmental protection. In the long run, policy formulation should be forward-looking and instructive to ensure firms fully understand the direction of environmental protection policies, establish reasonable expectations for future changes in environmental protection constraints, and promote the balancing of the relationship between production and environmental protection. This approach can fundamentally stimulate the internal motivation of firms to engage in ecological protection.
Second, to further optimize environmental protection policies, the government should continuously evaluate and adjust policies based on their implementation stage. Currently, it is recommended that the distribution of environmental protection subsidies should prioritize firms that have not yet received such subsidies in order to unlock their potential for reducing pollutant emissions. Additionally, the government should strengthen the supervision of non-state-owned enterprises and firms with a history of environmental pollution, using various measures such as emission trading, environmental subsidy policies, and monitoring by the public. By doing so, the government can ensure that firms are held accountable for their environmental impact and encourage them to prioritize environmentally sustainable practices.
Third, to improve their ability to cope with increasing environmental constraints, firms should take proactive measures to reduce their pollutant emissions. They can start by planning the production processes and purification capacity of pollutant purification facilities at the initial stage of plant design based on their own needs. This will enable them to reduce their pollutant emissions by updating pollutant purification facilities or improving production processes for existing plants. Moreover, firms should also consider investing in cleaner production technologies and adopting eco-friendly practices to reduce their environmental impact. By taking such measures, firms can not only comply with environmental regulations but also enhance their competitiveness and reputation in the market.
6.3 Strengths and limitations
This paper has several strengths, which contribute to its significance. First, the theoretical framework provided a comprehensive understanding of the ways environmental protection regulations can impact firms’ pollutant emissions, which provided a foundation for the empirical analysis. Secondly, the utilization of the continuous DID method allowed for a more precise analysis of the Environmental Protection Law’s impact on total pollutant emissions and pollutant emissions per outcome. Thirdly, the investigation of the law’s impact on firms with distinct characteristics provided a more nuanced understanding of the law’s effect on pollutant emissions.
However, there are also some limitations to this study. One limitation is that regional heterogeneity could not be measured due to the wide range of locations covered by the factories of each listed company, which made it difficult to distinguish regional differences in pollutant emissions among firms accurately. Future studies could collect emission data from each factory of the listed firms to explore regional heterogeneity in pollutant emissions further.
Furthermore, another potential limitation is the reliance on self-reported data from the listed firms. Although efforts were made to verify the accuracy of the data, there is still a possibility of bias or errors in the reported emissions data. Future research could explore alternative methods of data collection, such as third-party monitoring or satellite-based remote sensing, to complement self-reported data and improve the accuracy of the analysis.
Overall, this study provides valuable insights into the effectiveness of environmental protection policies in reducing firms’ pollutant emissions. The findings highlight the importance of tailored policies that consider the heterogeneity of firms and the need for continuous evaluation and adjustment of policies. The study’s methodology also provides a useful approach for evaluating the impact of policies with wide coverage. However, there is still room for further exploration and improvement, particularly in addressing regional heterogeneity and improving data accuracy.
Data availability statement
The raw data supporting the conclusion of this article will be made available by the authors, without undue reservation.
Author contributions
All authors listed have made a substantial, direct, and intellectual contribution to the work and approved it for publication.
Funding
This work was supported by the National Natural Science Foundation of China (Grant No. 71971008), the Beijing Natural Science Foundation (Grant No. 9222020), the Major Program of the National Fund of Philosophy and Social Science of China (Grant No. 21ZDA012).
Conflict of interest
The authors declare that the research was conducted in the absence of any commercial or financial relationships that could be construed as a potential conflict of interest.
Publisher’s note
All claims expressed in this article are solely those of the authors and do not necessarily represent those of their affiliated organizations, or those of the publisher, the editors and the reviewers. Any product that may be evaluated in this article, or claim that may be made by its manufacturer, is not guaranteed or endorsed by the publisher.
References
Acemoglu, D., Aghion, P., Bursztyn, L., and Hemous, D. (2012). The environment and directed technical change. Am. Econ. Rev. 102 (1), 131–166. doi:10.1257/aer.102.1.131
Annicchiarico, B., Battles, S., Di Dio, F., Molina, P., and Zoppoli, P. (2017). GHG mitigation schemes and energy policies: A model−based assessment for the Italian economy. Econ. Model. 61, 495–509. doi:10.1016/j.econmod.2016.12.028
Ayu, P. (2018). The impact of carbon tax application on the economy and environment of Indonesia. Eur. J. Econ. Bus. Stud. 4 (1), 110–120. doi:10.2478/ejes−2018−0011
Barrows, G., and Ollivier, H. (2021). Foreign demand, developing country exports, and CO2 emissions: Firm−level evidence from India. J. Dev. Econ. 149, 102587. doi:10.1016/j.jdeveco.2020.102587
Cantuaria, M. L., Brandt, J., Løfstrøm, P., and Blanes−Vidal, V. (2017). Public perception of rural environmental quality: Moving towards a multi−pollutant approach. Atmos. Environ. 170, 234–244. doi:10.1016/j.atmosenv.2017.09.051
Chen, H., Hao, Y., Li, J., and Song, X. (2018). The impact of environmental regulation, shadow economy, and corruption on environmental quality: Theory and empirical evidence from China. J. Clean. Prod. 195, 200–214. doi:10.1016/j.jclepro.2018.05.206
Costa−Campi, M. T., García−Quevedo, J., and Martínez−Ros, E. (2017). What are the determinants of investment in environmental R&D? Energy Policy 104, 455–465. doi:10.1016/j.enpol.2017.01.024
Dan, T., Qiang, Z., Steven, J., Fei, L., Bo, Z., Guannan, G., et al. (2018). Targeted emission reductions from global super−polluting power plant units. Nat. Sustain. 1, 59–68. doi:10.1038/s41893−017−0003−y
Demailly, D., and Quirion, P. (2006). CO2 abatement, competitiveness and leakage in the European cement industry under the EU ETS: Grandfathering versus output−based allocation. Clim. Policy 6 (1), 93–113. doi:10.1080/14693062.2006.9685590
Forslid, R., Okubo, T., and Ulltveit−Moe, K. H. (2011). International trade, CO2 emissions and heterogeneous firms. London, United Kingdom: Centre for Economic Policy Research.
Forslid, R., Okubo, T., and Ulltveit−Moe, K. H. (2018). Why are firms that export cleaner? International trade, abatement and environmental emissions. J. Environ. Econ. Manag. 91, 166–183. doi:10.1016/j.jeem.2018.07.006
Gray, W. B., and Shimshack, J. P. (2011). The effectiveness of environmental monitoring and enforcement: A review of the empirical evidence. Rev. Environ. Econ. Policy 5 (1), 3–24. doi:10.1093/reep/req017
Guo, X., Shi, M., Ni, N., Zhang, X., Yuan, W., and Wang, N. (2022). China pollutant discharge permits as a link between total emission control and water quality: A pilot study of the pesticide industry. Water Policy 24 (1), 19–30. doi:10.2166/wp.2021.077
Guo, Y., Zeng, Z., Tian, J., Xu, F., Chen, L., and Zhou, A. (2017). Uncovering the strategies of green development in a Chinese province driven by reallocating the emission caps of multiple pollutants among industries. Sci. Total Environ. 607, 1487–1496. doi:10.1016/j.scitotenv.2017.06.234
Hahn, R. W. (2018). Market power and transferable property rights. United Kingdom: London: Routledge.
Hao, Y., Deng, Y., Lu, Z., and Chen, H. (2018). Is environmental regulation effective in China? Evidence from city−level panel data. J. Clean. Prod. 188, 966–976. doi:10.1016/j.jclepro.2018.04.003
Hockenstein, J. B., Stavins, R. N., and Whitehead, B. W. (1997). Crafting the next generation of market−based environmental tools. Environ. Sci. Policy Sustain. Dev. 39 (4), 12–33. doi:10.1080/00139159709603637
Horbach, J. (2008). Determinants of environmental innovation−New evidence from German panel data sources. Res. Policy 37 (1), 163–173. doi:10.1016/j.respol.2007.08.006
Hu, Y., and Cheng, H. (2013). Water pollution during China's industrial transition. Environ. Dev. 8, 57–73. doi:10.1016/j.envdev.2013.06.001
Huang, L., Liu, S., Han, Y., and Peng, K. (2020). The nature of state−owned enterprises and collection of pollutant discharge fees: A study based on Chinese industrial enterprises. J. Clean. Prod. 271, 122420. doi:10.1016/j.jclepro.2020.122420
Jaffe, A. B., and Palmer, K. (1997). Environmental regulation and innovation: A panel data study. Rev. Econ. Statistics 79 (4), 610–619. doi:10.1162/003465397557196
Ji, S., Jiang, F., Li, J., Wang, Y., and Zhang, W. (2021). Assessment of the performances of pollutant discharge fee in China. Ecol. Indic. 125, 107468. doi:10.1016/j.ecolind.2021.107468
Kreickemeier, U., and Richter, P. M. (2014). Trade and the environment: The role of firm heterogeneity. Rev. Int. Econ. 22 (2), 209–225. doi:10.1111/roie.12092
Kuang, H., and Xiong, Y. (2022). Could environmental regulations improve the quality of export products? Evidence from China’s implementation of pollutant discharge fee. Environ. Sci. Pollut. Res. 29 (54), 81726–81739. doi:10.1007/s11356−022−21566−3
Li, R., and Ramanathan, R. (2018). Exploring the relationships between different types of environmental regulations and environmental performance: Evidence from China. J. Clean. Prod. 196, 1329–1340. doi:10.1016/j.jclepro.2018.06.132
Liao, Z. (2018). Institutional pressure, knowledge acquisition and a firm's environmental innovation. Bus. Strategy Environ. 27 (7), 849–857. doi:10.1002/bse.2036
Liao, Z., and Zhu, X. (2022). A configurational analysis of firms' environmental innovation: Evidence from China's key pollutant-discharge listed companies. Sustain. Dev. 30 (6), 1511–1522. doi:10.1002/sd.2324
Liu, J., Zhao, M., and Wang, Y. (2020). Impacts of government subsidies and environmental regulations on green process innovation: A nonlinear approach. Technol. Soc. 63, 101417. doi:10.1016/j.techsoc.2020.101417
Liu, S., Zhu, Y., and Du, K. (2017). The impact of industrial agglomeration on industrial pollutant emission: Evidence from China under new normal. Clean Technol. Environ. Policy 19 (9), 2327–2334. doi:10.1007/s10098−017−1407−0
Liu, Y., Ge, Y., Xia, B., Cui, C., Jiang, X., and Skitmore, M. (2019). Enhancing public acceptance towards waste−to−energy incineration projects: Lessons learned from a case study in China. Sustain. Cities Soc. 48, 101582. doi:10.1016/j.scs.2019.101582
Liu, Z., Mao, X., Tu, J., and Jaccard, M. (2014). A comparative assessment of economic−incentive and command−and−control instruments for air pollution and CO2 control in China's iron and steel sector. J. Environ. Manag. 144, 135–142. doi:10.1016/j.jenvman.2014.05.031
Lu, B., Du, X., and Huang, S. (2017). The economic and environmental implications of wastewater management policy in China: From the LCA perspective. J. Clean. Prod. 142, 3544–3557. doi:10.1016/j.jclepro.2016.10.113
Lu, Y., Song, S., Wang, R., Liu, Z., Meng, J., Sweetman, A. J., et al. (2015). Impacts of soil and water pollution on food safety and health risks in China. Environ. Int. 77, 5–15. doi:10.1016/j.envint.2014.12.010
Lv, Z. (2014). The past and present of environment protection law. J. Political Sci. Law 5, 51–61. (in Chinese).
Majumdar, S. K., and Marcus, A. A. (2001). Rules versus discretion: The productivity consequences of flexible regulation. Acad. Manag. J. 44 (1), 170–179. doi:10.2307/3069344
Marin, G. (2014). Do eco−innovations harm productivity growth through crowding out? Results of an extended CDM model for Italy. Res. Policy 43 (2), 301–317. doi:10.1016/j.respol.2013.10.015
Mbanyele, W., and Wang, F. (2022). Environmental regulation and technological innovation: Evidence from China. Environ. Sci. Pollut. Res. 29 (9), 12890–12910. doi:10.1007/s11356−021−14975−3
Nunn, N., and Qian, N. (2011). The potato's contribution to population and urbanization: Evidence from a historical experiment. Q. J. Econ. 126 (2), 593–650. doi:10.1093/qje/qjr009
Ouyang, X., Li, Q., and Du, K. (2020). How does environmental regulation promote technological innovations in the industrial sector? Evidence from Chinese provincial panel data. Energy Policy 139, 111310. doi:10.1016/j.enpol.2020.111310
Ouyang, X., Shao, Q., Zhu, X., He, Q., Xiang, C., and Wei, G. (2019). Environmental regulation, economic growth and air pollution: Panel threshold analysis for OECD countries. Sci. Total Environ. 657, 234–241. doi:10.1016/j.scitotenv.2018.12.056
Pereira, A. M., Pereira, R. M., and Rodrigues, P. G. (2016). A new carbon tax in Portugal: A missed opportunity to achieve the triple dividend? Energy Policy 93, 110–118. doi:10.1016/j.enpol.2016.03.002
Porter, M. E., and Van der Linde, C. (1995). Toward a new conception of the environment−competitiveness relationship. J. Econ. Perspect. 9 (4), 97–118. doi:10.1257/jep.9.4.97
Poumanyvong, P., and Kaneko, S. (2010). Does urbanization lead to less energy use and lower CO2 emissions? A cross−country analysis. Ecol. Econ. 70 (2), 434–444. doi:10.1016/j.ecolecon.2010.09.029
Ramanathan, R., Ramanathan, U., and Bentley, Y. (2018). The debate on flexibility of environmental regulations, innovation capabilities and financial performance–A novel use of DEA. Omega 75, 131–138. doi:10.1016/j.omega.2017.02.006
Ren, S., Li, X., Yuan, B., Li, D., and Chen, X. (2018). The effects of three types of environmental regulation on eco−efficiency: A cross−region analysis in China. J. Clean. Prod. 173, 245–255. doi:10.1016/j.jclepro.2016.08.113
Shevchenko, A. (2021). Do financial penalties for environmental violations facilitate improvements in corporate environmental performance? An empirical investigation. Bus. Strategy Environ. 30 (4), 1723–1734. doi:10.1002/bse.2711
Shi, Y., Xu, X., Li, Q., Zhang, M., Li, J., Lu, Y., et al. (2018). Integrated regional ecological risk assessment of multiple metals in the soils: A case in the region around the bohai sea and the yellow sea. Environ. Pollut. 242, 288–297. doi:10.1016/j.envpol.2018.06.058
Siping, J., Wendai, L., Liu, M., Xiangjun, Y., Hongjuan, Y., Yongming, C., et al. (2019). Decoupling environmental pressures from economic growth based on emissions monetization: Case in Yunnan, China. J. Clean. Prod. 208, 1563–1576. doi:10.1016/j.jclepro.2018.10.218
Sun, J., Wang, J., Wang, T., and Zhang, T. (2019). Urbanization, economic growth, and environmental pollution: Partial differential analysis based on the spatial Durbin model. Manag. Environ. Qual. Int. J. 30 (2), 483–494. doi:10.1108/Meq−05−2018−0101
Tang, L., Qu, J., Mi, Z., Bo, X., Chang, X., Anadon, L. D., et al. (2019). Substantial emission reductions from Chinese power plants after the introduction of ultra−low emissions standards. Nat. Energy 4 (11), 929–938. doi:10.1038/s41560−019−0468−1
Tang, M., Zhang, R., Li, Z., and Wu, B. (2021). Assessing the impact of tradable discharge permit on pollution reduction and innovation: Micro−evidence from Chinese industrial enterprises. Environ. Dev. Sustain. 23, 16911–16933. doi:10.1007/s10668−021−01381−5
Wang, B., Liu, L., Huang, G., Li, W., and Xie, Y. (2018). Effects of carbon and environmental tax on power mix planning−A case study of Hebei Province, China. Energy 143, 645–657. doi:10.1016/j.energy.2017.11.025
Wang, F., Li, J., and Tu, W. (2017). Voluntary agreements, flexible regulation and CER: Analysis of games in developing countries and transition economies. Procedia Eng. 174, 377–384. doi:10.1016/j.proeng.2017.01.156
Wang, K., Yin, H., and Chen, Y. (2019). The effect of environmental regulation on air quality: A study of new ambient air quality standards in China. J. Clean. Prod. 215, 268–279. doi:10.1016/j.jclepro.2019.01.061
Wang, Q., and Yang, Z. (2016). Industrial water pollution, water environment treatment, and health risks in China. Environ. Pollut. 218, 358–365. doi:10.1016/j.envpol.2016.07.011
Wind (2021). Wind economic database. Available at: https://www.wind.com.cn/NewSite/data.html.
Xie, R., Yuan, Y., and Huang, J. (2017). Different types of environmental regulations and heterogeneous influence on “green” productivity: Evidence from China. Ecol. Econ. 132, 104–112. doi:10.1016/j.ecolecon.2016.10.019
Xinhua−News (2014). Environmental protection law of the people's republic of China (order No. 9 of the president). Available: http://www.gov.cn/zhengce/2014−04/25/content_2666434.htm.
Yu, H., Xu, J., Shen, F., Fang, D., and Shi, D. (2022). The effects of an environmental accountability system on local environmental governance and firms’ emissions. Econ. Syst. 46 (3), 100987. doi:10.1016/j.ecosys.2022.100987
Zeng, J., Liu, T., Feiock, R., and Li, F. (2019). The impacts of China's provincial energy policies on major air pollutants: A spatial econometric analysis. Energy Policy 132, 392–403. doi:10.1016/j.enpol.2019.05.052
Zhang, D., and Vigne, S. A. (2021). The causal effect on firm performance of China's financing–pollution emission reduction policy: Firm−level evidence. J. Environ. Manag. 279, 111609. doi:10.1016/j.jenvman.2020.111609
Zhang, Q., He, K., and Huo, H. (2012). Cleaning China's air. Nature 484 (7393), 161–162. doi:10.1038/484161a
Zhang, Q., Jiang, X., Tong, D., Davis, S. J., Zhao, H., Geng, G., et al. (2017). Transboundary health impacts of transported global air pollution and international trade. Nature 543 (7647), 705–709. doi:10.1038/nature21712
Zhang, X., Guo, Z., Zheng, Y., Zhu, J., and Yang, J. (2016). A CGE analysis of the impacts of a carbon tax on provincial economy in China. Emerg. Mark. Finance Trade 52 (6), 1372–1384. doi:10.1080/1540496x.2016.1152801
Zhao, X., Yin, H., and Zhao, Y. (2015). Impact of environmental regulations on the efficiency and CO2 emissions of power plants in China. Appl. Energy 149, 238–247. doi:10.1016/j.apenergy.2015.03.112
Zhu, P., Zhang, Z., and Jiang, G. (2011). Empirical study of the relationship between FDI and environmental regulation: An intergovernmental competition perspective. Econ. Res. J. 6, 133–145. (in Chinese).
Keywords: environmental policy, pollutant discharge, sustainable development, continuous DID model, time series data
Citation: Li W, Shan W and Gao J (2023) Heterogeneity of environmental protection law’s impact on firms’ pollutant discharge. Front. Environ. Sci. 11:1130652. doi: 10.3389/fenvs.2023.1130652
Received: 23 December 2022; Accepted: 05 April 2023;
Published: 21 April 2023.
Edited by:
Ahmed El Nemr, National Institute of Oceanography and Fisheries (NIOF), EgyptReviewed by:
Jiandong Chen, Southwestern University of Finance and Economics, ChinaZhiming Yang, University of Science and Technology Beijing, China
Copyright © 2023 Li, Shan and Gao. This is an open-access article distributed under the terms of the Creative Commons Attribution License (CC BY). The use, distribution or reproduction in other forums is permitted, provided the original author(s) and the copyright owner(s) are credited and that the original publication in this journal is cited, in accordance with accepted academic practice. No use, distribution or reproduction is permitted which does not comply with these terms.
*Correspondence: Junguang Gao, Z2FvamdAdGguYnRidS5lZHUuY24=