 Haisheng Tang1,2
 Chung-Ya Ou
- 1Party School of the Chaozhou Committee of C.P.C, Chaozhou, China
- 2School of Public Administration, Nanfang College, Guangzhou, China
- 3College of Art Design, Hsuan Chuang University, Hsinchu, Taiwan
Introduction: The existing literature extensively covers factors influencing environmental, social, and governance (ESG) performance. However, there’s a lack of studies exploring the relationship between smart cities and ESG performance. This gap is surprising, particularly considering the significant role that governments in developing countries play in leading smart city initiatives.
Methods: As the impact of smart city pilot (SCP) policies, initiated by governments, on the ESG performance of manufacturing firms lacks verification, our study leverages SCP as a quasi-experiment to examine the effects of smart city development on this performance. Data was collected from 2,229 listed manufacturing firms in China from 2009 to 2020.
Results: Our findings indicate a substantial increase in ESG performance among manufacturing firms due to SCP implementation. Heterogeneity analysis reveals that the positive influence of SCP is primarily advantageous for non-state-owned enterprises. Geographically, SCP significantly enhances corporate ESG performance in eastern and central China, with more muted effects observed in the western region. Two key mechanisms driving the enhancement of corporate ESG performance due to SCP are the promotion of green innovation investment and the improvement of internal control quality.
Discussion: This paper provides valuable insights for policymakers and business leaders in China and other emerging economies. It guides them in fortifying ESG performance, thereby facilitating sustainable corporate growth.
1 Introduction
China is currently undergoing a pivotal economic transformation as its rapid industrialization has led to high economic growth (He et al., 2022). This industrial boom, however, has propelled the nation to the position of the world’s largest energy consumer and carbon dioxide emitter, with its downsides being evident in escalating pollution, increased energy consumption, and carbon emissions (Hu and Zheng, 2021). Specifically, the manufacturing industry, which is notably energy-intensive and pollution-prone, accounts for approximately 60% of China’s total energy consumption and over half of its carbon emissions (Xu and Lin, 2016). Recognizing these challenges, the China government has intensified its focus on the environment, social, and governance (ESG) practices of manufacturing firms (Ge et al., 2022), because these practices are pivotal at enhancing productivity and mitigating environment pollution in the sector (Gao et al., 2022). For instance, in September 2018 the China Securities Regulatory Commission (CSRC) updated the Code of Corporate Governance for listed Companies, laying down foundational guidelines for ESG practice disclosures. This commitment was further underlined in 2021 when CSRC refined and standardized ESG information disclosure requirements for these firms. Such moves underscore a growing emphasis within the China market on ESG-related information of listed entities (Y. Yan et al., 2023). It is clear that government authorities are increasingly sensitive to corporate ESG performance in order to fulfil key green economy policy goals.
The literature has analyzed the factors influencing ESG performance from various perspectives. Aspects examined include ownership structure (McGuinness et al., 2017; Wang et al., 2023), board structure (Menicucci and Paolucci, 2022), leadership characteristics, (Gillan et al., 2021), pledges of controlling shareholders (Huang et al., 2022), M&A activity (Barros et al., 2022), CEO payment (Ikram et al., 2019), CEO confidence (McCarthy et al., 2017), CSR committee (Baraibar-Diez and Odriozola, 2019), executive incentive (Jang et al., 2022) etc. Nevertheless, there is a noticeable gap in examining the relationship between smart cities and ESG performance (Barykin et al., 2023). The scant research available primarily emphasizes the influence of businesses’ spontaneous investments in smart technology, driven by market competition pressures, on ESG (Sun and Saat, 2023). Many of these studies tend to neglect the pivotal role governments play in advancing smart cities.
In developed countries the rise of smart cities stems from both technological advancements and urban demands for efficiency and sustainability (Angelidou, 2015). Conversely, smart cities in developing countries encounter distinct challenges like budget constraints, poor technology-related infrastructure, and lack of skilled human capital. In these nations, governments play a crucial role of addressing infrastructure needs, generating revenue, setting regulatory frameworks to counter technological risks, nurturing human capital, ensuring digital inclusivity, and upholding environmental sustainability. For instance, governments in countries like China and India have embarked on smart city initiatives (Tan and Taeihagh, 2020). However, over a decade later, pressing concerns linger: Have these government-led initiatives positively impacted manufacturing firms’ ESG performance and fostered sustainable development?
To explore this topic, China’s phased smart city pilot program offers an insightful context. Our analysis draws from data collated from the China Stock Market and Accounting Research Database (CSMAR), the Huazheng ESG rating index (HESG), and the City Statistics Yearbook, by considering 2,229 listed manufacturing firms from 2009 to 2020. Utilizing both the difference in differences (DID) and the propensity score matching-difference in differences (PSM-DID) methodologies, we gauge the influence of the smart city initiative on firms’ ratings. The preliminary findings lean towards a beneficial impact.
This paper offers three key additions to the exiting literature. First, our work explores the influence of the smart city pilot (SCP) program on ESG performance. While numerous studies have analyzed the factors affecting ESG engagement or performance from diverse perspectives, (Gillan et al., 2021), few, like the study of Sun and Saat (2023), delve into the impact of intelligent manufacturing on ESG at the enterprise level. Recognizing the pivotal role of governments in fostering smart city development in developing nations (Tan and Taeihagh, 2020), our study introduces a novel perspective to the ESG literature, investigating the causal relationship between a government-initiated smart city pilot and ESG outcomes.
Second, our research enriches the smart cities’ discourse by examining the impact on ESG performance at the micro-firm level. While numerous studies have begun exploring the implications of smart city policies on sustainability, their focus largely remains on broader themes like innovation (Caragliu and Del Bo, 2019; Wang and Deng, 2022), environmental (Li et al., 2020; Chu et al., 2021; Feng and Hu, 2022; Xu and Yang, 2022), carbon emissions (Cavada et al., 2015; Yigitcanlar and Kamruzzaman, 2018; Guo et al., 2022), and green total factor productivity (Jiang et al., 2021; Dong et al., 2022; Wang et al., 2022), among others. Notably, most studies target macro-level affects, overlooking micro-firm implications. For instance, while Chen (2022) assesses the influence of smart city pilot policies on a firm’s total productivity, our paper extends this exploration to firm-level ESG performance. We posit that SCP can significantly enhance manufacturing firms’ ESG outcomes, which are essential for addressing challenges brought about by swift industrialization.
Third, we delve into the heterogeneous effects of SCP. Our findings suggest that non-state-owned enterprises (non-SOEs) derive greater benefits from SCP than SOEs. This aligns with the observations of Sun and Saat (2023). Given that non-SOEs typically confront stiffer financing constraints (Su et al., 2022) and heightened competition (Liu et al., 2022), they benefit more from the infrastructure set forth by smart city initiatives, reflected through enhanced ESG performance. Furthermore, we discern that SCP’s influence is more pronounced in east and central regions than in the west region. In contexts where cities, especially in developing nations, exhibit both resource scarcity and limited proclivity towards sustainability, smart city pilots might not notably bolster corporate ESG outcomes.
Fourth and finally, we pinpoint two pivotal pathways through which SCP impacts ESG performance in manufacturing firms: corporate internal control and green innovation. Echoing the findings of Chen (2022), we observe that manufacturing firms proactively leverage smart city pilot strategies to bolster their ESG metrics via green innovation. Additionally, the integration of advanced artificial intelligence (AI) and digital tools through SCP initiatives fortifies internal governance and risk management in listed manufacturing corporations, leading to improved ESG outcomes.
The structure of this paper is organized as follows. Section 2 outlines the policy background and delves into the underlying mechanisms. Section 3 details our research design, encompassing data sources, variables, and model specification. Section 4 offers the empirical results along with robustness tests for validation. Section 5 examines heterogeneity. Sections identifies key channel affecting the outcomes. Section 7 and Section 8 conclude the study and offer research implications, respectively.
2 Policy background and mechanism analysis
2.1 Smart city policy in China
Since the inception of the concept of smart cities by IBM in 2008, many developed countries in Europe and the United States have pioneered their respective smart city policies. China, however, entered the smart city development arena somewhat later. This late onset came amidst China’s rapid economic expansion, which unfortunately led to a plethora of environmental issues (Xu et al., 2019).
In response to these environmental challenges, China has initiated a variety of measures, including environment regulation, carbon trading, carbon taxing (Zhao et al., 2017; Shi, 2018; Chang and Han, 2020; Song et al., 2020) etc. One crucial component of these actions was the construction of smart cities, which is an integral part of China’s new urbanization drive. The China government, since 2010, has continuously launched relevant policies to guide and encourage the construction of smart cities, all aiming towards the principle of “no disease, less disease, and quick treatment” in urban areas.
In late 2012, China’s Ministry of Housing and Urban-Rural Development officially announced the smart city pilot initiative, which covered 90 places: 37 prefecture-level cities, 50 districts (counties), and 3 towns. The initiative dictated a 3–5-year establishment period for each pilot city. During this period, the China development Bank partnered with local governments to invest in intelligent infrastructure, such as cloud computing, 5G network, high-efficiency online platform, efficient organization, etc., to realize the intelligence of city management (Yang, 2018). In 2013 the government expanded the initiative with the second batch of smart city pilots, which included an additional 103 cities, including 83 at the prefecture level and 20 at the county and town level (MOHURD, 2013).
By 2015 the third batch list of smart city pilots was rolled out, increasing the total to 290. This expansion effectively accelerated China’s new urbanization efforts. For these smart city initiatives, the central government has developed a three-level indicator system to access the construction achievement of the pilot cities. These indicators include network infrastructure, intelligent management and services, and industrial upgrading and new industries (MOHURD, 2012). This system introduced both incentives and pressure on local governments to meet evaluation benchmarks, resulting in diverse policies and actions compared to non-pilot cities.
2.2 Smart city and enterprise ESG performance
Smart city indicatives have far-reaching implications for various aspects of manufacturing firms, including environmental, responsibility, and governance (ESG). From an environmental standpoint, smart cities apply and integrate a vast array of new digital technologies. These technologies play a pivotal role in energy and environmental conservation, directly impacting energy usage and pollutant emissions. Moreover, smart cities aim to foster harmony between humanity and the natural environment, prioritizing the use of clean energy and development of green technology (Vázquez et al., 2018; Chien et al., 2022). Research has indicated that smart city development can bolster green total factor productivity (Jiang et al., 2021; Wang et al., 2022), reduce pollution (Li et al., 2020; Chu et al., 2021; Feng and Hu, 2022), and carbon emissions (Cavada et al., 2015; Yigitcanlar and Kamruzzaman, 2018; Guo et al., 2022).
As for social responsibility, smart city initiatives can significantly influence stakeholders, including shareholders, employees, and consumers. Smart cities utilize digital technology infrastructure to improve individuals’ lives and increase organizational productivity and competitiveness (Lima, 2020). This infrastructure allows companies to transition from a product-centric approach to one that prioritizes user experience (Yong, 2020). As a result, firms operating within smart cities can enhance economic efficiency and workers’ rights and interests, including better working conditions (López-Arranz, 2019) and improved labor remuneration and labor protection (Qi et al., 2020).
On the corporate governance front, smart cities improve access to information and enrich both its depth and breadth. Digital technologies used in smart cities facilitate information exchange (Gupta and Bose, 2022) and knowledge sharing, (Lin et al., 2002), leading to more rational decision-making (Qi et al., 2020). Smart cities provide an efficient platform for firms to communicate dynamic changes to stakeholders, helping to minimize information asymmetry (Chen et al., 2014). Based on the considerations, this paper proposes the first hypothesis.
Hypothesis 1. Smart city construction can increase manufacturing firms’ ESG performance.
2.3 Mechanism of green innovation
Green innovation, defined as technological activities related to green processes or products (Chen et al., 2006), serves as a pivotal driver for green transformation within enterprises (Huang et al., 2021). This paper posits that the construction of smart cities will bolster ESG performance by fostering green innovation in manufacturing enterprise.
First, smart city construction can exert a positive influence on manufacturing enterprise green innovation. By offering a reliable public digital infrastructure, smart cities pave the way for green innovation (Filiou et al., 2023). Within these smart cities, the embedded AI and Internet of Things (IoT) technology infrastructure facilitates technology-intensive industries and helps develop high-tech sectors (Qian et al., 2023). The growth of these sectors stimulates agglomeration of innovation elements, attracts high-end talent, expedites the transformation of scientific and technological achievements, encourages economic entities to invest in research and development, and enhances manufacturing enterprises’ technological innovation abilities. Moreover, smart city construction seeks harmony between humanity and the natural environment, implying an emphasis on clean energy usage and green technology development (Vázquez et al., 2018; Chien et al., 2022). This focus not only fine-tunes green technologies (Hao et al., 2023), but also speeds up the incorporation of energy-efficient and eco-friendly technologies in the manufacturing sector (Witkowski, 2017). In essence, smart city initiatives create a conducive environment for green innovation selection (Gibbs and O’Neill, 2018) and elevate the quantity and quality of urban green innovation (Qiu, 2022).
Second, green innovation significantly enhances manufacturing enterprises’ ESG performance. As green innovation activities increase, the sophistication of green technology improves, and the cost of green production decreases. This dynamic enables companies to more effectively assume environmental responsibility (Peattie and Ratnayaka, 1992) and boost their ESG performance. Moreover, a commitment to fostering green innovation indicates a company’s willingness and propensity to assume social responsibility and to prioritize environmental protection, which in turn enhance its ESG performance. Concurrently, through green innovation activities, companies can project a positive image to external stakeholders, establishing a favorable corporate green image (Xie et al., 2019). This positive image helps attract more investor attention and capital support, thereby providing resources to implement ESG principles. From these premises, we propose the next hypothesis.
Hypothesis 2. Smart city initiatives further enhance manufacturing enterprises’ ESG performance by promoting green innovation.
2.4 Mechanism of corporate internet control levels
The concept of internal control pertains to various control activities aimed at achieving a company’s management objectives and gauging the level of internal governance and risk control within listed companies (Zhong et al., 2022). First, the construction of smart cities applies emerging information technologies to spur organizational structure and enhance the level of internal governance (Acemoglu et al., 2007). Specifically, smart city construction embeds crucial information and personnel into the information management system, facilitating a shift from vertical management towards a flatter, information-centric, networked management. This transition strengthens interdepartmental relationships and improves information transmission efficiency within the enterprise. Furthermore, by utilizing visual data workflows, IT governance, and data mining, smart city construction significantly improves the information transparency of business decisions (Solana-González et al., 2021), thereby enhancing the quality of supervision and ensuring efficient management.
Second, smart cities leverage technologies like big data and artificial intelligence to digitize, network, and intelligently manage risk. This approach mitigates one-sided information from scattered data and enhances data processing efficiency and security. In terms of risk model construction, multidimensional data analysis is performed on business positions and processes, allowing differentiated supervision and responses in various scenarios based on big data analysis results. Ultimately, enterprise risk management and internal control evolve from fragmented to systematic and from uniform to diverse (Fan, 2022).
Internal control is critical for integrating ESG (Harasheh and Provasi, 2023). Koo and Ki (2020) argue that firms with weak internal controls tend to have low ESG ratings, suggesting that robust internal control bolsters corporate sustainability. Effective internal control enhances corporate environmental protection investment (Yang et al., 2020), ensures law compliance (Le et al., 2022), and increases green levels (Li and Shen, 2021). Additionally, internal control effectively detects fraud risks that curtail improper behaviors damaging corporate reputation (Hao et al., 2018) and helps encourage managers to make shareholder-friendly decisions and to proactively fulfill social responsibilities (Liu, 2018). By improving the supervision and incentive system for managers, internal control can mitigate agency conflicts and curtail self-serving behaviors by managers (Abbott et al., 2007). Consequently, effective internal control cultivates a conducive business environment for an enterprise and ensures long-term financial forecasts and decisions, thereby enhancing their environmental, social, and governance performance and aiding in achieving sustainable development (Yang et al., 2020). Given the above, we propose the following hypothesis.
Hypothesis 3. Smart city initiatives can boost manufacturing enterprises’ ESG performance by improving the level of internal control within the pilot area enterprises.
3 Research design
3.1 Sample design
This paper considers 2,229 Chinese A-share listed manufacturing firms from 2009 to 2020 as the research sample. The selection of listed manufacturing firms is primarily due to their comprehensive disclosure of key research content such as “ESG performance.” These firms provide reliable data through trusted databases, making them ideal for this investigation. The ESG rating index of Chinese listed firms dates back to 2009, with ESG data obtained from the Wind database.
Additional micro-data related to the corporations come from the CSMAR database, which is the most comprehensive and accurate financial and economic database in China. It includes fundamental information on governance structure, financial status, and operational conditions of listed companies. Macro-data related to cities are sourced from the China City Statistical Yearbook.
To ensure the integrity and accuracy of the research findings, the following data processing steps have been taken. 1) Companies in the ST and *ST categories, denoting firms with financial issues or other abnormalities that could potentially skew the research conclusion, are excluded from the sample. 2) Any sample with missing relevant data are also excluded. 3) The continuous financial variables are winsorized at the 1% and 99% quartiles to mitigate the effect of extreme values. After this thorough screening, the paper ends up with 13,923 firm-year sample observations. Data processing and regression analyses are carried out using STATA17.0.
3.2 Variable definitions
3.2.1 Dependent variable: ESG score (ESG)
Our dependent variable is corporate ESG performance (ESG). The ESG rating index is a recognized tool for the quantitative assessment of firms’ ESG performance. We employ the Huazheng ESG rating index (HESG) to gauge this performance, as it encompasses A-share listed manufacturing firms over an extended timeframe. HESG is comprised of 3 primary indicators, 14 secondary indicators, 26 tertiary indicators, and over 130 underlying indicators. For robustness testing, we also use the SynTao Green Finance Agency ESG evaluation index (SESG) and the Bloomberg ESG evaluation index (BESG), but these indices have limitations. SESG was first announced in 2015, while Bloomberg covers about 1,000 Chinese listed firms. Compared to HESG, both SESG and BESG exhibit more data gaps.
3.2.2 Independent variables: smart city pilot (SCP)
The treatment variable, smart city pilot (SCP), is a binary variable reflecting the city of a firm’s registration. If a city is approved as a smart city, then its SCP takes a value of 1 and otherwise 0.
3.2.3 Mediating variables
Internal control effectiveness (IC): We determine the effectiveness of internal control using the disclosure of internal control deficiencies from the listed companies’ internal control evolution reports. In this context, a lack of deficiencies indicates effective internal controls and gives this variable a value of 1. Conversely, the presence of deficiencies set its value to 0.
Green innovation (Gpatent): Green innovation is quantified as the natural logarithm of total green invention patents granted to a firm plus one.
3.2.4 Control variables
Based on the literature, we select the control variables at two levels: firm and city. Data on firm characteristics are taken from China Stock Market and Accounting Research Database (CSMAR) and encompass the following: 1) enterprise size; 2) financial leverage; 3) return on total assets; 4) proportion of control rights owned by the actual controller; 5) percentage of shares held by the largest shareholder; 6) Tobin’s Q value; and 7) age since listing. Data on city characteristics are from the China City Statistical Yearbook (2009–2019) and include: 8) per capita GDP; 9) GDP growth rate; 10) industrial sulfur dioxide emissions; 11) annual average concentrations of inhalable particulate matter (mg/m3); 12) industrial nitrogen oxide emissions; 13) centralized treatment rate of sewage treatment plants; and 14) harmless treatment rate of domestic waste. The variables appear in Table 1.
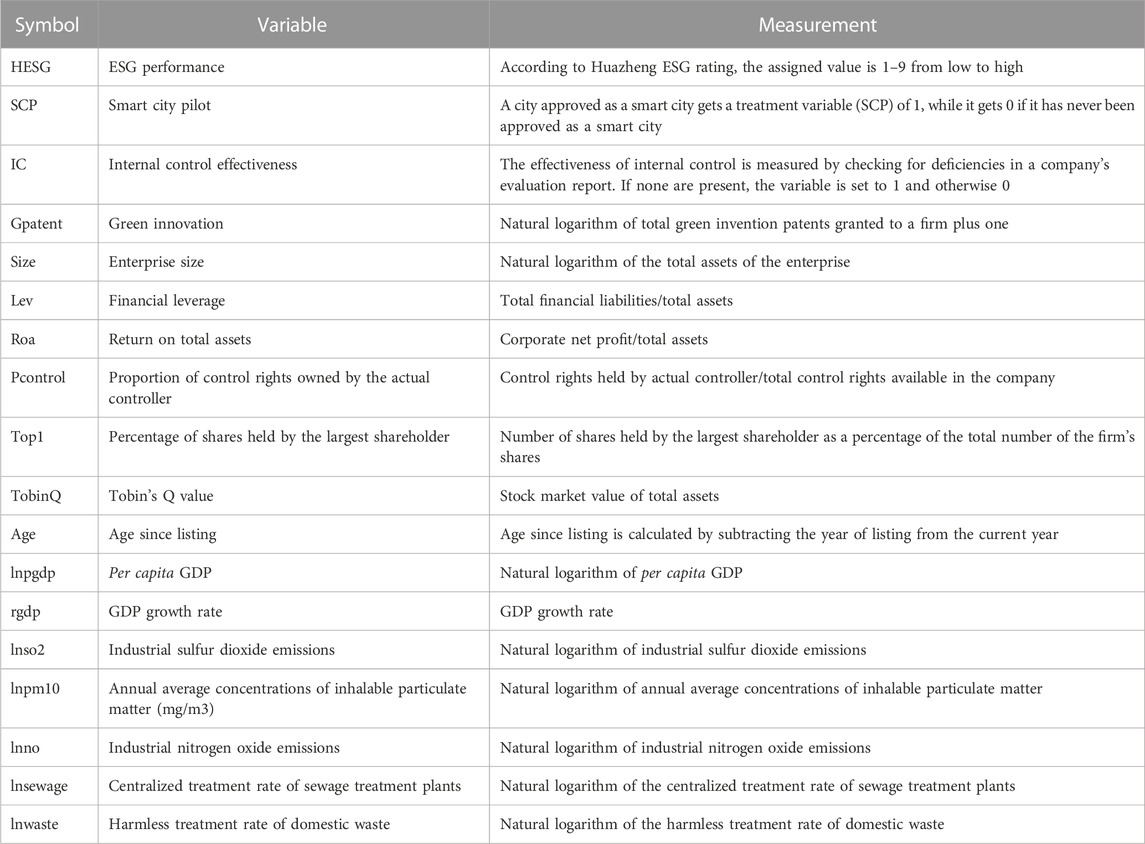
TABLE 1. Variable definitions.
3.3 Model design
China’s smart city pilot policy is akin to a quasi-natural experiment. Pilot cities function as the experimental group, while non-pilot cities serve as the control group. The difference in differences (DID) model is widely used in the literature for policy effect evaluation. Given that China had three batches of national smart city pilots in 2012, 2013, and 2015, we adopt a dynamic DID approach, as Beck et al. (2010) and Wang et al. (2011) and set up the following econometric regression model (see Eq. 1):
Here,
4 Empirical results
4.1 Descriptive statistics
Table 2 shows the results of descriptive statistics. HESG, our primary dependent variable indicating ESG performance, has 13,923 observations with a mean value of 4.046 and a standard deviation of 1.038. It ranges from 1 to 8, showing a moderate level of variability in ESG performance among the firms in our sample. Our key independent variable, SCP, has the same number of observations, reflecting a mean of 0.330 with a standard deviation of 0.470 and suggesting that roughly 33% of the manufacturing firms in our sample are located in smart cities.
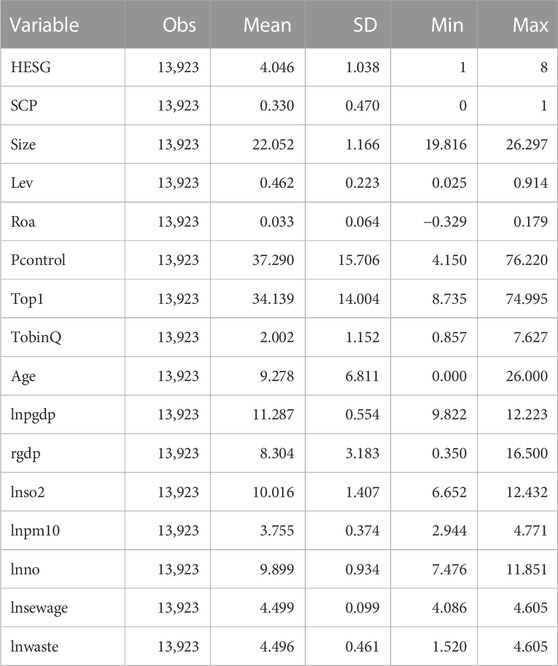
TABLE 2. Descriptive statistics for all variables.
4.2 Baseline regression results
Table 3 presents the regression results of SCP on ESG performance. To account for heteroscedasticity, this paper provides results employing robust standard errors. Firm and time effects are fixed across all columns. The initial regression equation without control variables shows SCP with a significant coefficient of 0.162 at the 1% level, implying a 0.162% increase in a firm’s ESG performance with every 1% rise in SCP policy.
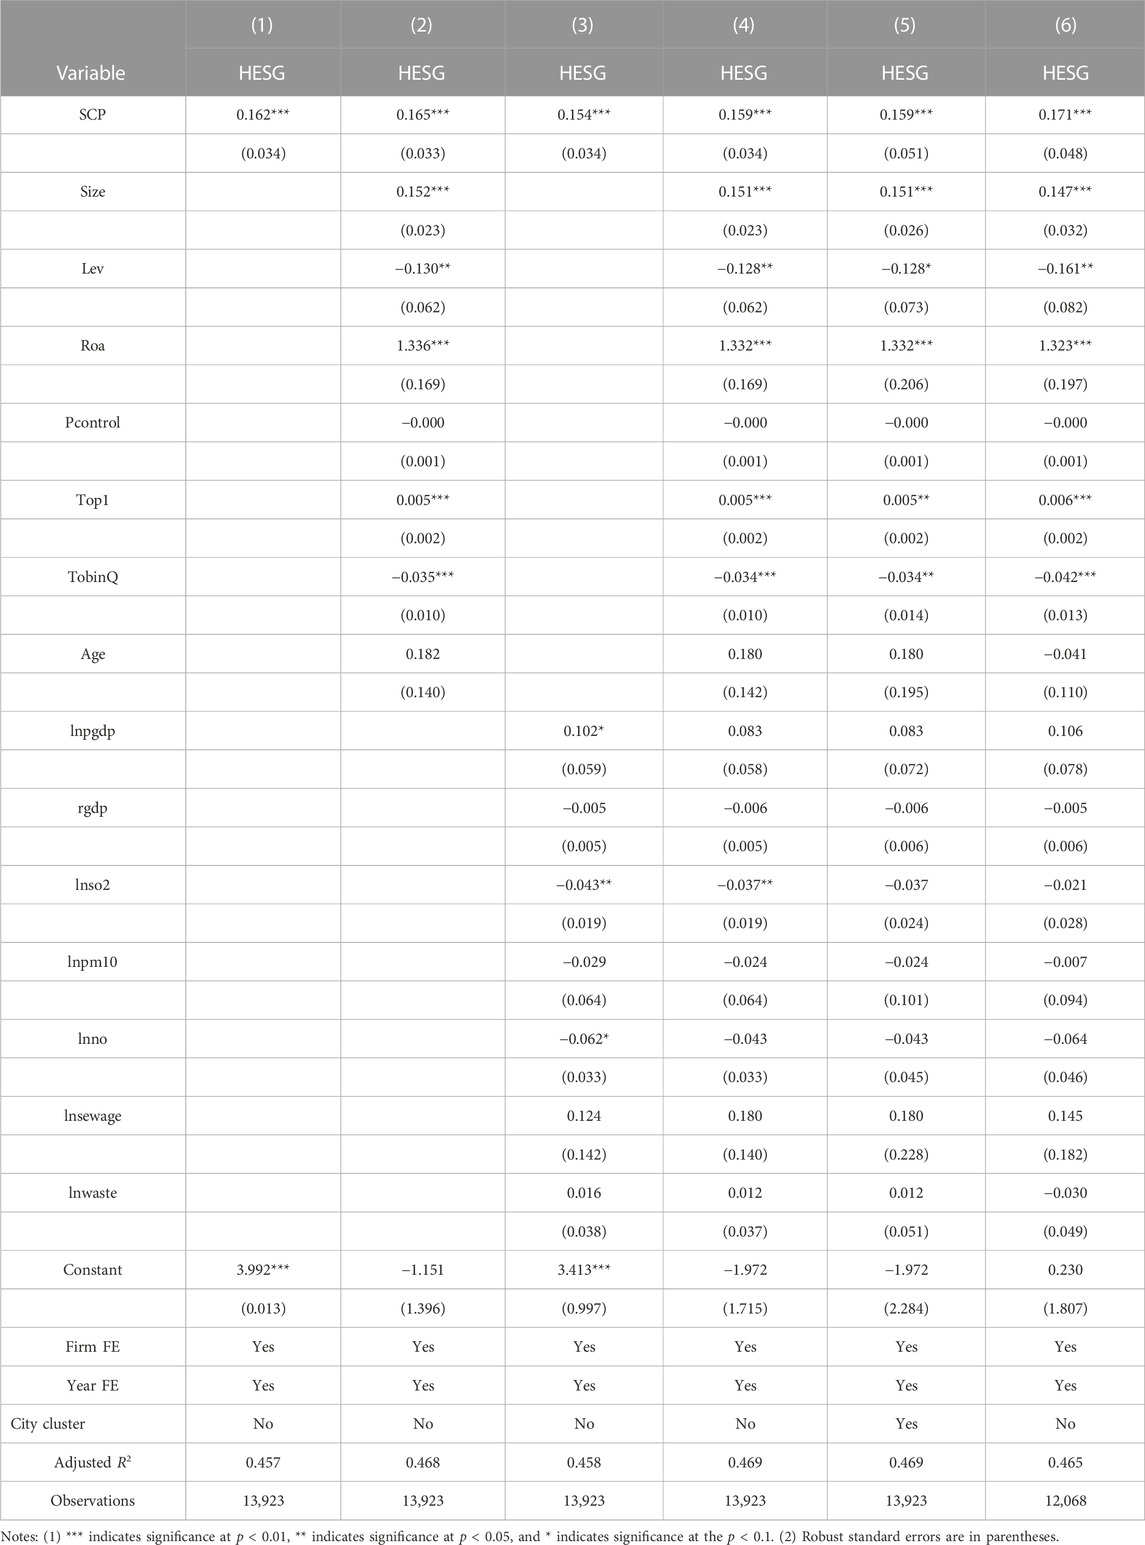
TABLE 3. Baseline regression results.
Subsequent models add firm characteristics (column 2), city characteristics (column 3), and both firm and city characteristics (column 4). Regardless of these added characteristics, SCP significantly boosts the ESG of firms in pilot cities.
Column (5), applying city-level clustered robust standard errors, reports an SCP regression coefficient of 0.159 at the 1% significance level. This consideration acknowledges the unique situation of Beijing, Tianjin, Shanghai, and Chongqing—municipalities directly under central government regulation with high political status, population density, and economic development (Sun et al., 2021). When we exclude these four municipalities in column (6), the SCP regression coefficient is 0.171, which is still significant at the 1% level. These findings support Hypothesis 1.
4.3 Robustness test
4.3.1 Parallel trend test
The difference in differences (DID) model necessitates that both the treatment and control groups fulfill the parallel trend assumption. This means that there should be no significant difference in ESG performance between these two groups before the event under study. To ensure this, we structured our estimation equation as follows (see Eq. 2):
Here, D equals 1 if the city, in which the firm is located, initiated SCP in a particular year and 0 otherwise. Figure 1 illustrates the results of the parallel trend test for the first 5 years and the last 8 years of a city’s implementation. The regression coefficients from
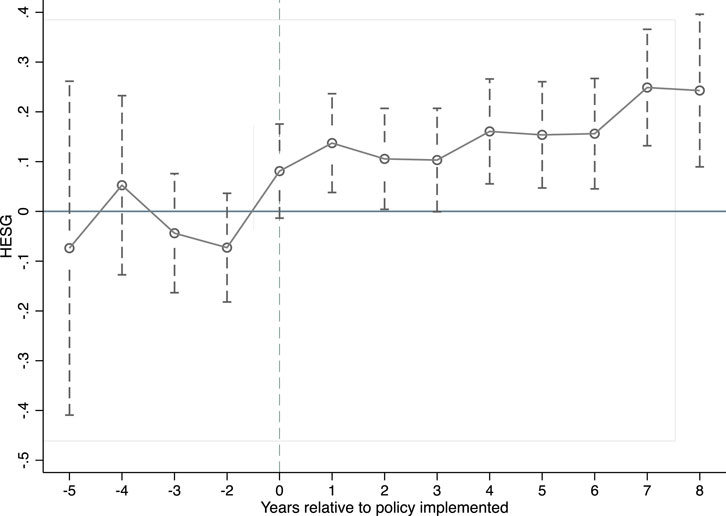
FIGURE 1. Parallel trend test of the impact of SCP on HESG. Note: The black dash line shows the confidence interval for the regression coefficients at the 5% significance level. The gray solid line represents the 0 scale line on the vertical axis, indicating that the regression coefficient is 0. The gray dotted line is the 0 scale line on the horizontal axis, indicating the year in which the policy is implemented.
4.3.2 PSM-DID
Firms may factor in economic and other attributes of their place of incorporation, potentially leading to selection bias. To address this, we utilize propensity score matching (PSM) as a strategy to mitigate such bias (Dehejia and Wahba, 2002). Following the methodologies of Heyman et al. (2007) and Böckerman and Ilmakunnas (2009), our study conducts yearly propensity score matching. This approach emphasizes yearly matching, primarily within the current year, preventing mismatches such as pairing the 2009 sample with the 2020 sample.
Figures 2A, B represent the kernel density function plots before and after matching, respectively. By comparing these figures, it is evident that the treatment and control groups are considerably more aligned after one-to-two matching. The reduced distance between the groups affirms this. It demonstrates the validity of the samples obtained using PSM and ensures the reliability of the paper’s estimation results.
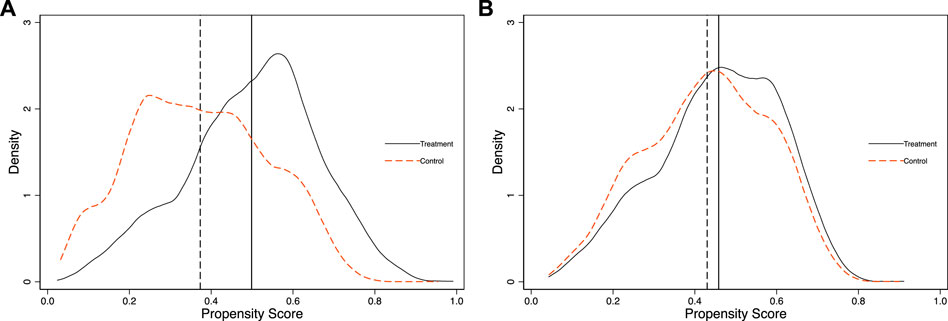
FIGURE 2. Kernel density test: (A) Before year-by-year and (B) After year-by-year matching.
In this study we select three types of samples to evaluate the impact: those with non-zero matching weights (_weight! = .), those satisfying common support (On_Support), and those undergoing frequency-weighted regression (Weight_Reg). Table 4 presents the new regression results derived from these newly obtained samples. The regression coefficients of SCP are significantly positive with no considerable changes in their magnitude and significance level, suggesting credibility of the regression outcomes.
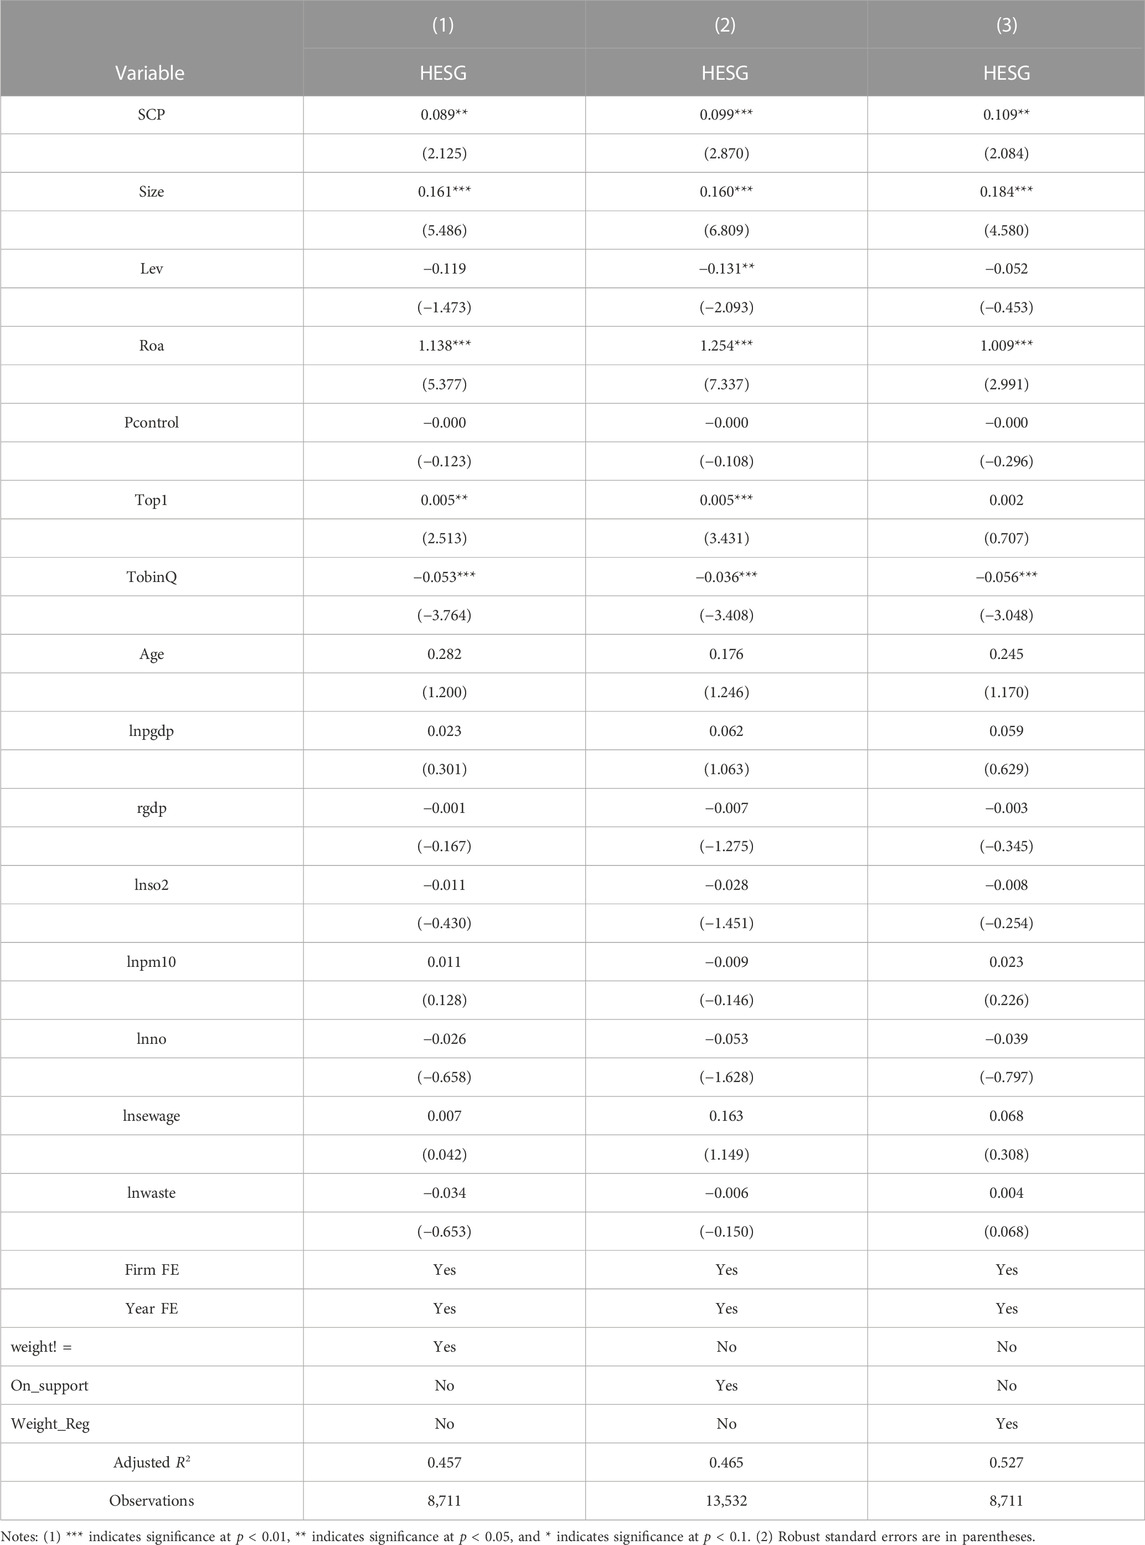
TABLE 4. Impact of SCP on ESG within PSM-DID
This study decides to select different samples to test the impact effect. These samples are of three types: those matching weights not equal to zero, those that meet common support (On_Support), and those that undergo frequency-weighted regression (Weight_Reg). Using these new samples obtained after matching, the new regression results appear in Table 4. The regression coefficients of SCP are significantly positive, and there are no significant changes in the magnitude and significant level of these regression coefficients, indicating the regression results are credible.
4.3.3 Placebo test
We execute two distinct placebo tests to eliminate the effect of any unobserved variable on the regression results of SCP and to enhance the robustness of the estimates (Dong et al., 2022). In the first placebo test, we simulate a scenario where SCP was initiated during the pre-reform period. We postulate that the smart city pilot was implemented 1–5 years ahead of the actual schedule. The results are displayed in Table 5. The coefficients are not significant. This implies that SCP only influences the ESG performance of manufacturing firms in smart cities following the actual policy implementation. Put simply, the ESG effect associated with the smart city pilot holds significance.
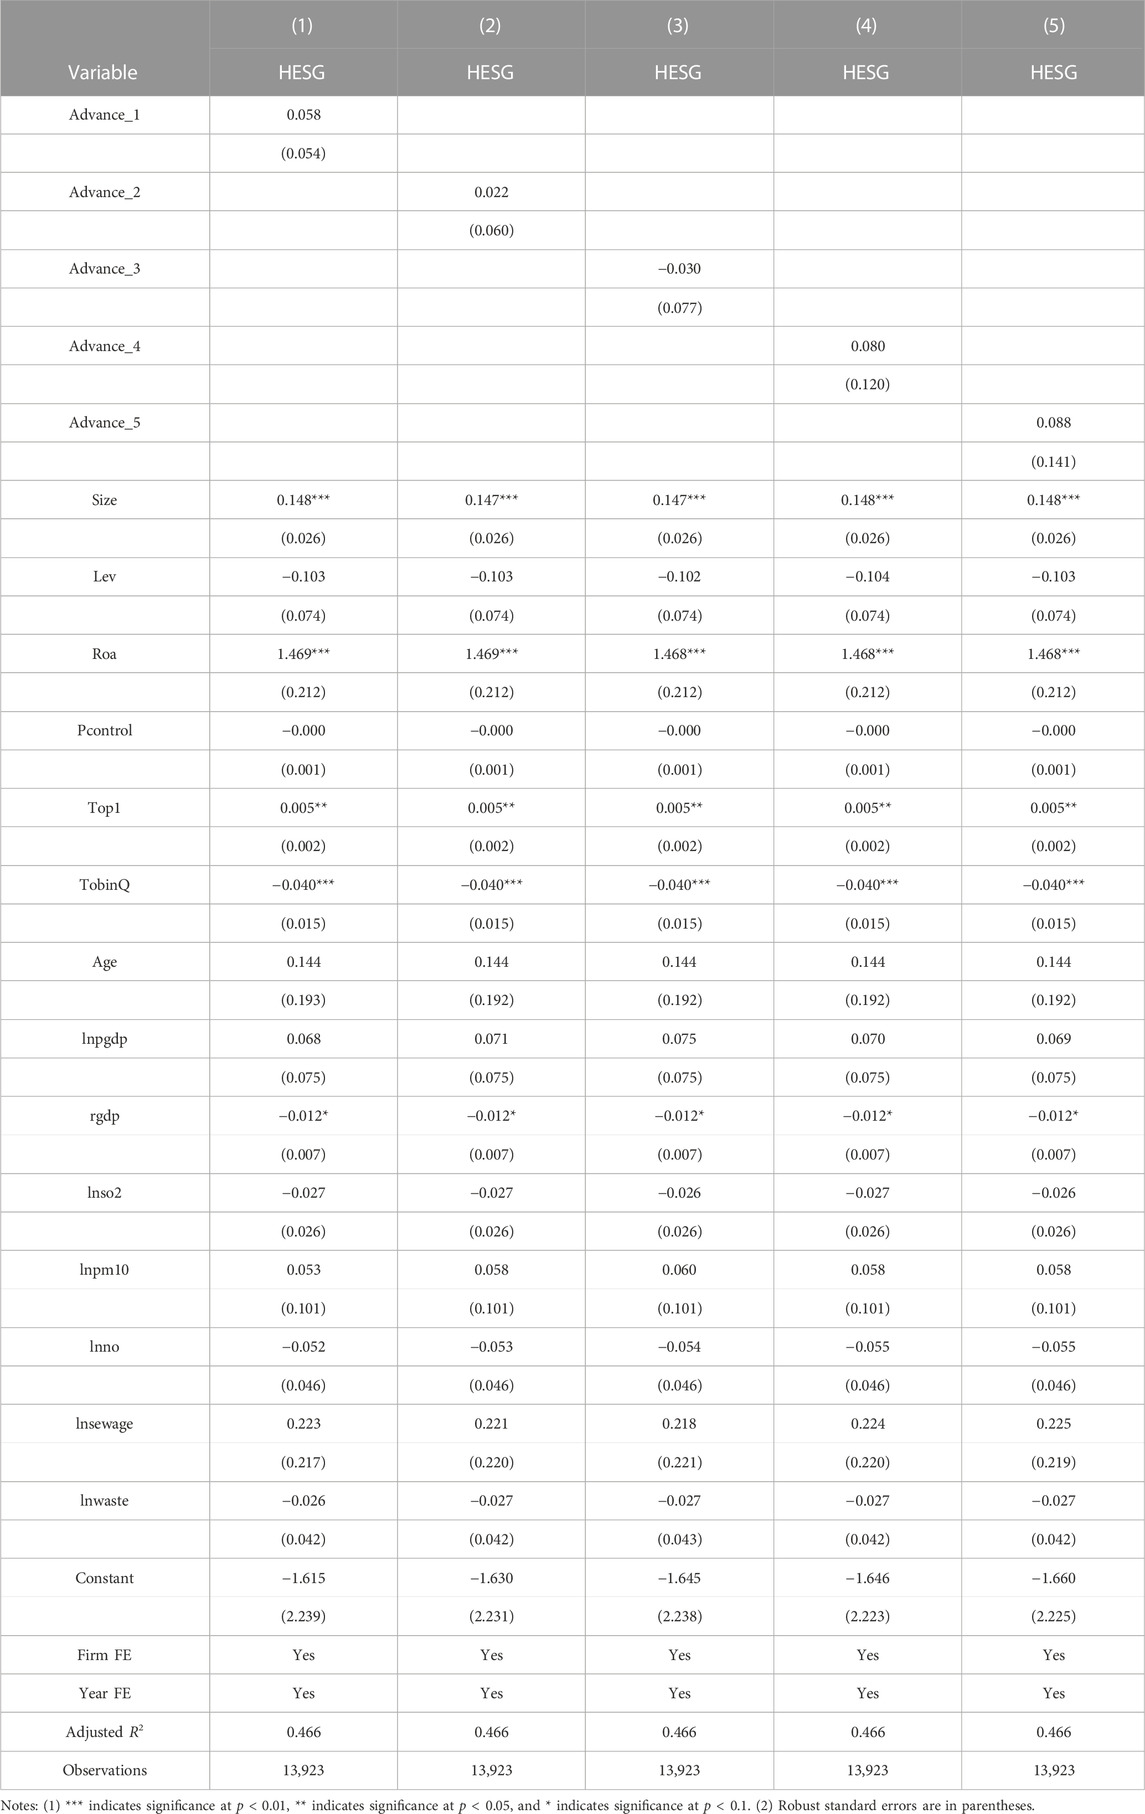
TABLE 5. Placebo test using the fake treatment time.
For the second placebo test, we create a fictitious group. We choose an imaginary treatment group, containing the same number of cities as the original treatment group. This procedure was repeated 1,000 times. Figure 3 illustrates the kernel density plot of the SCP coefficients for these 1,000 repetitions, with the estimates after random sampling primarily hovering around 0. This infers that the remaining omitted coefficients are 0, suggesting that the regression outcomes are not swayed by unobserved variables, and that the influence of SCP on ESG performance is notably robust.
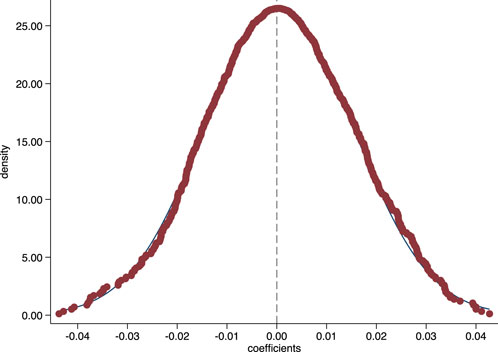
FIGURE 3. Kernel density plot of the placebo test coefficients (the virtual treatment).
4.3.4 Alternative measures of ESG performance
To confirm the robustness of our findings, we undertake a series of supplementary tests. Initially, we replace year-end data with the quarterly average of Huazheng’s ESG scores (QHESG). The outcome, presented in column (1) of Table 6, shows a significantly positive regression coefficient for SCP at the 1% level.
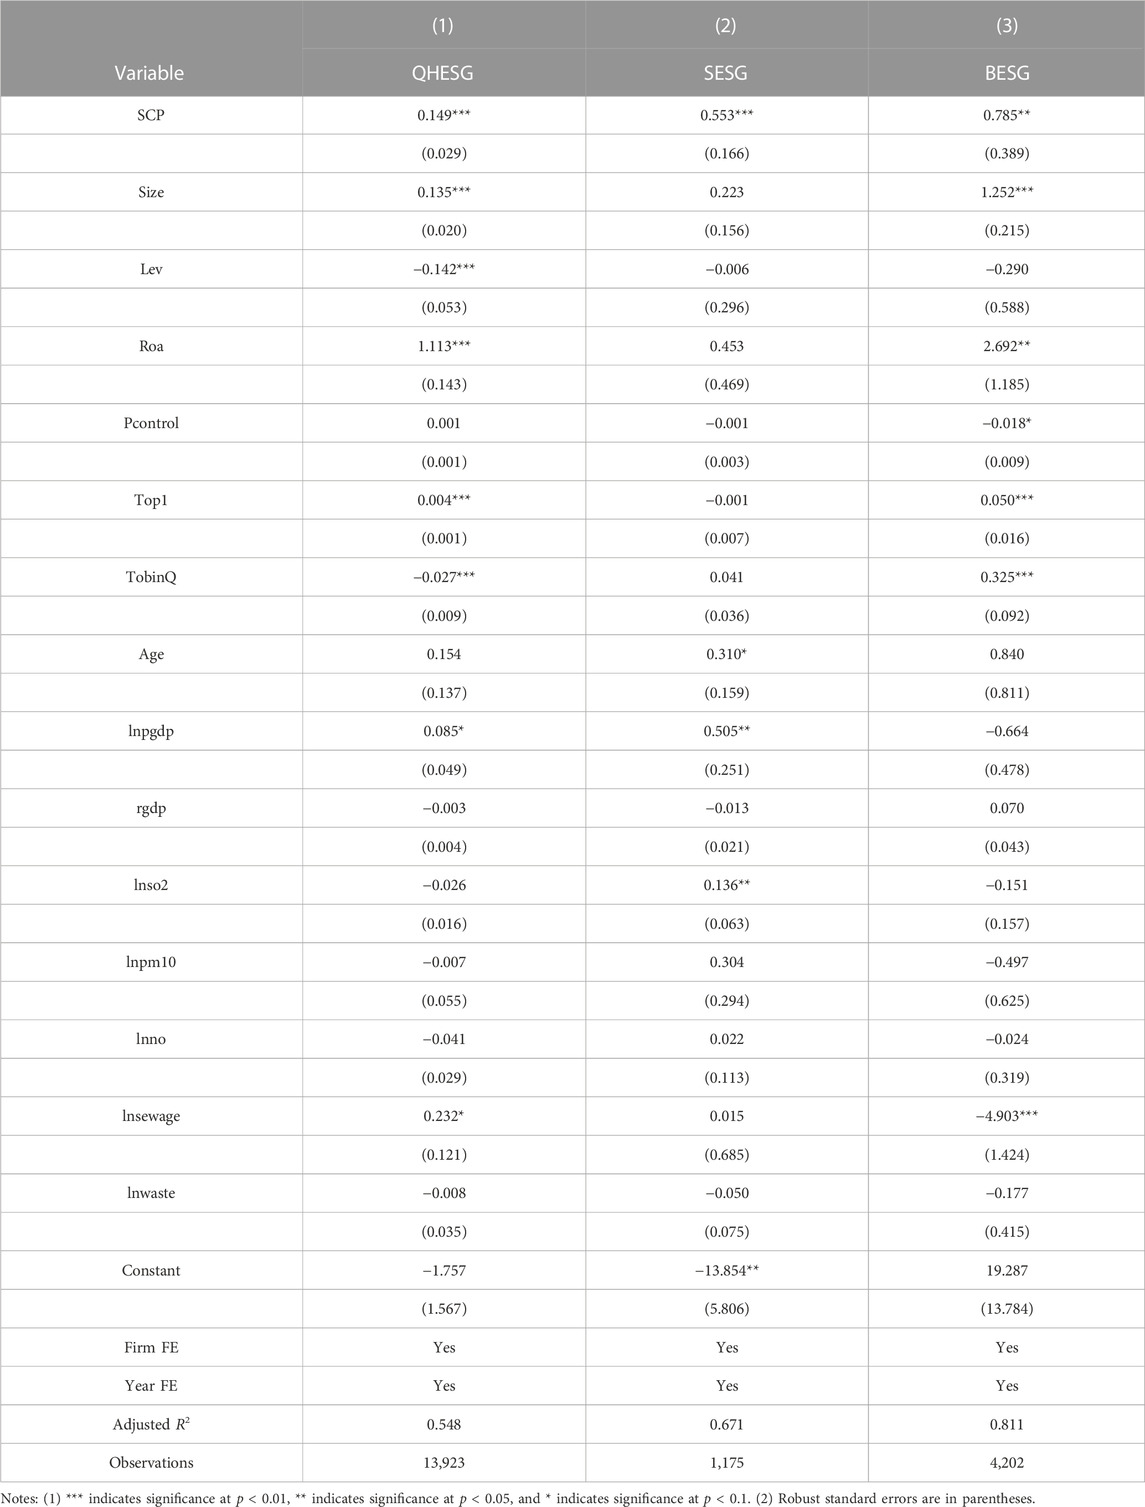
TABLE 6. Alternative measures of ESG.
Apart from the Huazheng database, various authoritative rating agencies or financial information providers also assess enterprises’ ESG performance, effectively promoting sustainable behaviors (Chen and Xie, 2022). In this context, we substitute the baseline regression model’s Huazheng ESG scoring data with SynTao Green Finance Agency (SESG) and the ESG scoring data of BloomBerg (BESG) respectively to perform robustness checks. The control variables and fixed effects align with the baseline regression model. The regression outcomes for SynTao Green Finance Agency’s ESG rating data and BloomBerg’s ESG score data are presented in columns (2) and (3) of Table 6. Here again, we observe a positive and statistically significant impact of SCP on manufacturing firms’ ESG performance.
4.3.5 High dimension fixed effect
In order to account for the time-invariant heterogeneity across provinces or cities, as well as to buffer any province-specific economic and political fluctuations (for example, those triggered by changes in provincial leadership or the central government’s regional policies), we incorporate the covariates of province fixed effects (FE), Prov ×Year fixed effects (FE), and City fixed effects (FE) as shown in Table 7. The primary results are consistent—that SCP significantly boosts the ESG performance of firms.

TABLE 7. Robustness test of high dimension FE.
5 Heterogeneity test analysis
We begin by evaluating the heterogeneity effect between enterprises of different ownerships. State-owned enterprises (SOEs) and non-state-owned enterprises (non-SOEs), operating in distinct business environments and using varied decision-making mechanisms in China, present interesting contrasts (Dong et al., 2022). Table 8 columns (1) and (2) display the results of our ownership-focused analysis. Our data reveal that SCP do not affect the ESG performance of SOEs, but they do enhance the ESG performance of non-SOEs. This conclusion aligns with Sun’s research (Sun and Saat, 2023), suggesting that non-SOEs have a larger potential for ESG performance improvement than SOEs. Notably, the former, facing more intense financing constraints (Su et al., 2022) and marked competition (Liu et al., 2022) than the latter, benefit more from the infrastructure developed by smart city pilots in terms of ESG performance enhancement.
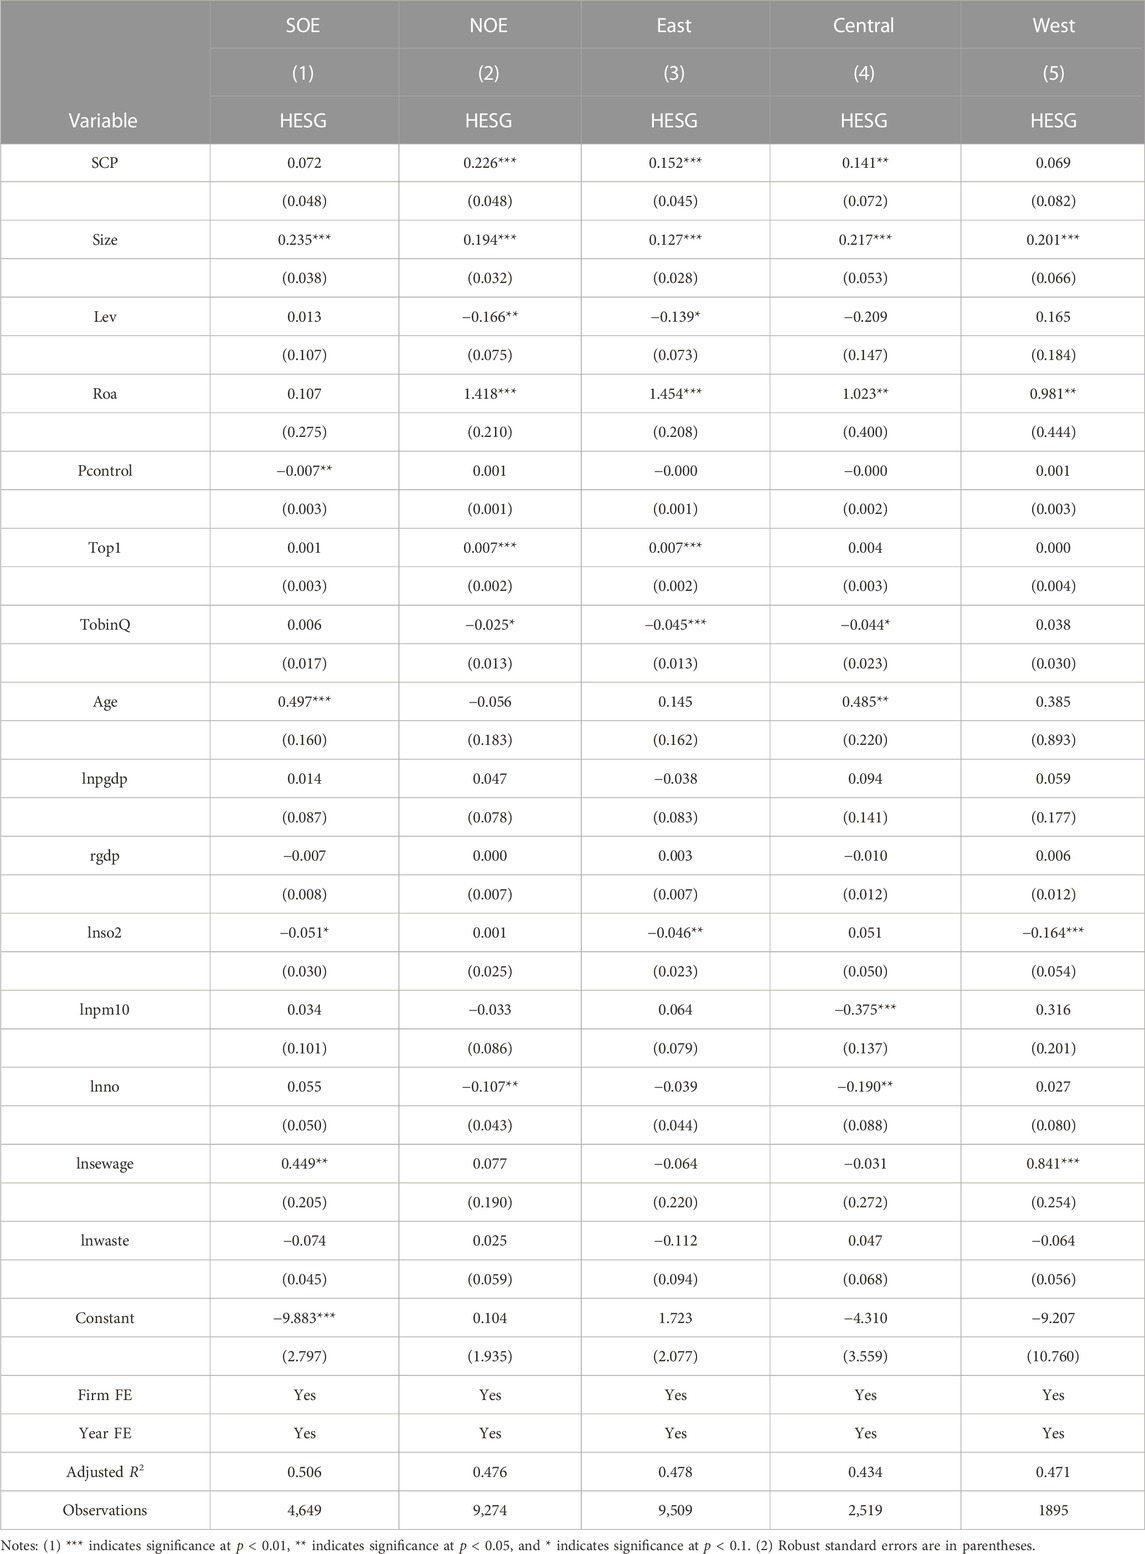
TABLE 8. Regression results based on firm heterogeneity.
We next consider the influence of regional differences on enterprise ESG practices (Wang et al., 2023). China, following a development model that prioritizes efficiency since its reform and opening up, displays stark regional disparities (Wang et al., 2023). These disparities translate to notable differences in resources, industrial characteristics, and government policies across regions. (Liu et al., 2021; Wen et al., 2023). For a more comprehensive understanding of SCP’s influence on enterprise ESG performance, we classify cities into three types: east region (East), central region (Central), and west region (West). A separate regression is conducted for each to understand SCP’s influence on enterprise ESG performance more comprehensively.
Table 8 columns (3)–(5) present results for the east, central, and west regions, respectively. SCP significantly boosts corporate ESG performance in the east and central regions. However, in the west region, SCP does not notably influence corporate ESG performance. The east and central regions, boasting a larger concentration of labor and industry (Li et al., 2023), foster green innovation through increased labor input, information infrastructure, and fiscal expenditure (Z. Yan et al., 2023). Conversely, the west region, characterized by underdeveloped technology and economic infrastructure, prioritizes economic growth (Qiu, 2022). Despite initiating smart city pilots, these cities within this region show a lack of both resources and willingness to promote sustainable development through improving enterprises’ ESG performance.
6 Mechanism testing
We proceed to examine the potential pathways and mechanism. Following the model proposed by Baron and Kenny (1986), we construct a mediation effect model to verify the mechanism of the smart city pilots on ESG. This model can be segmented into three stages. The first stage (see Eq. 3) is the same as Eq. 1. In the second stage, we assess whether the smart city pilots affect internal control or green innovation (see Eq. 4). In the third stage, we incorporate the internal control or green innovation into the dynamic DID model and verify their statistical significance (see Eq. 5):
Table 9 displays the results of the mechanism test. The regression coefficient of SCP in model (1) is significantly negative, while the regression coefficient of IC in model (2) is also significantly negative. This indicates that SCP could enhance corporate ESG performance by mitigating corporate internal control deficiencies. On the other hand, the regression coefficient of SCP in model (3) is significantly positive, and the regression coefficient of Gpatent in model (4) is likewise significantly positive. This suggests that SCP could enhance corporate ESG performance by fostering firms’ green patents.
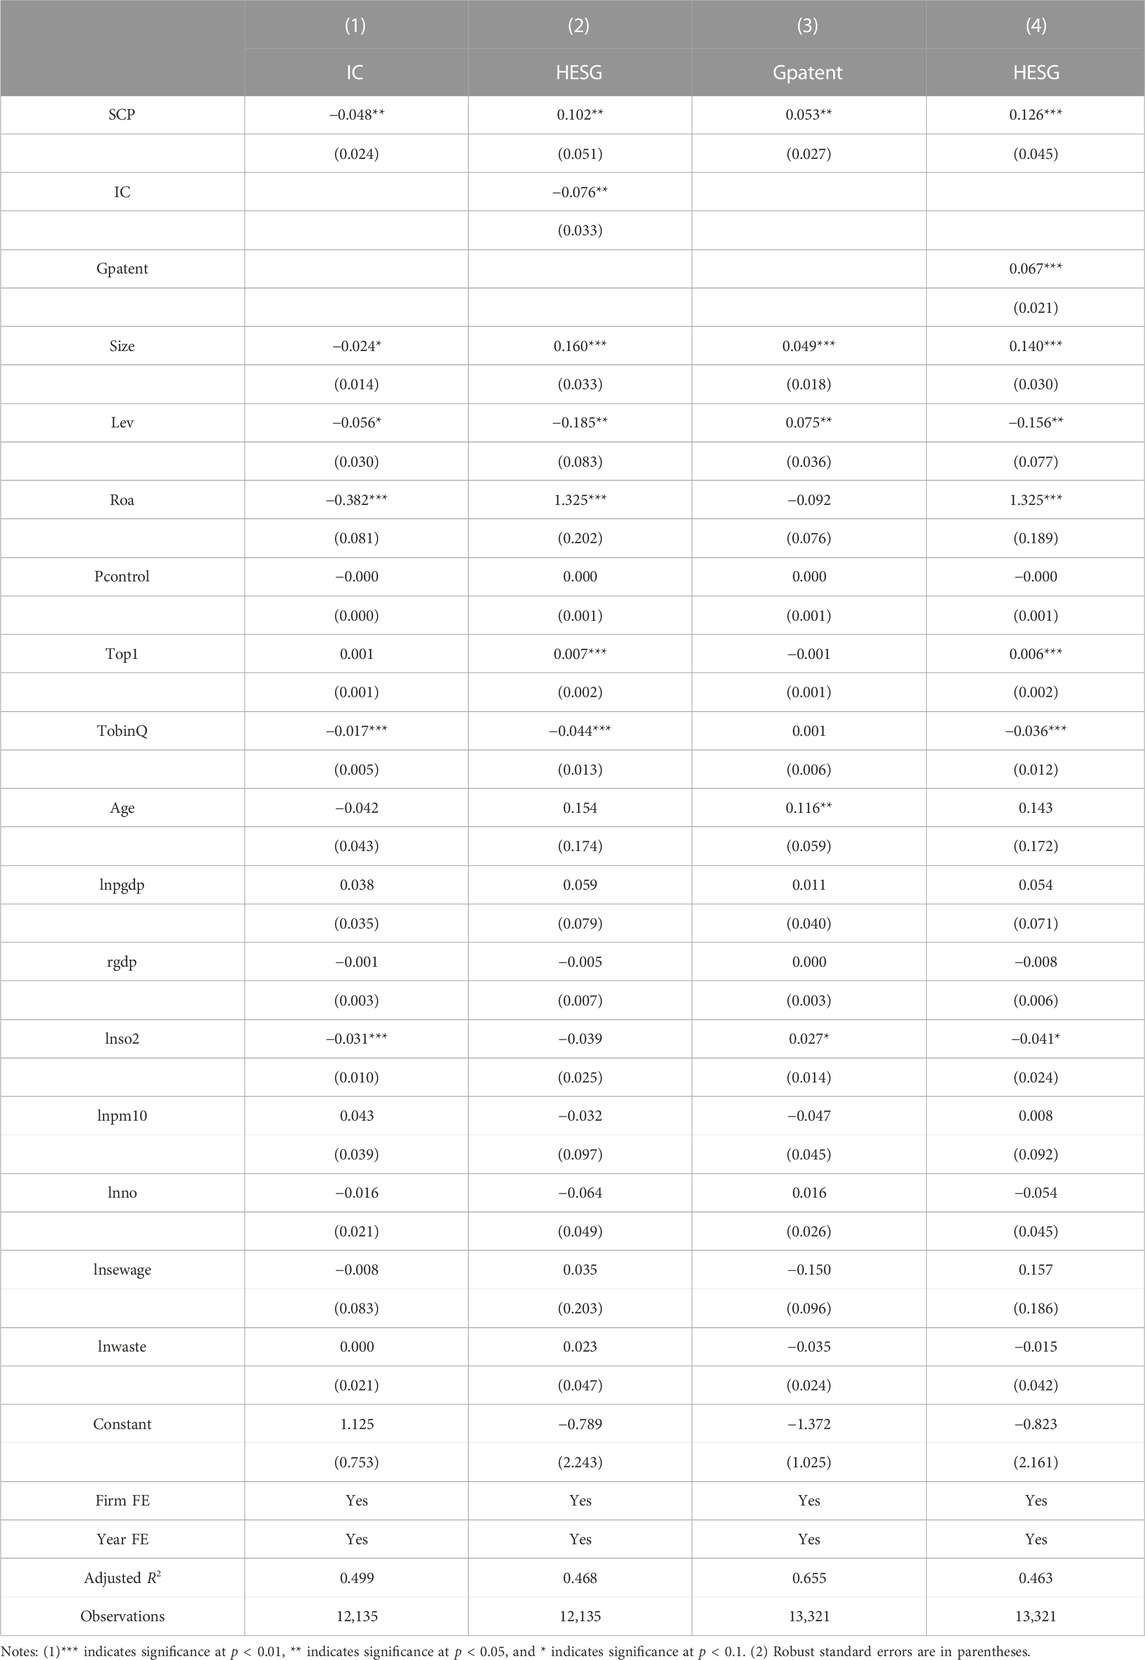
TABLE 9. Mechanism testing.
7 Conclusion
This paper considers the implementation of the smart city pilot policy as a quasi-natural experiment. Utilizing data from 2,229 manufacturing firms listed in China between 2009 and 2020, we investigate the potential of SCP to enhance corporate ESG performance. We also delve into the mechanisms by which SCP impacts corporate ESG performance. Our study illuminates how SCP serves as crucial infrastructure to augment corporate ESG performance in developing countries. The specific findings of the study are as follows.
First, SCP can notably bolster corporate ESG performance, which is a result that remains robust after a series of tests. We find that, compared with non-pilot cities, smart city construction amplifies corporate ESG performance by 15.9%. This demonstrates the remarkable success of China’s smart city pilot policy. The effect persists at being significantly positive after the parallel trend test, PSM-DID, the placebo test, alternative measures of ESG performance, and high dimension fixed effect inclusion.
Second, the SCP’s effects vary across different firms. Our heterogeneity test based on corporate ownership reveals that the impact of SCP on improving ESG performance is restricted to non-SOEs. SOEs do not exhibit a significant impact of SCP on ESG performance. Compared to them, non-SOEs derive greater benefit from the infrastructure developed by smart city pilots, as evidenced by enhanced ESG performance. The heterogeneity test based on corporate location indicates that SCP significantly improves corporate ESG performance in the east and central region, but not in the west region. In cities lacking both resources and willingness to promote sustainable development, smart city pilots have failed to improve enterprise ESG performance.
Third and finally, SCP improves corporate ESG performance via two mechanisms: internal control and green innovation. SCP diminishes corporate internal control deficiencies and augments the volume of corporate green innovation, both of which subsequently advance corporate ESG performance. Our exploration for the internal mechanisms through which smart city construction enhances corporate ESG performance contributes to understanding how to fully unlock the benefits of smart city construction.
This study, in a theoretical context, delves into SCP’s influence on manufacturing firms’ ESG performance and expounds on two mechanisms via which SCP strengthens corporate ESG performance. However, the study is not without limitations. SCP’s influence on corporate ESG performance extends beyond the two explored channels, warranting future research to uncover additional channels like information environment and resource allocation efficiency. The study’s focus also is confined to the heterogeneity of corporate ownership and location, calling for future research to analyze SCP’s impact on ESG performance from more diverse perspectives. Furthermore, this study treats corporate ESG performance as a unified entity. Future research may consider the individual impact of SCP on the E, S, and G components. Lastly, policy creation and its impact are often influenced by external factors (Praharaj et al., 2018), such as economic policy uncertainty (Sharif et al., 2021) and political uncertainty (Sohail et al., 2022), leading to their consideration in future studies.
8 Implications
SCP not only enhances firms’ total factor productivity (Chen, 2022), but also bolsters ESG performance. This in turn helps the China government combat industrialization-induced challenges and stride towards sustainable development. Consequently, this study offers several implications.
First, from a policy perspective, our empirical analysis provides critical insights for policymakers in developing economies. To address a broad spectrum of environmental challenges, China initiated a smart city pilot policy in 2012. This policy aimed at revolutionizing the traditional urban development model through digital technological reform, thereby creating opportunities for both innovations and green development (Cao et al., 2019). This paper aligns with these efforts, showcasing how SCP bolsters ESG performance and lays the groundwork for a transition to sustainability.
Second, our research underscores the pivotal role of SCP in boosting corporate ESG performance, particularly in developing countries, due to its potential to exert a system-level impact. It also highlights the importance of policy for advancing digital infrastructure to facilitate sustainability transition in cities. Policymakers should therefore persist in fostering public digital infrastructure development (such as AI and IoT), along with the corresponding expertise. This support will help city stakeholders overcome barriers to AI and IoT implementation and develop necessary capabilities.
Third, the research also uncovers in the underdeveloped west region with poor infrastructure that ESG performance enhancement is considerably less. As such, meeting basic infrastructure needs, securing funding, and crafting regulatory frameworks are crucial during the smart city construction phase. These steps will ensure cities have the requisite resources and inclination to drive sustainable development.
Fourth, the results reveal that green innovation is a vital pathway to elevate ESG performance among manufacturing firms. Hence, government regulations should facilitate knowledge protection and incentivize technological innovation. Doing so can promote renewable energy usage and foster a conducive institutional for green innovation.
Fifth, business managers should not only recognize the merits of smart city policies, but also actively synchronize their corporate strategies with these policies to foster sustainable growth. Additionally, they should concentrate on improving innovation investment and internal control to leverage SCP’s potential in enhancing ESG performance optimally.
Data availability statement
The original contributions presented in the study are included in the article/Supplementary material, further inquiries can be directed to the corresponding author.
Author contributions
HT: Formal Analysis, Methodology, Validation, Writing–original draft. J-BW: Data curation, Investigation, Software, Writing–review and editing. C-YO: Conceptualization, Investigation, Supervision, Validation, Writing–review and editing.
Funding
The author(s) declare that no financial support was received for the research, authorship, and/or publication of this article.
Acknowledgments
The authors like to thank “Construction and Practice of Industry-University-Research-Education Collaborative Talent Cultivation Model in Public Administration Majors for Digital Governance.” The Higher Education Association of Guangdong Province, No. 23GYB96; “Study on the Coupling Relationship Between Regional Economic Resilience and Rural Revitalization in the Context of Industrial Transfer in the Eastern, Western, and Northern Counties of Guangdong Province.” Department of education of Guangdong Province, No. 2023WTSCX153.
Conflict of interest
The authors declare that the research was conducted in the absence of any commercial or financial relationships that could be construed as a potential conflict of interest.
Publisher’s note
All claims expressed in this article are solely those of the authors and do not necessarily represent those of their affiliated organizations, or those of the publisher, the editors and the reviewers. Any product that may be evaluated in this article, or claim that may be made by its manufacturer, is not guaranteed or endorsed by the publisher.
References
Abbott, L. J., Parker, S., Peters, G. F., and Rama, D. V. (2007). Corporate governance, audit quality, and the Sarbanes-Oxley Act: evidence from internal audit outsourcing. Account. Rev. 82 (4), 803–835. doi:10.2308/accr.2007.82.4.803
Acemoglu, D., Aghion, P., Lelarge, C., Van Reenen, J., and Zilibotti, F. (2007). Technology, information, and the decentralization of the firm. Q. J. Econ. 122 (4), 1759–1799. doi:10.1162/qjec.2007.122.4.1759
Angelidou, M. (2015). Smart cities: a conjuncture of four forces. Cities 47, 95–106. doi:10.1016/j.cities.2015.05.004
Baraibar-Diez, E., and Odriozola, M. D. (2019). CSR committees and their effect on ESG performance in UK, France, Germany, and Spain. Sustainability 11 (18), 5077. doi:10.3390/su11185077
Baron, R. M., and Kenny, D. A. (1986). The moderator–mediator variable distinction in social psychological research: conceptual, strategic, and statistical considerations. J. personality Soc. Psychol. 51 (6), 1173–1182. doi:10.1037/0022-3514.51.6.1173
Barros, V., Verga Matos, P., Miranda Sarmento, J., and Rino Vieira, P. (2022). M&A activity as a driver for better ESG performance. Technol. Forecast. Soc. Change 175, 121338. doi:10.1016/j.techfore.2021.121338
Barykin, S. E., Strimovskaya, A., Sergeev, S., Borisoglebskaya, L., Dedyukhina, N., Sklyarov, I., et al. (2023). Smart city logistics on the basis of digital tools for ESG goals achievement. Sustainability 15 (6), 5507. doi:10.3390/su15065507
Beck, T., Levine, R., and Levkov, A. (2010). Big bad banks? The winners and losers from bank deregulation in the United States. J. finance 65 (5), 1637–1667. doi:10.1111/j.1540-6261.2010.01589.x
Böckerman, P., and Ilmakunnas, P. (2009). Unemployment and self-assessed health: evidence from panel data. Health Econ. 18 (2), 161–179. doi:10.1002/hec.1361
Cao, W., Zhang, Y., and Qian, P. (2019). The effect of innovation-driven strategy on green economic development in China—an empirical study of smart cities. Int. J. Environ. Res. Public Health 16 (9), 1520. doi:10.3390/ijerph16091520
Caragliu, A., and Del Bo, C. F. (2019). Smart innovative cities: the impact of Smart City policies on urban innovation. Technol. Forecast. Soc. Change 142, 373–383. doi:10.1016/j.techfore.2018.07.022
Cavada, M., Hunt, D. V., and Rogers, C. D. (2015). “Do smart cities realise their potential for lower carbon dioxide emissions?,” in Proceedings of the institution of civil engineers-engineering sustainability (United Kingdom: Thomas Telford Ltd), 243–252.
Chang, N., and Han, C. (2020). Cost-push impact of taxing carbon in China: a price transmission perspective. J. Clean. Prod. 248, 119194. doi:10.1016/j.jclepro.2019.119194
Chen, J. C., Cho, C. H., and Patten, D. M. (2014). Initiating disclosure of environmental liability information: an empirical analysis of firm choice. J. Bus. ethics 125, 681–692. doi:10.1007/s10551-013-1939-0
Chen, P. (2022). The impact of smart city pilots on corporate total factor productivity. Environ. Sci. Pollut. Res. 29 (55), 83155–83168. doi:10.1007/s11356-022-21681-1
Chen, Y.-S., Lai, S.-B., and Wen, C.-T. (2006). The influence of green innovation performance on corporate advantage in Taiwan. J. Bus. ethics 67, 331–339. doi:10.1007/s10551-006-9025-5
Chen, Z., and Xie, G. (2022). ESG disclosure and financial performance: moderating role of ESG investors. Int. Rev. Financial Analysis 83, 102291. doi:10.1016/j.irfa.2022.102291
Chien, F., Hsu, C., Andlib, Z., Shah, M. I., Ajaz, T., and Genie, M. G. (2022). The role of solar energy and eco-innovation in reducing environmental degradation in China: evidence from QARDL approach. Integr. Environ. Assess. Manag. 18 (2), 555–571. doi:10.1002/ieam.4500
Chu, Z., Cheng, M., and Yu, N. N. (2021). A smart city is a less polluted city. Technol. Forecast. Soc. Change 172, 121037. doi:10.1016/j.techfore.2021.121037
Dehejia, R. H., and Wahba, S. (2002). Propensity score-matching methods for nonexperimental causal studies. Rev. Econ. statistics 84 (1), 151–161. doi:10.1162/003465302317331982
Dong, F., Li, Y., Li, K., Zhu, J., and Zheng, L. (2022). Can smart city construction improve urban ecological total factor energy efficiency in China? Fresh evidence from generalized synthetic control method. Energy 241, 122909. doi:10.1016/j.energy.2021.122909
Dong, W., Dong, X., and Lv, X. (2022). How does ownership structure affect corporate environmental responsibility? Evidence from the manufacturing sector in China. Energy Econ. 112, 106112. doi:10.1016/j.eneco.2022.106112
Fan, Y. (2022). “Research on internal control of yihua company under technology of artificial intelligence,” in 2022 2nd International Conference on Social Sciences and Intelligence Management (SSIM). 2022 2nd International Conference on Social Sciences and Intelligence Management (SSIM), Taichung, Taiwan, 24-26 November 2022, 85–89. doi:10.1109/SSIM55504.2022.10047950
Feng, Y., and Hu, S. (2022). The effect of smart city policy on urban haze pollution in China: empirical evidence from a quasi-natural experiment. Pol. J. Environ. Stud. 31 (3), 2083–2092. doi:10.15244/pjoes/143775
Filiou, D., Kesidou, E., and Wu, L. (2023). Are smart cities green? The role of environmental and digital policies for Eco-innovation in China. World Dev. 165, 106212. doi:10.1016/j.worlddev.2023.106212
Gao, J., Chu, D., Zheng, J., and Ye, T. (2022). Environmental, social and governance performance: can it be a stock price stabilizer? J. Clean. Prod. 379, 134705. doi:10.1016/j.jclepro.2022.134705
Ge, G., Xiao, X., Li, Z., and Dai, Q. (2022). Does ESG performance promote high-quality development of enterprises in China? The mediating role of innovation input. Sustainability 14 (7), 3843. doi:10.3390/su14073843
Gibbs, D., and O’Neill, K. (2018). Future green economies and regional development: a research agenda. Transitions Regional Econ. Dev., 287–309. doi:10.4324/9781315143736-13
Gillan, S. L., Koch, A., and Starks, L. T. (2021). Firms and social responsibility: a review of ESG and CSR research in corporate finance. J. Corp. Finance 66, 101889. doi:10.1016/j.jcorpfin.2021.101889
Guo, Q., Wang, Y., and Dong, X. (2022). Effects of smart city construction on energy saving and CO2 emission reduction: evidence from China. Appl. Energy 313, 118879. doi:10.1016/j.apenergy.2022.118879
Gupta, G., and Bose, I. (2022). Digital transformation in entrepreneurial firms through information exchange with operating environment. Inf. Manag. 59 (3), 103243. doi:10.1016/j.im.2019.103243
Hao, D. Y., Qi, G. Y., and Wang, J. (2018). Corporate social responsibility, internal controls, and stock price crash risk: the Chinese stock market. Sustainability 10, 1675–1697. doi:10.3390/su10051675
Hao, X., Li, Y., Ren, S., Wu, H., and Hao, Y. (2023). The role of digitalization on green economic growth: does industrial structure optimization and green innovation matter? J. Environ. Manag. 325, 116504. doi:10.1016/j.jenvman.2022.116504
Harasheh, M., and Provasi, R. (2023). A need for assurance: do internal control systems integrate environmental, social, and governance factors? Corp. Soc. Responsib. Environ. Manag. 30 (1), 384–401. doi:10.1002/csr.2361
He, K., Zhu, N., Jiang, W., and Zhu, C. (2022). Efficiency evaluation of Chinese provincial industrial system Based on network DEA method. Sustainability 14 (9), 5264. doi:10.3390/su14095264
Heyman, F., Sjöholm, F., and Tingvall, P. G. (2007). Is there really a foreign ownership wage premium? Evidence from matched employer–employee data. J. Int. Econ. 73 (2), 355–376. doi:10.1016/j.jinteco.2007.04.003
Hu, Q., and Zheng, Y. (2021). Smart city initiatives: a comparative study of American and Chinese cities. J. Urban Aff. 43 (4), 504–525. doi:10.1080/07352166.2019.1694413
Huang, M., Li, M., and Liao, Z. (2021). Do politically connected CEOs promote Chinese listed industrial firms’ green innovation? The mediating role of external governance environments. J. Clean. Prod. 278, 123634. doi:10.1016/j.jclepro.2020.123634
Huang, W., Luo, Y., Wang, X., and Xiao, L. (2022). Controlling shareholder pledging and corporate ESG behavior. Res. Int. Bus. Finance 61, 101655. doi:10.1016/j.ribaf.2022.101655
Ikram, A., Li, Z. F., and Minor, D. (2019). CSR-contingent executive compensation contracts. J. Bank. Finance 151, 105655. doi:10.1016/j.jbankfin.2019.105655
Jang, G.-Y., Kang, H.-G., and Kim, W. (2022). Corporate executives’ incentives and ESG performance. Finance Res. Lett. 49, 103187. doi:10.1016/j.frl.2022.103187
Jiang, H., Jiang, P., Wang, D., and Wu, J. (2021). Can smart city construction facilitate green total factor productivity? A quasi-natural experiment based on China’s pilot smart city. Sustain. Cities Soc. 69, 102809. doi:10.1016/j.scs.2021.102809
Koo, J. E., and Ki, E. S. (2020). Internal control personnel’s experience, internal control weaknesses, and ESG rating. Sustainability 12 (20), 8645. doi:10.3390/su12208645
Le, H. Q., Vu, T. P. L., Do, V. P. A., and Do, A. D. (2022). The enduring effect of formalization on firm-level corruption in Vietnam: the mediating role of internal control. Int. Rev. Econ. Finance 82, 364–373. doi:10.1016/j.iref.2022.06.021
Li, D., and Shen, W. (2021). Can corporate digitalization promote green innovation? The moderating roles of internal control and institutional ownership. Sustainability 13 (24), 13983. doi:10.3390/su132413983
Li, D., Zhou, Z., Cao, L., Zhao, K., Li, B., and Ding, C. (2023). What drives the change in China’s provincial industrial carbon unlocking efficiency? Evidence from a geographically and temporally weighted regression model. Sci. Total Environ. 856, 158971. doi:10.1016/j.scitotenv.2022.158971
Li, L., Zheng, Y., Zheng, S., and Ke, H. (2020). The new smart city programme: evaluating the effect of the internet of energy on air quality in China. Sci. Total Environ. 714, 136380. doi:10.1016/j.scitotenv.2019.136380
Lima, M. (2020). Smarter organizations: insights from a smart city hybrid framework. Int. Entrepreneursh. Manag. J. 16 (4), 1281–1300. doi:10.1007/s11365-020-00690-x
Lin, C., Huang, H.-C., Wu, J.-Y., and Liu, B. (2002). A knowledge management architecture in collaborative supply chain. J. Comput. Inf. Syst. 42 (5), 83–94. doi:10.1080/08874417.2002.11647612
Liu, J.-Y. (2018). An internal control system that includes corporate social responsibility for social sustainability in the new era. Sustainability 10 (10), 3382. doi:10.3390/su10103382
Liu, K., Liu, X., Long, H., Wang, D., and Zhang, G. (2022). Spatial agglomeration and energy efficiency: evidence from China’s manufacturing enterprises. J. Clean. Prod. 380, 135109. doi:10.1016/j.jclepro.2022.135109
Liu, S., Liu, C., and Yang, M. (2021). The effects of national environmental information disclosure program on the upgradation of regional industrial structure: evidence from 286 prefecture-level cities in China. Struct. Change Econ. Dyn. 58, 552–561. doi:10.1016/j.strueco.2021.07.006
López-Arranz, M. A. (2019). “The role corporate social responsibility has in the smart city project in Spain,” in Smart cities and smart spaces: concepts, methodologies, tools, and applications (United States: IGI Global), 1562–1582.
McCarthy, S., Oliver, B., and Song, S. (2017). Corporate social responsibility and CEO confidence. J. Bank. Finance 75, 280–291. doi:10.1016/j.jbankfin.2016.11.024
McGuinness, P. B., Vieito, J. P., and Wang, M. (2017). The role of board gender and foreign ownership in the CSR performance of Chinese listed firms. J. Corp. Finance 42, 75–99. doi:10.1016/j.jcorpfin.2016.11.001
Menicucci, E., and Paolucci, G. (2022). Board diversity and ESG performance: evidence from the Italian banking sector. Sustainability 14 (20), 13447. doi:10.3390/su142013447
MOHURD (2012). National smart city (district, town) pilot indicator system (trial). Available at: https://www.gov.cn/gzdt/2012-12/10/content_2286787.htm (Accessed July 19, 2023).
MOHURD (2013). The ministry of housing and urban-rural development has released a list of national pilot smart cities. Available at: https://www.gov.cn/jrzg/2013-08/05/content_2461575.htm (Accessed July 19, 2023).
Peattie, K., and Ratnayaka, M. (1992). Responding to the green movement. Ind. Mark. Manag. 21 (2), 103–110. doi:10.1016/0019-8501(92)90004-D
Praharaj, S., Han, J. H., and Hawken, S. (2018). Urban innovation through policy integration: critical perspectives from 100 smart cities mission in India. City, Cult. Soc. 12, 35–43. doi:10.1016/j.ccs.2017.06.004
Qi, H., Cao, X., and Liu, Y. (2020). The influence of digital economy on corporate governance: analyzed from information asymmetry and irrational behavior perspective. Reform 4, 50–64. (In Chinese).
Qi, Y. D., Liu, C. H., and Ding, S. L. (2020). Digital economic development, employment structure optimization and employment quality upgrading. Econ. Perspect. 11, 17–35. (In Chinese).
Qian, L., Xu, X., Zhou, Y., Sun, Y., and Ma, D. (2023). Carbon emission reduction effects of the smart city pilot policy in China. Sustainability 15 (6), 5085. doi:10.3390/su15065085
Qiu, L. (2022). Does the construction of smart cities promote urban green innovation? Evidence from China. Appl. Econ. Lett. 0 (0), 2688–2696. doi:10.1080/13504851.2022.2103497
Sharif, A., Bhattacharya, M., Afshan, S., and Shahbaz, M. (2021). Disaggregated renewable energy sources in mitigating CO2 emissions: new evidence from the USA using quantile regressions. Environ. Sci. Pollut. Res. 28 (41), 57582–57601. doi:10.1007/s11356-021-13829-2
Shi, D., Ding, H., Wei, P., and Liu, J. (2018). Can smart city construction reduce environmental pollution. China Ind. Econ. 6, 117–135. doi:10.19581/j.cnki.ciejournal.2018.06.008
Sohail, M. T., Majeed, M. T., Shaikh, P. A., and Andlib, Z. (2022). Environmental costs of political instability in Pakistan: policy options for clean energy consumption and environment. Environ. Sci. Pollut. Res. 29 (17), 25184–25193. doi:10.1007/s11356-021-17646-5
Solana-González, P., Vanti, A. A., García Lorenzo, M. M., and Bello Pérez, R. E. (2021). Data mining to assess organizational transparency across technology processes: an approach from it governance and knowledge management. Sustainability 13 (18), 10130. doi:10.3390/su131810130
Song, Y., Yang, T., Li, Z., Zhang, X., and Zhang, M. (2020). Research on the direct and indirect effects of environmental regulation on environmental pollution: empirical evidence from 253 prefecture-level cities in China. J. Clean. Prod. 269, 122425. doi:10.1016/j.jclepro.2020.122425
Su, Z., Guo, Q., and Lee, H.-T. (2022). RETRACTED: green finance policy and enterprise energy consumption intensity: evidence from a quasi-natural experiment in China. Energy Econ. 115, 106374. doi:10.1016/j.eneco.2022.106374
Sun, L., Liu, W., Li, Z., Cai, B., Fujii, M., Luo, X., et al. (2021). Spatial and structural characteristics of CO2 emissions in East Asian megacities and its indication for low-carbon city development. Appl. Energy 284, 116400. doi:10.1016/j.apenergy.2020.116400
Sun, L., and Saat, N. A. M. (2023). How does intelligent manufacturing affect the ESG performance of manufacturing firms? Evidence from China. Sustainability 15 (4), 2898. doi:10.3390/su15042898
Tan, S. Y., and Taeihagh, A. (2020). Smart city governance in developing countries: a systematic literature review. Sustainability 12 (3), 899. doi:10.3390/su12030899
Vázquez, J. L., Lanero, A., Gutierrez, P., and Sahelices, C. (2018). “The contribution of smart cities to quality of life from the view of citizens,” in Entrepreneurial, innovative and sustainable ecosystems: best practices and implications for quality of life (Berlin, Germany: Springer), 55–66. doi:10.1007/978-3-319-71014-3_3
Wang, J., and Deng, K. (2022). Impact and mechanism analysis of smart city policy on urban innovation: evidence from China. Econ. Analysis Policy 73, 574–587. doi:10.1016/j.eap.2021.12.006
Wang, K.-L., Pang, S. Q., Zhang, F. Q., Miao, Z., and Sun, H. P. (2022). The impact assessment of smart city policy on urban green total-factor productivity: evidence from China. Environ. Impact Assess. Rev. 94, 106756. doi:10.1016/j.eiar.2022.106756
Wang, S. S., Zhou, D., Zhou, P., and Wang, Q. (2011). CO2 emissions, energy consumption and economic growth in China: a panel data analysis. Energy policy 39 (9), 4870–4875. doi:10.1016/j.enpol.2011.06.032
Wang, X., Wu, W., and Li, H. (2023). The impact of city ranking on industry shifting: an empirical study. Sustainability 15 (11), 8930. doi:10.3390/su15118930
Wang, Y., Lin, Y., Fu, X., and Chen, S. (2023). Institutional ownership heterogeneity and ESG performance: evidence from China. Finance Res. Lett. 51, 103448. doi:10.1016/j.frl.2022.103448
Wen, H., Liang, W., and Lee, C.-C. (2023). China’s progress toward sustainable development in pursuit of carbon neutrality: regional differences and dynamic evolution. Environ. Impact Assess. Rev. 98, 106959. doi:10.1016/j.eiar.2022.106959
Witkowski, K. (2017). Internet of things, big data, industry 4.0–innovative solutions in logistics and supply chains management. Procedia Eng. 182, 763–769. doi:10.1016/j.proeng.2017.03.197
Xie, X., Huo, J., and Zou, H. (2019). Green process innovation, green product innovation, and corporate financial performance: a content analysis method. J. Bus. Res. 101, 697–706. doi:10.1016/j.jbusres.2019.01.010
Xu, B., and Lin, B. (2016). Reducing carbon dioxide emissions in China’s manufacturing industry: a dynamic vector autoregression approach. J. Clean. Prod. 131, 594–606. doi:10.1016/j.jclepro.2016.04.129
Xu, G., and Yang, Z. (2022). The mechanism and effects of national smart city pilots in China on environmental pollution: empirical evidence based on a DID model. Environ. Sci. Pollut. Res. 29 (27), 41804–41819. doi:10.1007/s11356-021-18003-2
Xu, S., Miao, , Li, , Zhou, , Ma, , He, , et al. (2019). What factors drive air pollutants in China? an analysis from the perspective of Regional difference using a combined method of production decomposition analysis and logarithmic mean divisia index. Sustainability 11 (17), 4650. doi:10.3390/su11174650
Yan, Y., Cheng, Q., Huang, M., Lin, Q., and Lin, W. (2023). Government environmental regulation and corporate ESG performance: evidence from natural resource accountability audits in China. Int. J. Environ. Res. Public Health 20 (1), 447. doi:10.3390/ijerph20010447
Yan, Z., Sun, Z., Shi, R., and Zhao, M. (2023). Smart city and green development: empirical evidence from the perspective of green technological innovation. Technol. Forecast. Soc. Change 191, 122507. doi:10.1016/j.techfore.2023.122507
Yang, L., Qin, H., Gan, Q., and Su, J. (2020). Internal control quality, enterprise environmental protection investment and finance performance: an empirical study of China’s a-share heavy pollution industry. Int. J. Environ. Res. Public Health 17 (17), 6082. doi:10.3390/ijerph17176082
Yang, Z. H. (2018). Can smart city improve economic efficiency: quasi natural experiment based on smart city construction. Sci. Tech. Mgt. Res. 10, 263–266. doi:10.3969/j.issn.1000-7695.2018.10.036
Yigitcanlar, T., and Kamruzzaman, M. (2018). Does smart city policy lead to sustainability of cities? ’, Land use policy 73, 49–58. doi:10.1016/j.landusepol.2018.01.034
Yong, J. (2020). Digital economy empowers manufacturing transformation: from value reshaping to value creation. Economists (6), 89–94. doi:10.16158/j.cnki.51-1312/f.2020.06.010
Zhao, X., Wu, L., and Li, A. (2017). Research on the efficiency of carbon trading market in China. Renew. Sustain. Energy Rev. 79, 1–8. doi:10.1016/j.rser.2017.05.034
Keywords: smart city pilot policy, environmental, social, and governance performance, green innovation, internal control, difference in differences
Citation: Tang H, Wang J-B and Ou C-Y (2024) How do smart city pilots affect the ESG performance of manufacturing firms? evidence from China. Front. Environ. Sci. 11:1305539. doi: 10.3389/fenvs.2023.1305539
Received: 02 October 2023; Accepted: 18 December 2023;
Published: 08 January 2024.
Edited by:
Vinay Kandpal, University of Petroleum and Energy Studies, IndiaCopyright © 2024 Tang, Wang and Ou. This is an open-access article distributed under the terms of the Creative Commons Attribution License (CC BY). The use, distribution or reproduction in other forums is permitted, provided the original author(s) and the copyright owner(s) are credited and that the original publication in this journal is cited, in accordance with accepted academic practice. No use, distribution or reproduction is permitted which does not comply with these terms.
*Correspondence: Chung-Ya Ou, b3VjaHlAbmZ1LmVkdS5jbg==