 Hongrui Jiao
 Hongbing Deng
 Shengmei Hu1,2
- 1School of Economics and Management, China University of Geosciences, Wuhan, China
- 2Hubei Province Regional Innovation Capability Testing and Analysis Soft Science Base, Wuhan, China
A strong environmental regulatory framework enhances green technology innovation (GTI), which is crucial for sustainable economic growth. We construct SDM models by using panel data from 108 cities in China’s Yangtze River Economic Belt (YREB) from 2011 to 2020 to investigate the effects of heterogeneous environmental regulations (ER) on GTI in local and neighboring cities. The moderating influence of digital financial inclusion (DFI) is also examined within the SDM model. Our findings reveal that: (1) Different types of ER have varying impacts on GTI. (2) Command-and-control environmental regulation (CER) hinders local GTI but promotes GTI in neighboring cities. Both market-based (MER) and public-participation environmental regulations (PER) promote GTI in both local and neighboring cities. (3) DFI positively moderates the impact of ER on GTI by providing flexible finance support to enterprises. The study concludes with policy recommendations to improve environmental regulation systems, enhance regional synergistic governance, and promote digital financial inclusion for green sustainable development.
1 Introduction
Facing global warming and extreme weather threats, China is actively pursuing green innovation development path. Currently, environmental protection and economic growth are primary concerns for China’s governments. GTI is seen as the key solution, gaining increasing attention (Xie and Teo, 2022; Zhao et al., 2022). In 2021, China’s government issued the “Guiding Opinions on Accelerating the Establishment of a Green, Low-Carbon, and Circular Economic System,” emphasizing “in-depth promotion of technological innovation.” In the report to the 20th National Congress of the Communist Party of China, the importance of GTI in economic development was reemphasized. Therefore, GTI has become a crucial element in China’s pursuit of high-quality development.
YREB, an inland economic belt with global influence, covers 11 provinces and cities across China’s east, middle, and west regions, accounting for 21.4% of the national land area. It is a key region for China to achieve high-quality development goals of economy and ecology (Luo et al., 2022). YREB has significant economic advantages, with GDP growing from RMB 17.71 trillion in 2010 to RMB 55.98 trillion in 2022, contributing substantially to China’s economic development. By connecting the eastern, central, and western China, YREB has played a crucial role in harmonizing unbalanced regional development. However, YREB faces significant green development challenges, including over production and high pollution emissions (Liu et al., 2020). For instance, wastewater discharge in YREB increased from 29.64 billion tons in 2005 to 34.41 billion tons in 2018. By 2020, total wastewater discharge in YREB accounted for 44.4% of the national total. These environmental problems pose serious challenges to YREB, making green transformation and high-quality development urgent.
Promoting high-quality development of YREB requires a focus on GTI. In 2016, the Outline of the Development Plan for the Yangtze River Economic Belt was launched, providing guidance on ecological protection, industrial transformation, and emphasizing green innovation development. GTI is a core component of green development but is constrained by its dual externalities. Adhering to the strategic orientation of “ecological priority and green development,” the YREB has developed a multi-stakeholder environmental policy system involving the government, market, and public. It has introduced various regulatory policies, including the Law on the Protection of the Yangtze River, the sewage rights trading system, and the environmental protection tax. These diverse regulatory measures have the potential to effectively address the dual externalities of GTI.
In recent years, cities in YREB have actively formulated plans to develop the digital economy. Digital financial tools such as Alipay, WeChat Pay, and Ant Finance Support have rapidly developed under the influence of Internet, providing increased financial support for enterprises. These tools have revolutionized financial transactions, making it easier for businesses to access capital and manage their finances efficiently. Guided by proactive policies, DFI significantly supports the development of the YREB, demonstrating notable environmental and economic impacts (Li et al., 2022; Wang et al., 2022). For instance, the integration of DFI has facilitated the adoption of green technologies and sustainable practices by reducing the financial barriers to innovation. This synergy between DFI and ER has contributed to reduce carbon emissions in the region. Moreover, the economic benefits are evident in the enhanced productivity and competitiveness of local enterprises through DFI, leading to robust economic growth. The combined effect of these initiatives underscores the critical role of DFI in promoting sustainable development in YREB.
By examining the impacts of various ER on GTI in YREB and introducing DFI, we can offer new insights into environmental governance for other regions in China and even for other developing countries. These explorations provide a foundation for empirical research and valuable experience for achieving green sustainable development.
Studies exploring the impacts of ER on GTI can be categorized into three main views: the first view is that ER inhibits GTI (Du et al., 2021). The second view is that ER promotes GTI (Xie et al., 2017). The third view is that ER has a nonlinear effect on GTI (Ouyang et al., 2020; Li and Du, 2021). With continuous development of MER and PER, the relationship between ER and GTI has become increasingly complex. This complexity makes it difficult for a single theory to fully explain the relationships between them. Researchers have categorized ER into formal and informal (Huang and Tian, 2023), or further subdivided them into CER, MER and PER (Luo et al., 2021; Wang et al., 2022). Based on data from 30 provinces in China, Xie et al. (2017) found that MER promotes green innovation activities more efficiently than CER. However, most studies are limited to the provincial level, potentially underestimating the real effects of ER at the city level. Using city-level data, Huang and Yi (2023) employed DID model to explore the effects of different kinds of ER on carbon emission reduction, finding that carbon emission trading policies are more effective than low-carbon pilot policies, but the study analyses the differences in the function of several environmental regulations at a local level, focusing only on particular policies and not adequately evaluating the effectiveness of them. DFI brings opportunities for green innovation, and many scholars have explored its impact on the green innovation behaviors of enterprises. They concluded that DFI can increase the number of GTI (Liu et al., 2022; Li et al., 2023) and also promote the quality of GTI (Rao et al., 2022).
Although existing studies have identified differences in the impacts of various types of ER on environmental and economic performance, several limitations remain: First, there is a lack of researches on the impacts of heterogeneous ER on GTI at the city scale. Second, the spatial spillover effects of heterogeneous ER on GTI have been neglected. Third, the moderating effect of DFI remains unclear. Therefore, based on these development backgrounds and research gaps, we propose the following research questions: How do heterogeneous ER in the YREB affect GTI? Do they have spatial spillover effects? What is the role of DFI in the relationship between ER and GTI?
Exploring these issues can further promote GTI in YREB under existing ER systems. This paper examines 108 cities in the YREB from 2011 to 2020, using spatial econometric models to analyze the impacts of different types of ER on GTI and their spatial spillover effects, while also exploring the moderating effects of DFI. The innovations of this paper are mainly three aspects: First, it more clearly expresses the strength of each type of ER at the city level compared to previous studies. Second, it analyzes the local and neighboring impacts of different types of ER on GTI by constructing multiple spatial weight matrices and using SDM models. Third, it introduces the concept of DFI, revealing the impact of the interaction between ER and DFI on GTI and its spatial spillover effects, further enriching green innovation theory.
The rest of the paper consists of six sections: Section 2 presents the literature review and proposes hypotheses. Section 3 describes the research methodology and data sources. Section 4 discusses the evolutionary characteristics of GTI and ER. Section 5 reports the main empirical results, including the endogeneity and robustness tests. Section 6 describes the moderating effects of DFI. Section 7 provides conclusions and policy implications.
2 Literature review and research hypotheses
2.1 The role of ER on GTI
ER can be categorized into three types based on their behavioral modes: First, CER with strong enforcement power (Huang and Yi, 2023). Second, MER which is guided and regulated through market mechanisms (Wang et al., 2022). Third, PER implemented through public involvement in regulation (Tian and Feng, 2022; Li et al., 2023). Each kind of ER has distinct characteristics, affecting GTI differently. There are two main views on the effect of ER on GTI: “crowding out cost theory” posits that ER increases pollution control costs, burdening production and diverting funds of R&D, thereby impeding GTI (Luo et al., 2021). In contrast, “innovation compensation theory” originating from Porter’s hypothesis, argues that ER can stimulate innovation through product and process compensation. Product compensation means that regulation reduces pollution and creates more environment-friendly products, increasing enterprise income. Process compensation means that ER improves resource productivity, thereby increases business revenue (Wang et al., 2022). Increasingly, studies conclude that appropriate ER encourages enterprises to invest in green innovation for sustainable development. Firms improve market competitiveness and productivity through product and process compensation, leading to technological upgrading.
CER relies on government policymaking, has strong constraints, and aims to achieve pollution control in a short period (Du et al., 2021). For example, it sets strict emission reduction targets by specifying technical standards to limit pollution emissions from enterprises, using measures such as shutting down enterprises, imposing fines, and ordering the rectification of heavily polluted plants. According to “cost crowding out theory”, excessive environmental governance pressure damages enterprise interests, leaving them with insufficient funds and motivation for GTI, thereby undermining the city’s GTI. For instance, the ecological and environmental protection inspection system is a top-down mechanism with high specifications, full coverage, and strict accountability, representing a typical CER tool (Feng et al., 2022). China’s central government implements the inspection system, and sets up full-time inspection institutions to carry out ecological and environmental protection inspections for the provinces, autonomous regions and municipalities. Facing the pressure of central environmental protection inspectors, local governments often adopt a “one-size-fits-all” approach to reduce pollution, seriously affecting enterprise production and operation. It crowds out R&D funds for GTI, further restricting GTI in cities.
More flexible MER emphasizes the market’s ability to internalize pollution control costs (Huang and Yi, 2023). The governments in YREB have introduced instruments such as environmental protection taxes and carbon emissions trading policies. According to “innovation compensation theory”, MER increases external pressure on corporate environmental governance while providing incentives for GTI. Enterprises can obtain market subsidies or innovation dividends through GTI under MER, this guides R&D behaviors of corporations for GTI, thereby enhancing urban GTI. For example, China’s green development tax incentives encourage and promote enterprises to accelerate the upgrading and transformation of environmental protection equipment by means of tax reductions and exemptions. It not only provides opportunities for R&D of GTI, but also further promotes the progress of urban GTI.
Increased public environmental awareness and information disclosure have heightened the importance of PER. PER creates an invisible binding force on enterprise production behavior, compensating for “government failure” and “market failure”. Specifically, the public engages in environmental governance through consumer behavior choices, government complaints, and media opinions (Zhang et al., 2022). According to “innovation compensation theory”, enterprises are encouraged to produce green products through technological innovation to satisfy public green consumption behavior. Their business image and innovation dividends can be also enhanced and it further incentivizes GTI. Enhanced public attention to the environment can also indirectly influence enterprise green production behavior by affecting government investment in environmental protection and governance. This, in turn, impacts GTI and improves the overall level of GTI in cities.
Summarizing the above analysis, hypothesis 1 is proposed: there are differences in the impacts of heterogeneous ER on urban GTI.
2.2 Spatial spillover effects of ER
Previous studies have shown that, in addition to impacting local environmental performance, ER may also indirectly affect green development in neighboring regions (Li and Du, 2021; Fan et al., 2022). ER may trigger cross-border pollution and the cross-regional transfer of polluting industries, creating “pollution havens”. This study further analyzes the impact of ER on GTI in neighboring regions.
In response to increased CER, enterprises facing significant regulatory pressure may choose to relocate to nearby areas with weaker CER, leading to industrial transfers. Additionally, under China’s fiscal decentralization, some regions attract high-output, high-polluting enterprises by implementing lower CER to promote local economic development. Although industrial transfer can lead to the movement of pollutants to neighboring regions, the entry of high-value firms boosts local economic development and provides financial support for local innovation, potentially enhancing GTI. For example, under China’s stringent emission reduction mandates in the 11th Five-Year Plan, polluting firms have shifted from coastal provinces with stringent requirements to central and western provinces. This shift improves the economic performance of central and western provinces but increases their environmental governance pressure (Wu et al., 2017). Dong and Wang (2019) found that the inter-regional transfer of polluting industries can promote local GTI through increased income effects. In the case of economic growth, if the governments of the relocated regions implement policy guidance on environmental protection, GTI in the region could be increased with more sufficient finance support. Therefore, CER has a promotional effect on GTI in neighboring regions.
MER promotes GTI in local and neighboring regions through economic incentives and market mechanisms. MER releases positive signals through economic incentives, encouraging local and neighboring enterprises to pursue GTI. This also triggers inter-regional learning, competition, and the exchange of knowledge, information, and technology, further promoting GTI in neighboring regions (Mu et al., 2022; Wang et al., 2023). Additionally, MER can expand the market for GTI, increase demand for GTI, and promote innovation by neighboring enterprises. For example, China’s carbon emissions trading system establishes a market where enterprises can exchange saved carbon allowances for gains, promoting green production (Shi et al., 2022). To realize green production, enterprises expand the demand for green intermediate products and technologies, further motivating neighboring enterprises to pursue GTI. Therefore, MER actively promotes GTI in neighboring regions.
PER is not limited by geographical distance. The development of Internet and the disclosure of environmental decision-making information have enabled the public to access more transparent environmental information. With sufficient information disclosure, the public can monitor the environmental performance of neighboring regions, thus achieving cross-regional regulation and forcing companies to implement GTI (Yu et al., 2023). For instance, when the environmentally conscious public learns about highly polluting enterprises in neighboring regions through disclosed environmental and ESG information, they can file complaints and feedback to neighboring administrative departments through government websites, forcing these enterprises to rectify the situation and carry out GTI. Therefore, PER can positively promote GTI in neighboring regions.
To sum up, hypothesis 2 is proposed: heterogeneous ER have spatial spillover effects on GTI in neighboring regions, but the effects are various.
2.3 Moderating effects of DFI
The development of information technology has driven the rapid growth of DFI (Lee et al., 2023). The development of DFI has lowered the threshold for enterprise financing, improved financing efficiency, and reduced financing costs. Sufficient financial support for enterprises to engage in GTI, increasing their willingness to innovate and promoting GTI in cities (Meng and Zhang, 2022; Li et al., 2023). Moreover, DFI is not limited by geography and exhibits spatial spillover effects. DFI impacts the environmental performance of neighboring regions, previous research found that although DFI may reduce local carbon dioxide emissions, it may increase emissions in neighboring regions (Wang et al., 2022).
Under the constraints of CER, enterprises choose to use methods such as production shutdowns to achieve short-term environmental compliance rather than adopting GTI. In this case, DFI struggles to support GTI and fails to realize its potential in regulating the relationship between CER and GTI (Han et al., 2023). However, DFI is expected to facilitate industry transfer triggered by CER, promoting economic development in neighboring regions, and further promote GTI.
MER significantly facilitates GTI in local and neighboring regions. In the context of MER, DFI provides a favorable external environment for enterprises to support their GTI (Hao et al., 2023). By providing pre-investment funds and diversifying innovation risks, DFI makes enterprises in local and neighboring regions more inclined to invest in GTI.
With the development of China’s responsible investment market, enterprises’ sustainable development capabilities have become the focus of investors’ attention. Against this backdrop, PER promotes GTI aligned with sustainable development. DFI further promotes GTI by addressing capital shortages and enhancing competition within the industry (Lee et al., 2022; Wang et al., 2022). However, due to the disparities of DFI between regions, DFI has capacities to trigger a siphoning effect, attracting innovative resources in neighboring areas, which is detrimental to the development of GTI in neighboring regions.
Hypothesis 3 is proposed: A moderating and geographical spillover effects are played by DFI on GTI which is affected by CER, MER, and PER.
3 Research methodology and data sources
3.1 Benchmark regression model
We propose the following benchmark model, as shown in Equation 1:
Where subscripts i and t represent the cities and years,
3.2 Spatial Durbin model
3.2.1 Spatial weight matrix setting
The essential first step in spatial statistical analysis is constructing spatial weight matrices, which can be created using two primary methods: contiguity and distance. We construct two different spatial weight matrices as benchmarks. First, following Shao et al. (2016), we construct a spatial weight matrix based on geoeconomic distance (W1), which includes both geographic and economic factors. The formula for the spatial weight matrix based on geoeconomic distance is defined as, shown in Equation 2:
where
Furthermore, we construct R&D capability distance weight matrix (Dong and Wang, 2019). The matrix (W2) is defined as shown in Equation 3:
Where
3.2.2 Spatial correlation analysis
Spatial autocorrelation analysis of the variables is necessary before further analysis. The global Moran’s I statistic is commonly used to assess the similarity of variables in local and neighboring regions. The calculation formula is as follows:
where
3.2.3 Setting and decomposition of SDM model
Spatial econometric models account for the influences of neighboring regions on each other. Therefore, we introduce these models in this study to obtain precise outcomes regarding the spatial relationships of variables (Zhou et al., 2019). We establish an SDM model, which is comprehensive and encompasses both the SAR and SEM (Pace and LeSage, 2009). The SDM model is as follows:
To further explore the spatial spillover effects, the results of the SDM models need to be decomposed. According to the methods of Pace and LeSage (2009), we use the partial derivative matrix approach, which is based on the interpretation of the spatial model’s parameters, to determine the direct and indirect impacts of SDM model. The formula is as follows:
The average of the diagonal members represents the direct influence, while the average of the non-diagonal elements represents the indirect effect. The two impacts are added together to get the overall effect.
3.3 Moderating effects model
According to the method of Edwards and Lambert (2007), the moderating effects model is used to further investigate whether the impacts of heterogeneous ER on GTI depend on DFI. The formula of the model is as follows:
The interactive term (
3.4 Variables setting
3.4.1 Dependent variable
GTI (greeninn) is an important dependent variable. The number of green patents indicates GTI in a city. In this study, we define green invention patents by precisely matching IPC numbers to the green patents list issued by WIPO. The number of green invention patents granted per 10,000 people is used to measure the level of GTI (Du et al., 2021; Chen et al., 2022; Lin and Ma, 2022).
3.4.2 Independent variables
CER(cer). Government work reports indicate the government’s dedication to environmental preservation. Therefore, the level of CER in cities can be measured by calculating the ratio of environmental protection-related phrases in annual government work reports.
MER(mer). Environmental protection investment costs and subsidies, both financial expenditures of local municipal governments, are usually used to measure MER. Since 2007, the China Urban Statistical Yearbook has not listed environmental protection investment data separately. Therefore, in this study, we consider the completeness of municipal-level data and refer to the methods of Zhang and Xu (2022). We use the logarithm of the product of the government’s public budget expenditure and the solid waste utilization rate to measure MER.
PER(per). The level of public concern for the environment can be gauged by analyzing the frequency of Internet keyword searches related to environmental topics, representing the extent of public participation in environmental protection. According to Wu et al. (2022), we use the Baidu index of search terms such as “haze” and “environmental pollution” as proxy variables to quantify PER.
3.4.3 Control variables
Omitted variables might lead to estimation bias; therefore, the following control variables are chosen to minimize this bias.
Economic Development (pgdp). GDP per capita of each city is used as a proxy variable in this study.
Foreign Direct Investment (fdi). FDI is expressed as the ratio of actual FDI utilization to GDP.
Industrial Structure (is). Industrial structure has a complex association with GTI (Mi et al., 2015). In this study, we quantify industrial structure using the ratio of the value contributed by the secondary industry to that of the tertiary sector.
R&D Investment (tech). R&D investment characterizes the importance that regional governments place on innovation while providing financial support for GTI (Fan and Teo, 2022). The ratio of science expenditure to GDP in the general budget expenditure of local finance is chosen as a proxy variable to assess R&D investment intensity.
Government Scale (gov). The proportion of government non-public financial expenditure to GDP is chosen to measure government size.
3.4.4 Moderating variable
DFI (index). According to Guo et al. (2020), the digital financial inclusion index provides a comprehensive assessment, encompassing three key aspects: the extent of coverage, the level of usage, and the availability of digital support services.
3.5 Data sources and descriptions
Considering that 2011 is the first year of China’s 12th Five-Year Plan and 2020 is the last year of China’s 13th Five-Year Plan, we use data from 108 cities in the YREB from 2011 to 2020. The primary data sources are the National Bureau of Statistics’ official website, China Environmental Yearbook, and China Urban Statistical Yearbook. The descriptive statistics for the variables are presented in Table 1.
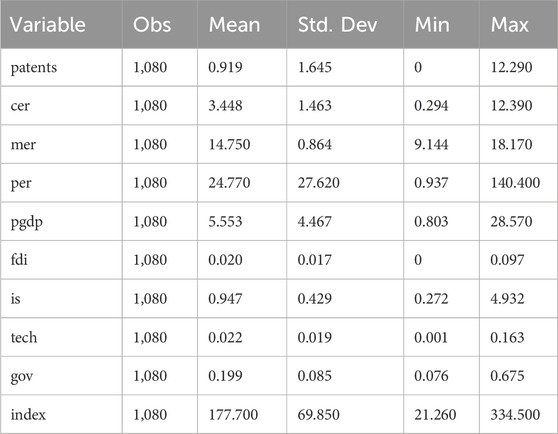
Table 1. Statistical description of variable.
4 Spatial distribution of variables and correlation tests
4.1 Evolutionary characteristics of the spatial distribution of GTI
We analyze the spatial evolution pattern of GTI within YREB from 2011 to 2020 using Jenks natural breakpoint method and visualize the results with ArcGIS 10.8. We categorize GTI into five grades: high, high-medium, medium, low-medium, and low, with darker colors indicating higher GTI levels.
Figure 1 shows the distribution of GTI in the YREB for 2011, 2015, and 2020, revealing a considerable improvement in GTI from 2011 to 2020. In 2011, only five cities had a high GTI level: Changzhou, Wuxi, Shanghai, Nanjing, and Suzhou. These cities, located downstream in YREB, accounted for only 4.63% of the total. By 2015, the number of cities with high GTI increased to 15, and by 2020, it reached 25. The cities with high GTI were mostly located downstream in the YREB, particularly in the Yangtze River Delta Economic Zone near the port. This zone benefited from a favorable geographical location, a strong economic foundation, high internationalization, and abundant innovation resources. These factors collectively contributed to the progress of GTI in this region.
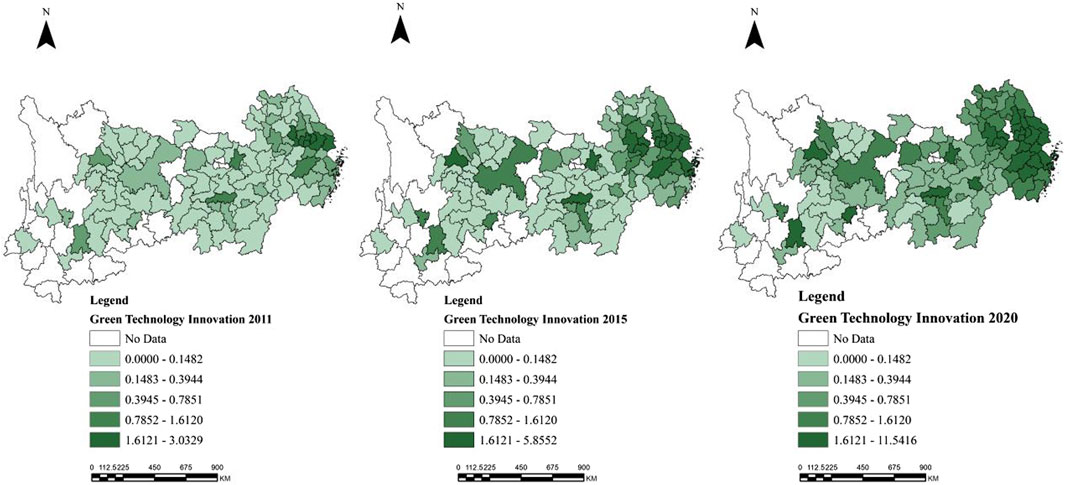
Figure 1. Evolution of spatial pattern of GTI in YREB.
Meanwhile, provincial cities played a crucial role in fostering innovation and expansion. Urban centers quickly amassed innovative resources and provided excellent conditions to support GTI (Hu and Xu, 2023). The urban agglomeration in the YREB exhibited a fragmented upgrading pattern, with gradual improvements across various parts of these clusters over time. Collaboration and interaction between cities in a cluster created a strong foundation for GTI. This environment encouraged the exchange of information, resource cooperation, and collective actions for sustainable development, thereby fostering GTI within the city cluster.
4.2 Characterizing the spatial distribution of heterogeneous ER
Figure 2 depicts the annual average value distribution for CER, MER, and PER from 2011 to 2020. The values are classified into four categories, from high to low, using the Jenks natural breakpoint method, and the visualization is generated using ArcGIS 10.8.
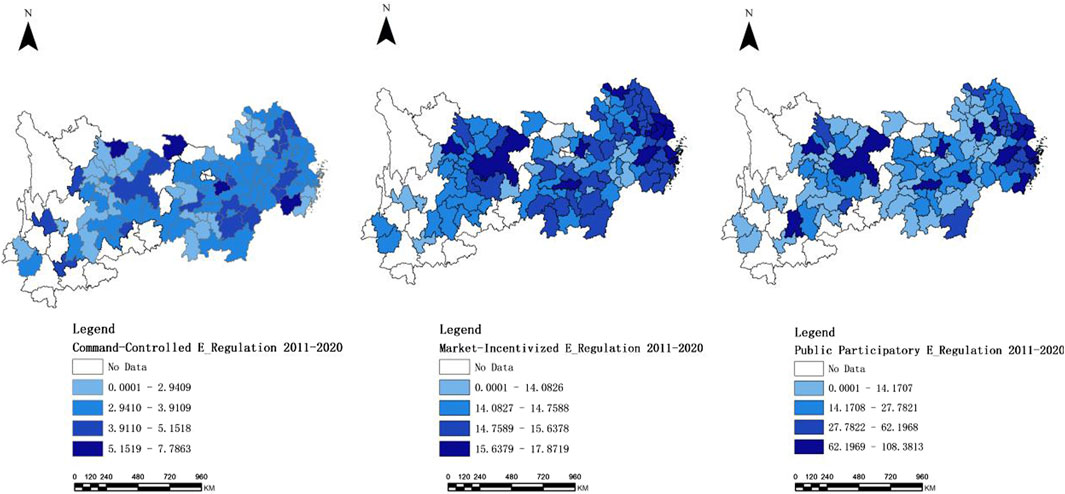
Figure 2. Spatial distribution of the intensity of CER, MER and PER.
The visualization reveals significant regional variations across the three types of ER. These findings highlight the importance of categorizing ER to analyze their impact on GTI. According to Figure 2, CER in the YREB displayed a uniform geographical distribution characterized by a mosaic pattern. The 13 cities with high-level MER were predominantly located downstream in the YREB, including Shanghai, Nanjing, and Wuxi. In contrast, the 14 cities with high PER were spread across all basins of the YREB, while most other cities fell within moderate or low levels of PER. Understanding these regional variations in environmental management can help governments develop targeted actions and strategies to enhance GTI. Through the analysis of the spatiotemporal evolution of the three types of ERand GTI, we are once again guided to think about the local and neighborhood impacts of ER on GTI and we explore the problems in the rest part.
4.3 Tests for spatial correlation of variables
Global Moran’s I is used to test the spatial correlation of GTI and the three types of ER. Table 2 reports the results of the global spatial correlation test for each year from 2011 to 2020, covering 108 cities in the YREB.

Table 2. Global Moran’s index of variable.
As shown in Table 2, Moran’s I for GTI is significantly positive, indicating clear spatial agglomeration within the YREB. Similarly, the three types of environmental regulation (ER) also exhibit significant spatial agglomeration. These spatial agglomerations illustrate the necessity to consider spatial spillover effects when constructing models.
5 Empirical tests and analysis of the results
5.1 Spatial model selection
Before discussing the impact of ER on GTI, the specific modeling approach needs to be identified (Elhorst, 2003). Table 3 reports the results of the LM, LR and Wald tests. The results show that the LM tests for all ER pass 1% significance level, confirming the existence of spatial error and spatial lag. Thus, constructing SDM model is reasonable. It also passes the LR and Wald tests for all three types of ER, supporting the choice of SDM model. We conduct the same tests for the other two spatial weight matrices and obtain consistent results.
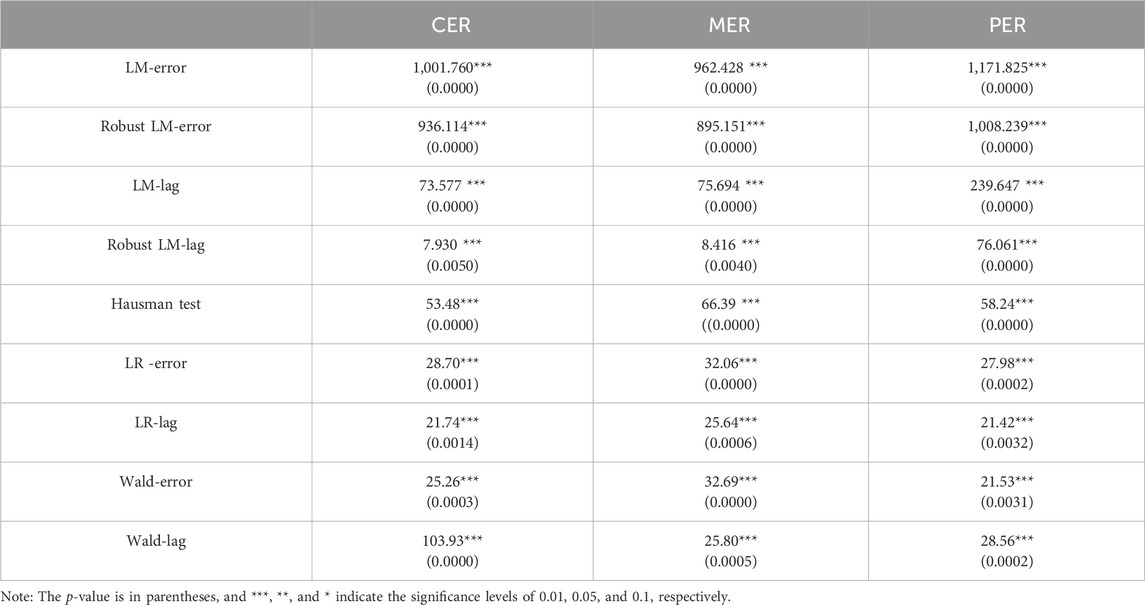
Table 3. Test for spatial econometric model selection.
5.2 Analysis of empirical results
OLS estimation method ignores spatial correlation between regions, potentially producing biased parameter estimates (Zhang et al., 2022). Existing studies widely use MLE method for estimating SDM models. Therefore, we also adopt MLE method to estimate the SDM model regression results. Additionally, to enhance the credibility of the results, we utilize the GMM method for estimating the benchmark model, addressing model endogeneity and increasing the robustness of the regression results (Behera and Sethi, 2022). Table 4 reports the regression results. The estimated coefficients of ER are consistent. In columns (4), (8) and (12) in Table 4, the estimation results using GMM method also pass the AR (2) and Sargan tests, it indicates that the benchmark model is credible in terms of variable selection and estimation outcomes.
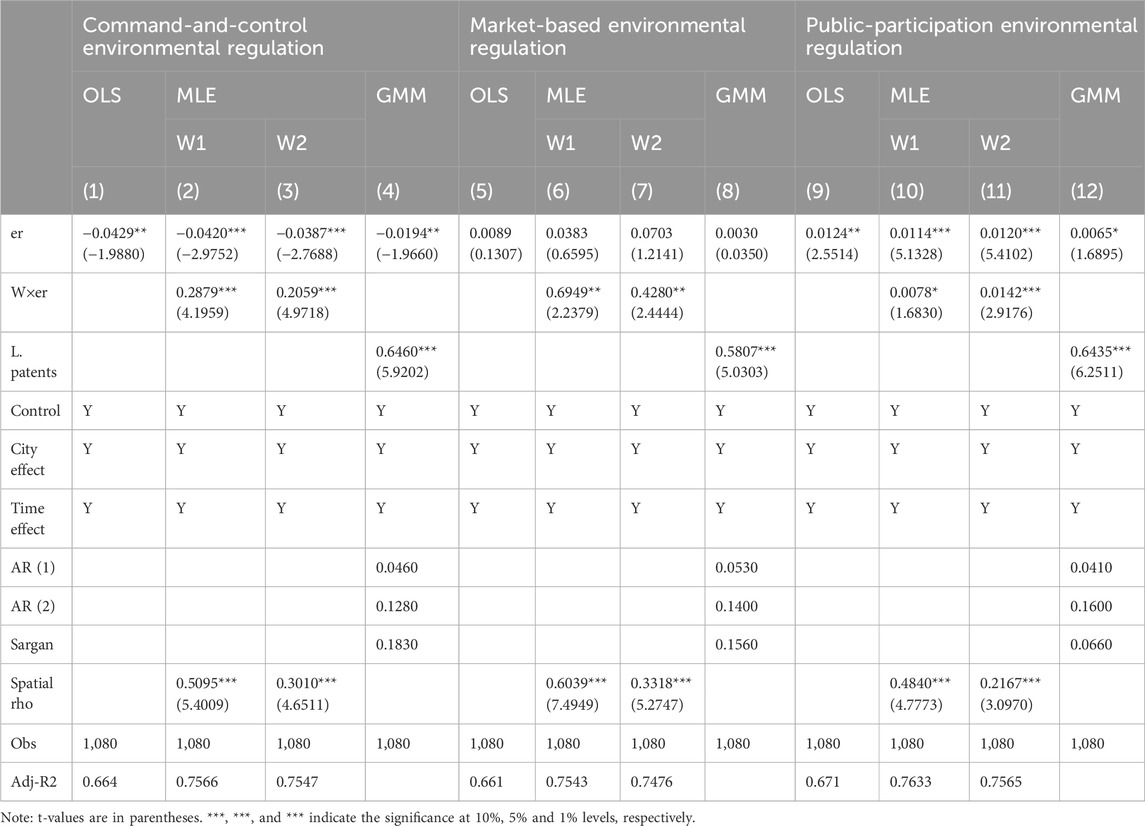
Table 4. Estimation results of the spatial panel Durbin model for environmental regulation.
The regression coefficients of the independent variables indicate that the sign of the coefficients for the three types of ER differs, highlighting their distinct effects on GTI and confirming hypothesis 1.
Specifically, columns (1)–(4) in Table 4 show that the regression coefficients for CER are significantly negative, suggesting that CER inhibits urban GTI. This finding is consistent with earlier studies on ER (Conrad and Wastl, 1995; Du et al., 2021; Shao et al., 2022). Additionally, columns (2)–(3) indicate that the coefficients for the spatial lagged term of CER (W × CER) are positive and significant at the 1% level, suggesting that local CER produces positive spatial spillover effects.
Columns (5)–(8) in Table 4 show that the regression coefficients for MER are positive but not significant. However, columns (6)–(7) indicate that under two spatial weight matrices, the coefficients for spatial lag term of MER (W × MER) are positive significantly. It suggests that MER has a positive spatial spillover effect, consistent with the findings of Lee et al. (2022).
The coefficients of PER on GTI in columns (9)–(12) in Table 4 are all significantly positive, indicating that PER can significantly promote GTI. This further confirms the findings of Zhang et al. (2022). Columns (10) and (11) show that the coefficients of the lagged term of PER (W × PER) are significantly positive. This suggests that PER has a positive spatial spillover effect.
The regression results of SDM model provide a preliminary judgment for exploring spatial spillover effects. To obtain more detailed results, we next conduct a partial differentiation of the spillover effects of heterogeneous ER on GTI. Table 5 reports the direct, indirect, and total effects of CER, MER and PER on GTI. The results indicate differences in the spatial spillover effects of the three types of ER, confirming Hypothesis 2. We further try to explain the reasons for these differences in further detail.
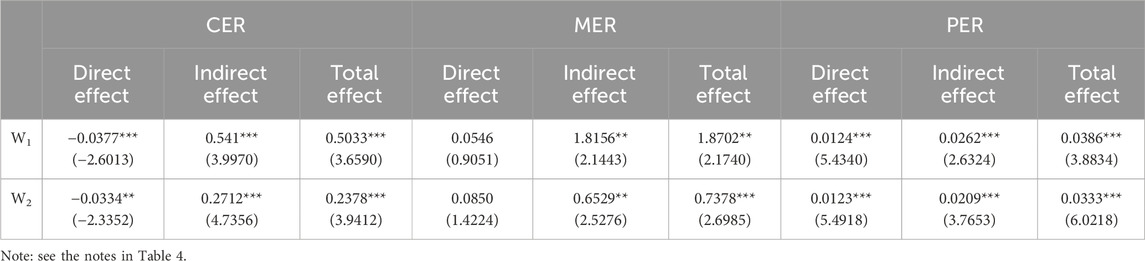
Table 5. Decomposition of spatial spillover effects of ER on GTI.
Under both types of spatial weight matrices, the estimation coefficients for the direct effect of CER are significantly negative, indicating an inhibitory effect on local GTI. GTI involves high R&D risk and significant initial investment, making short-term pollution control difficult to achieve. Under stringent CER, enterprises lack sufficient motivation to pursue GTI, and CER increases the pressure on enterprises for environmental governance, crowding out R&D funds, so that the development of GTI is hindered. The estimated coefficients for the indirect effect of CER is significantly positive, indicating that CER promotes GTI in neighboring areas. This is consistent with the findings of Dong and Wang (2019). This phenomenon may be due to two reasons: first, higher CER may lead to the relocation of polluting industries to neighboring regions to reduce environmental management costs, resulting in economic growth in neighboring regions. This growth allows neighboring governments to have more sufficient revenue to invest in GTI. Second, for enterprises, the environmental management cost savings after relocation can be invested in GTI, further enhancing GTI in neighboring areas. Furthermore, according to signaling theory, higher levels of CER signal the government’s determination for environmental governance to surrounding areas. This provides development opportunities for GTI, encouraging enterprises in neighboring regions to prioritize green production and invest in R&D activities for GTI.
According to the decomposition results, the coefficients of direct effect of MER are positive but not significant. According to innovation compensation theory, MER creates market conditions for enterprises’ GTI, allowing them to recover costs through green product and green production process. This enhances enterprises’ willingness to engage in GTI, increases R&D investment, and further improves GTI in the city. However, the insignificance of the regression coefficient may be due to the fact that MER in the YREB is still developing and has not yet mobilized the market forces to fully engage local enterprises in GTI. As a representative tool of MER, China Carbon Emission Trading Market (CETM) starts online trading, with two of the three major carbon emission trading markets in China located in Wuhan and Shanghai, two key cities in the YREB. This development clarifies the governance concept of market constraints on environmental pollution and the promotion of GTI (Zhang et al., 2022). With continuous improvement, the impact of MER on promoting GTI in YREB will gradually become evident. The coefficients of indirect effects of MER are significantly positive, indicating that it facilitates GTI in neighboring regions. The possible reasons are as follows: first, under the influence of MER, GTI in neighboring regions could be improved through the exchange of related knowledge and technology with the promotion of local GTI. Second, MER uses market radiation effects to encourage GTI by expanding the market for green intermediate products and green production, which also provides sufficient motivation for neighboring enterprises to engage in GTI.
The coefficients of direct effect of PER on GTI are significantly positive, indicating that PER facilitates local GTI. This is primarily because the public has access to environmental information and actively participates in environmental governance. The public can directly pressure high-polluting enterprises to adopt green development through public opinion and consumer choices. They can also participate in government environmental regulation through petitions and lawsuits, compelling the government to focus on environmental governance and use its power to guide enterprises in GTI. The coefficients of indirect effect of PER are significantly positive. There are two main reasons: first, while PER regulates enterprises in the region, information spillover deters neighboring enterprises, prompting them to develop GTI, which enhances GTI in neighboring cities. Second, in the digital information period, as environmental information in neighboring areas become more open and transparent, public with high environment awareness can regulate governments and enterprises in neighboring cities through online information, such as website reports or public opinion, without being constrained by geographical distance, enhancing the spatial spillover effect of PER on GTI.
5.3 Endogeneity test
5.3.1 Regression analysis of instrumental variables
To address the problem of endogeneity in selecting indicators of ER, this paper adopts PM2.5 and the air circulation index as the main instrumental variables. First, higher regional PM2.5 is associated with poorer environmental performance, leading to stronger ER (Yin et al., 2022). This suggests that PM2.5 can influence the strength of regional ER, which is consistent with the correlation characteristics of instrumental variables. However, because GTI has certain technological barriers, PM2.5 does not directly affect it, aligning with the independence characteristics of instrumental variables. Therefore, it is reasonable to choose PM2.5 as an instrumental variable.
Second, wind speed has been found to affect the strength of regional ER. In reality, the greater the air circulation coefficient, the lower the relative air pollution and the strength of ER (Chen and Deng, 2018), which is consistent with the correlation characteristics of instrumental variables. The air circulation coefficient does not directly impact urban GTI, aligning with the independence characteristics of instrumental variables. Therefore, it is reasonable to choose the air circulation index as an instrumental variable, which is obtained by multiplying the wind speed by the height of the boundary layer.
We further employ 2SLS methods to test the effect of ER on GTI. Columns (1)–(4) of Table 6 detail the regression results of the endogeneity test, demonstrating that the influence of heterogeneous ER on GTI in cities remains significant after accounting for endogeneity. According to the results of the Kleibergen-Paap rk LM statistic and the Kleibergen-Paap rk Wald F statistic, the chosen instrumental variables do not suffer from over-identification or weak instrumental variable problems. The test results justify the use of these instrumental variables.
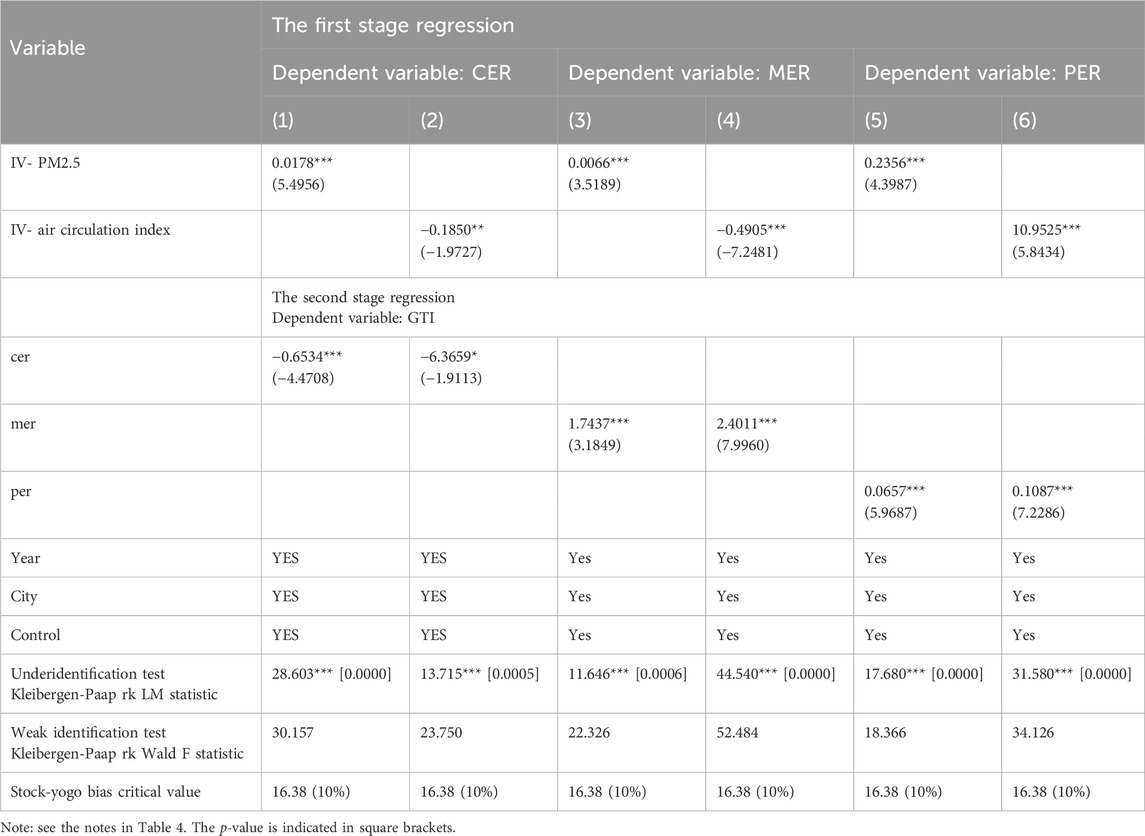
Table 6. Regression results for instrumental variables.
5.3.2 Exclusivity test based on SDID model
This paper focuses on the impacts of heterogeneous ER on urban GTI, potentially assuming that ER affects urban GTI without considering other influencing factors, which may introduce endogeneity problems. To address this issue, this paper references existing studies and selects pilot policies representing three types of ER to construct quasi-natural experiments and conducts exclusion tests using DID models. Specifically, we select the “Action Plan for Air Pollution Prevention and Control” (or simply as it is “Ten Rules of the Atmosphere”) as a pilot policy to replace CER. This policy is the most stringent atmospheric governance action plan in China and can effectively represent the coercive administrative nature of CER. Additionally, this paper chooses the “Carbon Emission Trading Pilot Policy” as a pilot policy to replace MER. Through the establishment of a carbon trading market, China promotes energy conservation and emission reduction, which well characterizes the features of MER. Furthermore, this paper selects the “Measures for Public Participation in Environmental Protection” as a policy to replace PER. It enhances the public’s regulatory status in environmental protection, making it a representative policy of PER. The spatial DID models are constructed as follows, where “post” represents the time dummy variable before and after the policy shock:
The regression results are shown in Table 7, the regression results represent that the direct, indirect and total effects of the three types of ER are consistent with the regression results of the benchmark model, so we believe that the results are credible.

Table 7. Regression results for SDID model.
5.4 Robustness tests
5.4.1 Switching weight matrices
To ensure the reliability of the analysis results, we choose the neighboring spatial weight matrix
Table 8 reports the regression results. We observe that the decomposition results the three types of ER are consistent with the results of benchmark model. CER inhibits local GTI at the 10% significance level and promotes GTI in neighboring cities at the 1% significance level. MER does not significantly promote local GTI, but it promotes GTI in neighboring areas at the 10% significance level. PER promotes both local and neighboring GTI at the 1% significance level. Therefore, we believe that the benchmark model regression results are robust.
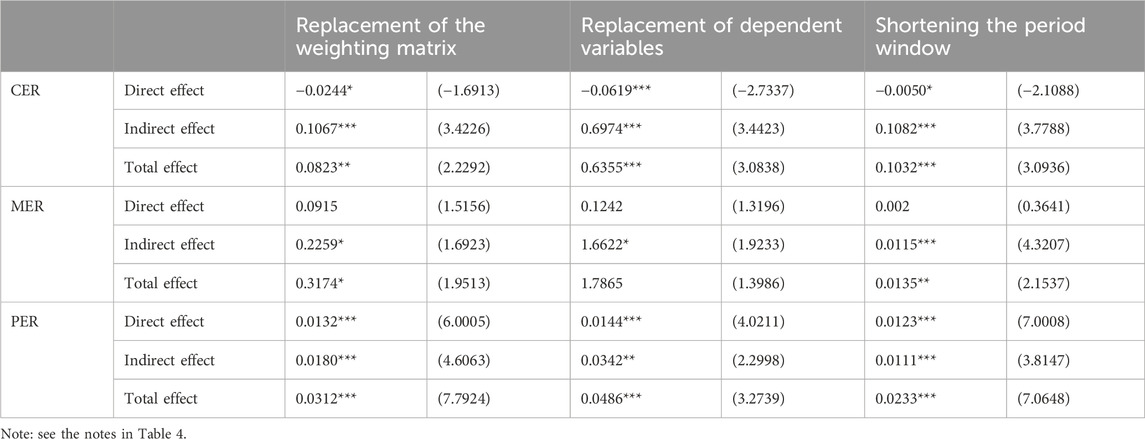
Table 8. Robustness test results.
5.4.2 Switching dependent variables
We further replaced the dependent variable, using the total number of green patent applications per 10,000 people as a proxy variable characterizing GTI. The total number of green patent applications per 10,000 people has a larger scope, including more inventions and utility models, and represents urban GTI broadly (Chen et al., 2022). According to Table 8, after replacing dependent variable, the coefficients of ER are consistent with the baseline regression results. Therefore, we believe that the model regression results are robust.
5.4.3 Shortening the time window
To ensure the results robust, we have further shortened our research window. Considering that the concept of “building the YREB based on golden waterways” was introduced in 2014 Chinese Government Work Report, formally marking the development of the YREB as a national strategy, it clarified the scientific significance of our research. In the same year (in 2014), Ant Finance Services Group was formally established, and Alipay, one of its core businesses products, was launched, injecting new vitality into the development of DFI in China. This emphasizes the need to incorporate the concept of DFI into our research framework. What’s more, we also take the other uncertainties into consider, such as the COVID-19 pandemic in 2020, the introduction of the Yangtze River Protection Law, and the implementation of the policy “10-year fishing ban on the Yangtze River”, may affect the estimation results. This study selects panel data from 2014 to 2019 finally to re-estimate the model. According to Table 8, the coefficients of ER remain consistent with the results of benchmark regression model after shortening the study period.
6 Moderating effects of DFI
GTI requires financial support, and DFI can effectively compensate for the deficiencies of traditional financial services, such as complicated procedures and low efficiency, providing enterprises with convenient and fast financial support. We further introduce the concept of DFI to further explore its role in the process of GTI under heterogeneous ER. DFI can guarantee R&D investment in GTI through investment in innovative activities (Lin and Ma, 2022; Cheng et al., 2023). DFI can also improve the efficiency of capital utilization through the identification and management of investment risks, enhancing the efficiency of enterprises’ GTI (Li et al., 2022). In addition, the combination of DFI and government policy support can guide enterprises to actively pursue GTI by providing targeted subsidies. This approach can also trigger a learning effect among similar enterprises, encouraging more enterprises to engage in GTI (Wang et al., 2022). However, DFI also has shortcomings. Studies have found that it may lead to increased environmental pollution in local and neighboring areas (Ozturk and Ullah, 2022). Differences in digital infrastructure between regions may also lead to a regional digital divide. DFI may cause a siphoning effect, where regions with high levels of DFI absorb large quantities of innovation elements from neighboring regions due to differences in development and technical support (Zhang et al., 2022).
Table 9 reports the moderating and spatial spillover effects of DFI in the context of three types of ER on GTI under two weight matrices.
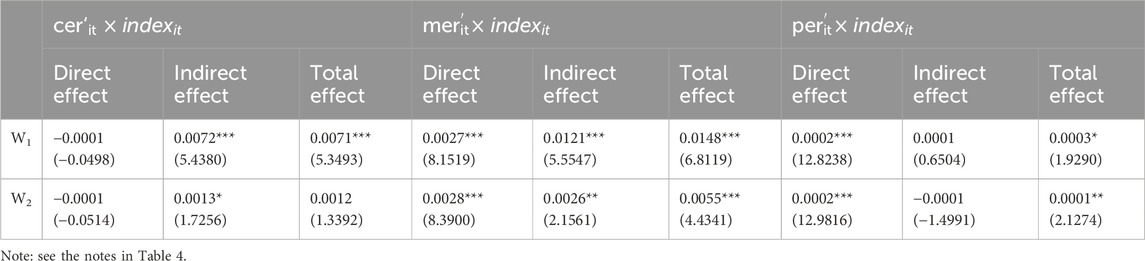
Table 9. Decomposition of spatial spillover effects.
The results show that the interaction term between CER and DFI (
The interaction term between MER and DFI (
The interaction term between PER and DFI (
Overall, GTI effects of all three types of ER can be enhanced to extent in regions with higher levels of DFI. However, DFI has different effects on GTI in local versus neighboring regions. It further confirms Hypothesis 3.
7 Conclusion and policy implications
Discussions around ER and GTI have been extensive. While scholars have provided important insights into the complex relationship between them, research on the impact of different types of ER on GTI and its spatial spillover effects remains insufficient. This study empirically analyzes the impacts of heterogeneous ER on GTI and its spatial spillover effects. We construct SDM models by utilizing panel data from 108 cities in YREB from 2011 to 2020. Additionally, the role of DFI in this process is further explored using a moderating effect model that considers spatial spillover factors.
The main findings of the study are as follows:
First, the analysis of spatio-temporal evolution reveals that GTI in YREB has significantly improved, with consistently higher levels in the downstream area, showing a significant positive correlation in spatial distribution.
Second, three types of ER in YREB exhibit spatial spillover effects on GTI. CER inhibits local GTI but positively promotes GTI in neighboring cities. MER does not significantly affect local GTI but can enhance GTI in neighboring cities. PER not only promotes local GTI but also positively influences GTI in neighboring cities. These findings remain robust after conducting a series of endogeneity and robustness tests.
Third, DFI plays a significant role in the local and neighboring effect of ER on GTI. Specifically, DFI enhances the role of CER in promoting GTI in neighboring regions but has a weaker impact on local GTI. DFI enhances the role of MER in promoting GTI in both local and neighboring regions. DFI enhances the impact of PER on local GTI, with the spillover effect being negligible.
The main findings of the study are as follows:
Based on these findings, we propose the following policy implications:
First, cities in the YREB should enhance the multi-type environmental regulatory system and fully utilize the power of the government, market, and the public for environmental governance. The government should avoid “one-size-fits-all” regulatory policies, consider the actual problems faced by enterprises, and formulate differentiated policies of CER based on the resource endowment and industrial structure characteristics of different regions. The role of market guidance should be maintained, emphasizing the primary position of enterprises in GTI. In addition to implementing green development tax incentives and subsidy policies, further scientific implementation of MER, such as carbon emissions trading and emissions trading policies, should be promoted to encourage more enterprises to participate in market transactions and incentivize the development of GTI. The public’s role in environmental governance should be emphasized by raising environmental awareness, safeguarding the public’s right to participate in ER through improved information disclosure and developing a public reporting platform for environmental monitoring.
Second, the YREB should enhance regional synergistic governance and address spatial spillover effects of various types of ER. The governments should objectively assess the regional transfer of polluting industries caused by CER and formulate support policies for the green production transition of these industries to help enterprises achieve sustainable development. Additionally, the government should scientifically evaluate the development advantages of local and neighboring cities, actively introduce or cultivate green and low-carbon industries, and support green and low-carbon enterprises with competitive advantages. The positive spillover effects of MER should be further enhanced. For instance, accelerating the construction of a carbon emissions trading market, gradually forming a market for the YREB and even a nationwide market, and incorporating more cities and industries into this market can influence more enterprises to implement green technological innovation. Expanding the green technology trading market and encouraging cross-regional transactions of green technology should be promoted. The government can facilitate regional technology transactions and information exchange by regularly hosting regional green technology market exchange meetings. Additionally, the government should standardize environmental information disclosure mechanisms and ESG performance disclosure by listed companies across regions. Currently, China’s ESG information disclosure system is still in its early stages, characterized by inconsistent standards and incomplete content. To ensure greater public participation in environmental governance, the transparency of environmental information needs to be further improved. Therefore, it is recommended that relevant national departments issue unified ESG information disclosure standards, clarifying the requirements for listed companies regarding environmental, social, and governance aspects.
Third, the implementation of the DFI strategy should guide the regulation of the digital financial support environment. The government should create a fairer financing environment of DFI, safeguard the financing rights of growth-oriented green innovative enterprises to stimulate corporate innovation and further promote GTI. This can be achieved by improving digital infrastructure across the YREB, building big data centers, and introducing cloud computing technology, among other measures. Additionally, supervision of fund use should be strengthened to ensure funds flow to environmentally friendly activities, improve fund allocation efficiency, and support competitive green innovation activities, thereby realizing the green and high-quality development of the YREB.
Although valuable findings are obtained in this paper, there is still spaces for improvement in the current study. For example, our study area is limited to the YREB and does not include all cities in China. Since there are significant differences in the characteristics of cities across China, future research could encompass all cities in China, potentially leading to more interesting findings.
Data availability statement
The original contributions presented in the study are included in the article/supplementary material, further inquiries can be directed to the corresponding author.
Author contributions
HJ: Conceptualization, Data curation, Formal Analysis, Investigation, Methodology, Software, Validation, Visualization, Writing–original draft, Writing–review and editing. HD: Funding acquisition, Resources, Supervision, Writing–review and editing. SH: Data curation, Formal Analysis, Methodology, Software, Visualization, Writing–original draft, Writing–review and editing.
Funding
The author(s) declare that financial support was received for the research, authorship, and/or publication of this article. This work was supported by grant from National Social Science Foundation 2022 Late Stage Funding Program of China (Grant No.22FJLB006).
Conflict of interest
The authors declare that the research was conducted in the absence of any commercial or financial relationships that could be construed as a potential conflict of interest.
Publisher’s note
All claims expressed in this article are solely those of the authors and do not necessarily represent those of their affiliated organizations, or those of the publisher, the editors and the reviewers. Any product that may be evaluated in this article, or claim that may be made by its manufacturer, is not guaranteed or endorsed by the publisher.
References
Behera, P., and Sethi, N. (2022). Nexus between environment regulation, fdi, and green technology innovation in oecd countries. Environ. Sci. Pollut. Res. Int. 29, 52940–52953. doi:10.1007/s11356-022-19458-7
Chen, C. F., Lin, Y. S., Lv, N., Zhang, W., and Sun, Y. W. (2022). Can government low-carbon regulation stimulate urban green innovation? Quasi-experimental evidence from China's low-carbon city pilot policy. Appl. Econ. 54, 6559–6579. doi:10.1080/00036846.2022.2072466
Chen, S. Y., and Chen, D. K. (2018). Smog pollution, government governance and high-quality economic development. Econ. Res. J. 53, 20–34.
Chen, Y. Y., Yao, Z. Y., and Zhong, K. (2022). Do environmental regulations of carbon emissions and air pollution foster green technology innovation: evidence from China's prefecture-level cities. J. Clean. Prod. 350, 131537. doi:10.1016/j.jclepro.2022.131537
Cheng, Y., Lv, K. J., and Zhu, S. W. (2023). How does digital financial inclusion promote green total factor productivity in China? An empirical analysis from the perspectives of innovation and entrepreneurship. Process Saf. Environ. Prot. 174, 403–413. doi:10.1016/j.psep.2023.04.002
Conrad, K., and Wastl, D. (1995). The impact of environmental regulation on productivity in German industries. Empir. Econ. 20, 615–633. doi:10.1007/BF01206060
Dong, Z. Q., and Wang, H. (2019). Local and neighboring effects of environmental regulation on green technology progress. China Ind. Econ., 100–118. doi:10.19581/j.cnki.ciejournal.2019.01.006
Du, K. R., Cheng, Y. Y., and Yao, X. (2021). Environmental regulation, green technology innovation, and industrial structure upgrading: the road to the green transformation of Chinese cities. Energy Econ. 98, 105247. doi:10.1016/j.eneco.2021.105247
Edwards, J. R., and Lambert, L. S. (2007). Methods for integrating moderation and mediation: a general analytical framework using moderated path analysis. Psychol. Methods 12, 1–22. doi:10.1037/1082-989X.12.1.1
Elhorst, J. P. (2003). Specification and estimation of spatial panel data models. Int. Reg. Sci. Rev. 26, 244–268. doi:10.1177/0160017603253791
Fan, J. D., and Teo, T. (2022). Will China's r&d investment improve green innovation performance? An empirical study. Environ. Sci. Pollut. Res. Int. 29, 39331–39344. doi:10.1007/s11356-021-18464-5
Fan, M., Yang, P., and Li, Q. (2022). Impact of environmental regulation on green total factor productivity: a new perspective of green technological innovation. Environ. Sci. Pollut. Res. Int. 29, 53785–53800. doi:10.1007/s11356-022-19576-2
Feng, L., Chen, Z. M., and Chen, H. S. (2022). Does the central environmental protection inspectorate accountability system improve environmental quality? Sustainability 14, 6575. doi:10.3390/su14116575
Guo, F., Wang, J. Y., Wang, F., Kong, T., Zhang, X., and Cheng, Z. Y. (2020). Measuring the development of digital financial inclusion in China: index compilation and spatial characteristics. China Econ. Q. 19, 1401–1418. doi:10.13821/j.cnki.ceq.2020.03.12
Han, Y. Q., Li, Y. S., and Wang, Q. Q. (2023). Digital finance, environmental regulation, and green development efficiency of China. Front. Environ. Sci. 11. doi:10.3389/fenvs.2023.1131058
Hao, X. L., Wang, X. H., Wu, H. T., and Hao, Y. (2023). Path to sustainable development: does digital economy matter in manufacturing green total factor productivity? Sustain Dev. 31, 360–378. doi:10.1002/sd.2397
Harrison, BJAA (1999). Do domestic firms benefit from direct foreign investment evidence from Venezuela. Am. Econ. Assoc. 3, 605–618. doi:10.1257/aer.89.3.605
Hu, R. F., and Xu, W. Q. (2023). What's going on? Urban agglomerations and firm green innovation: evidence from chengdu-chongqing economic circle, China. J. Clean. Prod. 414, 137662. doi:10.1016/j.jclepro.2023.137662
Hua, S. M., and Li, J. Z. (2023). Can environmental regulation tools achieve “quality improvement and quantity increase” of enterprise green technological innovation under the conditions of digital economy? Sci. Technol. Prog. Policy 40, 141–150.
Huang, H. P., and Yi, M. T. (2023). Impacts and mechanisms of heterogeneous environmental regulations on carbon emissions: an empirical research based on did method. Environ. Impact Assess. Rev. 99, 107039. doi:10.1016/j.eiar.2023.107039
Huang, X. L., and Tian, P. (2023). How does heterogeneous environmental regulation affect net carbon emissions: spatial and threshold analysis for China. J. Environ. Manage 330, 117161. doi:10.1016/j.jenvman.2022.117161
Lee, C. C., Chen, P. F., and Chu, P. J. (2023). Green recovery through financial inclusion of mobile payment: a study of low- and middle-income asian countries. Econ. Anal. Policy 77, 729–747. doi:10.1016/j.eap.2022.12.012
Lee, C. C., Wang, F. H., and Lou, R. C. (2022). Digital financial inclusion and carbon neutrality: evidence from non-linear analysis. Resour. Policy 79, 102974. doi:10.1016/j.resourpol.2022.102974
Lee, C. C., Zeng, M. L., and Wang, C. S. (2022). Environmental regulation, innovation capability, and green total factor productivity: new evidence from China. Environ. Sci. Pollut. Res. Int. 29, 39384–39399. doi:10.1007/s11356-021-18388-0
Li, G. X., Zhang, R., Feng, S. L., and Wang, Y. Q. (2022). Digital finance and sustainable development: evidence from environmental inequality in China. Bus. Strategy Environ. 31, 3574–3594. doi:10.1002/bse.3105
Li, J., and Du, Y. X. (2021). Spatial effect of environmental regulation on green innovation efficiency: evidence from prefectural-level cities in China. J. Clean. Prod. 286, 125032. doi:10.1016/j.jclepro.2020.125032
Li, P., and Fang, J. (2023). Environmental regulation, digital economy and enterprise green innovation. Statistics Decis. 39, 158–163. doi:10.13546/j.cnki.tjyjc.2023.05.029
Li, Z. H., Chen, H. Z., and Mo, B. (2023). Can digital finance promote urban innovation? Evidence from China. Borsa Istanb Rev. 23, 285–296. doi:10.1016/j.bir.2022.10.006
Li, Z. H., Huang, Z. M., and Su, Y. Y. (2023). New media environment, environmental regulation and corporate green technology innovation:evidence from China. Energy Econ. 119, 106545. doi:10.1016/j.eneco.2023.106545
Lin, B. Q., and Ma, R. Y. (2022). How does digital finance influence green technology innovation in China? Evidence from the financing constraints perspective. J. Environ. Manage 320, 115833. doi:10.1016/j.jenvman.2022.115833
Liu, J. M., Jiang, Y. L., Gan, S. D., He, L., and Zhang, Q. F. (2022). Can digital finance promote corporate green innovation? Environ. Sci. Pollut. Res. Int. 29, 35828–35840. doi:10.1007/s11356-022-18667-4
Liu, Y. Q., Zhu, J. L., Li, E. Y., Meng, Z. Y., and Song, Y. (2020). Environmental regulation, green technological innovation, and eco-efficiency: the case of yangtze river economic belt in China. Technol. Forecast Soc. Change 155, 119993. doi:10.1016/j.techfore.2020.119993
Luo, K., Liu, Y. B., Chen, P. F., and Zeng, M. L. (2022). Assessing the impact of digital economy on green development efficiency in the yangtze river economic belt. Energy Econ. 112, 106127. doi:10.1016/j.eneco.2022.106127
Luo, Y. S., Salman, M., and Lu, Z. N. (2021). Heterogeneous impacts of environmental regulations and foreign direct investment on green innovation across different regions in China. Sci. Total Environ. 759, 143744. doi:10.1016/j.scitotenv.2020.143744
Meng, F. S., and Zhang, W. Y. (2022). Digital finance and regional green innovation: evidence from Chinese cities. Environ. Sci. Pollut. Res. Int. 29, 89498–89521. doi:10.1007/s11356-022-22072-2
Mi, Z. F., Pan, S. Y., Yu, H., and Wei, Y. M. (2015). Potential impacts of industrial structure on energy consumption and co2 emission: a case study of beijing. J. Clean. Prod. 103, 455–462. doi:10.1016/j.jclepro.2014.06.011
Mu, X. Z., Zhan, Q. L., Ameer, W., Anser, M. K., Zeng, X. H., and Amin, A. (2022). Effects of environmental regulation competition and public participation on enterprise location selection under climate change in covid-19 pandemic conditions: an analysis based on the Chinese provincial spatial panel model. Front. Environ. Sci. 10. doi:10.3389/fenvs.2022.884401
Obobisa, E. S., Chen, H. B., and Mensah, I. A. (2023). Transitions to sustainable development: the role of green innovation and institutional quality. Environ. Dev. Sustain 25, 6751–6780. doi:10.1007/s10668-022-02328-0
Ouyang, X. L., Li, Q., and Du, K. R. (2020). How does environmental regulation promote technological innovations in the industrial sector? Evidence from Chinese provincial panel data. Energy Policy 139, 111310. doi:10.1016/j.enpol.2020.111310
Ouyang, X. L., Zhang, J. H., and Du, G. (2022). Environmental regulation and urban green technological innovation: mechanisms and spatial effects. Chin. J. Manag. Sci. 30, 141–151. doi:10.16381/j.cnki.issn1003-207x.2022.0642
Ozturk, I., and Ullah, S. (2022). Does digital financial inclusion matter for economic growth and environmental sustainability in obri economies? An empirical analysis. Resour. Conserv. Recycl 185, 106489. doi:10.1016/j.resconrec.2022.106489
Pace, R. K., and Lesage, J. P. (2009). A sampling approach to estimate the log determinant used in spatial likelihood problems. J. Geogr. Syst. 11, 209–225. doi:10.1007/s10109-009-0087-7
Rao, S. Y., Pan, Y., He, J. N., and Shangguan, X. M. (2022). Digital finance and corporate green innovation: quantity or quality? Environ. Sci. Pollut. Res. Int. 29, 56772–56791. doi:10.1007/s11356-022-19785-9
Shao, S., Li, X., Cao, J. H., and Yang, L. L. (2016). Economic policy choices for China's smog pollution control: perspective of spatial spillover effects. Econ. Res. J. 51, 73–88.
Shao, X. Y., Liu, S., Ran, R. P., and Liu, Y. Q. (2022). Environmental regulation, market demand, and green innovation: spatial perspective evidence from China. Environ. Sci. Pollut. Res. Int. 29, 63859–63885. doi:10.1007/s11356-022-20313-y
Shi, B. B., Li, N., Gao, Q., and Li, G. Q. (2022). Market incentives, carbon quota allocation and carbon emission reduction: evidence from China's carbon trading pilot policy. J. Environ. Manage 319, 115650. doi:10.1016/j.jenvman.2022.115650
Tan, F. F., Gong, C. Y., and Niu, Z. Y. (2022). How does regional integration development affect green innovation? Evidence from China's major urban agglomerations. J. Clean. Prod. 379, 134613. doi:10.1016/j.jclepro.2022.134613
Taylor, BRCA, and Taylor, M. S. (1994). north-south trade and the environment. Q. J. Econ. 109 (3), 755e–787e. doi:10.2307/2118421
Tian, Y., and Feng, C. (2022). The internal-structural effects of different types of environmental regulations on China's green total-factor productivity. Energy Econ. 113, 106246. doi:10.1016/j.eneco.2022.106246
Wang, J., Zhao, L. Y., and Zhu, R. X. (2022). Peer effect on green innovation: evidence from 782 manufacturing firms in China. J. Clean. Prod. 380, 134923. doi:10.1016/j.jclepro.2022.134923
Wang, L. P., Long, Y., and Li, C. (2022). Research on the impact mechanism of heterogeneous environmental regulation on enterprise green technology innovation. J. Environ. Manage 322, 116127. doi:10.1016/j.jenvman.2022.116127
Wang, X., Wang, X., Ren, X. H., and Wen, F. H. (2022). Can digital financial inclusion affect co2 emissions of China at the prefecture level? Evidence from a spatial econometric approach. Energy Econ. 109, 105966. doi:10.1016/j.eneco.2022.105966
Wang, X. Y., Chai, Y. Z., Wu, W. S., and Khurshid, A. (2023). The empirical analysis of environmental regulation's spatial spillover effects on green technology innovation in China. Int. J. Environ. Res. PUBLIC HEALTH 20, 1069. doi:10.3390/ijerph20021069
Wu, H., Guo, H., Zhang, B., and Bu, M. (2017). Westward movement of new polluting firms in China: pollution reduction mandates and location choice. J. Comp. Econ. 45, 119–138. doi:10.1016/j.jce.2016.01.001
Wu, L. B., Yang, M. M., and Sun, K. G. (2022). Impact of public environmental concern on enterprise and government environmental governance. China Popul. Resour. Environ. 32, 1–14. doi:10.12062/cpre.20210625
Xie, R. H., and Teo, T. (2022). Green technology innovation, environmental externality, and the cleaner upgrading of industrial structure in China - considering the moderating effect of environmental regulation. Technol. Forecast Soc. Change 184, 122020. doi:10.1016/j.techfore.2022.122020
Xie, R. H., Yuan, Y. J., and Huang, J. J. (2017). Different types of environmental regulations and heterogeneous influence on "green" productivity: evidence from China. Ecol. Econ. 132, 104–112. doi:10.1016/j.ecolecon.2016.10.019
Yin, L. H., Meng, X. Q., and Wu, C. Q. (2022). Impact of environmental regulation on the green total factor productivity of the manufacturing industry in the Yangtze River Economic belt. Reform, 101–113.
Yu, C. Y., Long, H. Y., Zhang, X., Tan, Y., Zhou, Y., Zang, C., et al. (2023). The interaction effect between public environmental concern and air pollution: evidence from China. J. Clean. Prod. 391, 136231. doi:10.1016/j.jclepro.2023.136231
Zhang, H., Xu, T. T., and Feng, C. (2022). Does public participation promote environmental efficiency? Evidence from a quasi-natural experiment of environmental information disclosure in China. Energy Econ. 108, 105871. doi:10.1016/j.eneco.2022.105871
Zhang, J. F., Shang, J. H., and Qiao, B. (2022). The impact of digital financial inclusion on green innovation efficiency: empirical evidence from 280 prefecture-level cities in China. Econ. Probl., 17–26. doi:10.16011/j.cnki.jjwt.2022.11.004
Zhang, W., Li, G. X., and Guo, F. Y. (2022). Does carbon emissions trading promote green technology innovation in China? Appl. Energy 315, 119012. doi:10.1016/j.apenergy.2022.119012
Zhang, W., Liu, X. M., Wang, D., and Zhou, J. P. (2022). Digital economy and carbon emission performance: evidence at China's city level. Energy Policy 165, 112927. doi:10.1016/j.enpol.2022.112927
Zhang, X., and Xu, F. (2022). The impact of environmental regulation on green technological innovation: a regional heterogeneity analysis from the perspective of government intervention. Urban Probl., 55–64. doi:10.13239/j.bjsshkxy.cswt.220906
Zhao, X., Nakonieczny, J., Jabeen, F., Shahzad, U., and Jia, W. X. (2022). Does green innovation induce green total factor productivity? Novel findings from Chinese city level data. Technol. Forecast Soc. Change 185, 122021. doi:10.1016/j.techfore.2022.122021
Zhou, Q., Zhang, X. L., Shao, Q. L., and Wang, X. L. (2019). The non-linear effect of environmental regulation on haze pollution: empirical evidence for 277 Chinese cities during 2002-2010. J. Environ. Manage 248, 109274. doi:10.1016/j.jenvman.2019.109274
Keywords: heterogeneous environmental regulation, green technology innovation, digital financial inclusion, SDM model, YREB
Citation: Jiao H, Deng H and Hu S (2024) Driving green technology innovation: the impacts of heterogeneous environmental regulation and digital financial inclusion. Front. Environ. Sci. 12:1392419. doi: 10.3389/fenvs.2024.1392419
Received: 27 February 2024; Accepted: 27 June 2024;
Published: 16 September 2024.
Edited by:
Shashi Arya, Imperial College London, United KingdomCopyright © 2024 Jiao, Deng and Hu. This is an open-access article distributed under the terms of the Creative Commons Attribution License (CC BY). The use, distribution or reproduction in other forums is permitted, provided the original author(s) and the copyright owner(s) are credited and that the original publication in this journal is cited, in accordance with accepted academic practice. No use, distribution or reproduction is permitted which does not comply with these terms.
*Correspondence: Hongbing Deng, ZGVuZzExNUBjdWcuZWR1LmNu