 Wang Jie
 Khan Rabnawaz
- School of Internet Economics and Business, Fujian University of Technology, Fuzhou, Fujian, China
Emerging economies and ecosystems are critically dependent on fossil fuels, and a country’s energy dependence is a significant measure of its reliance on foreign suppliers. This study evaluates the impact of energy reliance on energy intensity, CO2 emission intensity, and the utilization of renewable resources in 35 developing and 20 developed nations, as well as the connection between renewable energy (REN), GDP growth, and CO2 emissions. This study employs the generalized linear model (GLM) and the robust least squares (RLS) method to assess the inverse association between renewable energy and developed and developing economy policymakers, utilizing unique linear panel estimate approaches (1970–2022). The impact of renewable energy as a response variable on economic growth, energy consumption, and CO2 emissions across four continents is investigated in this study. The findings indicate that developing countries experience a rise in per capita CO2 emissions if their renewable energy use exceeds their capacity. This finding remains significant even when other proxies for renewable energy use are introduced using modified approaches. Furthermore, it is particularly relevant to industrialized nations that possess more developed institutions. Even more surprisingly, in terms of the energy and emission intensity required for growth, energy dependence has accelerated all components. The regional analysis revealed a spillover impact in most areas, suggesting that the consequences of energy dependence are essentially the same in neighboring countries. The growth of the renewable energy sector and the decrease in greenhouse gas emissions depend critically on the ability of regional energy exchange unions to mitigate the negative environmental and economic impacts of energy dependency. These underdeveloped countries need to spend more on research and development to catch up technologically.
1 Introduction
Today, more than ever, climate change represents a serious threat to humanity’s very survival. Historically rising GHG emissions from expanding fossil fuel consumption and industrialization are widely recognized as major contributors to our warming planet (Le, 2022; Jiang et al., 2022). Natural resource extraction and high-value manufacturing use a lot of energy, which is good for the economy (Rahman et al., 2022), but it also creates a lot of trash, which can have a detrimental impact on the environment (Sheraz et al., 2022). Theoretically, the expansion of industries is a major factor in the allocation of scarce resources, the dynamics of economic development, the distribution of energy consumption, and the rate of environmental deterioration (Hu et al., 2020; Hussain et al., 2020). Using dirty energy in production and the increasing industrialization of developing continents have boosted environmental CO2 emissions and eroded natural capital (Wang X. et al., 2022). With its current rate of expansion, it is seen as a significant energy consumer. Sure enough, several sectors of the industry—notably manufacturing—are consuming a lot of power at high frequencies, which is negatively affecting CO2 emissions (Muhammad and Long, 2021; Schulhof et al., 2022). The causes of CO2 emissions and strategies for reducing them in order to lessen their impact on global warming have been the subject of a large body of research (Anwar et al., 2021; Deng and Du, 2020). Nonrenewable energy consumption was determined to be a large source of CO2 emissions, as fossil fuels account for around 80% of global energy consumption (Wang et al., 2023). It has been established that using nonrenewable energy sources is a major cause of CO2 emissions (Yang Y. et al., 2022). However, between 2019 and 2024, the global capacity for renewable energy sources is expected to increase by 50 percent, which could mitigate the negative effects of greenhouse gas emissions on the environment and human health (Li et al., 2019; Somoza-Tornos et al., 2021). Regarding this, one body of research has discovered that the use of renewable energy (REN) sources leads to a global reduction in CO2 emissions (Deng and Du, 2020; Saidi and Omri, 2020).
Various concepts about CO2 emissions have been investigated by the environmental Kuznets curve (EKC). Developing nations are better off following a growth path different from the EKC, which advocates for rapid economic expansion at the expense of environmental protection (Balsalobre-Lorente et al., 2021; Awan et al., 2022; Beyene, 2022). Growth is both the source and remedy of air pollution, as seen by the US shape link between income and environmental deterioration (EKC) (Liu and Lai, 2021). The EKC rises with rising income due to increased agricultural output. However, there are repercussions associated with tying economic growth and industrial policy to the energy sector. The alignment of economic growth and industrial policy with the energy industry, however, has consequences. Since accelerating economic expansion is incompatible with safeguarding the natural world, we must slow it down (Leal and Marques, 2020). According to the most up-to-date interpretation of the EKC, economic development is linked to deterioration in environmental performance (Liu et al., 2022; Bradley, 2021). Since this is the case, people worry more about things like air pollution, global warming, and the holy vapors that emanate from machines and factories than they do about the severe depletion of energy used per capita (Kaika and Zervas, 2013; Rashid Gill et al., 2018; Khan S. U. et al., 2022). Economic expansion, according to the so-called EKC concept, causes environmental damage at first, followed by improvement later on (Shittu et al., 2021). Studies assessing the link between economic growth and CO2 emissions have investigated the EKC theory at length, with conflicting results. There is evidence in the literature supporting the EKC theory that shows a negative correlation between per capita CO2 emissions and GDP (Muhammad and Long, 2021; Tenaw and Beyene, 2021; Cui et al., 2022). The latter piece of work suggests that once high-income countries reach a certain threshold, their per capita CO2 emissions begin to grow again (Jiang et al., 2022; Li et al., 2022; Fakher et al., 2023). The latter literature suggests that after high-income countries hit a certain threshold, the rate of CO2 emissions per capita begins to rise once more. Therefore, the mitigation of environmental harm resulting from CO2 emissions can be facilitated through the adoption of renewable energy sources and the enhancement of energy efficiency. Environmental risk can be mitigated by the implementation and refinement of an effective energy efficiency management program for a firm. Energy management can presently be executed utilizing the same technological expertise that has been applied to manage other, more valuable aspects of the expansion of developing and developed economies, including the value added by industries, per capita energy consumption, and fossil fuel energy (FFE) consumption. This study offers practical recommendations for strategies based on the aforementioned factors.
The causes of CO2 emissions and strategies for reducing them to lessen their impact on global warming have been the subject of a large body of research (Deng and Du, 2020; Anwar et al., 2021). Nonrenewable energy consumption was determined to be a major source of CO2 emissions as fossil fuels account for approximately 80% of global energy consumption (Wang et al., 2023). It has been established that using nonrenewable energy sources is a major cause of CO2 emissions (Yang Y. et al., 2022). Numerous research studies at various continents and temporal scales investigate the causes and distribution of CO2 emissions in the atmosphere (Dong et al., 2019; Jiao et al., 2020). Tracing the spatial gravity centers of the effects of the drivers revealed that energy intensity was the primary contributor to global CO2 emissions, while economic growth and population expansion were the most important variables in accelerating CO2 emissions on a per-country basis (Chang et al., 2019). The study’s key contribution is based on two parts: the use of renewable energy and CO2 emissions in 55 industrialized and developing nations. First, there is the deliberate movement toward renewable energy sources, which demonstrates that industrialized nations are making a concerted effort to lessen their dependency on fossil fuels and reduce CO2 emissions (Işık et al., 2024). To further reduce their growing CO2 emissions and achieve sustainable development, businesses are also investigating renewable energy sources. Second, there is a growing movement toward renewable energy sources as a result of governments’ growing awareness of the connection between CO2 emissions and climate change (Adu et al., 2023). This trend is true in both developed and developing nations (Bergougui, 2024). Renewable energy sources are quickly becoming the preferred energy source for many nations as they become more conscious of the environmental impacts and CO₂ emissions caused by fossil fuels (Sufyanullah et al., 2022; Dehghan Shabani, 2024). Thus, this work makes a fourfold contribution. This study’s insights are valuable additions to the literature because of them. Strong evidence from this study supports the idea that rapid economic growth affects the green economy. While conclusive research is lacking, it is safe to assume that national market mechanisms are impacted by the structure of economic growth. There was a positive correlation between energy’s role, economic growth, and the influence of CO2 emissions, as well as rapid changes in national structures.
Although these studies employ a wide variety of methodologies and datasets to investigate this impact, the vast majority of them rely on a linear relationship between REN consumption, nonrenewable energy consumption, GDP per capita, and CO2 emissions per capita (see Section 2 for a more detailed account of the literature) (Karaaslan and Çamkaya, 2022; Rahman et al., 2022). Despite renewable energy’s potential to fight climate change, this study reveals that major obstacles persist, particularly in both wealthy and developing nations. Widespread adoption is impeded, especially in poorer nations, by the cost, infrastructure limits, and the necessity for enabling regulations. In addition, it is crucial to transition away from fossil fuels quickly since the climate crisis is worsening. This will need international collaboration and a fair transition so that poor nations can afford to switch to renewable energy. This study distinguishes itself by focusing on economic growth; similarly, previous research studies have examined the dynamic relationship between energy use in developing countries and economic growth (Wang and Yan, 2022; Fakher et al., 2023). In this study, we use recently established panel threshold models to analyze panel data for 97 countries, spanning 1970–2022, for figuring out whether there is a nonlinear relationship between these three variables and CO2 emissions (Abbasi et al., 2021). Once a country reaches a particular level of REN consumption, we find no negative correlation between REN consumption and the growth of per capita CO2 emissions (Bekhet and Othman, 2018). In other words, only countries whose REN consumption exceeds a certain threshold would see a decline in their per capita CO2 emissions as their REN consumption increases (Mendonça et al., 2020; Mei et al., 2023).
A nonlinear relationship between an individual’s share of REN in their total energy use and their CO2 emissions is supported by theoretical considerations. The initial cost of REN is high, and its ongoing cost is higher than the cost of using conventional energy sources. Since the capacity to store REN is lower than that of nonrenewable energy sources, there can be supply problems during periods of high energy demand (Ocal and Aslan, 2013; Chen et al., 2022). For instance, a study conducted between 1984 and 2007 that examined REN use in 19 developed and developing countries found that it did not result in a reduction of CO2 emissions (Apergis et al., 2010). However, improvements in technologies (Rubin et al., 2015) used to utilize REN have been made recently. Furthermore, the cost of utilizing REN sources has decreased over the past few years, and the quality of REN technology has considerably improved due to substantial investments in R&D (Schilling and Esmundo, 2009; Chen et al., 2019a). Therefore, we expect that if countries achieve a specific threshold of REN consumption, it will significantly influence the reduction of CO2 emissions, lower industrial emissions, and decrease fossil fuel energy consumption. This is owing to the fact that high investment costs and storage problems may render the impact of REN usage on CO2 emissions negligible at lower levels of consumption. The most important takeaway from this research is the discovery of REN behavior as a dependent variable in the context of growth and CO2 emissions and the influence that this has on the listing of developing and developed countries by continent.
There are a few areas in which our paper adds to the existing body of research. To begin, a quadratic term of GDP per capita is typically utilized in the existing literature on EKC to represent REN impacts (see, for example, Jiang et al. (2022); Chang et al. (2023)). Although earlier research has examined the effects of GDP per capita on CO2 emissions, it has paid less attention to the inverse relationship between REN, economic growth, energy consumption, and the nexus of CO2 emissions. This work employs a panel dataset to predict the relationship between CO2 emissions, energy use per capita, industries, construction, and fossil fuel energy consumption, allowing us to test for all conceivable associations with the generalized linear model (GLM) and robust least squares (RLS) method. Second, this study employs the GLM and RLS method to measure the inverse relationship of REN as the dependent variable and to emphasize the influence of policymakers in both developing and wealthy countries on a continental scale. Consider the role that CO2 and other gases emitted into the atmosphere by burning fossil fuels, such as coal and petroleum gas, play in increasing the frequency and severity of devastating storms. Finally, the cross-sectional dependence was ignored in favor of the first-generation unit root test in the majority of the available literature. After checking for cross-sectional dependence, we employ second-generation unit root tests in this paper. The variables used in the regression model are decided based on the unit root results.
The remainder of this paper is structured as follows. The causes of REN and CO2 emissions are examined in Section 2 of this paper. The specifics of the empirical estimating strategies are presented in Section 3. The specifics of the dataset utilized for this analysis are provided in Section 4. Finally, Section 5 provides the results of the dynamic linear and threshold estimations, the robustness analysis, and the cross-sectional dependence and panel unit root tests. Section 6 concludes the report and provides policy suggestions.
2 Growth in the economy, CO2 emissions, and renewable energy
Large-scale construction projects and infrastructure—including roads, bridges, power plants, dams, cement, and steel—have been shown to contribute significantly to global warming (Deng and Du, 2020; Wu et al., 2021; Sheraz et al., 2022; Wang Z. et al., 2022; Yang Y. et al., 2022). Consequently, environmental quality will increase, and creating substitutes is widely recognized as a practical way to cut down on CO2 emissions. As a result, there will be a marked improvement in environmental quality, and the creation of substitutes is widely recognized as a viable strategy for reducing CO2 emissions.
It is important to note that the energy development levels of emerging and industrialized countries are vastly different (Su et al., 2022) and that some poor countries have tremendous renewable resources. Therefore, there is a significant difference in energy development between emerging and developed countries, while some developing countries have plentiful renewable resources (Chen et al., 2020; Schulhof et al., 2022). The ambitious goals, despite rigorous academic research on the foundation and contribution exploring to fulfill these strategic objectives, are still scarce and dangerous (Isik et al., 2019; Nwaka et al., 2020; Ren et al., 2021). Therefore, this study contributes fourfold. Insights like these from this study are useful contributions to the canon of written work. The findings of this research lend credence to the theory that brisk economic expansion has an impact on the green economy (Jiang et al., 2022). There has not been a definitive study demonstrating this, but the structure of economic growth does have an effect on the market mechanisms of individual nations. Rapid changes in national structures were found to be positively correlated with factors including energy’s role, economic growth, and the impact of CO2 emissions (Muhammad et al., 2020).
According to recent research, an assortment of effects that economic expansion has on CO2 emissions in industrialized and developing nations demonstrate the statistical relevance of the correlation between economic growth and CO2 emissions (Chang et al., 2023; Baajike et al., 2024). On the contrary, certain perspectives have highlighted that numerous developed and developing nations have mitigated their CO2 emissions by incorporating CO2 into the items they import via international commerce (Foster et al., 2023). More precisely, the country of production is held accountable for these emissions. Regarding the association between CO2 emissions and economic growth, a study employing the GLM and the RLS methods identified an inverse relationship between the two variables in industrialized nations (Alam and Hossain, 2024; Li et al., 2024). Comparatively, the utilization of renewable energy has been found to significantly decrease CO2 emissions, while sustainable economic expansion has been found to increase CO2 emissions (Lin and Ullah, 2024). Additionally, this research unveiled a reciprocal causal relationship that extends in all directions: from REN to CO2 emissions, technological innovation to CO2 emissions, GDP to REN, and REN to technological innovation (González-Álvarez and Montañés, 2023). Furthermore, economic diversification and the investment of natural resource extraction proceeds in innovative technologies can contribute to the advancement of sustainable development (Alvarado et al., 2023). Although technical advancement and ecological security are not the only significant metrics, limited attention is paid to the double-edged influence on CO2 emission reduction (Khan R., 2021; Ongan et al., 2022).
Changes in infrastructure and development, including urbanization and lifestyle changes, have outpaced efficiency expansion as CO2 emissions have increased (Işık et al., 2021; Khan R., 2021; Khan et al., 2022b; Khan, 2023). Environmental sustainability and economic growth are both important, yet many believe they are incompatible since economic growth threatens the environment (Jahanger et al., 2022). Similarly, the use of wind power has prevented the release of at least 600 million tons of CO2 into the atmosphere in 2017. Energy transition faces structural threats, yet REN’s potential to support long-term sustainable development is promising (Mi et al., 2021; Raihan et al., 2022). There are several severe drawbacks to REN, including high investment prices, insufficient scientific and technological developments, onerous infrastructural needs, and limited information accessibility. Although REN has been demonstrated to provide environmental benefits, these advantages are still contested in practice (Apergis et al., 2010). There has been a shift in focus toward REN sources due to their lower environmental impact. In terms of CO2 emissions, REN sources like solar photovoltaics (PV) and wind power are among the most promising (Yousefi, 2019; Wang and Sun, 2012).
By examining the interconnections between developing and developed nations in terms of CO2 emissions, economic growth, renewable energy utilization, industries, and trade, this study reveals substantial ramifications for these sectors and environmental policy (Wu et al., 2018; Yang X. et al., 2022). Given the origins of excessive pollution in recent years, greater emphasis has been placed on the interconnectedness of energy waste, energy transitions, and environmental sustainability. Both developed and emerging nations have robust technological capabilities and adhere to stringent environmental policies (Abbasi et al., 2022; Jahanger et al., 2023). Despite possessing a substantial ability to absorb environmental risks, the industrialized world continues to face challenges in regulating and mitigating the ongoing emissions. Developed and emerging nations alike have adopted rigorous environmental rules and are equipped with cutting-edge technologies, which confers upon them a considerable ability to assimilate environmental risks (Kaika and Zervas, 2013; Bashir et al., 2024). As a result, however, industrialized nations’ efforts to regulate and mitigate ongoing emissions continue to be hindered. In addition, Nathaniel and Iheonu (2019) used the augmented panel mean group (APMG) estimator to analyze the impact of REN on CO2 emissions in 19 sub-Saharan nations and concluded that this type of energy had a negligible effect on global emissions. Recent research has suggested that REN will not significantly reduce CO2 emissions until it reaches a certain level of development; at that point, the focus will shift from lowering the cost of energy transition to increasing energy efficiency.
First, REN sources are becoming increasingly popular as the global economy becomes more integrated. REN sources benefit from economic globalization because of the money and expertise they may get from around the world (Doytch and Narayan, 2016; Liu et al., 2016). Its secondary effects improve environmental quality (You and Lv, 2018). Through liberalized trade, for instance, developing countries can acquire items and technologies that are green and save energy from developed countries with established renewable energy companies (Koengkan and Fuinhas, 2020). Additionally, when nations work together to develop a robust market for REN, the price of switching to this energy source can be brought down significantly. Second, political globalization encourages nations to adopt policies that protect the environment and collaborate to reduce CO2 emissions output. In 2015, for instance, 196 UNFCCC parties adopted the Paris Agreement, which was proposed to deal with climate change. The Paris Accord laid up a system via which countries might receive aid in the form of both money and expertise (Jiang et al., 2021). Third, the societal norm of using REN and conserving the environment is being encouraged by cultural globalization, and because of the dissemination of information, the need to protect the environment is now recognized on every continent. As a result, the ability of REN to reduce CO2 emissions should increase as the world becomes more interconnected. Globalization may alter the nexus between REN and emission levels of CO2 emissions from OECD nations; however, this point is still up for debate.
Unlike previous research, which has used external variables like globalization to examine the link between REN and CO2 emissions, the current study takes into account endogenous factors like REN and CO2 emissions themselves (Adebayo and Acheampong, 2022; Nan et al., 2022). To determine whether the correlation between REN and CO2 emissions has shifted as a result of globalization, this article uses the PSTR model, with globalization as the transition variable. Since this is a nexus between REN and CO2 emissions, one of our goals is to investigate globalization’s part in this relationship. The aforementioned studies not only advance their respective fields of study but also give us a chance to dig deeper into the connection between REN and CO2 emissions. Our research is distinct from the aforementioned in that we aim to investigate the dynamic benefits of REN in reducing CO2 emissions when globalization levels shift.
3 Methodology
3.1 Data and variables
The data period covers 1970–2022 for a panel consisting of 55 developing and developed countries (Supplementary Appendix S1). The countries are spread across all continents. In this study, we examine these 55 countries based on the availability of the panel dataset. In East Asia (EAS), South Asian countries (SES), Europe and Central Asia (ECA), and the Middle East and North Africa (MENA), there are 25, 6, 35, and 18 countries listed, respectively, but we only examine 12, 4, 26, and 13 countries from these regions. Furthermore, all four continents have been categorized on the basis of developing and developed countries. In the EAS, SES, ECA, and MENA categories, there are 8, 4, 16, and 7 developing and 4, 10, and 6 developed countries, respectively. Continents of developing countries were analyzed for measuring the amount of green economic growth attributable to investments in economic growth, CO2 emissions, R&D, and REN. The results of an econometric estimating procedure were obtained using a two-stage GLM and RLS approach. This procedure reveals not only advantageous statistical influences but also the compositional and technical effects. In the domains of economic expansion and environmental degradation, both approaches provide significant advantages (Ilyas et al., 2024; Zhao et al., 2024). Panel datasets offer greater flexibility, resilience, and interpretability, as well as the ability to handle a broad spectrum of data distributions, including continuous data (Mohammad Husain et al., 2024; Van Poecke et al., 2024). Moreover, this facilitates comprehension of the connections between the predictors and the response variable. The RLS resistance to outliers is superior to ordinary least squares resistance and increases precision by reducing the impact of outliers (Dada and Al-Faryan, 2024; Kwilinski et al., 2024). Ultimately, it furnishes resilient, adaptable, and comprehensible instruments for shaping and enhancing the dependability and precision of statistical deductions (Meygoonpoury et al., 2024). The composition impact was found to be much more influential than the technical effect during the investigation (Yu et al., 2023). This study also examines the impact of the most potent prospective public spending channels on green economic growth in terms of REN. The results indicate that increased government expenditure on education will help human capital-reliant industries. Similarly, government investment in R&D can speed up technological advancement.
Data sources and definitions for the explanatory variables used in the analysis are listed in Supplementary Appendix S2; these are abbreviated in Table 1. There are three categories of factors to consider while discussing REN, GDP growth, and CO2 emissions: the first category conceptually depicts the connection between REN, CO2 emissions, and CMIC; the second category presents REN, CMIC, EPC, and GDPC; and the third category presents REN and IVA. Each of the three subgroups also provides additional evidence of its relationship with developing and developed nations throughout the various continents. Therefore, the pragmatic study draws on annual data from 55 developing and developed nations between 1970 and 2022. Primary energy equivalents from hydro (excluding pumped storage), solar, geothermal, tidal, and wave sources contribute to the total primary energy consumption (TPES) as part of REN. REN not only originates from renewable municipal waste but also includes bio-gasoline, bio-diesel, bio-fuels, bio-fuel liquid, biogases, and other related sources. Biomass, which comes from creatures that were once alive or have just died, is the source of bio-fuels. Waste from businesses, households, and government agencies is collected by municipal authorities. Therefore, it does not release CO2 emissions when created, and a higher value of REN is linked to advances in technology and large investments in infrastructure. Emissions of CO2 are produced when fossil fuels are burned or when cement is manufactured using a combination of solid, liquid, and gaseous fuels; these emissions are the result of flaring gas and gas fuels. The EPC measures the amount of energy produced locally plus the amount of energy imported and changed in stock minus the amount exported with fuel subsidies. As a percentage of GDP, manufacturing, construction, water, electricity, and gas all contribute to what is known as “industry value added” (IVA). The origin value is indicated by the International Standard Industrial Classification (ISIC), versions 3 and 4. GDP per capita (GDPC) is calculated as the domestic product divided by midyear population, and it reflects the degradation of natural resources. CO2 emissions from manufacturing industries and construction (CMIC) include emissions from manufacturing industries and those resulting from the combustion of fuel in these industries. Fossil fuel energy consumption comprises oil, natural gas, and petroleum products.
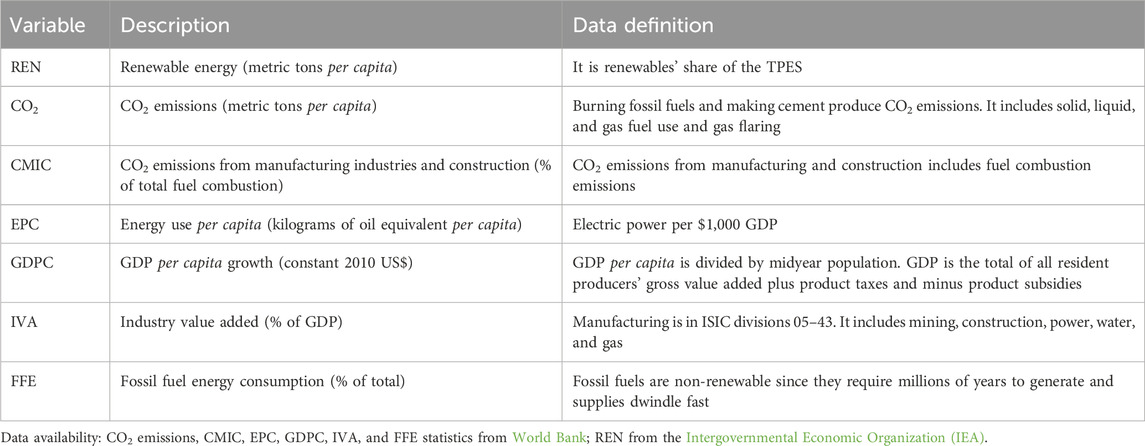
Table 1. Variable descriptions.
High manufacturing and export development have a detrimental impact on the environment due to the release of CO2 emissions, while CMIC and FFE affect the infrastructure of this mega project. At first, increasing incomes lead to higher CO2 emissions across all stages of economic development. However, analysis of panel causality data found that REN also has had a major impact on CO2 emissions, IVA, and GDPC but not created effects on CMIC. In the SES, CO2 emissions have significantly affected EPC, GDPC, and FFE, except for other variables; similarly, in ECA, CO2 emissions have affected EPC. We begin by testing all potential explanatory variables in a panel data set, using GLM if the data are non-stationary, and doing maximum likelihood estimation using a variety of different distributions (Khan, 2024). The QML estimators are reliable because they consistently estimate the conditional mean of the parameters. The so-called second-generation test relies on applying the panel unit root test independently to each variable, hence enabling serial correlation across cross-sections (Khan S. Z. R., 2021). Estimating the stationary of each explanatory variable is crucial for this reason. Various unit root tests, such as the IPS augmented test and Pesaran’s (2007) cross-sectional panel unit root test, confirm the validity of the data.
3.2 Specification of the model
The identification approach of panel data encompasses a broad and empirically useful range of specifications that include the Poisson model with a negative binomial. The data processes are stationary in the GLM. Therefore, the unit root test examines each variable and indicates the stationary level, which also ensures the reliability of the result, including, according to the first generation test, the unit root has been computed individually. Subsequently, we computed the robust estimation with the least squares. Similar conclusions were drawn by Ben Jebli et al. (2020); they used the GLM and RLS estimate methods and the Granger causality test for 102 different nations over the time period of 1990–2015 (Chen et al., 2019b). It was discovered that the three areas of China—each—had a unique effect on the CO2 emissions caused by REN. The central area of China was largely unaffected by the detrimental effects that REN had on the eastern and western regions of the country (Najmuddin et al., 2022). They speculated that the disparity could be attributed to a geological element in the environment. According Eq. 1 the GLM assumption imply that the first two moments of
where
The dispersion is restricted to 1, and prior weighting is not permitted. We follow the approach that includes, CO2 emissions, average annual energy use, GDP, and industry value CO2 emissions from manufacturing and building, as well as fossil fuel energy usage. These factors are detailed below.
where REN represents renewable energy and i = 1,., 53 and t = 1970,…., 2022 indicate the location and time period (Eq. 5). REN is calculated using data on per-capita energy use, industrial value added, GDP growth rate, manufacturing sectors, and fossil fuel usage. It specifies the nation αit as a fixed effect, with
Eq. 6 represents the second model for the robust least squares using M-estimation. If the scale
The REN is the same as that in Eq. 7 with “i” countries and “t” time period, with
4 Results
4.1 Descriptive statistics and unit root
Using linear panel estimate approaches, we analyzed data from developing and developed economies from 1970 to 2022 in order to examine the impact of renewable energy as a response variable on economic growth, energy consumption, and CO2 emissions across four continents, with each country’s renewable energy sector elaborated upon (Table 2). In relation to the value of the boxplot element examined in Figure 1, the median is represented by a 95% confidence interval with specified widths for upper and lower whiskers.
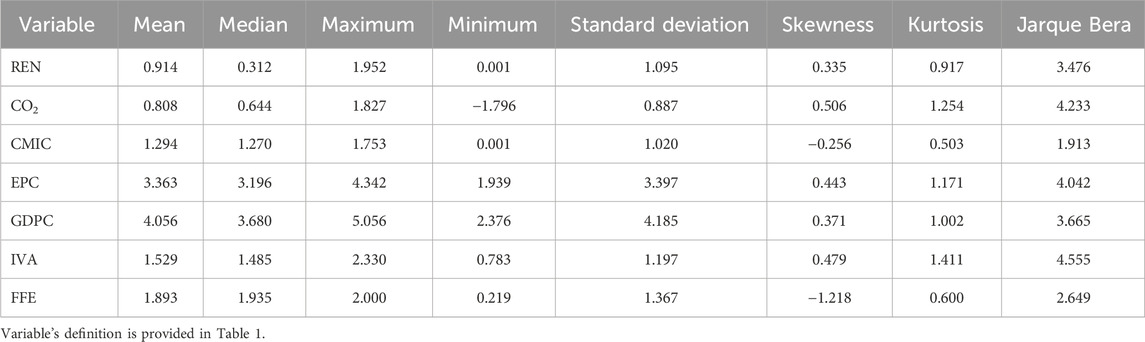
Table 2. Descriptive statistics.
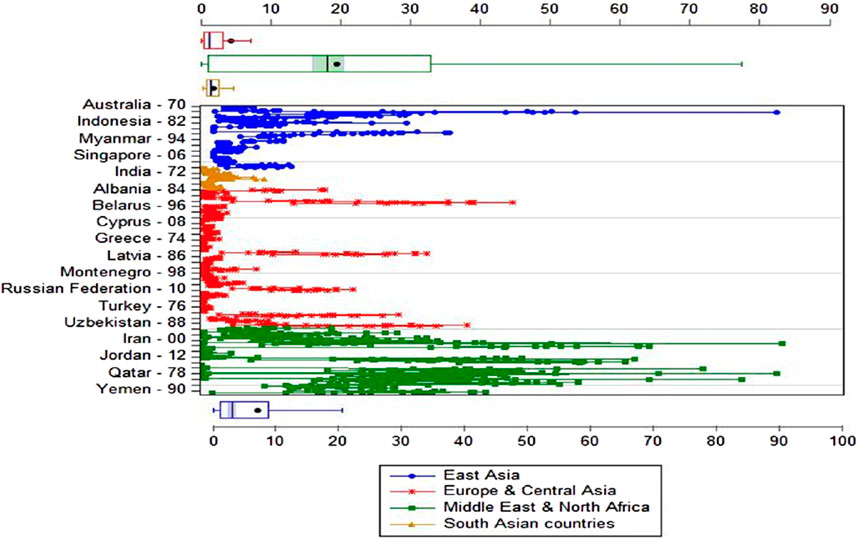
Figure 1. Continent distribution of countries. Sources: authors’ compiling by the continents (EAS, SES, ECA, and MENA).
All predictors with REN are integrated with the countries, as indicated by the fact that the lower whisker of REN shows the fewest outliers relative to FFE, EPC, and GDPC. The residual, actual, and fitted values of renewable energy and CO2 emissions are illustrated in Figure 2. The residual (blue line) results indicate a positive attitude if the actual percentage of renewable energy consumption in a developing country exceeds the fitted value predicted by the line for its factor impacting adoption in comparison to developed countries. This implies that developing countries, such as EAS, SES, and, more likely, MENA countries, have a higher percentage of renewable energy use than anticipated, as indicated by the identified factor. The MENA region will require an investment of over $200 billion in a substantial undertaking to support the region’s socio-economic development and develop REN, as dispersion in REN has been meticulously calculated. Second, if the fitted value is greater than the actual (red line) percentage, the residual indicates a negative attitude (Khan, 2023). This suggests that the developing countries have a lower percentage of renewable energy use than anticipated, as indicated by the factor. Third, the zero residual value indicates that a perfect fit would be achieved if the actual and fitted values were identical, resulting in a zero residual. Additionally, the fitted line is the light green line traced through the data points. This line is produced by the regression analysis and denotes the anticipated relationship between the independent and dependent variables in accordance with the selected model. In conclusion, the actual values demonstrate that, despite the absence of explicit individual values on the graph, the data points accurately represent the values of both the X and Y variables for each case study. The actual data point is represented by the position of each point (e.g., the specific factor value and corresponding percentage of renewable energy consumption of a developing and developed country) (Rabnawaz Khan and Kong, 2020).
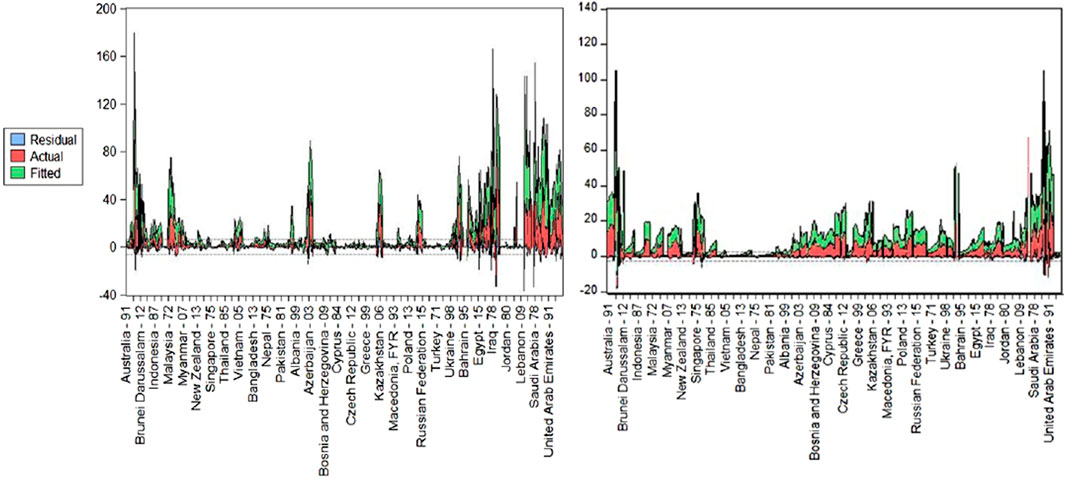
Figure 2. Renewable energy and CO2 emissions.
The LLC, IPS, ADF, PP, and Hadri panel unit root tests, as well as the individual and trend intercept tests, along with the stationary test rendering to cross-sectional in first-generation unit root tests with a common root, the primary variables IVA, per capita GDP (Constant 2010 US dollar), and CMIC, and the other explanatory variables—in for both level and first difference—in order to eliminate inconvenience, are included in Supplementary Appendix S3. Following this, the co-integration test developed by Pedroni and Kao was executed prior to the empirical evaluation of the GLM and RLS approaches (Supplementary Appendix S4). These methods have become mainstream dynamic approaches of relevant studies (Işık et al., 2022; Rehman et al., 2023; Rothenberg, 2023). It is imperative to consider the dynamic interrelation of variables when doing analyses on distinct individual variables. The initial variation of time is a crucial variable when examining Granger causality between variables. The changes in variables are also directly influenced by the lagging effects of the policy or historical data. Third, the nature of the interaction between variables varies in the long and short terms, necessitating dynamic calculations for both time periods.
The short-run coefficient is significant, suggesting that there will be a decline in the short run (Koengkan et al., 2023). This conclusion is drawn from the fact that the logarithm of the coefficient does not account for major order relationships or transepts. Furthermore, the variance decomposition illustrates the proportion of focus arrow variance that can be accounted for by a particular variable indicator over a five-year period in the short run and long run. The long-run influence of REN on itself diminishes further into future, while the influence of predictor variables increases over time. This indicates that predictor variables exhibit a strong endogenous influence on REN as time progresses, while REN exhibits a weak endogenous influence on itself (Rothenberg, 2023; Bashir et al., 2024). For instance, in the short run, REN alone accounts for 100% of the variance in the focus arrow during the first period.
The residual indication of REN in different countries by region is elucidated in Figures 3A, B. The null hypothesis cannot be rejected in the level case, with the exception of CO2 emissions, IVA, and GDPC. Energy intensity, CO2 emission intensity, and renewable energy utilization are some of the important variables that are investigated in the study. There can be substantial cross-national and temporal variation in the operationalization, or the process of defining and measuring, of these variables (Shah et al., 2022). As an illustration, one way to quantify energy intensity may be by comparing energy use per capita in different countries or per unit of GDPC. It is also possible to use alternative metrics to measure the intensity of CO2 emissions and the utilization of renewable energy sources (Borelli et al., 2023).
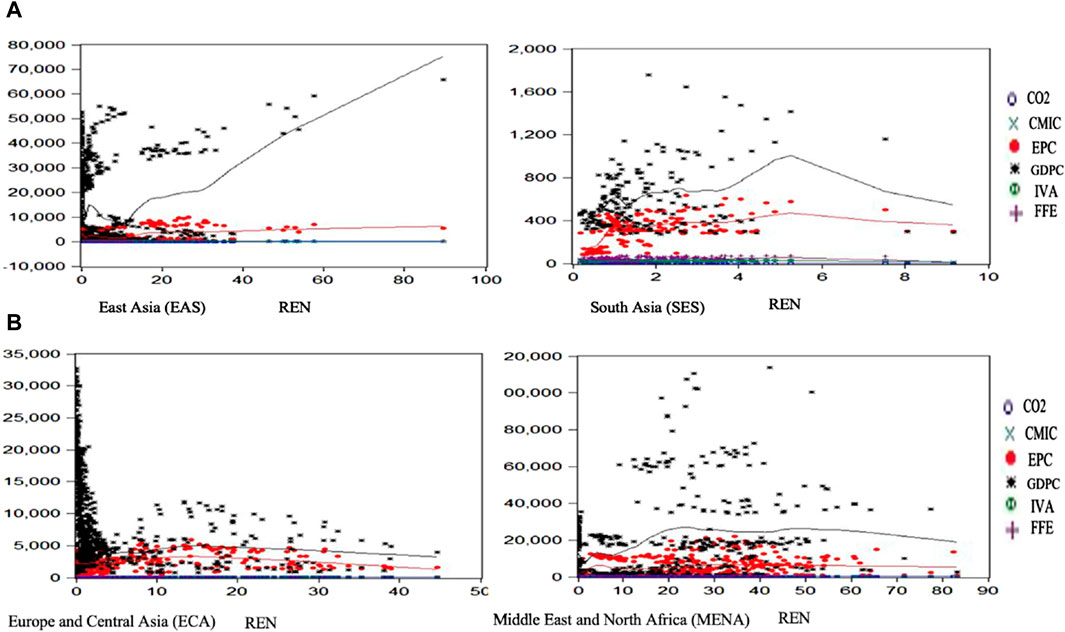
Figure 3. (A) Individual regression in East and South Asia. (B) Individual regression in Central Europe and the Middle East.
Afterward, we computed the GLM with Poisson quasi-likelihood, followed by the Wald test; the value was assessed using a negative binomial (k) with a family parameter; and panel least squares (PLS) regression was then performed before conducting the empirical valuation of RLS estimations.
4.2 Analysis of panel regression
A notable aspect of this study is the examination of the dynamic connections between REN, CO2 emissions, energy consumption, economic expansion, the industrial revolution, fossil fuel energy consumption, and energy consumption per capita. Accordingly, in applied economics, it is important to distinguish between static and unrealistic approaches: the line between dynamic and statistics is not a division between realism and abstraction but rather a distinction that appears in economic history as a realistic field of study. Therefore, this distinction should be acknowledged as a form of confirmation. The concept of equilibriumis fundamental in static and dynamic. While statistical equilibrium is fundamental, in dynamic contexts, equilibrium can be unstable if not handled carefully, potentially leading to significant changes in equilibrium levels.
Since the static model’s endogenous explanatory variables do not include any information about the variables’ historical values and the error term is serially and mutually independent, a dynamic model in the form of lagged endogenous variables and serially correlated errors must be constructed. As a result, GLM and RLS estimations include the lag of dependent variables as explanatory variables in the regression equation, indicating the dynamic link and permitting the construction of a dynamic model for the endogenous variables. These strategies are now commonly used in the dynamic techniques of many related investigations. It is critical to consider the dynamic relationship between variables while conducting independent analyses. Investigating the mean-variance relationship requires careful consideration of the first-time variation. Second, the lagged impacts of the policy or historical information have a direct impact on changes in variables. The dynamic lagging should be considered when analyzing developing countries as they are founded on the economic basis of the past and the process achieved by an economic corridor. As for the third, RLS necessitates M, S, and MM estimates in various locations because of dissimilarity in the relationship between variables.
4.3 Covariance of the generalized linear model
Table 3 shows the covariance computed by QML z-statistics in negative binominal log-likelihood with ordinary, Huber–White, and HAC (Newley–West) for different regions. We use a Poisson regression to determine the values that the dependent variable should take. The z-statistics of the coefficient are significantly positive, including overdispersion in the residuals of individuals. The presence of overdispersion is k = 0.536 in EAS, 0.047 in South Asia, 0.819 in ECA Central, and 0.0001 in the MENA.
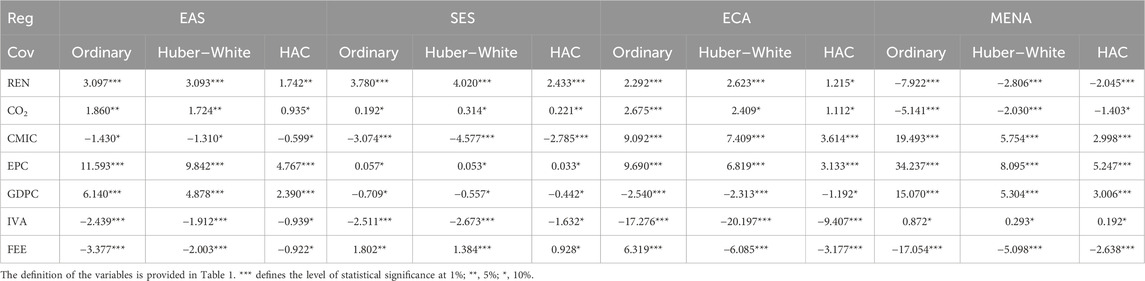
Table 3. Covariance by the generalized linear model.
4.4 Estimation by robust regression
Figures 4A, B indicate the robust regression by M-estimation, S-estimation, and MM-estimation, which employ the REN of the panel dataset with explanatory variables. Before the estimation of robust regression, the ordinary least squares were computed in the work file and confirmed findings using diagnostic influence statistics to examine leverages for the second model. The bisquare function with a default tuning parameter value of 4.685 was utilized in each estimation performed using the median absolute deviation approach, and z-statistics were calculated using the estimated covariance matrix from the Huber distribution. The impact of switching from least squares to M-estimation on the estimated coefficients is significant (Table 4).
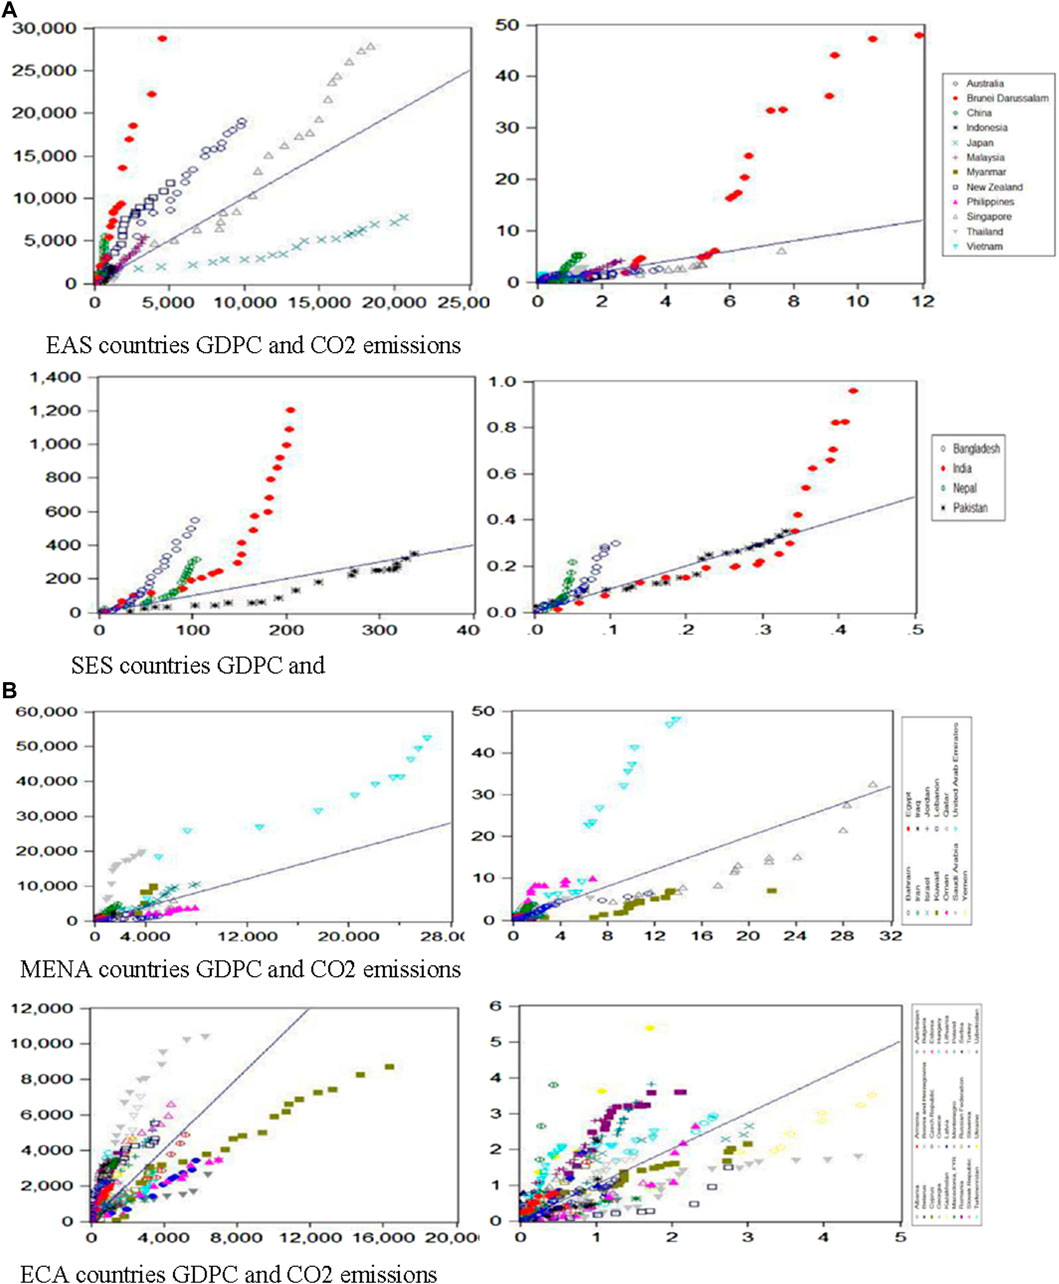
Figure 4. A) East and South Asia of GDPC and CO2 emissions. (B) Europe and Central Asia’s GDPC and CO2 emissions.
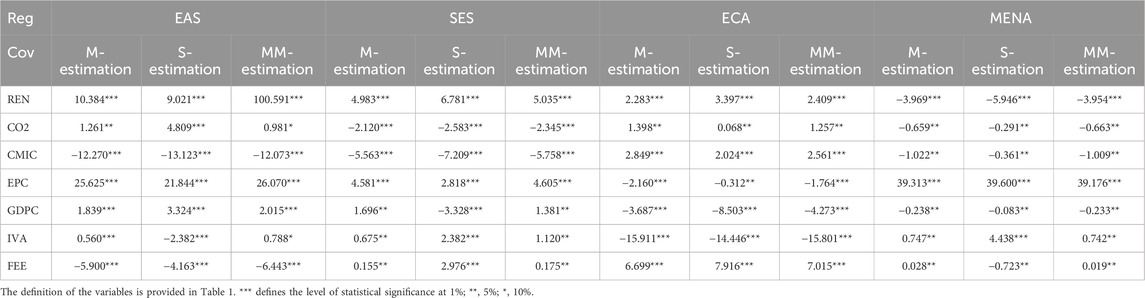
Table 4. Estimation by robust regression.
In the EAS, the results of robust estimates show statistically more CO2 emissions, IVA, CMIC, and FFE on REN than those of ordinary panel least squares and strongly reject the null hypothesis, where the robust estimation indicated a lower coefficient value compared to least squares. Consequently, Eq. 7 suggests the observation of high leverage for the relationship between them, and EPC and GDPC do not show any change in robust estimation. Furthermore, R2 (24.65), R2 (81.26) adjusted, and goodness-of-fit measures indicate that the model explains approximately 60%–90% of the variation in the constant-only model. Likewise, in the SES, CO2 emissions, EPC, and IVA strongly reject the null hypothesis, suggesting a high-leverage relationship among them. GDPC, CMIC, and FFE did not reject null hypotheses. In ECA central CO2 emissions, IVA and FFE on REN strongly reject the null hypothesis, where the robust estimation indicated a lower value relative to panel least squares. CMIC has not rejected the null hypothesis, and EPC and GDPC showed no effect in robust estimation. In the MENA, the results of robust estimates show a statistically negative impact of CMIC and FFE on REN compared to ordinary least squares, strongly rejecting the null hypothesis. This suggests a high leverage in the observed relationship between REN, CMIC, and FFE. The least squares of CO2 emissions and IVA indicate that the null hypothesis is not rejected, and EPC and GDPC do not show any change in robust estimation. The results across countries or over time can be difficult to compare due to these inconsistencies. While one nation may appear to have a lower energy intensity than another depending on the meter it uses, in reality (Yu et al., 2022), it may be consuming more energy overall. In order to make more accurate comparisons, researchers in the future should focus on standardizing data or use methods to account for possible measurement differences (Hao et al., 2022). Furthermore, the M-estimation reported a 4.684 turning parameter, and the result from M-estimation and MM-estimation are generally quite similar in all region robust estimations.
Table 5 provides the values of correlation of coefficient “r” measured by likewise deletion with an ordinary method, indicating the strength and direction of the linear relationship between variables in different regions. In addition, a correlation coefficient of 0.138 indicates a weak uphill (positive) linear relationship between CO2 emissions to REN in ECA central, while a correlation coefficient of 0.442 suggests a moderate uphill positive relationship in EAS. Similarly, the highest positive uphill linear relationship is observed between EPC and CO2 emissions, with an r-value of 0.922 in ECA. In addition, the correlation between economic growth and CO2 emissions is statistically significant in this study. In order to achieve robust economic growth, industrial expansion is crucial. Concurrently, one of the main causes of environmental degradation is unplanned industrialization. The results from this study are consistent with those from You et al. (2024). The goal of REN is to help achieve environmental sustainability by reducing ecological damage. Therefore, improving environmental conditions is an outcome of investing in REN. Consistent with our findings, previous research has shown a negative correlation between REN and CO2 emissions (Perone, 2024; Yadav et al., 2024).
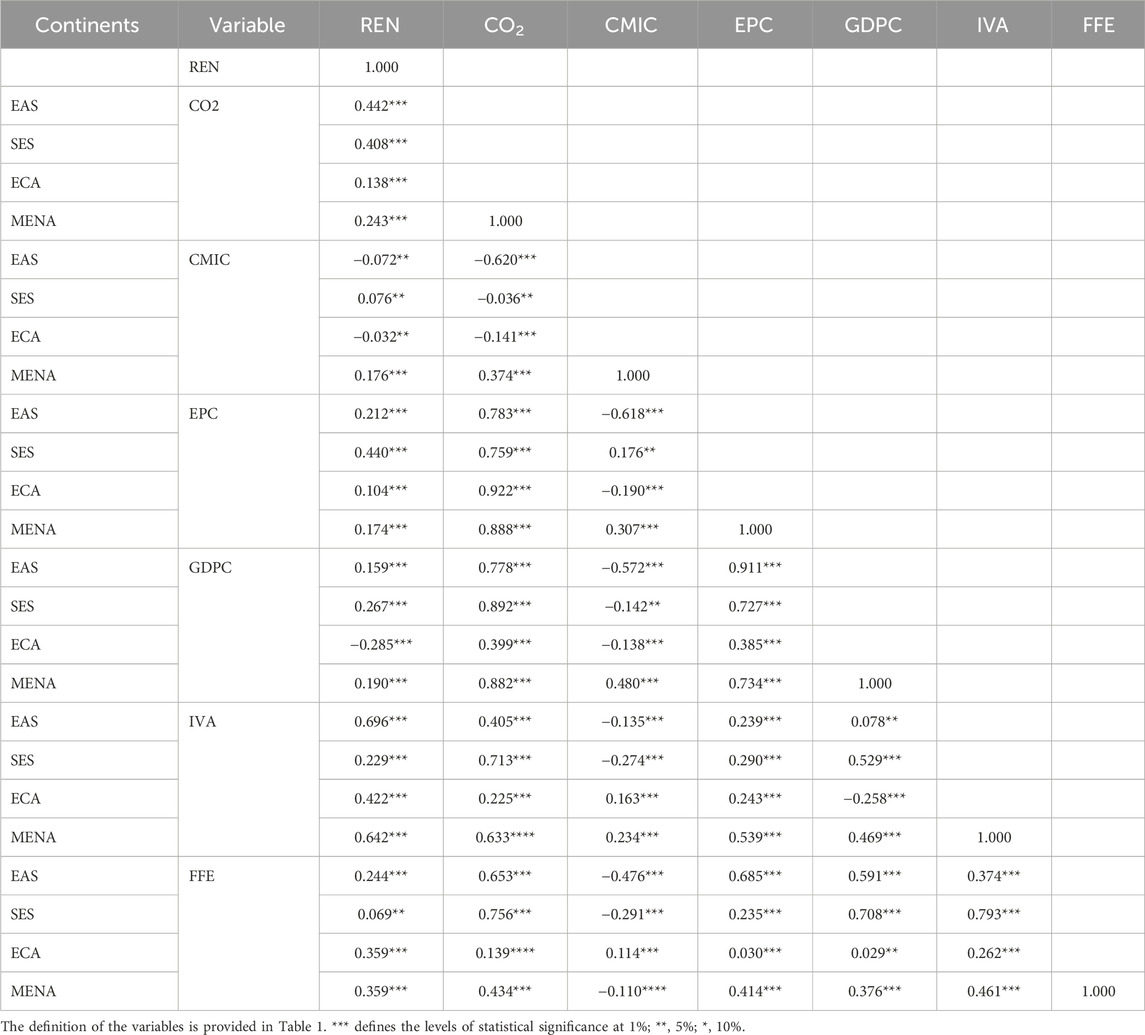
Table 5. Correlation of continents.
5 Discussion
(Figures 4A, B) There was a positive benefit in a high economic growth regime but a negative effect on CO2 emissions for all EAS countries except Australia, Japan, and New Zealand. Using a panel autoregressive distributed lag (PARDL) model (Koengkan and Fuinhas, 2020; Khan, 2022; Khan et al., 2022c; Khan, 2023), researchers analyzed the impact of switching to REN on CO2 emissions in LAC nations (Shahbaz et al., 2018), which is suitable for analyzing alterations in parameters over time. In order to better understand these energy challenges, this research employs the GLM and RLS model. For example, Aydin and Cetintas (2022) observed that when using REN as the transition variable, there is an inverted US-shaped link between economic progress and environmental degradation. Chiu and Lee (2020); Rabnawaz Khan and Kong (2020); Khan S. Z. R. (2021); Aydin and Cetintas (2022) used a number of transition variables to examine the impact of country risks on the energy-finance nexus. Both the short- and long-term analyses revealed that transitioning to REN decreased CO2 emissions. Bilgili et al. (2016) drew their conclusions from studies conducted in 17 OECD countries and found that CO2 emissions were reduced while economic growth was increased because of the use of REN.
Furthermore, developing countries are expected to be the source of climate catastrophe in Asia in the coming decades (Yu et al., 2023). However, their weak infrastructure and lack of resources will make it difficult for them to adapt to and sustain economic growth in the face of a changing climate. This is evidenced by Singapore’s high economic growth with relatively low CO2 emissions and Brunei’s emissions being above the median line. On the other hand, a developing nation that is short on grid infrastructure and in need of investment in smaller, distributed renewable energy solutions would not benefit from the same program (Ali et al., 2023). To encourage renewable energy and decrease CO2 emissions, it is essential to understand these intricacies and craft successful policies. Due to their distinct situations and problems, industrialized and developing nations call for distinct strategies (Wolde-Rufael and Weldemeskel, 2020; Raihan et al., 2022). Extensive studies in the economies of Brazil, Russia, India, Indonesia, China, Turkey, and South Africa (BRIICS) revealed that REN helps improve environmental quality (Khan, 2023; Li et al., 2024). They all agreed that increasing the use of REN sources and addressing problems with energy demand should be at the forefront of any environmentally friendly industrial plan. Despite the strong will behind transitioning to renewable energy and reaching net-zero emissions, there are still substantial legislative hurdles to overcome, especially when contrasting the realities of developed and developing countries. Public support and political will for ambitious climate policies are two factors that can be challenging to translate into action in developing nations, even if environmental issues are likely to be high on the public agenda (Abbasi et al., 2021). Rigid environmental restrictions can be thwarted by powerful lobbying efforts by special interests in the fossil fuel sector. The second part is financial factors; political and public opposition may arise from the perceived short-term economic costs of abandoning the fossil fuel infrastructure that has been in place for a long time (Saba, 2023). In order to achieve both short-term economic success and longer-term environmental sustainability, thoughtful policymaking is required. In the case of developed countries, reducing poverty and boosting the economy are typically seen as two opposing goals. There may be competition for scarce government resources and attention from environmental concerns, even as they are gaining recognition (AlNemer et al., 2023). Second, funding, technical knowledge, and physical infrastructure in poor nations may be insufficient to establish and uphold thorough environmental regulations. Because of this, it may be difficult to implement and sustain renewable energy solutions (Perone, 2024). However, these policy problems can be addressed through international cooperation. Financial aid from developed nations can encourage developing nations to engage in renewable energy infrastructure, scientific research, and capacity-building programs. Innovations in renewable energy technology can be shared to hasten its implementation in underdeveloped nations (Yadav et al., 2024).
Many studies have examined the environmental impact of REN, but their findings have been inconsistent. In general, two themes emerge from the empirical data (Sung et al., 2018). The first group of studies shows that decreasing CO2 emissions and boosting the use of REN sources help the environment. The increasing use of REN sources has a negative impact on the environment, consumes valuable green space, and exacerbates pollution, all of which make it harder to cut down on CO2 emissions. (Tran et al., 2022) As a result, it is important to discuss the impact that REN has on CO2 emissions. The second line of thought proposed that there was no real impact of REN on the environment, and some academics offered proof for this claim. Dong et al. (2020) suggested that countries with lower per capita income did not benefit from the CO2 emission reduction benefits of REN. In contrast, reduction impacts are sizable in both nations with low and high per capita income. They said that countries with greater incomes already have the capital to invest, state-of-the-art scientific knowledge, and the required infrastructure to reduce CO2 emissions (Algieri et al., 2022). We have discussed the intricacies and difficulties in relation to renewable energy and CO2 emissions. First, from a socioeconomic perspective, emerging nations have the necessary infrastructure in place and access to larger sums of money to invest in renewable energy. Integration with the grid and efficiency gains can be their primary goals (Elstad, 2022). Renewable energy sources, such as solar and wind power, may be plentiful in developing nations despite their lack of investment and energy infrastructure (Ali et al., 2023). The provision of initial financial support and the construction of new infrastructure may be their top goals. Second, developed nations have set clean energy targets or carbon pricing mechanisms to encourage the use of renewable energy sources. In terms of environmental policy enforcement, poor nations either do not have the necessary resources or have less robust regulatory frameworks (Kartal et al., 2023). Third, when it comes to energy infrastructure, industrialized nations have advanced grids that can accommodate renewable power generation on a massive scale (Ali et al., 2023; László, 2023). Renewable energy integration is more difficult in developing countries due to low-quality infrastructures or high reliance on energy sources derived from fossil fuels. Fourth, policies that work in rich nations with well-developed infrastructure and carbon pricing may not have the same impact in poor nations with fewer resources (Jahanger et al., 2023). An industrialized nation with a robust infrastructure might benefit from a program that encourages large-scale solar installations through feed-in tariffs.
Additionally, the United Arab Emirates and Qatar (countries with the second-highest ecological footprint globally) are contributing to increasing CO2 emissions in the MENA region; Romania’s fossil fuel combustion decreased by 14.6% in 2012; in Turkmenistan, CO2 emissions increased from 19 million to 100 million, at an annual rate of 10%–20% from 1997 to 2016; and CO2 emissions in Hungary and Ukraine are decreasing slightly. Using the generalized spatial two-stage least squares (GS2SLS) method, Radmehr et al. (2021) investigated the immediate triggers of the CO2 emission increase during 1995–2014 in the context of ECA. They identified a unidirectional causal relationship between REN and CO2 emissions, recommending that CO2 mitigation techniques should be included in investment plans for REN. Furthermore, the results showed a weak negative correlation, which may be because educational opportunities are underfunded despite the fact that they would improve both technological competence and environmental literacy (Barnea et al., 2022). One competing theory holds that the high levels of CO₂ emissions seen in both developing and wealthy nations show that the investments made in the human sector through industrialization so far are not enough to significantly reduce these emissions (Bergougui, 2024). Further environmental harm is increased by using non-REN sources. Energy sources that cannot be replenished increase opportunities for business, transportation, agriculture, and job creation. In response to increasing CO2 emissions, the demand for alternative REN sources has surged in the last several decades (AlNouss et al., 2022).
The contribution of CO2 emissions, EPC, IVA, GDPC, CMIC, and FFE is largely exogenous, implying that regions are subject to varying influences. CMIC and FFE exert a considerable influence on predictor factors on the EAS and MENA continents but a limited influence on the prediction of REN on the SES and ECA continents. In addition, a predator exhibits a strong endogenous influence on REN removal in the future, whereas REN demonstrates a weak endogenous influence on itself (Chiu and Chang, 2009). The effect of reducing CO2 emissions would not be visible until the share of REN supply in total energy supply for the 20 OECD countries reached 8.39 percent between 1996 and 2005, according to one analysis. Attempts to demonstrate a causal relationship between REN and CO2 emissions have yielded varied results, which may be related to a number of factors. When analyzing the relationship between REN and CO2 emissions, it is critical to remember that globalization may have a significant effect. The numerous environmental benefits of globalization include the promotion of renewable energy sources and the decrease of pollution. Global environmental policy differs greatly between developed and developing countries (Kwilinski et al., 2024). Harsher environmental laws are typically implemented by developed nations in response to public pressure and harsher legislation. Investments in clean technology, emission reduction goals, and carbon pricing schemes are all examples of what could fall into this category (Grodzicki and Jankiewicz, 2022). Policy changes like these, however, are not always cheap or simple to implement. However, reducing poverty and boosting economic growth are frequently the top priorities of developing nations (AlNemer et al., 2023). Despite growing awareness of environmental issues, comprehensive environmental policies may be challenging to establish and uphold due to a lack of funding and other competing demands (Perone, 2024). In order to help developing nations build strong environmental rules and implement sustainable development practices, developed countries can provide financial aid and work together internationally to close this gap.
6 Conclusion and policy implication
The goal of this study is to investigate the nexus between renewable energy consumption and CO2 emissions and economic growth by using a panel estimate approach in developing and developed countries over the period 1970–2022. Our strong motivation is to fill the gap related to the absence of studies discussing this subject in developing and developed countries. Developing and developed countries are an exact representative example of a continent’s economic corporation, and it is a plan based around two cores with low to high income. Analysis of the data shows a correlation between CO2 consumption, renewable energy, manufacturing industries, construction value added, and GDP per capita, as well as regional growth and cooperation potential for energy consumption among countries. The major findings can be summarized as follows: there is a feedback relationship between economic growth and renewable energy consumption in the case of whole, developing, and developed countries. The countries on the same continent tend to behave differently in terms of their economic contributions; hence, policy recommendations for energy are broken down by region. Positive and rapid economic growth was seen in East Asian countries, and a correlation was found between GDP per capita, industry value added, and renewable energy.
The primary suggestions emerging from our study can be introduced as follows. First, the emergence of a feedback relationship between the renewable energy category and income explains the strong association between them. Inside the groups of countries analyzed, the mentioned association proposes energy strategies intended to expand the utilization of renewable energy, producing a positive effect on output. Policymakers should encourage renewable energy projects to beat the limitations on nonrenewable energy consumption and ameliorate economic growth. Second, we discover a bi-directional causality between trade and economic growth. It implies that trade plays a vital role in enhancing the growth of developing and developed countries. It involves that policy that accelerates economic growth will prompt the trade. In addition, it implies that policymakers should prompt trade to facilitate the creation of a competitive advantage, accelerate the transfer of technical knowledge, and attract foreign direct investment. Third, we show a feedback connection between trade and renewable energy consumption. This implies that trade openness needs to outlay more renewable energy consumption. In addition, it involves that renewable energy helps the integration of developing and developed countries in international trade. Openness is an important vehicle serving the transfer of renewable energy technology. Policymakers ought to take distinctive measures to develop the renewable energy division, for example, giving fiscal incentives for renewable energy and promoting investing in renewable energy projects. Energy preferences can also be influenced by societal norms on sustainability and the severity of environmental laws in a given nation. Another disclaimer is that “spillover effects”—the phenomenon whereby a change in energy policy or technology in one country influences the energy dynamics in neighboring countries—may have been disregarded in the study. Furthermore, recent technological developments—adoption of renewable energy sources and energy intensity could be profoundly affected by innovations in energy efficiency and battery storage. Energy usage and emissions can be influenced by policy interventions such as carbon pricing schemes or subsidies for renewable energy. Furthermore, the degree of government bureaucracy and the rigor of environmental rules are examples of institutional factors that could influence energy consumption decisions. Public sentiments toward sustainability and energy conservation are examples of socio-cultural factors that can impact energy usage habits. In addition, policymakers may be able to gain a deeper understanding of the topic and make more comprehensive changes to relevant policies in the future if they analyze the link between the empirical study and a theoretical framework.
The implications of these results for policies and initiatives aimed at accomplishing a transition to renewable energy and net-zero emissions are substantial. Our research emphasized that by addressing income inequality via income redistribution, there would be a substantial increase in the utilization of renewable energy sources, accompanied by a reduction in energy intensity and nonrenewable energy consumption. According to the results of the study, the introduction of feed-in tariffs, the lowering of barriers, and the provision of financial aid are all examples of financial incentives that are necessary for the implementation of renewable energy sources. The economy may reduce its impact on the environment by using less fossil fuels. We must support environmentally conscious businesses, encourage the usage of green bonds, and set standards for environmentally conscious responsible financial operations. Planning for sustainable urban environments, including walkability, compactness, and energy efficiency, must be a top priority.
Despite providing a moderate empirical contribution to policy concerns regarding the attainment of energy transition and net zero, this study is not without its constraints. We utilized a global sample of 55 nations for our research. Although utilizing a sizable sample size enhances the validity of generalizations and conclusions, it is likely that the policy recommendations it generates do not pertain to specific countries. This constraint enables further research endeavors to examine the correlation between renewable energy, economic growth, energy consumption, and the interplay of CO2 emissions in industrialized and developing countries through the implementation of country-specific analytical methodologies. This would substantially aid policymakers in comprehending the political and economic obstacles that impede the attainment of carbon neutrality and energy transition by 2050. However, our research has policy implications that could potentially inform worldwide energy transition and net-zero strategies.
Data availability statement
The original contributions presented in the study are included in the article/Supplementary Material, further inquiries can be directed to the corresponding authors.
Author contributions
WJ: conceptualization, software, and writing–review and editing. KR: conceptualization, formal analysis, methodology, project administration, resources, software, supervision, validation, visualization, writing–original draft, and writing–review and editing.
Funding
The author(s) declares that financial support was received for the research, authorship, and/or publication of this article. This study was funded by the National Social Science Foundation of China (22BGL007) and the Fujian University of Technology Launch Project Research on the Impact of Low Carbon Strategies on the Rural Revitalization Strategy in Fujian Province (GY-S20014).
Acknowledgments
The author is receptive to wise counsel and grateful to his teachers for all of the support and instruction they have provided. The author has a lot of respect for Fujian University of Technology and the wonderful educational possibilities it provides. The encouragement of his family and friends has been invaluable as he works toward his goal of completing his doctoral degree. The author recognizes the worth of a kid with a disability who is willing to put their emotions aside in the pursuit of academic excellence. The author believes that love is the forces that sustains him up and gives him the energy to keep going.
Conflict of interest
The author declares that the research was conducted in the absence of any commercial or financial relationships that could be construed as a potential conflict of interest.
Publisher’s note
All claims expressed in this article are solely those of the authors and do not necessarily represent those of their affiliated organizations, or those of the publisher, the editors, and the reviewers. Any product that may be evaluated in this article, or claim that may be made by its manufacturer, is not guaranteed or endorsed by the publisher.
References
Abbasi, K. R., Adedoyin, F. F., Abbas, J., and Hussain, K. (2021). The impact of energy depletion and renewable energy on CO2 emissions in Thailand: fresh evidence from the novel dynamic ARDL simulation. Renew. Energy 180, 1439–1450. doi:10.1016/j.renene.2021.08.078
Abbasi, K. R., Shahbaz, M., Zhang, J., Irfan, M., and Alvarado, R. (2022). Analyze the environmental sustainability factors of China: the role of fossil fuel energy and renewable energy. Renew. Energy 187, 390–402. doi:10.1016/j.renene.2022.01.066
Adebayo, T. S., and Acheampong, A. O. (2022). Modelling the globalization-CO2 emission nexus in Australia: evidence from quantile-on-quantile approach. Environ. Sci. Pollut. Res. 29 (7), 9867–9882. doi:10.1007/s11356-021-16368-y
Adu, D., Jianguo, D., Darko, R. O., Baffour G., E., and Asomani, S. N. (2023). Overcoming CO2 emission from energy generation by renewable hydropower – the role of pump as turbine. Energy Rep. 9, 114–118. doi:10.1016/j.egyr.2023.09.155
Alam, M. B., and Hossain, M. S. (2024). Investigating the connections between China’s economic growth, use of renewable energy, and research and development concerning CO2 emissions: an ARDL Bound Test Approach. Technol. Forecast. Soc. Change 201, 123220. doi:10.1016/j.techfore.2024.123220
Algieri, B., Füg, O., and Lombardo, R. (2022). The Italian Journey: carbon dioxide emissions, the role of tourism and other economic and climate drivers. J. Clean. Prod. 375, 134144. doi:10.1016/j.jclepro.2022.134144
Ali, B., Hedayati-Dezfooli, M., and Gamil, A. (2023). Sustainability assessment of alternative energy power generation pathways through the development of impact indicators for water, land, GHG emissions, and cost. Renew. Sustain. Energy Rev. 171, 113030. doi:10.1016/j.rser.2022.113030
AlNemer, H. A., Hkiri, B., and Tissaoui, K. (2023). Dynamic impact of renewable and non-renewable energy consumption on CO2 emission and economic growth in Saudi Arabia: fresh evidence from wavelet coherence analysis. Renew. Energy 209, 340–356. doi:10.1016/j.renene.2023.03.084
AlNouss, A., Shahbaz, M., Mckay, G., and Al-Ansari, T. (2022). Bio-methanol production from palm wastes steam gasification with application of CaO for CO2 capture: techno-economic-environmental analysis. J. Clean. Prod. 341, 130849. doi:10.1016/j.jclepro.2022.130849
Alvarado, R., Murshed, M., Cifuentes-Faura, J., Işık, C., Razib Hossain, M., and Tillaguango, B. (2023). Nexuses between rent of natural resources, economic complexity, and technological innovation: the roles of GDP, human capital and civil liberties. Resour. Policy 85, 103637. doi:10.1016/j.resourpol.2023.103637
Anwar, M. A., Nasreen, S., and Tiwari, A. K. (2021). Forestation, renewable energy and environmental quality: empirical evidence from Belt and Road Initiative economies. J. Environ. Manage. 291, 112684. doi:10.1016/j.jenvman.2021.112684
Apergis, N., Payne, J. E., Menyah, K., and Wolde-Rufael, Y. (2010). On the causal dynamics between emissions, nuclear energy, renewable energy, and economic growth. Ecol. Econ. 69 (11), 2255–2260. doi:10.1016/j.ecolecon.2010.06.014
Awan, A., Abbasi, K. R., Rej, S., Bandyopadhyay, A., and Lv, K. (2022). The impact of renewable energy, internet use and foreign direct investment on carbon dioxide emissions: a method of moments quantile analysis. Renew. Energy 189, 454–466. doi:10.1016/j.renene.2022.03.017
Aydin, C., and Cetintas, Y. (2022). Does the level of renewable energy matter in the effect of economic growth on environmental pollution? New evidence from PSTR analysis. Environ. Sci. Pollut. Res. 29 (54), 81624–81635. doi:10.1007/s11356-022-21516-z
Baajike, F. B., Oteng-Abayie, E. F., Dramani, J. B., and Amanor, K. (2024). Effects of trade liberalization on the global decoupling and decomposition of CO2 emissions from economic growth. Heliyon 10 (1), e23470. doi:10.1016/j.heliyon.2023.e23470
Balsalobre-Lorente, D., Driha, O. M., Leitão, N. C., and Murshed, M. (2021). The carbon dioxide neutralizing effect of energy innovation on international tourism in EU-5 countries under the prism of the EKC hypothesis. J. Environ. Manage. 298, 113513. doi:10.1016/j.jenvman.2021.113513
Barnea, G., Hagemann, C., and Wurster, S. (2022). Policy instruments matter: support schemes for renewable energy capacity in worldwide comparison. Energy Policy 168, 113093. doi:10.1016/j.enpol.2022.113093
Bashir, M. F., Shahbaz, M., Ma, B., and Alam, K. (2024). Evaluating the roles of energy innovation, fossil fuel costs and environmental compliance towards energy transition in advanced industrial economies. J. Environ. Manage. 351, 119709. doi:10.1016/j.jenvman.2023.119709
Bekhet, H. A., and Othman, N. S. (2018). The role of renewable energy to validate dynamic interaction between CO2 emissions and GDP toward sustainable development in Malaysia. Energy Econ. 72, 47–61. doi:10.1016/j.eneco.2018.03.028
Ben Jebli, M., Farhani, S., and Guesmi, K. (2020). Renewable energy, CO2 emissions and value added: empirical evidence from countries with different income levels. Struct. Chang. Econ. Dyn. 53, 402–410. doi:10.1016/j.strueco.2019.12.009
Bergougui, B. (2024). Moving toward environmental mitigation in Algeria: asymmetric impact of fossil fuel energy, renewable energy and technological innovation on CO2 emissions. Energy Strateg. Rev. 51, 101281. doi:10.1016/j.esr.2023.101281
Beyene, S. D. (2022). Human activities and environmental quality: evidence beyond the conventional EKC hypothesis. Heliyon 8, e10756. doi:10.1016/j.heliyon.2022.e10756
Bilgili, F., Koçak, E., and Bulut, Ü. (2016). The dynamic impact of renewable energy consumption on CO2 emissions: a revisited Environmental Kuznets Curve approach. Renew. Sustain. Energy Rev. 54, 838–845. doi:10.1016/j.rser.2015.10.080
Borelli, D., Devia, F., Schenone, C., Silenzi, F., Sollai, F., and Tagliafico, L. A. (2023). Assessing environmental benefits of the transition from standard fossil fuels to liquefied natural gas: the Sardinia Region case study. Energy sustain. Dev. 73, 205–217. doi:10.1016/j.esd.2023.01.008
Bradley, P. (2021). An institutional economics framework to explore sustainable production and consumption. Sustain. Prod. Consum. 27, 1317–1339. doi:10.1016/j.spc.2021.02.035
Chang, C.-P., Dong, M., Sui, B., and Chu, Y. (2019). Driving forces of global carbon emissions: from time- and spatial-dynamic perspectives. Econ. Model. 77, 70–80. doi:10.1016/j.econmod.2019.01.021
Chang, T., Hsu, C.-M., Chen, S.-T., Wang, M.-C., and Wu, C.-F. (2023). Revisiting economic growth and CO2 emissions nexus in Taiwan using a mixed-frequency VAR model. Econ. Anal. Policy 79, 319–342. doi:10.1016/j.eap.2023.05.022
Chen, C., Pinar, M., and Stengos, T. (2022). Renewable energy and CO2 emissions: new evidence with the panel threshold model. Renew. Energy 194, 117–128. doi:10.1016/j.renene.2022.05.095
Chen, J., Xian, Q., Zhou, J., and Li, D. (2020). Impact of income inequality on CO2 emissions in G20 countries. J. Environ. Manage. 271, 110987. doi:10.1016/j.jenvman.2020.110987
Chen, Y., Wang, Z., and Zhong, Z. (2019a). CO2 emissions, economic growth, renewable and non-renewable energy production and foreign trade in China. Renew. Energy 131, 208–216. doi:10.1016/j.renene.2018.07.047
Chen, Y., Zhao, J., Lai, Z., Wang, Z., and Xia, H. (2019b). Exploring the effects of economic growth, and renewable and non-renewable energy consumption on China’s CO2 emissions: evidence from a regional panel analysis. Renew. Energy 140, 341–353. doi:10.1016/j.renene.2019.03.058
Chiu, C.-L., and Chang, T.-H. (2009). What proportion of renewable energy supplies is needed to initially mitigate CO2 emissions in OECD member countries? Renew. Sustain. Energy Rev. 13 (6), 1669–1674. doi:10.1016/j.rser.2008.09.026
Chiu, Y.-B., and Lee, C.-C. (2020). Effects of financial development on energy consumption: the role of country risks. Energy Econ. 90, 104833. doi:10.1016/j.eneco.2020.104833
Cui, Y., Khan, S. U., Deng, Y., and Zhao, M. (2022). Spatiotemporal heterogeneity, convergence and its impact factors: perspective of carbon emission intensity and carbon emission per capita considering carbon sink effect. Environ. Impact Assess. Rev. 92, 106699. doi:10.1016/j.eiar.2021.106699
Dada, J. T., and Al-Faryan, M. A. S. (2024). Linking per capita income, renewable energy, natural resources, trade, and Urbanisation to material footprint: insights from Saudi Arabia. Energy Nexus 13, 100269. doi:10.1016/j.nexus.2023.100269
Dehghan Shabani, Z. (2024). Renewable energy and CO2 emissions: does human capital matter? Energy Rep. 11, 3474–3491. doi:10.1016/j.egyr.2024.03.021
Deng, X., and Du, L. (2020). Estimating the environmental efficiency, productivity, and shadow price of carbon dioxide emissions for the Belt and Road Initiative countries. J. Clean. Prod. 277, 123808. doi:10.1016/j.jclepro.2020.123808
Dong, K., Dong, X., and Dong, C. (2019). Determinants of the global and regional CO2 emissions: what causes what and where? Appl. Econ. 51 (46), 5031–5044. doi:10.1080/00036846.2019.1606410
Dong, K., Dong, X., and Jiang, Q. (2020). How renewable energy consumption lower global CO2 emissions? Evidence from countries with different income levels. World Econ. 43 (6), 1665–1698. doi:10.1111/twec.12898
Doytch, N., and Narayan, S. (2016). Does FDI influence renewable energy consumption? An analysis of sectoral FDI impact on renewable and non-renewable industrial energy consumption. Energy Econ. 54, 291–301. doi:10.1016/j.eneco.2015.12.010
Fakher, H. A., Ahmed, Z., Acheampong, A. O., and Nathaniel, S. P. (2023). Renewable energy, nonrenewable energy, and environmental quality nexus: an investigation of the N-shaped Environmental Kuznets Curve based on six environmental indicators. Energy 263, 125660. doi:10.1016/j.energy.2022.125660
Foster, V., Dim, J. U., Vollmer, S., and Zhang, F. (2023). Understanding the challenge of decoupling transport-related CO2 emissions from economic growth in developing countries. World Dev. sustain. 3, 100111. doi:10.1016/j.wds.2023.100111
González-Álvarez, M. A., and Montañés, A. (2023). CO2 emissions, energy consumption, and economic growth: determining the stability of the 3E relationship. Econ. Model. 121, 106195. doi:10.1016/j.econmod.2023.106195
Grodzicki, T., and Jankiewicz, M. (2022). The impact of renewable energy and urbanization on CO2 emissions in Europe – spatio-temporal approach. Environ. Dev. 44, 100755. doi:10.1016/j.envdev.2022.100755
Hao, J., Gao, F., Fang, X., Nong, X., Zhang, Y., and Hong, F. (2022). Multi-factor decomposition and multi-scenario prediction decoupling analysis of China’s carbon emission under dual carbon goal. Sci. Total Environ. 841, 156788. doi:10.1016/j.scitotenv.2022.156788
Hu, M., Li, R., You, W., Liu, Y., and Lee, C.-C. (2020). Spatiotemporal evolution of decoupling and driving forces of CO2 emissions on economic growth along the Belt and Road. J. Clean. Prod. 277, 123272. doi:10.1016/j.jclepro.2020.123272
Hussain, J., Khan, A., and Zhou, K. (2020). The impact of natural resource depletion on energy use and CO2 emission in Belt & Road Initiative countries: a cross-country analysis. Energy 199, 117409. doi:10.1016/j.energy.2020.117409
Ilyas, M., Mu, Z., Akhtar, S., Hassan, H., Shahzad, K., Aslam, B., et al. (2024). Renewable energy, economic development, energy consumption and its impact on environmental quality: new evidence from South East Asian countries. Renew. Energy 223, 119961. doi:10.1016/j.renene.2024.119961
Işık, C., Ahmad, M., Ongan, S., Ozdemir, D., Irfan, M., and Alvarado, R. (2021). Convergence analysis of the ecological footprint: theory and empirical evidence from the USMCA countries. Environ. Sci. Pollut. Res. 28 (25), 32648–32659. doi:10.1007/s11356-021-12993-9
Işık, C., Bulut, U., Ongan, S., Islam, H., and Irfan, M. (2024). Exploring how economic growth, renewable energy, internet usage, and mineral rents influence CO2 emissions: a panel quantile regression analysis for 27 OECD countries. Resour. Policy 92, 105025. doi:10.1016/j.resourpol.2024.105025
Işık, C., Ongan, S., Bulut, U., Karakaya, S., Irfan, M., Alvarado, R., et al. (2022). Reinvestigating the Environmental Kuznets Curve (EKC) hypothesis by a composite model constructed on the Armey curve hypothesis with government spending for the US States. Environ. Sci. Pollut. Res. 29 (11), 16472–16483. doi:10.1007/s11356-021-16720-2
Isik, C., Ongan, S., and Özdemir, D. (2019). The economic growth/development and environmental degradation: evidence from the US state-level EKC hypothesis. Environ. Sci. Pollut. Res. 26 (30), 30772–30781. doi:10.1007/s11356-019-06276-7
Jahanger, A., Hossain, M. R., Usman, M., and Chukwuma Onwe, J. (2023). Recent scenario and nexus between natural resource dependence, energy use and pollution cycles in BRICS region: does the mediating role of human capital exist? Resour. Policy 81, 103382. doi:10.1016/j.resourpol.2023.103382
Jahanger, A., Yu, Y., Hossain, M. R., Murshed, M., Balsalobre-Lorente, D., and Khan, U. (2022). Going away or going green in NAFTA nations? Linking natural resources, energy utilization, and environmental sustainability through the lens of the EKC hypothesis. Resour. Policy 79, 103091. doi:10.1016/j.resourpol.2022.103091
Jiang, Q., Khattak, S. I., and Rahman, Z. U. (2021). Measuring the simultaneous effects of electricity consumption and production on carbon dioxide emissions (CO2e) in China: New evidence from an EKC-based assessment. Energy 229, 120616. doi:10.1016/j.energy.2021.120616
Jiang, Q., Rahman, Z. U., Zhang, X., Guo, Z., and Xie, Q. (2022). An assessment of the impact of natural resources, energy, institutional quality, and financial development on CO2 emissions: evidence from the B&R nations. Resour. Policy 76, 102716. doi:10.1016/j.resourpol.2022.102716
Jiao, J., Chen, C., and Bai, Y. (2020). Is green technology vertical spillovers more significant in mitigating carbon intensity? Evidence from Chinese industries. J. Clean. Prod. 257, 120354. doi:10.1016/j.jclepro.2020.120354
Kaika, D., and Zervas, E. (2013). The environmental Kuznets curve (EKC) theory. Part B: critical issues. Energy Policy 62, 1403–1411. doi:10.1016/j.enpol.2013.07.130
Karaaslan, A., and Çamkaya, S. (2022). The relationship between CO2 emissions, economic growth, health expenditure, and renewable and non-renewable energy consumption: empirical evidence from Turkey. Renew. Energy 190, 457–466. doi:10.1016/j.renene.2022.03.139
Kartal, M. T., Pata, U. K., Kılıç Depren, S., and Depren, Ö. (2023). Effects of possible changes in natural gas, nuclear, and coal energy consumption on CO2 emissions: evidence from France under Russia’s gas supply cuts by dynamic ARDL simulations approach. Appl. Energy 339, 120983. doi:10.1016/j.apenergy.2023.120983
Khan, R. (2021a). Beta decoupling relationship between CO2 emissions by GDP, energy consumption, electricity production, value-added industries, and population in China. PLoS One 16 (4 April), e249522. doi:10.1371/journal.pone.0249444
Khan, R. (2022). The impact of agricultural intensification on carbon dioxide emissions and energy consumption: a comparative study of developing and developed nations.
Khan, R. (2023). The impact of a new techno-nationalism era on eco-economic decoupling. Resour. Policy 82, 103452. doi:10.1016/j.resourpol.2023.103452
Khan, R. (2024). Catch-up growth with alpha and beta decoupling and their relationships between CO2 emissions by GDP, population, energy production, and consumption. Heliyon 10, e31470. doi:10.1016/j.heliyon.2024.e31470
Khan, R., Alabsi, A. A. N., and Muda, I. (2022c). Comparing the effects of agricultural intensification on CO2 emissions and energy consumption in developing and developed countries. Front. Environ. Sci. 10. doi:10.3389/fenvs.2022.1065634
Khan, R., Zhuang, W., Najumddin, O., Butt, R. S., Ahmad, I., and Al-Faryan, M. A. S. (2022b). The impact of agricultural intensification on carbon dioxide emissions and energy consumption: a comparative study of developing and developed nations. Front. Environ. Sci. 10. doi:10.3389/fenvs.2022.1036300
Khan, A. A., Khan, S. U., Ali, M. A. S., Safi, A., Gao, Y., Ali, M., et al. (2022a). Role of institutional quality and renewable energy consumption in achieving carbon neutrality: case study of G-7 economies. Sci. Total Environ. 814, 152797. doi:10.1016/j.scitotenv.2021.152797
Khan, S. Z. R. (2021b). Performance evaluation of e-commerce firms in China: using three-stage data envelopment analysis and the Malmquist productivity index. PLoS One 11 (6). doi:10.1371/journal.pone.0255851
Koengkan, M., and Fuinhas, J. A. (2020). Exploring the effect of the renewable energy transition on CO2emissions of Latin American & Caribbean countries. Int. J. Sustain. Energy 39 (6), 515–538. doi:10.1080/14786451.2020.1731511
Koengkan, M., Fuinhas, J. A., Tavares, A. I. P., and Gonçalves Silva, N. M. B. (2023). in 9 - does the obesity epidemic increase the consumption of fossil fuels in Latin America and Caribbean countries? Editors M. Koengkan, J. A. Fuinhas, A. I. P. Tavares, and E. Gonçalves Silva (Academic Press), 241–273.
Kwilinski, A., Lyulyov, O., and Pimonenko, T. (2024). Reducing transport sector CO2 emissions patterns: environmental technologies and renewable energy. J. Open Innov. Technol. Mark. Complex. 10, 100217. doi:10.1016/j.joitmc.2024.100217
László, T. (2023). Ambivalent changes in the correlation of energy consumption and economic growth in the member states of the European Union (2010–2019). Heliyon 9 (3), e14550. doi:10.1016/j.heliyon.2023.e14550
Le, T. H. (2022). Connectedness between nonrenewable and renewable energy consumption, economic growth and CO2 emission in Vietnam: new evidence from a wavelet analysis. Renew. Energy 195, 442–454. doi:10.1016/j.renene.2022.05.083
Leal, P. H., and Marques, A. C. (2020). Rediscovering the EKC hypothesis for the 20 highest CO2 emitters among OECD countries by level of globalization. Int. Econ. 164, 36–47. doi:10.1016/j.inteco.2020.07.001
Li, L., Chen, X., and Zhu, P. (2024). How do e-commerce anchors’ characteristics influence consumers’ impulse buying? An emotional contagion perspective. J. Retail. Consum. Serv. 76, 103587. doi:10.1016/j.jretconser.2023.103587
Li, R. C. L., Dao, K. K. M., Ho, D. W. H., and Lui, S. C. L. (2019). Development & use of renewable energy in sewage treatment facilities. Energy Procedia 158, 502–508. doi:10.1016/j.egypro.2019.01.143
Li, T., Liu, T., Sawyer, A. O., Tang, P., Loftness, V., Lu, Y., et al. (2024). Generalized building energy and carbon emissions benchmarking with post-prediction analysis. Dev. Built Environ. 17, 100320. doi:10.1016/j.dibe.2024.100320
Li, W., Qiao, Y., Li, X., and Wang, Y. (2022). Energy consumption, pollution haven hypothesis, and Environmental Kuznets Curve: examining the environment–economy link in belt and road initiative countries. Energy 239, 122559. doi:10.1016/j.energy.2021.122559
Lin, B., and Ullah, S. (2024). Effectiveness of energy depletion, green growth, and technological cooperation grants on CO2 emissions in Pakistan’s perspective. Sci. Total Environ. 906, 167536. doi:10.1016/j.scitotenv.2023.167536
Liu, W., Xu, X., Yang, Z., Zhao, J., and Xing, J. (2016). Impacts of FDI renewable energy technology spillover on China’s energy industry performance. Sustainability 8 (9), 846. doi:10.3390/su8090846
Liu, Y., and Lai, X. (2021). EKC and carbon footprint of cross-border waste transfer: evidence from 134 countries. Ecol. Indic. 129, 107961. doi:10.1016/j.ecolind.2021.107961
Liu, Z., Qiu, C., and Zhu, L. (2022). Dynamic role of green energy efficiency and climate technologies in realizing environmental sustainability: fresh insights from China. Front. Environ. Sci. 10. doi:10.3389/fenvs.2022.908470
Mei, B., Khan, A. A., Khan, S. U., Ali, M. A. S., and Luo, J. (2023). Variation of digital economy’s effect on carbon emissions: improving energy efficiency and structure for energy conservation and emission reduction. Environ. Sci. Pollut. Res. 30 (37), 87300–87313. doi:10.1007/s11356-023-28010-0
Mendonça, A. K. de S., de Andrade Conradi Barni, G., Moro, M. F., Bornia, A. C., Kupek, E., and Fernandes, L. (2020). Hierarchical modeling of the 50 largest economies to verify the impact of GDP, population and renewable energy generation in CO2 emissions. Sustain. Prod. Consum. 22, 58–67. doi:10.1016/j.spc.2020.02.001
Meygoonpoury, E., Ghadim, M. K., and Ziabakhsh-Ganji, Z. (2024). Internationalization of renewable energy base businesses with a combined approach to networking and collaborative competition. Results Eng. 21, 101726. doi:10.1016/j.rineng.2023.101726
Mi, Z., Zheng, J., Green, F., Guan, D., Meng, J., Feng, K., et al. (2021). Decoupling without outsourcing? How China’s consumption-based CO2 emissions have plateaued. iScience 24 (10), 103130. doi:10.1016/j.isci.2021.103130
Mohammad Husain, A., Muzaffarul Hasan, M., Khan, Z. A., and Asjad, M. (2024). A robust decision-making approach for the selection of an optimal renewable energy source in India. Energy Convers. Manag. 301, 117989. doi:10.1016/j.enconman.2023.117989
Muhammad, S., and Long, X. (2021). Rule of law and CO2 emissions: a comparative analysis across 65 belt and road initiative(BRI) countries. J. Clean. Prod. 279, 123539. doi:10.1016/j.jclepro.2020.123539
Muhammad, S., Long, X., Salman, M., and Dauda, L. (2020). Effect of urbanization and international trade on CO2 emissions across 65 belt and road initiative countries. Energy 196, 117102. doi:10.1016/j.energy.2020.117102
Najmuddin, W. Z., Zhuang, W., Li, Z., and Khan, R. (2022). Valuation of land-use/land-cover-based ecosystem services in Afghanistan—an assessment of the past and future. Land 11 (11), 1906. doi:10.3390/land11111906
Nan, S., Huo, Y., You, W., and Guo, Y. (2022). Globalization spatial spillover effects and carbon emissions: what is the role of economic complexity? Energy Econ. 112, 106184. doi:10.1016/j.eneco.2022.106184
Nathaniel, S. P., and Iheonu, C. O. (2019). Carbon dioxide abatement in Africa: the role of renewable and non-renewable energy consumption. Sci. Total Environ. 679, 337–345. doi:10.1016/j.scitotenv.2019.05.011
Nwaka, I. D., Nwogu, M. U., Uma, K. E., and Ike, G. N. (2020). Agricultural production and CO2 emissions from two sources in the ECOWAS region: new insights from quantile regression and decomposition analysis. Sci. Total Environ. 748, 141329. doi:10.1016/j.scitotenv.2020.141329
Ocal, O., and Aslan, A. (2013). Renewable energy consumption–economic growth nexus in Turkey. Renew. Sustain. Energy Rev. 28, 494–499. doi:10.1016/j.rser.2013.08.036
Ongan, S., Işık, C., Bulut, U., Karakaya, S., Alvarado, R., Irfan, M., et al. (2022). Retesting the EKC hypothesis through transmission of the ARMEY curve model: an alternative composite model approach with theory and policy implications for NAFTA countries. Environ. Sci. Pollut. Res. 29 (31), 46587–46599. doi:10.1007/s11356-022-19106-0
Perone, G. (2024). The relationship between renewable energy production and CO2 emissions in 27 OECD countries: a panel cointegration and Granger non-causality approach. J. Clean. Prod. 434, 139655. doi:10.1016/j.jclepro.2023.139655
Rabnawaz Khan, Y. K., and Kong, Y. (2020). Effects of energy consumption on GDP: new evidence of 24 countries on their natural resources and production of electricity. Ekonomika 99 (1), 26–49. doi:10.15388/Ekon.2020.1.2
Radmehr, R., Henneberry, S. R., and Shayanmehr, S. (2021). Renewable energy consumption, CO2 emissions, and economic growth nexus: a simultaneity spatial modeling analysis of eu countries. Struct. Chang. Econ. Dyn. 57, 13–27. doi:10.1016/j.strueco.2021.01.006
Rahman, M. M., Alam, K., and Velayutham, E. (2022). Reduction of CO2 emissions: the role of renewable energy, technological innovation and export quality. Energy Rep. 8, 2793–2805. doi:10.1016/j.egyr.2022.01.200
Raihan, A., Muhtasim, D. A., Farhana, S., Hasan, M. A. U., Pavel, M. I., Faruk, O., et al. (2022). Nexus between economic growth, energy use, urbanization, agricultural productivity, and carbon dioxide emissions: new insights from Bangladesh. Energy Nexus 8, 100144. doi:10.1016/j.nexus.2022.100144
Rashid Gill, A., Viswanathan, K. K., and Hassan, S. (2018). The Environmental Kuznets Curve (EKC) and the environmental problem of the day. Renew. Sustain. Energy Rev. 81, 1636–1642. doi:10.1016/j.rser.2017.05.247
Rehman, F. U., Islam, M. M., and Raza, S. A. (2023). Does disaggregate energy consumption matter to export sophistication and diversification in OECD countries? A robust panel model analysis. Renew. Energy 206, 274–284. doi:10.1016/j.renene.2023.02.035
Ren, L., Zhou, S., Peng, T., and Ou, X. (2021). A review of CO2 emissions reduction technologies and low-carbon development in the iron and steel industry focusing on China. Renew. Sustain. Energy Rev. 143, 110846. doi:10.1016/j.rser.2021.110846
Rothenberg, G. (2023). A realistic look at CO2 emissions, climate change and the role of sustainable chemistry. Sustain. Chem. Clim. Action 2, 100012. doi:10.1016/j.scca.2023.100012
Rubin, E. S., Azevedo, I. M. L., Jaramillo, P., and Yeh, S. (2015). A review of learning rates for electricity supply technologies. Energy Policy 86, 198–218. doi:10.1016/j.enpol.2015.06.011
Saba, C. S. (2023). Nexus between CO2 emissions, renewable energy consumption, militarisation, and economic growth in South Africa: evidence from using novel dynamic ARDL simulations. Renew. Energy 205, 349–365. doi:10.1016/j.renene.2023.01.070
Saidi, K., and Omri, A. (2020). Reducing CO2 emissions in OECD countries: do renewable and nuclear energy matter? Prog. Nucl. Energy 126, 103425. doi:10.1016/j.pnucene.2020.103425
Schilling, M. A., and Esmundo, M. (2009). Technology S-curves in renewable energy alternatives: analysis and implications for industry and government. Energy Policy 37 (5), 1767–1781. doi:10.1016/j.enpol.2009.01.004
Schulhof, V., van Vuuren, D., and Kirchherr, J. (2022). The belt and road initiative (BRI): what will it look like in the future? Technol. Forecast. Soc. Change 175, 121306. doi:10.1016/j.techfore.2021.121306
Shah, M. I., AbdulKareem, H. K. K., khan, Z., and Abbas, S. (2022). Examining the agriculture induced Environmental Kuznets Curve hypothesis in BRICS economies: the role of renewable energy as a moderator. Renew. Energy 198, 343–351. doi:10.1016/j.renene.2022.08.052
Shahbaz, M., Shahzad, S. J. H., and Mahalik, M. K. (2018). Is globalization detrimental to CO2 emissions in Japan? New threshold analysis. Environ. Model. Assess. 23 (5), 557–568. doi:10.1007/s10666-017-9584-0
Sheraz, M., Deyi, X., Sinha, A., Mumtaz, M. Z., and Fatima, N. (2022). The dynamic nexus among financial development, renewable energy and carbon emissions: moderating roles of globalization and institutional quality across BRI countries. J. Clean. Prod. 343, 130995. doi:10.1016/j.jclepro.2022.130995
Shittu, W., Adedoyin, F. F., Shah, M. I., and Musibau, H. O. (2021). An investigation of the nexus between natural resources, environmental performance, energy security and environmental degradation: evidence from Asia. Resour. Policy 73, 102227. doi:10.1016/j.resourpol.2021.102227
Somoza-Tornos, A., Guerra, O. J., Crow, A. M., Smith, W. A., and Hodge, B.-M. (2021). Process modeling, techno-economic assessment, and life cycle assessment of the electrochemical reduction of CO2: a review. iScience 24 (7), 102813. doi:10.1016/j.isci.2021.102813
Su, X., Li, Y., Fang, K., and Long, Y. (2022). Does China’s direct investment in ‘Belt and Road Initiative’ countries decrease their carbon dioxide emissions? J. Clean. Prod. 339, 130543. doi:10.1016/j.jclepro.2022.130543
Sufyanullah, K., Ahmad, K. A., and Sufyan Ali, M. A. (2022). Does emission of carbon dioxide is impacted by urbanization? An empirical study of urbanization, energy consumption, economic growth and carbon emissions - using ARDL bound testing approach. Energy Policy 164, 112908. doi:10.1016/j.enpol.2022.112908
Sung, B., Song, W.-Y., and Park, S.-D. (2018). How foreign direct investment affects CO2 emission levels in the Chinese manufacturing industry: evidence from panel data. Econ. Syst. 42 (2), 320–331. doi:10.1016/j.ecosys.2017.06.002
Tenaw, D., and Beyene, A. D. (2021). Environmental sustainability and economic development in sub-Saharan Africa: a modified EKC hypothesis. Renew. Sustain. Energy Rev. 143, 110897. doi:10.1016/j.rser.2021.110897
Tran, Q. T., Huynh, N., and Huynh, N. A. (2022). Trading-off between being contaminated or stimulated: are emerging countries doing good jobs in hosting foreign resources? J. Clean. Prod. 379, 134649. doi:10.1016/j.jclepro.2022.134649
Van Poecke, A., Tabari, H., and Hellinckx, P. (2024). Unveiling the backbone of the renewable energy forecasting process: exploring direct and indirect methods and their applications. Energy Rep. 11, 544–557. doi:10.1016/j.egyr.2023.12.031
Wang, X., Liu, Y., Bi, J., and Liu, M. (2022a). New challenges of the Belt and Road Initiative under China’s ‘3060’ carbon target. J. Clean. Prod. 376, 134180. doi:10.1016/j.jclepro.2022.134180
Wang, X., Wang, Y., and Wei, C. (2023). The impact of natural resource abundance on green economic growth in the belt and road countries: the role of institutional quality. Environ. Impact Assess. Rev. 98, 106977. doi:10.1016/j.eiar.2022.106977
Wang, X., and Yan, L. (2022). Driving factors and decoupling analysis of fossil fuel related-carbon dioxide emissions in China. Fuel 314, 122869. doi:10.1016/j.fuel.2021.122869
Wang, Y., and Sun, T. (2012). Life cycle assessment of CO2 emissions from wind power plants: Methodology and case studies. Renew. Energy 43, 30–36. doi:10.1016/j.renene.2011.12.017
Wang, Z., Pham, T. L. H., Sun, K., Wang, B., Bui, Q., and Hashemizadeh, A. (2022b). The moderating role of financial development in the renewable energy consumption - CO2 emissions linkage: the case study of Next-11 countries. Energy 254, 124386. doi:10.1016/j.energy.2022.124386
Wolde-Rufael, Y., and Weldemeskel, E. M. (2020). Environmental policy stringency, renewable energy consumption and CO2 emissions: panel cointegration analysis for BRIICTS countries. Int. J. Green Energy 17 (10), 568–582. doi:10.1080/15435075.2020.1779073
Wu, Y., Shi, X., and Hu, C. (2021). Per capita CO2 emissions divergence influenced by bilateral trade with China under the belt and road initiative. Sustain. Prod. Consum. 27, 1589–1601. doi:10.1016/j.spc.2021.04.005
Wu, Y., Zhu, Q., and Zhu, B. (2018). Decoupling analysis of world economic growth and CO2 emissions: a study comparing developed and developing countries. J. Clean. Prod. 190, 94–103. doi:10.1016/j.jclepro.2018.04.139
Yadav, A., Gyamfi, B. A., Asongu, S. A., and Behera, D. K. (2024). The role of green finance and governance effectiveness in the impact of renewable energy investment on CO2 emissions in BRICS economies. J. Environ. Manage. 358, 120906. doi:10.1016/j.jenvman.2024.120906
Yang, X., Ramos-Meza, C. S., Shabbir, M. S., Ali, S. A., and Jain, V. (2022b). The impact of renewable energy consumption, trade openness, CO2 emissions, income inequality, on economic growth. Energy Strateg. Rev. 44, 101003. doi:10.1016/j.esr.2022.101003
Yang, Y., Wang, H., Löschel, A., and Zhou, P. (2022a). Patterns and determinants of carbon emission flows along the Belt and Road from 2005 to 2030. Ecol. Econ. 192, 107260. doi:10.1016/j.ecolecon.2021.107260
You, W., and Lv, Z. (2018). Spillover effects of economic globalization on CO2 emissions: a spatial panel approach. Energy Econ. 73, 248–257. doi:10.1016/j.eneco.2018.05.016
You, Z., Li, L., and Waqas, M. (2024). How do information and communication technology, human capital and renewable energy affect CO2 emission; New insights from BRI countries. Heliyon 10 (4), e26481. doi:10.1016/j.heliyon.2024.e26481
Yousefi, H. (2019). Uncertainty quantification of axisymmetric spherical cavities with lining in coupled saturated thermo-poro-elastic media via adaptive second-order central high resolution schemes. Int. J. Hydromechatronics 2 (4), 111. doi:10.1504/ijhm.2019.104389
Yu, T.-M., Yan, Y.-T., Yin, Y.-H., and Yang, M.-G. (2023). Are natural resources and oil prices a possible solution to renewable energy electricity? Evidence from global time series data. Resour. Policy 86, 104288. doi:10.1016/j.resourpol.2023.104288
Yu, Y., Radulescu, M., Ifelunini, A. I., Ogwu, S. O., Onwe, J. C., and Jahanger, A. (2022). Achieving carbon neutrality pledge through clean energy transition: linking the role of green innovation and environmental policy in E7 countries. Energies 15 (17), 6456. doi:10.3390/en15176456
Keywords: renewable energy, economic growth, CO2 emissions, generalized linear model, developing and developed countries
Citation: Jie W and Rabnawaz K (2024) Renewable energy and CO2 emissions in developing and developed nations: a panel estimate approach. Front. Environ. Sci. 12:1405001. doi: 10.3389/fenvs.2024.1405001
Received: 25 March 2024; Accepted: 22 July 2024;
Published: 09 August 2024.
Edited by:
Martin Siegert, University of Exeter, United KingdomReviewed by:
Muhammad Saeed Meo, Sunway University, MalaysiaSufyan Ullah Khan, University of Stavanger, Norway
Copyright © 2024 Jie and Rabnawaz. This is an open-access article distributed under the terms of the Creative Commons Attribution License (CC BY). The use, distribution or reproduction in other forums is permitted, provided the original author(s) and the copyright owner(s) are credited and that the original publication in this journal is cited, in accordance with accepted academic practice. No use, distribution or reproduction is permitted which does not comply with these terms.
*Correspondence: Wang Jie, d2FuZy5qaWVAZmp1dC5lZHUuY24=; Khan Rabnawaz, ZGs0OTE5MDgyQGdtYWlsLmNvbQ==