- School of Economics and Management, Beijing University of Technology, Beijing, China
Low-carbon economy is the inevitable path for the development of Beijing-Tianjin-Hebei. The SD model of High-quality development in the Beijing-Tianjin-Hebei region was constructed based on the “dual carbon” goal, including capital input and environmental pollution index as influencing factors. Through simulation and prediction, the following results are obtained: (1) Through the production function of Cobb Douglas, Beijing-Tianjin-Hebei region is still in the stage of highly concentrated capital to promote economic development. (2) It is proved that under the baseline scenario, the overall carbon neutrality and carbon peaking targets of Beijing-Tianjin-Hebei are difficult to achieve. However, in the context of high-quality development, the Beijing-Tianjin-Hebei region can successfully achieve the target of carbon peak by 2035. (3) Under the high-quality development scenario, the carbon emissions will decrease after the carbon peak, and the growth of economic aggregate and the development of total carbon emissions will be decoupled. Through the carbon emission simulation of the Beijing-Tianjin-Hebei region, it can be found that high-quality development is the only way for the future coordinated development of the Beijing-Tianjin-Hebei region, which can provide certain enlightenment for the development direction of the Beijing-Tianjin-Hebei region.
1 Introduction
At the 75th session of the United Nations General Assembly, China proposed that it will strive to achieve carbon peak by 2030 and strive to achieve carbon neutrality by 2060. The Beijing-Tianjin-Hebei region is the core region of China’s urban agglomerations, and promoting high-quality development of the Beijing-Tianjin-Hebei region not only conforms to the policy orientation of the regional coordinated development strategy proposed in the “Big 20” report, but also the inherent requirement of realizing the “double carbon” goal. At present, how to promote the Beijing-Tianjin-Hebei to achieve carbon peak and carbon neutrality before the time limit in promoting economic growth and green and low-carbon development has become an important task for the high-quality coordinated development of Beijing, Tianjin and Hebei.
Lin Boqiang believes that carbon neutrality can be simply understood as the adjustment of energy structure (Lin, 2022). According to the current energy structure and consumption upgrading in China (Wu et al., 2022), at the present stage, China’s “dual carbon” goal faces the challenges of carbon emission reduction pressure, tight time and high cost (Liu et al., 2021; Liu et al., 2022; Zheng, 2023). It is precisely because of these problems that Yang Lisha et al. discussed the driving factors of carbon dioxide change and proved the key role of technological progress (Yang et al., 2019). Secondly, in terms of policy and governance, some scholars believe that the goal of “dual carbon” does not lie in the reduction of carbon emissions in the short term, but in the transformation of the development scale of various cities (Yuan et al., 2022). LinB et al. also believe that in the short term, the effect of government policies on energy conservation and emission reduction is not significant, so the long-term effect of policies deserves more attention (Lin and Zhu, 2019). In terms of policies, carbon tax is considered to have significant effects and low cost (Baranzini et al., 2000), and differentiated carbon tax can promote carbon emission reduction (Weng et al., 2021). While reducing carbon emission intensity, carbon trading policy can also achieve coordinated emission reduction of other pollutants (Zhang et al., 2022). Ren Yayun et al. also believe that carbon trading policy can promote the overall green development of pilot areas (Ren and Fu, 2019; Guo et al., 2021). Green finance can significantly promote carbon emission reduction, and industrial structure and green innovation are the core transmission mechanisms (Ran and Zhang, 2023). In addition to carbon finance, research has shown that stock markets can also accelerate emissions reductions in carbon-intensive industries (De Haas and Popov, 2023). Finally, social participation is being widely promoted. From the perspective of environmental regulation, Huang Qinghuang and et al. confirmed that environmental regulation with public participation and market incentives is the key factor for improving energy conservation and emission reduction efficiency (Huang and Gao, 2016). Wu Jiannan and et al. also pointed out that the role of public participation in the process of environmental governance is gradually becoming more and more important over time (Wu et al., 2016), and it is crucial to jointly establish a green and low-carbon development environment with the public, which is crucial for the realization of the “two-carbon” goal.
At present, the high-quality development of Beijing-Tianjin-Hebei is generally divided into two research directions. One is to study the mutual influence of specific fields on the high-quality development of Beijing-Tianjin-Hebei under the constraint of the high-quality development of Beijing-Tianjin-Hebei; the other is to construct the high-quality development indicator system of Beijing-Tianjin-Hebei to explore the degree, problems (Wen and Zhiting, 2023) and future development path of Beijing-Tianjin-Hebei (Liu et al., 2023). Among the scholars who carried out research with the high-quality development of Beijing-Tianjin-Hebei as the constraint, were Wen and Yang (2022) and Sun et al. (2020). By constructing an index system to analyze the degree and problems of high-quality development in Beijing-Tianjin-Hebei, Chen et al. (2022), Tian et al. (2022), Dong (2022), Guo et al. (2022), Li et al. (2022) sought the path of high-quality development in the future. It can be seen that after the concept of high-quality development was put forward, the importance of building a new development pattern has become prominent. Scholars have studied a lot from the aspects of connotation, influencing factors, mechanism, development path and model of high-quality development in Beijing-Tianjin-Hebei. In high-quality development, it is crucial to identify the factors that affect economic development. At present, most of the factors affecting the high-quality development of Beijing-Tianjin-Hebei are in the evaluation stage of index construction, and the long-term systematic simulation and prediction of dynamic development are still relatively lacking. Many scholars have analyzed the reasons affecting the economic development of Beijing-Tianjin-Hebei region from the aspects of technological innovation (Deng et al., 2023), capital input (Fang, 2018) and labor input (Yufeng, 2022), but the three factors are rarely used in the analysis of the Beijing-Tianjin-Hebei region. Beijing-tianjin-hebei, as a region of coordinated economic development, belongs to a complex system. The study of complex system optimization is mainly carried out by system dynamics, network analysis, multi-objective optimization, game theory and other methods. For example, Ji Luo et al. studied the prediction and optimization of carbon emissions in the region with the background of big data (Luo et al., 2024), and Li G et al. predicted the carbon emissions of Tianjin City with the system dynamics method (Li et al., 2023), and Liu L Y et al. analyzed the impact of carbon emission through system dynamics during the planning of new city (Liu et al., 2018). But there are still few studies on the collaborative development of Beijing-Tianjin-Hebei as the analysis subject of simulation prediction.
Based on the above problems, this paper makes a targeted analysis of the main factors affecting the development of Beijing-Tianjin-Hebei based on the Cobb Douglas production function. Then draws on Zeng Peng’s SD model of high-quality development of urban agglomerates in China (Zeng et al., 2022), adding environmental pollution index, fixed investment and other influencing factors to build the SD model of high-quality development of Beijing-Tianjin-Hebei. The constructed model, combined with historical trend analysis and future scenario simulation, is used to predict the carbon emissions of the Beijing-Tianjin-Hebei region in a variety of scenarios. And systematically study how to achieve the “dual carbon” goal through high-quality development, which has certain practical and theoretical value for providing decision-making basis for the “dual carbon” goal of the Beijing-Tianjin-Hebei region.
2 Materials and methods
2.1 SD model association thinking
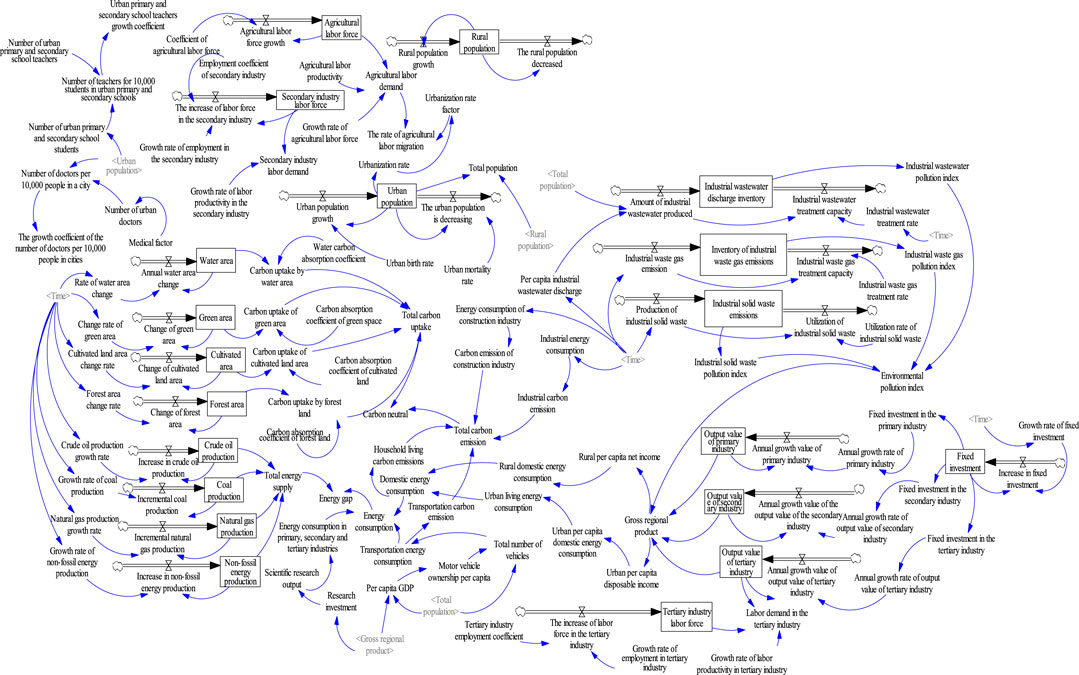
The high-quality coordinated development of the Beijing-Tianjin-Hebei region cannot be achieved without the support of a low-carbon development environment with emission reduction as the core. Carbon emission and carbon absorption should be the main factors in the process of high-quality development. Zeng Peng mainly analyzed industrial carbon emissions, construction carbon emissions, residential carbon emissions, and transportation carbon emissions as the focus of carbon emissions, and simulated carbon emissions and carbon absorption driven by production, living and ecological environment (Zeng et al., 2022). This paper deconstructs the “dual-carbon” target subsystem based on carbon emission, carbon absorption and low-carbon development environment, considers the impact of environmental pollution and the whole society’s fixed investment on the high-quality development of Beijing-Tianjin-Hebei, and builds an SD model of Beijing-Tianjin-Hebei coordinated development with carbon emission and carbon absorption as the main factors. The relationship diagram of the specific SD model is shown in Figure 1 below.
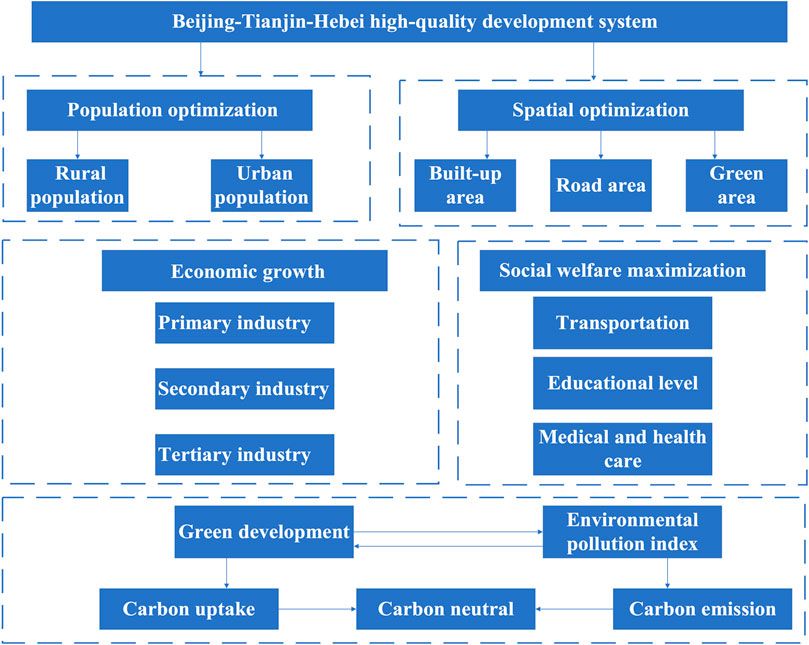
Figure 1. Logic diagram of high-quality coordinated development of Beijing-Tianjin-Hebei under the “dual-carbon” system.
2.2 Research hypothesis and measurement model construction
Cobb Douglas production function is the basis of modern economic growth analysis. It is widely used in the quantitative analysis of the contribution rate of each production factor. In order to quantitatively measure the current contribution of major factors to the Beijing-Tianjin-Hebei economy, this paper uses the improved Cobb Douglas production function model to analyze the impact of material capital, labor force and technological progress on the coordinated development of Beijing-Tianjin-Hebei, and analyzes the source and resistance of the coordinated development of Beijing-Tianjin-Hebei. The common expression formula of this model is as follows:
Among them,
Among them, the data set spans the period from 2010 to 2021, and the total output Y is reflected by the gross domestic product (GDP) of the Beijing-Tianjin-Hebei region (RMB 100 million). Capital factor supply K is reflected by the total investment in fixed assets of the whole society (100 million yuan); Labor factor supply L number of employees in Beijing, Tianjin and Hebei at the end of the year (10,000); Technological progress T is reflected in the total amount of technology contract investment (100 million yuan).
2.3 Main methods and data sources of “dual carbon” target system construction
In this paper, Vensim platform is used to build a high-quality SD model of Beijing-Tianjin-Hebei collaborative development constrained by “dual carbon” goals, which is mainly divided into carbon emission module, carbon absorption module, environmental pollution module and low-carbon development environment module. The carbon emission module mainly simulates the total carbon emissions of Beijing-Tianjin-Hebei, assuming that its carbon emissions mainly come from residential carbon emissions, construction carbon emissions, industrial carbon emissions, transportation carbon emissions and so on. For the carbon absorption module, the absorption capacity is mainly reflected in the carbon absorption capacity of green space, forest land, cultivated land and water area. The environmental pollution module mainly considers industrial solid waste, wastewater and exhaust gases.
The basic data involved in this study are divided into four aspects: population, economy, carbon emission, energy consumption and supply. The specific data indicators are from Beijing Statistical Yearbook, Hebei Statistical Yearbook, Tianjin Statistical Yearbook, National Economic and Social Development Statistical Bulletin of Beijing-Tianjin-Hebei Region, and carbon emission data are from CEADs database.
3 Results
3.1 Operational mechanism for high-quality development of the Beijing-Tianjin-Hebei region
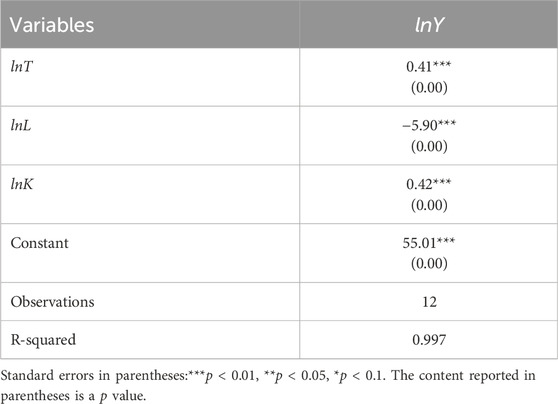
Using the data mentioned above, OLS estimation using Stata software can obtain the regression results in Table 1. Among them, the model determination coefficient R2 of Equation 3 is 0.997, and the goodness of fit is high. It can be considered that the GDP of the Beijing-Tianjin-Hebei region can be explained by capital input, labor input and scientific and technological progress input in the multiple linear regression equation. At the same time, the P-value of capital input, labor input and scientific and technological progress input is 0.00, indicating that these three variables have significant impacts on economic growth. Specifically, α = 0.42, β = −5.90, θ = 0.41, lnA = 55.01, that is, the output elasticity of capital, labor, and scientific and technological progress is 0.42, −5.90, 0.41 respectively, indicating that when the capital stock and scientific and technological progress increase by 1 percentage point, it can boost the GDP of the Beijing-Tianjin-Hebei region by 0.42 and 0.41 percentage points respectively. When the labor input increases by 1 percentage point, the GDP of the Beijing-Tianjin-Hebei region will decrease by 5.90 percentage points. According to the size of the three parameters, the contribution rate of capital and technology input to the GDP of the Beijing-Tianjin-Hebei region is similar, but labor input has a negative contribution to the GDP of the Beijing-Tianjin-Hebei region. At the same time, because
The diminishing returns to scale in this region from 2010 to 2021 are mainly caused by the problem of labor input. When the increase of labor input leads to the decrease of regional GDP, there may be a problem of labor surplus. The concentration of population in the Beijing-Tianjin-Hebei region has led to excessive labor input and reduced the productivity of each unit of labor. Therefore, in the current high-quality collaborative development of Beijing, Tianjin and Hebei, technology investment and capital investment are the main factors to promote the economic development of Beijing, Tianjin and Hebei, and the promotion effect of labor input has not reached the expected effect. The future development of the Beijing-Tianjin-Hebei region must improve the output efficiency of capital and technology to the regional GDP, while changing the structure of labor input.
3.2 Scenario simulation and result analysis
3.2.1 Correlation thinking and causality diagram of SD model
The coordinated development of the Beijing-Tianjin-Hebei region is a feedback system involving the interaction of economic, social and ecological factors, in which various factors influence each other to determine the operation of the system. SD model is suitable for modeling complex systems and supporting decision making. By constructing SD model, the interaction between economic, ecological and social factors can be simulated. Decision makers can adjust the accuracy of the system by comparing the simulated data with the real data. After ensuring the system error rate, decision makers simulate the long-term dynamics of the system through different planning measures to assess the impact of different policies and strategies and make more informed decisions. Therefore, this paper carries out the following analysis by constructing the SD model of Beijing-Tianjin-Hebei collaborative development. The research time series is from 2010 to 2060, the historical year data is from 2010 to 2019, and the simulation prediction year is from 2020 to 2060. The simulation step length is 1 year.
Based on the SD model built by Zeng et al. (2022), this paper divides the model into four systems: social subsystem, economic subsystem, energy subsystem and environmental subsystem. In the social subsystem, it is mainly divided into three parts: high-quality population development, spatial urbanization development and social urbanization development, urban population and rural population impact; The economic subsystem is mainly affected by the development of primary, secondary and tertiary industries and environmental pollution. The energy subsystem mainly controls the energy gap by controlling energy supply and energy consumption, which consists of energy consumption from the primary, secondary and tertiary industries, domestic energy consumption and motor vehicle energy consumption. The total energy supply mainly includes crude oil supply, raw coal supply, natural gas supply and non-fossil energy supply. In terms of low-carbon development, according to the “Opinions on the complete, accurate and Comprehensive Implementation of the new development Concept to do a good job of carbon peak carbon neutrality”, energy, transportation and construction industry as the key development industries to join them. Carbon emissions are considered from the aspects of residential carbon emissions, transportation carbon emissions, industrial carbon emissions and construction carbon emissions. Carbon absorption is considered from four aspects: arable land absorption, water area absorption, green land absorption and forest land absorption. GDP is composed of primary, secondary and tertiary industries and environmental pollution index. The specific SD model construction is shown in Figure 2.
3.2.2 Model checking
3.2.2.1 Structural test
Structural testing is one of the methods to ensure the mathematical and logical correctness of the simulation model, which improves the explainability and usability of the model by detecting the structure and rationality of the actual system, and ensures the reliable simulation results. In this paper, the structure tree, reason tree and Check Model functions of Vensim software were used to conduct structural tests on the constructed model to verify the rationality of system causality and variable selection. Secondly, the rationality of variable value and the correctness of mathematical formula writing are checked by the function of formula detection. Through the detection of these two aspects, the model is constantly corrected until the model no longer appears errors in the software operation.
3.2.2.2 Historical test
The historical test verifies the accuracy and feasibility of the model by comparing the simulated data with the real data, identifies the deviations and errors of the model, and provides feedback to guide the improvement of the model, so as to ensure that the model can accurately simulate past events and provide credibility for future decisions under different strategies. The historical test is calculated as follows:
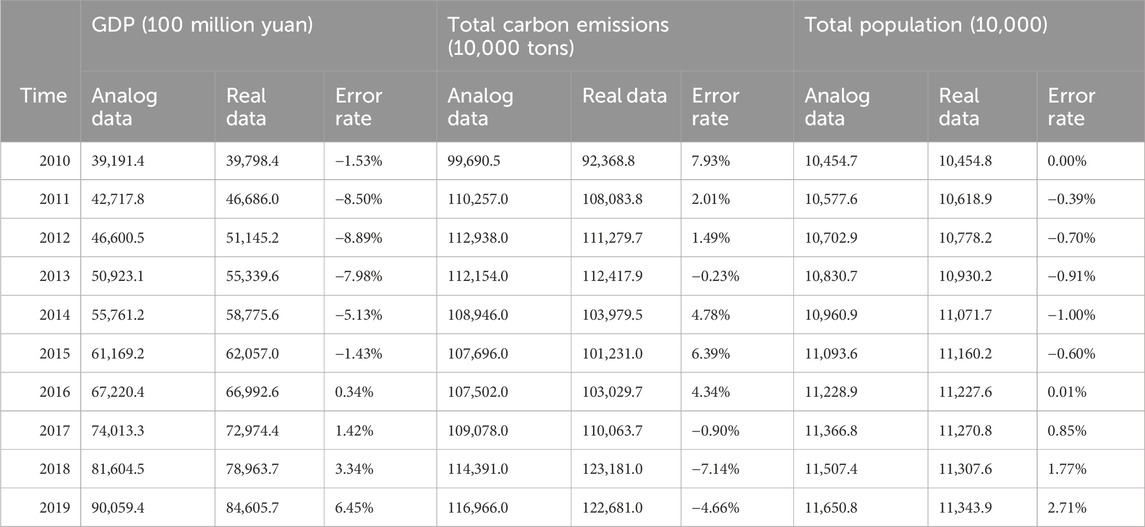
In this paper, the total number of people, GDP and total carbon emissions are selected as key variables as validation data. The simulation data, real data and error rate from 2010 to 2019 are all shown in Table 2 below.
Table 2 shows that the system model has passed the historical test. By comparing the difference between simulated values of total population, GDP and total carbon emission of key variables in the system and the real data. It is determined that the simulated data of the Beijing-Tianjin-Hebei high-quality collaborative development model is in good agreement with the real data, and its error rate is controlled within 10%, so it is considered that the error rate is within the acceptable range.
3.2.2.3 Robustness test
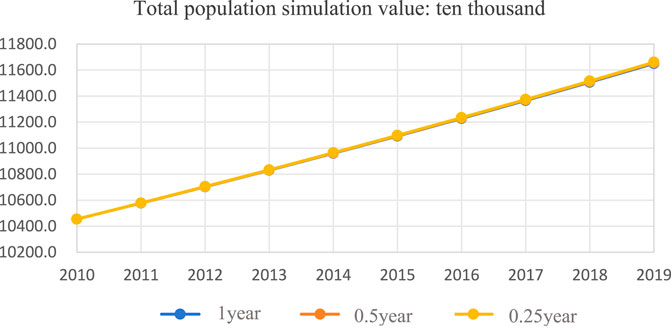
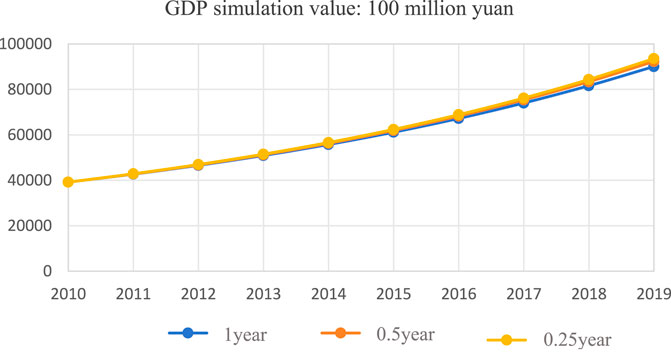
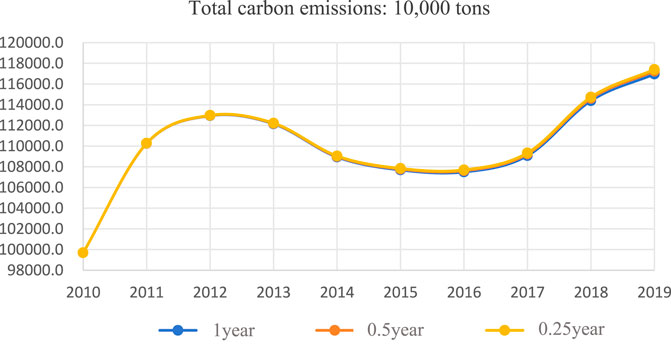
In this paper, the stability of the model is tested by changing the time step to check whether the variables in the model will change greatly. By changing the step size setting, this paper selects three key variables, total population, GDP and total carbon emission data, as examples to verify whether the results of model operation under different time steps have huge changes. As shown in Figures 3–5, when the time step of the model changes, the simulation results of the variables do not have a huge abnormal change, indicating that the model of high-quality collaborative development in the Beijing-Tianjin-Hebei region is relatively stable.
3.2.3 Sensitivity test
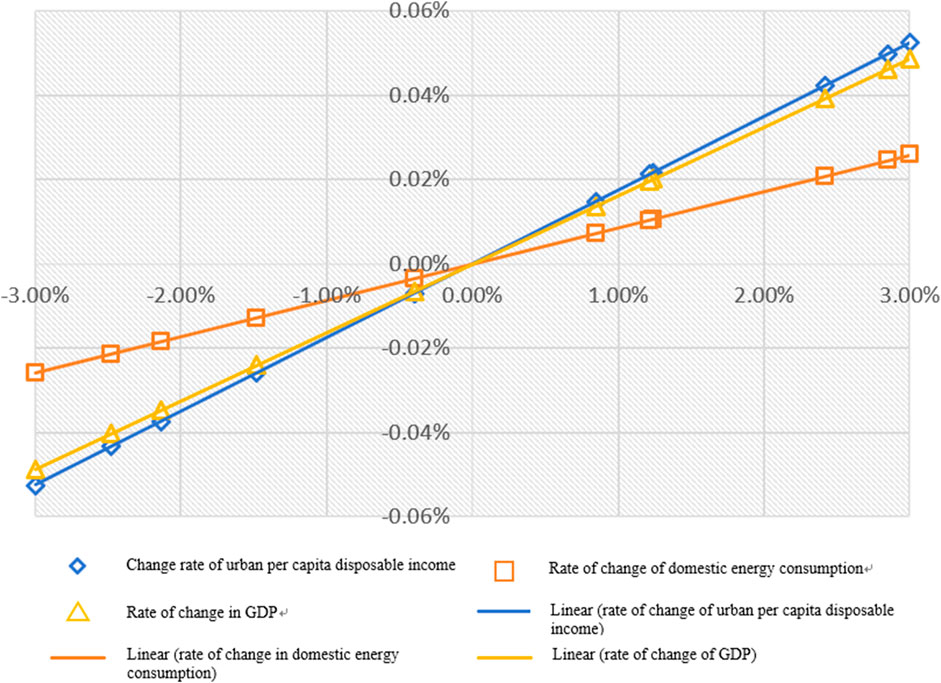
In order to reduce the uncertainty of the model, sensitivity analysis in the simulation model is a common method to evaluate the sensitivity of the model output to the input parameters. In this paper, 2019 is selected as the test year, GDP, urban per capita disposable income and total domestic energy consumption are selected as examples, and the change interval of these three key variables is measured by the change of fixed assets between −3% and 3%. As shown in Figure 6 below, the change rates of these three key variables all vary between −1% and 1%, and the change interval belongs to the reasonable change interval. Therefore, it indicates that small changes in model parameters will not have a great impact on model behavior and results, indicating that the model is less sensitive and can be used for simulation.
3.2.4 Scenario scheme parameter setting
China is committed to achieving the carbon peak target by 2030, which means that China’s carbon emissions will no longer grow after 2030. At the same time, China will make full use of various carbon absorption methods to achieve carbon neutrality in 2060, so this paper will focus on the analysis of carbon emissions and carbon absorption in the design scenario simulation. Taking 2019 as the base year, this paper simulated and predicted the baseline scenario and high-quality development scenario of carbon emission and carbon absorption in the Beijing-Tianjin-Hebei region from 2025 to 2060, seeking the optimal policy measures for the high-quality development of the Beijing-Tianjin-Hebei region.
Compared with other measurement methods, system dynamics pays more attention to the structure of the system and the construction of causality. The logic and integrity of the structure affect the future development trend of the system. There can be a certain tolerance for data errors in the future development trend, so in the operation of the system, the error can be controlled within a relatively reasonable range through the debugging of the system, and then the next step of simulation. The parameter setting used in this paper mainly includes initial value of variable, table function and constant. The method of parameter setting is mainly in the following two aspects:
The first aspect is to obtain the original data from the collection of historical data. It is obtained from the reports of Beijing Statistical Yearbook, Tianjin Statistical Yearbook, Hebei Statistical Yearbook, Beijing Statistical Bulletin of National Economic and Social Development, Tianjin Statistical Bulletin of National Economic and Social Development, Hebei Statistical Bulletin of National Economic and Social Development and the National Bureau of Statistics of relevant years. In this paper, linear interpolation method is used to complete the missing data of some years.
In the second aspect, statistical software is used for analysis. The table functions in the model are set up using Stata’s quadratic exponential smoothing method to make predictions for 2020 to 2060 using historical data for known years 2010–2019.
The equations used in system dynamics generally fall into three categories: the accumulation variable equation, the rate equation, and the auxiliary equation. The equation of accumulated variables is mainly used to describe the accumulated variables in the system, that is, the amount that can be accumulated in the system, as shown in Equation 4. Differential equations are usually expressed in terms of time and are used to describe the rate of change of an accumulated variable, as shown in Equation 5. Accumulation equations are used for many variables in the system, such as inventory, capital, population, etc. The rate equation is an equation composed of state variables in a unit time interval. In this paper, 1 year is used as the unit time interval except for the experimental part. Auxiliary equations are used to represent constraints, external inputs, control variables, etc. in the system, as shown in Equation 6. The expressions of the above three equations are:
Equation of accumulated variables:
Where,
Rate equation:
Where,
Auxiliary equation:
Where,
3.2.4.1 Benchmark scenario scheme parameter setting
From the perspective of total population change, the average natural population growth rate of the Beijing-Tianjin-Hebei region during the 12th Five-Year Plan period was 4.16%, and the average natural population growth rate of the Beijing-Tianjin-Hebei region during the 13th Five-Year Plan period was 3.17%. The natural growth rate of the national population in the “Twelfth Five-Year Plan” period is 6.5%, and the natural growth rate in the “thirteenth Five-Year Plan” period is 6%, which decreases to 0.5% every 5 years. The change rate of the population in the Beijing-Tianjin-Hebei region is too large during the “Twelfth Five-Year Plan” and “Thirteenth Five-Year Plan” period. The base scenario population change rate in this paper is set according to the national population fluctuation, which decreases by 0.5% every 5 years.
From the perspective of total population change, the average natural population growth rate of the Beijing-Tianjin-Hebei region during the 12th Five-Year Plan period was 4.16%, and the average natural population growth rate of the Beijing-Tianjin-Hebei region during the 13th Five-Year Plan period was 3.17%. During the 13th Five-Year Plan period, the population decreased by about 1% every 5 years compared with the 12th Five-Year Plan period, so it is assumed that the population growth rate will decrease by 1% every 5 years until the growth rate drops to 0%.
In terms of economic growth, the GDP growth rate of Beijing-Tianjin-Hebei during the 12th Five-Year Plan period was 9.7%, and the GDP growth rate of Beijing-Tianjin-Hebei during the 13th Five-Year Plan period was 6.8%. Due to the different GDP planning targets in the 14th Five-Year Plan for National Economic and Social Development and the Outline of Long-term Goals for 2035 issued by Beijing, Tianjin and Hebei, and the excessive and unstable changes in the Beijing-Tianjin-Hebei region during the two 5-year periods, this paper basically sets the GDP change rate of the whole country. The national GDP growth rate during the “12th Five-Year Plan” period was 7%, and the national GDP growth rate during the “13th Five-Year Plan” period was 6.5%, so the GDP growth rate was set to decrease by 0.5% every 5 years under the baseline situation.
From the perspective of industrial structure, according to the data of the three traditional industries in Beijing-Tianjin-Hebei from 2010 to 2019, the total output value of the tertiary industry in Beijing, Tianjin and Hebei has accounted for more than 50%, but for Hebei, the proportion of the tertiary industry is similar to the proportion of the secondary industry. Therefore, the setting of the benchmark scenario is still carried out according to the current development mode. This paper forecasts the growth rate of each industry by using the smoothing index method.
From the perspective of energy structure, the supply of raw coal in Beijing-Tianjin-Hebei Province accounts for the largest proportion, and the value is still set according to this energy development mode in the benchmark scenario. This paper uses the smoothing index method in Eviews software to predict the value of relevant years according to the historical development trend.
3.2.4.2 High-quality scenario scheme parameter setting
3.2.4.2.1 Investment growth path
The investment growth path sets the future economic development goals with reference to the 14th Five-Year Plan for National Economic and Social Development and the Outline of 2035 Long-term Goals published by Beijing, Tianjin and Hebei Province, and the government work reports of Beijing, Tianjin and Hebei from 2021 to 2023. In order to actively expand effective investment and give play to the key role of investment in economic development, specific values are set according to the 6.5% annual growth rate of fixed asset investment proposed by Hebei Province. The details are shown in Table 3 below.
3.2.4.2.2 Industrial optimization path
In order to promote the coordinated and healthy development of the Beijing-Tianjin-Hebei economy and coordinate the problems of industrial fault and industrial chain connection between different regions, it is necessary to carry out industrial optimization and transformation. At the same time, industrial transformation and optimization also have a significant impact on carbon emissions, and reducing the proportion of carbon-intensive industries can help reduce the overall carbon emission level. At the same time, industrial optimization to promote the construction of an environmentally friendly supply chain and a circular economy can reduce resource waste and reduce carbon emissions related to resource collection, production and waste gas. For the current Beijing-Tianjin-Hebei region, the proportion of the industrial structure of the three places is very different, Hebei’s tertiary industry is still below 50%, while Beijing’s tertiary industry has accounted for more than 80%. Therefore, in the industrial optimization path, the fixed growth rate of the tertiary industry is set at 5%, and the number of employees in the tertiary industry is set at 5%. The details are shown in Table 4 below.
3.2.4.2.3 Environmental regulation path
Environmental regulation is a system that guides and regulates human activities through laws, policies and standards to ensure that they are acceptable to the environment. In order to solve the externalities caused by environmental pollution and achieve the purpose of protecting the ecological environment, the main target is enterprises or organizations. In this paper, the emission reduction target of the government is used as an indicator to measure environmental regulation. According to the Comprehensive Work Plan for Energy Conservation and Emission Reduction of the 14th Five-Year Plan, “By 2025, Total chemical oxygen demand, ammonia nitrogen, nitrogen oxides and volatile organic compounds emissions will be reduced by 8%, 8%, 10% and more than 10% respectively from 2020.” Therefore, industrial waste gas emissions, industrial solid waste emissions, and industrial wastewater emissions are set to decrease by 2% annually. The details are shown in Table 5 below.
3.2.4.2.4 Population control path
According to the National Population Development Plan (2016–2030) and the three-child policy issued by the government, China’s population will peak in 2030, which is expected to reach 1.45 billion people. From 2010 to 2021, the ratio of the total population of the central Beijing-Tianjin-Hebei region to the total population of the country is about 7.8%, so the total population of the Beijing-Tianjin-Hebei region is expected to be about 113 million in 2030, and the population change will increase year by year during the forecast period. According to the total population of the Beijing-Tianjin-Hebei region in the baseline scenario, which has exceeded the expected value, the total population will be controlled in high-quality development and the population growth scenario will be set. The details are shown in Table 6 below.
3.2.4.2.5 Complex development path
The Beijing-Tianjin-Hebei collaborative development model is a simulation system formed by the interaction of various factors, and a single policy development path will have certain limitations, restricting the optimization of the overall effect. Therefore, in the real development, all kinds of policies should be coordinated and coordinated, and the composite development path can take into account the comprehensive interests of economic, social and environmental development, and realize the simulation of dynamic systems. All parameters in the above high-quality development were analyzed in a composite way to analyze the changing trend of the high-quality coordinated development of Beijing, Tianjin and Hebei.
3.2.5 Analysis of system simulation results
3.2.5.1 Analysis of baseline scenario simulation results
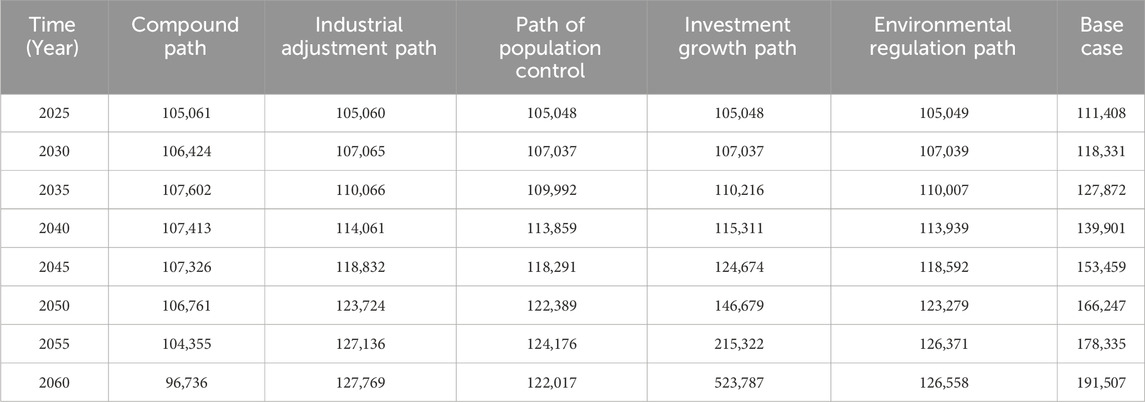
In the baseline scenario, in the simulation system from 2020 to 2060, the population of Beijing-Tianjin-Hebei reaches its peak around 2030, and the population of Beijing-Tianjin-Hebei begins to decline from 2030 to 2060. At the same time, in the forecast year, the economic aggregate of Beijing, Tianjin and Hebei will continue to grow. According to Table 7, in the base scenario, carbon emissions in the Beijing-Tianjin-Hebei region will continue to grow from 2025 to 2060, reaching 1,183.31 million tons in 2030 and 191,507 million tons in 2060. In the baseline scenario, the energy consumption increases gradually. As the energy consumption increases without improving the energy consumption structure at the same time, the carbon emissions continue to increase, and the carbon absorption gap gradually increases because the effect of carbon absorption is not obvious.
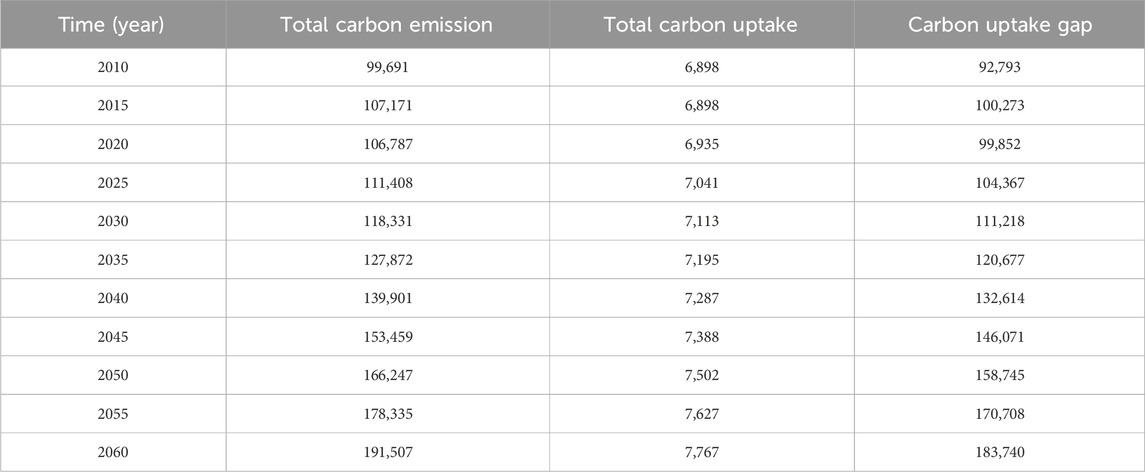
Table 7. Baseline scenario simulation results of Beijing-Tianjin-Hebei “Dual Carbon” target Unit: 10,000 tons.
3.2.5.2 Analysis of high quality development scenario simulation results
3.2.5.2.1 Investment growth path
The investment growth path regulates the relevant parameters according to the requirements of fixed assets in the 14th Five-Year Plan for Beijing, Tianjin and Hebei. The simulation results show that the GDP is expected to reach 19,606.8 billion yuan in 2030 and 332 + 07 million yuan in 2060. In 2025, the average annual GDP growth rate will be 10.31%, which will be able to achieve the target of 6% annual regional GDP growth during the 14th Five-Year Plan period set by the three regions of Beijing, Tianjin and Hebei. It is expected that by 2030, the environmental pollution index will increase by 6.48%, which is the largest increase in the pollution index among the five paths. The total carbon emission will increase to 1,070, 370, 000 tons in 2030, and then show a continuous rise. It can be seen that although the investment growth path has improved the economic development speed of Beijing-Tianjin-Hebei, it still causes the rapid growth of total carbon emission and environmental deterioration.
3.2.5.2.2 Industrial optimization path
According to the simulation results, when the fixed asset investment and the number of employees in the tertiary industry are increased, the GDP growth rate is higher than the benchmark scenario, reaching 196,407 billion yuan in 2030, ranking the second in GDP growth rate. After industrial optimization and adjustment, the total carbon emission and environmental pollution index are both in the third place. It can be seen that the industrial optimization path for Beijing-Tianjin-Hebei can strongly help the total economic development of Beijing-Tianjin-Hebei, and also alleviate the total carbon emission and environmental pollution problems.
3.2.5.2.3 Environmental regulation path
Referring to the “14th Five-Year Plan” emission reduction plan, it can be seen that the degree of environmental pollution has been alleviated under this path, and it is expected that by 2030, it will decrease by 9.54% compared with 2020. It can be seen that the implementation of environmental regulation means to control pollutants and restore the ecological environment has a certain degree of effect. At the same time, the decline in the degree of environmental pollution also makes the GDP growth rate higher than the benchmark development path, but the overall effect is still lower than the other four paths, possibly because the current environmental restrictions on economic development in the Beijing-Tianjin-Hebei region are still acceptable.
3.2.5.2.4 Population control path
In view of the fact that the current population growth rate and total amount of the Beijing-Tianjin-Hebei region have exceeded the plan of the 14th Five-Year Plan period. It is found that the corresponding population control plan has a positive effect on the regional GDP after the slow increase of the population of the Beijing-Tianjin-Hebei region, which reflects the importance of population reduction for the current development of the Beijing-Tianjin-Hebei region. At the same time, when the population growth rate is lower than the baseline scenario, the total carbon emissions of the Beijing-Tianjin-Hebei region decline significantly, showing a peak in 2040 and continuing to decline.
3.2.5.2.5 Complex development path
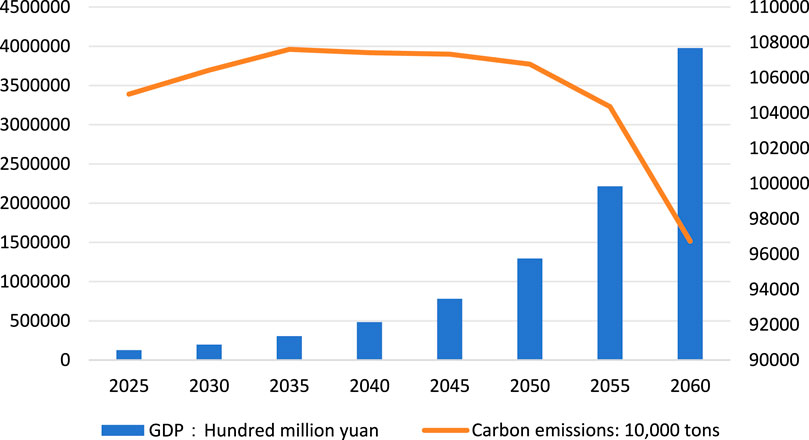
Under the premise of comprehensively considering the overall interests of economy, society, resources and environment, the compound development path creates a comprehensive development path by coordinating four paths: investment growth, environmental regulation, industrial adjustment and population control. According to the simulation results, under the compound path, both the GDP development speed and the final present value are maximum. The effect degree of each path is as follows: compound development path > investment growth path > industrial adjustment path > environmental regulation path > population control path > benchmark scenario. For the total carbon emissions, the composite path shown in Table 8 below can achieve the carbon peak in 2035, and the carbon dioxide emissions show a gradual decline trend after 2035. The other five paths cannot achieve the carbon peak, but they are different in the total carbon dioxide emissions. In terms of total carbon emissions, investment growth path > baseline scenario path > Industrial adjustment path > Environmental regulation path > population control path.
As can be seen from Figure 7, from the simulation values of GDP and total CO2 emission, the total GDP continues to grow in the composite path, while the relative total carbon emission rises first and then declines. The economic aggregate and the total carbon emission show asynchronous changes, and the growth of the economic aggregate and the total carbon emission are decoupled.
4 Discussion and conclusion
4.1 Discussion
According to Cobb-Douglas production function regression, the contribution of total social investment to the economy of the Beijing-Tianjin-Hebei region is the largest, which indicates that total social investment plays a crucial role in the economic development of the Beijing-Tianjin-Hebei region at the present stage. This could mean that investment is one of the main drivers of economic growth and development in the region. Previous scholars paid more attention to the development of technological investment in the Beijing-Tianjin-Hebei region, while the current total social investment is also crucial to the development of the Beijing-Tianjin-Hebei region. Therefore, the government and enterprises may need to further strengthen the guidance and management of investment to ensure that investment can maximize the stable growth and sustainable development of the economy. At the same time, the report also proposed to improve the function of the capital market, increase the proportion of direct financing, and regulate and guide the healthy development of capital in accordance with the law. Local governments should increase investment in infrastructure construction, especially in the fields of environment and energy, so as to enhance the overall competitiveness and development potential of the Beijing-Tianjin-Hebei region. At the same time, private capital is encouraged to participate in investment, and tax incentives and loan support are adopted to guide them toward high-tech, green environmental protection, modern services and other fields.
Faced with the challenge of limited area growth of carbon absorption mode, a series of measures should be taken to improve carbon absorption capacity. Firstly, through optimizing land use, rational planning and management of carbon absorption pathways of existing water areas, cultivated land, green space and forest land, the benefits of carbon absorption can be maximized. For example, measures such as improving soil quality and increasing vegetation coverage can improve the carbon absorption capacity of cultivated land. Second, we will promote ecological restoration, step up efforts to restore and protect natural ecosystems such as wetlands and forests, and improve their capacity to absorb carbon. In addition, it can promote scientific and technological innovation, develop new carbon absorption technologies and methods, and improve the efficiency and scale of carbon absorption.
The composite path in this paper achieves the phenomenon of decoupling economic growth from carbon emissions growth, which is a positive sign, but climate change remains a serious global challenge that requires continued strengthening of climate preparedness, attention to other environmental issues such as water pollution, soil degradation, biodiversity loss and integrated environmental protection measures. Achieve a virtuous cycle of economic development and ecological and environmental protection. Secondly, due to the lag effect of various policies in the process of formulation, there are certain differences between the early and late effects. Therefore, in the actual policy implementation, we should pay attention to both the superposition of policies and the joint effect between policies, build the Beijing-Tianjin-Hebei integrated coordinated development model as soon as possible, and break the administrative barriers to environmental governance.
Based on the above content, green technology innovation should be promoted in the future, and enterprises and research institutions should be encouraged to increase investment in research and development of clean energy and environmental protection technologies, so as to improve resource efficiency and reduce carbon emissions. At the same time, optimize the industrial structure, accelerate the elimination of high-pollution and high-energy consumption industries, develop low-carbon economy and circular economy, and cultivate green industries. In addition, we will strengthen policy coordination, establish and improve cross-departmental and cross-regional policy coordination mechanisms, ensure the effective integration of environmental protection policies and economic development policies, and promote the integrated and coordinated development of the Beijing-Tianjin-Hebei region. It is also important to raise public awareness of environmental protection through education and publicity to promote green consumption and sustainable lifestyles. The establishment of an ecological compensation mechanism will help promote reasonable compensation between ecological protection areas and development areas, so as to encourage all parties to actively participate in ecological and environmental protection. At the same time, we will strengthen environmental monitoring and assessment, establish a sound monitoring system, and regularly evaluate the implementation effects of various policies, so as to adjust and optimize measures in a timely manner and flexibly respond to emerging environmental challenges. Through these comprehensive measures, economic development and ecological protection can be deeply integrated in the future, laying a solid foundation for addressing climate change and environmental issues.
4.2 Conclusion
Based on the system dynamics model, this paper uses Vensim software to simulate the development trend of carbon emission and carbon absorption, and the simulation results are good. The model established in this paper is operable, and also proves the important role of high-quality development under the “dual carbon” goal. Through the simulation analysis of the carbon emission model, the following findings are obtained:
First of all, through Cobb-Douglas production function regression, we can see that the total driving force of Beijing-Tianjin-Hebei economic development is still reflected in capital input, indicating that Beijing-Tianjin-Hebei may still be in the stage of rapid industrial development. At present, the contribution of capital input to production is more prominent, and the economy is still in the process of rapid capital accumulation and technological transformation. In the future, the coordinated development of Beijing-Tianjin-Hebei may need to rely more on technological innovation, labor force upgrading and other factors to drive economic growth.
Secondly, the difference in the effect of carbon emission reduction in Beijing, Tianjin and Hebei under the baseline scenario and high-quality development scenario makes us refocus on the relationship between economic development and carbon emission reduction, and future research should start from the three directions of green development, regional coordinated development and high-quality development. Only by analyzing the relationship and mechanism between the three can the emission reduction be implemented effectively.
Third, in the high-quality development scenario, carbon emissions will decline after the carbon peak, and the growth of economic aggregate and the development of total carbon emissions will be decoupled. This indicates that the Beijing-Tianjin-Hebei region as a whole has entered the stage of sustainable development in the simulation period, and it is very important to share responsibilities among the three regions in the real situation. Future studies can start from the emission reduction undertaken by various regions in the Beijing-Tianjin-Hebei region under the decoupling of carbon emissions and economic growth, and optimize regional coordinated development policies.
Data availability statement
The original contributions presented in the study are included in the article/supplementary material, further inquiries can be directed to the corresponding author.
Author contributions
WY: Writing–review and editing. YH: Writing–original draft.
Funding
The author(s) declare that no financial support was received for the research, authorship, and/or publication of this article.
Conflict of interest
The authors declare that the research was conducted in the absence of any commercial or financial relationships that could be construed as a potential conflict of interest.
Publisher’s note
All claims expressed in this article are solely those of the authors and do not necessarily represent those of their affiliated organizations, or those of the publisher, the editors and the reviewers. Any product that may be evaluated in this article, or claim that may be made by its manufacturer, is not guaranteed or endorsed by the publisher.
References
Baranzini, A., Goldemberg, J., and Speck, S. (2000). A future for carbon taxes. Ecol. Econ. 32 (3), 395–412. doi:10.1016/s0921-8009(99)00122-6
Chen, M., Wang, Z., and Qian, L. (2022). Convergence test of high-quality development under the integration of beijing-tianjin-hebei. Chin. J. Popul. Sci. 210 (03), 86–98+128.
De Haas, R., and Popov, A. (2023). Finance and green growth. Econ. J. 133 (650), 637–668. doi:10.1093/ej/ueac081
Deng, J., Chen, T., and Zhang, Y. (2023). Effect of collaborative innovation on high-quality economic development in beijing–tianjin–hebei urban agglomeration—an empirical analysis based on the spatial durbin model. Mathematics 11 (8), 1909. doi:10.3390/math11081909
Dong, H. (2022). Measurement of high-quality development level of urbanization: based on the empirical study of the beijing-tianjin-hebei city cluster. Statistics and Decis. 38 (04), 93–97. doi:10.13546/j.cnki.tjyjc.2022.04.018
Fang, J. (2018). An analysis of the differentiation rules and influencing factors of venture capital in Beijing-Tianjin-Hebei urban agglomeration. J. Geogr. Sci. 28, 514–528. doi:10.1007/s11442-018-1487-8
Guo, D., Wang, D., and Zhong, X. (2022). Evaluation of high-quality development level and diagnosis of obstacle factors in beijing-tianjin-hebei. Statistics and Decis. 38 (15), 122–126. doi:10.13546/j.cnki.tjyjc.2022.15.023
Guo, Q., Su, Z., and Chiao, C. (2021). Carbon emissions trading policy, carbon finance, and carbon emissions reduction: evidence from a quasi-natural experiment in China. Econ. Change Restruct. 55, 1445–1480. doi:10.1007/s10644-021-09353-5
Huang, Q., and Gao, M. (2016). A research on the energy conservation and emission reduction effect of China’s environmental regulation tools. Sci. Res. Manag. 37 (06), 19–27. doi:10.19571/j.cnki.1000-2995.2016.06.003
Li, W., and Yuan, Z. (2023). Has beijing-tianjin-hebei integration promoted high-quality development? A policy evaluation based on regression control method. J. Technol. Econ. 42 (07), 77–93.
Li, G., Chen, X., and You, X. (2023). System dynamics prediction and development path optimization of regional carbon emissions: a case study of Tianjin. Renew. Sustain. Energy Rev. 184, 113579. doi:10.1016/j.rser.2023.113579
Li, W., Song, H., Dong, F., and Li, F. (2022). The high-quality development in Beijing-Tianjin-Hebei regions: based on the perspective of comparison. Procedia Comput. Sci. 199, 1244–1251. doi:10.1016/j.procs.2022.01.158
Lin, B. (2022). China's high-quality economic growth in the process of carbon neutrality. Econ. Res. J. 57 (01), 56–71. doi:10.1515/cfer-2022-0020
Lin, B., and Zhu, J. (2019). Impact of energy saving and emission reduction policy on urban sustainable development: empirical evidence from China. Appl. Energy 239, 12–22. doi:10.1016/j.apenergy.2019.01.166
Liu, H., Shi, Y., Guo, L., and Qiao, L. (2022). China's energy reform in the new era: process, achievements and prospects. J. Manag. World 38 (07), 6–24. doi:10.19744/j.cnki.11-1235/f.2022.0098
Liu, L., Gao, C., and Wang, W. (2023). The high-quality coordinated development of the beijing-tianjin-hebei region: evolution cause, power mechanism, and future prospects. J. Beijing Adm. Inst. 5, 61–71. doi:10.16365/j.cnki.11-4054/d.2023.05.004
Liu, L. Y., Zheng, B. H., and Bedra, K. B. (2018). Quantitative analysis of carbon emissions for new town planning based on the system dynamics approach. Sustain. Cities Soc. 42, 538–546. doi:10.1016/j.scs.2018.08.006
Liu, Y., Li, Y., and Wang, W. (2021). Challenges, opportunities and actions for China to achieve the targets of carbon peak and carbon neutrality. China Population. Resour. Prospects 31 (09), 1–5.
Luo, J., Zhuo, W., Liu, S., and Xu, B. (2024). The optimization of carbon emission prediction in low carbon energy economy under big data. IEEE Access 12, 14690–14702. doi:10.1109/access.2024.3351468
Ran, C., and Zhang, Y. (2023). The driving force of carbon emissions reduction in China: does green finance work. J. Clean. Prod. 421, 138502. doi:10.1016/j.jclepro.2023.138502
Ren, Y., and Fu, J. (2019). Research on the effect of emissions trading on emission reduction and green development. China Popul. Resour. Environ. 29 (05), 11–20.
Sun, J., Lu, Y., and Yi, S. (2020). A study on the beijing-tianjin-hebei industrial collaboration from the perspective of high-quality development. J. Beijing Adm. Inst. 130 (06), 20–29. doi:10.16365/j.cnki.11-4054/d.2020.06.003
Tian, W., Li, W., Song, H., and Yue, H. (2022). Analysis on the difference of regional high-quality development in Beijing-Tianjin-Hebei city cluster. Procedia Comput. Sci. 199, 1184–1191. doi:10.1016/j.procs.2022.01.150
Wen, Y., and Yang, Y. (2022). Coordinated development evaluation and spatial reconstruction of beijing-tianjin-hebei region under the background of high-quality development. Econ. Manag. 36 (02), 8–18.
Weng, Z., Wu, Y., and Li, B. (2021). Impact of differentiated industrial carbon taxes on China's economy and environment. China Popul. Resour. Environ. 31 (03), 75–86.
Wu, J., Xu, M., and Ma, Y. (2016). Environmental assessment, public participation and governance effectiveness: evidence from the Chinese provinces. Chin. Public Adm. 375 (09), 75–81.
Wu, X., Guo, C., and Yi, X. (2022). A study on China's economic and social development under the carbon peaking target and carbon neutrality vision. Macroeconomics 282 (05), 5–21. doi:10.16304/j.cnki.11-3952/f.2022.05.003
Yang, L., Zhu, J., and Jia, Z. (2019). Influencing factors and current challenges of CO2 emission reduction in China: a perspective based on technological progress. Econ. Res. J. 54 (11), 118–132.
Yuan, X., Geng, H., Li, S., and Li, Z. (2022). The status, challenges and countermeasures of the “double carbon goal realization” in Chinese cities from the perspective of high-quality development. J. Xi’an Jiaot. Univ. Soc. Sci. 42 (05), 30–38. doi:10.15896/j.xjtuskxb.202205004
Yufeng, W. (2022). Analysis on the evolution of spatial relationship between population and economy in the Beijing-Tianjin-Hebei and Shandong region of China. Sustain. Cities Soc. 83, 103948. doi:10.1016/j.scs.2022.103948
Zeng, P., Xu, W., and Huang, L. (2022). SD model and simulation of high-quality development of China’s urban agglomeration under “dual carbon” goals. J. Hohai Univ. Philosophy Soc. Sci. 24 (05), 52–61+129.
Zhang, G., Fan, M., and Ma, R. (2022). Effects of the carbon emission trading policy on collaborative emission reduction. China Popul. Resour. Environ. 32 (03), 1–10. doi:10.12062/cpre.20211108
Keywords: “dual carbon” target, Beijing-Tianjin-Hebei region, SD model, carbon emission reduction, predictive simulation
Citation: Yang W and Hei Y (2024) Research on the high-quality development of Beijing-Tianjin-Hebei region based on SD model under the constraint of “dual carbon” target. Front. Environ. Sci. 12:1414688. doi: 10.3389/fenvs.2024.1414688
Received: 15 April 2024; Accepted: 04 November 2024;
Published: 21 November 2024.
Edited by:
Reetu Verma, University of Wollongong, AustraliaReviewed by:
Otilia Manta, Romanian Academy, RomaniaMohamed R. Abonazel, Cairo University, Egypt
Lindong Ma, Zhejiang Normal University, China
Copyright © 2024 Yang and Hei. This is an open-access article distributed under the terms of the Creative Commons Attribution License (CC BY). The use, distribution or reproduction in other forums is permitted, provided the original author(s) and the copyright owner(s) are credited and that the original publication in this journal is cited, in accordance with accepted academic practice. No use, distribution or reproduction is permitted which does not comply with these terms.
*Correspondence: Weiwei Yang, eWFuZ3d3QGJqdXQuZWR1LmNu
 Weiwei Yang*
 Yingying Hei