 Daniel Pinillos1,2*
 Paulina Reyes1
 Valeria Barrera1Pedro Pineda1
 Juan Miguel Goyzueta1,3
 Rogier Schulte4
 Juan-Pablo Castaneda1
- 1Instituto de Investigación en Ciencias Naturales y Tecnología (Iarna), Universidad Rafael Landívar (URL), Guatemala City, Guatemala
- 2Inter-American Institute for Global Change Research (IAI), Clayton, Panama
- 3Fideres Partners LLP, Madrid, Spain
- 4Farming System Ecology Group, Wageningen University and Research, Wageningen, Netherlands
Economic performance is traditionally assessed through the System of National Accounts (SNA), with Gross Domestic Product (GDP)—the annual aggregated market value of a country’s goods and services—as its most widely used indicator. However, economic sectors depend on resources and ecosystem services, placing pressures on ecosystem assets and biodiversity. It is well established that the SNA does not account for these complex interactions between economic activities and environmental systems. Accordingly, assessing the dependencies of economic sectors on ecological functions and natural resources is critical to support informed policy and decision-making. This study addresses this gap through a national case study in Guatemala, applying the System of Environmental-Economic Accounting (SEEA) framework. We employed the Integrated Valuation of Ecosystem Services and Tradeoffs (InVEST) suite of models to estimate water provision and sediment retention as key ecosystem services, alongside sediment export as a landscape disservice, at the river basin level. Official statistics, land use and land cover (LULC) data, and nighttime lights imagery were integrated to estimate GDP per basin. Based on these estimations of ecosystem services, disservices, and GDP per basin, we conducted a cluster analysis of Guatemala’s 62 basins, which resulted in five distinct typologies: (1) Boca-Costa and southeastern basins, (2) Metropolitan-highly urbanized basins, (3) Dry shrubland basins, (4) Forested upland basins with low economic activity and (5) Forested lowland basins with low economic activity. We propose these clusters as Ecosystem Accounting Areas (EAAs) under the SEEA framework. Finally, we developed water use intensity indicators per sector within each EAA. This integrated approach with ecological and economic data provides valuable insights for territorial governance and landscape multifunctionality at multiple scales in Guatemala.
1 Introduction
Human economic systems are intrinsically dependent on natural ecosystems. Economic growth, characterized by increased consumption of natural resources and energy, often results in significant environmental degradation, including air, soil, and water pollution; deforestation; habitat destruction; biodiversity loss; and depletion of essential natural resources (Mittal and Gupta, 2015; Wiedmann et al., 2020). This environmental impact is reflected in the current transgression of six out of nine planetary boundaries: novel entities, biogeochemical flows, freshwater use, land system change, biosphere integrity, and climate change (Richardson et al., 2023; Steffen et al., 2015). These dynamics underscore the fundamental tension between the economy’s reliance on ecological systems and its role in driving environmental disruption, raising critical questions concerning the compatibility of perpetual economic growth with ecological sustainability (Hueting, 2010; Kosoy et al., 2012; Schneider et al., 2010; van den Bergh and Kallis, 2012).
Within sustainability science and ecological and political economics, this tension can be framed as a debate between the arguments of ecomodernism and degrowth. Ecomodernism argues that technological innovation and continued economic growth can mitigate ecological crises by decoupling economic activity from environmental degradation. The ecomodernist and decoupling perspectives highlight the possibility of implementing pathways for sustainability through technological innovation and resource management (Asafu-Adjaye et al., 2015; Ellis et al., 2023; UNEP, 2011). From this perspective, navigating the Anthropocene requires aligning technological innovation, pragmatic efficiency, and ecological vigilance to chart a course toward a sustainable and equitable future. Degrowth, by contrast, emphasizes the necessity of scaling back economic activity to remain within planetary boundaries, arguing that ecomodernism underestimates ecological limits. Degrowth proponents argue that economic growth is fundamentally incompatible with ecological sustainability and social equity (Kallis, 2011; Kallis et al., 2012; Schneider et al., 2010; van den Bergh and Kallis, 2012). According to this perspective, technological optimism and decoupling strategies are insufficient to address the scale of ecological crises, and alternative measures of success beyond GDP, focusing on wellbeing, ecological health, and social equity, are required to envision sustainability pathways in the Anthropocene (Parrique, 2019; Parrique et al., 2019).
Additional considerations emerge in this debate due to the differing implications for Global North and Global South countries (Hickel, 2021b; Lang, 2024). In the context of Global North countries, degrowth primarily addresses overconsumption and excessive resource use, advocating for reduced material throughput to achieve sustainability (Hickel, 2021b). On the other hand, mainstream economic discourses argue that economic growth is a prerequisite for development, poverty alleviation, and access to essential services in the Global South (de la Fuente, 2016; Mulok et al., 2012; Rodrik, 2000; Yusuf et al., 2023). Furthermore, it has been noted that the development and application of technologies and narratives associated with both degrowth and ecomodernism could perpetuate global inequities and colonialism by externalizing environmental harm while concentrating on the associated benefits in wealthy regions (Hickel, 2021a; Paulson, 2024; Schmelzer and Nowshin, 2023). These considerations underscore the complex and nuanced challenges of reconciling global development and ecological sustainability within a shared framework.
This study is situated within the context of this debate, focusing on analyzing economic activities concerning the biophysical space in which they occur, specifically at the basin level. The research is conducted in Guatemala, a country with a total area of 108,889 km2 and a population of approximately 17 million, accounting for roughly 0.1% of global GDP. Guatemala is classified as a middle-income country and represents the largest economy in Central America, with a GDP of US$80 billion in 2022 and a per capita GDP of US$8,000 (World Bank, 2024). Guatemala’s economy rebounded from the COVID-19 pandemic and a 1.5% decrease in 2020 to growth rates of 8% in 2021, 4.1% in 2022, and 3.5% in 2023 (World Bank, 2024). Remittances, estimated to account for 17% of Guatemala’s GDP, contribute to macroeconomic stability but have not contributed significantly to reducing poverty, which affects 55% of the population; simultaneously, the informal economy is estimated to amount to 49% of the GDP (World Bank, 2024). In terms of social indicators, Guatemala’s Human Capital Index (0.46 in 2020) is significantly below the Latin American average; additionally, a child malnutrition rate of 47% ranks Guatemala among the highest globally, while Indigenous Guatemalan women remain one of the most socially and economically excluded groups in the world (Arriaza et al., 2022).
On the other hand, Guatemala is recognized as one of the Convention on Biological Diversity’s (CBD) mega-biodiverse countries due to its exceptional levels of endemism and biodiversity (https://www.cbd.int/countries/profile?country=gt). Its geographical location and geomorphology make it one of the world’s most vulnerable nations to climate change and extreme weather events (Castellanos et al., 2022). This intrinsic vulnerability is compounded by institutional and socioeconomic challenges, including weak governance and institutions, low public investment, and high corruption levels, which marginalize much of the population and limit access to essential public services (Pérez Irungaray et al., 2020). Amid these systemic challenges, 60% of Guatemala’s population is under 30 years old, whereas by 2032, 64% of the population is expected to live in urban areas, adding 6 million people to cities (INE, 2021; Segeplan, 2019).
Guatemala’s combination of exceptional biodiversity, diverse ecosystems, intrinsic vulnerability to climate change, significant socioeconomic and institutional challenges, macroeconomic stability, and a dynamic economic system underscores its relevancy for examining pathways to sustainable economic growth. This potential becomes particularly evident when recognizing the critical importance of integrating autochthonous, Indigenous, and traditional knowledge with policymaking and scientific research. Such integration is essential for developing innovative approaches to address contemporary regional and global sustainability challenges (Fenelon and Alford, 2020; Helland, 2022; Mazzocchi, 2020). With its rich history of Maya civilization spanning centuries and a population that is 60% Indigenous, Guatemala holds significant relevance and responsibility within the Central American and Latin American regions to advance the integration of Indigenous and traditional knowledge into science, policymaking, and territorial governance (Destiche, 2024; Silburt, 2019). With careful contextualization, Guatemala’s characteristics can provide valuable lessons for other countries in Latin America, the Global South, and the Global North, promoting more inclusive, adaptive, and context-sensitive strategies for addressing shared global challenges.
2 Conceptual framework and research questions
To analyze the economy’s dependency on and impacts on the environment in Guatemala, we integrate economic and ecosystem service data with spatially explicit information from the conceptual perspective of the System of Environmental-Economic Accounting-Ecosystem Accounting (SEEA-EA) (United Nations, 2021). By integrating environmental data into national accounting frameworks, SEEA provides a comprehensive view of the interactions between the economy and the environment. This integration enables governments to identify trends, track natural resource stocks and flows (such as energy and water usage), and develop policies that promote sustainable resource management (United Nations, 2014). The SEEA Central Framework, recognized as the international statistical standard, offers standardized concepts and classifications, ensuring consistency across environmental and economic reporting (United Nations, 2014). Furthermore, SEEA EA expands this approach by incorporating ecosystem services into economic assessments, strengthening its relevance in sustainability-focused policymaking (World Bank, 2024). The integration of SEEA into national accounts also enhances data reliability and comparability, which is essential for effective environmental governance (Vardon et al., 2018).
The SEEA-EA aims to integrate natural capital and ecosystem services (ES) into national accounting systems, which traditionally focus on financial and physical assets alone (Hein et al., 2015; United Nations, 2021). A core element of this framework is the application of accounting concepts to ecosystem assessments, focusing on ES and the benefits ecosystems provide to the economy and society. The SEEA characterizes the relationship between the economy and nature as 1) stocks and variables comprising ecosystem assets, 2) intra- and inter-ecosystem flows of provisioning, regulating, cultural, and abiotic services emerging from the ecosystem’s ecological functionality, and 3) the accountable and non-accountable set of benefits (i.e., goods and services) that make use of those ES’s flows. More specifically, the SEEA-EA focuses on the flows of ES and complements the SEEA-Central Framework by analyzing the relationship between the economy and the environment in terms of the flows of ES that enter the economy to produce goods and services (United Nations, 2014; 2021).
The SEEA-EA also allows tracking changes in ecosystem assets over time at different scales to support policy-making through five measurements: 1) the extent and condition of ecosystems to assess the biophysical environment in terms of ecosystem assets and abiotic resources; 2) the ecosystem’s capacity to generate a particular ES as a function of extent and condition to a maximum level without degradation; 3) intra- and interflow of ES; 4) the connection between ecosystems and economic activity in terms of inputs for producing goods and services; and 5) ecosystems and biodiversity (Hein et al., 2015; United Nations, 2014).
Specifically for water accounting, the SEEA-EA provides a structured framework to integrate ES into water policy and management. By organizing data on water-related ES, such as water supply, purification, and soil retention, it connects ecosystems’ contributions to economic activities, supporting water resource management. The SEEA-EA addresses common policy issues like water security, quality, and soil erosion, offering consistent, policy-relevant information. The approach enhances transparency, identifies data gaps, and supports informed decision-making by stakeholders, aligning with global standards like SDG 6 and OECD Water Governance Principles (Chen and Vardon, 2024).
In Australia, for instance, the Australian Bureau of Statistics (ABS) and Bureau of Meteorology (BoM) produce national water accounts aligned with SEEA-Water and developed integrated accounts for Canberra (Chen and Vardon, 2024). Australia stands out for its long-standing and institutionalized water accounting practices led by ABS and BoM. The Netherlands has integrated water accounts with the EU Water Framework Directive, providing national and river basin scale data. Spain, Greece, and England applied SEEA-based water accounts to support water policy and cost recovery analyses. The United States launched a phased strategy for environmental-economic accounting, including water (Vardon et al., 2025). Other notable cases include Finland, which applied SEEA for national water accounts, and Iran, which applied SEEA to assess water security in the Rafsanjan Plain (Chen and Vardon, 2024). A recent global review analyzed 271 water accounts from 67 countries across various regions, income levels, and water stress contexts (Vardon et al., 2025). The Philippines, Botswana, and Namibia also illustrate water accounts’ role in addressing water security and governance challenges. Most countries face challenges in maintaining regular data production, ensuring data quality, and integrating data into decision-making processes (Vardon et al., 2025). However, these case studies illustrate the flexibility of SEEA in addressing diverse water management and policy challenges across varying ecological and institutional contexts.
In Guatemala, previous studies have focused on assessing the extent and condition of ecosystems to evaluate ecosystem assets in monetary terms (measurement 1) (Banco Mundial et al., 2021; Banguat and URL, 2009). This study focuses on linking the economy and ecosystems (measurement 4) to further develop the application of this framework in Guatemala. The research questions guiding this study are as follows:
1. How are economic activities, land use, landscape biophysical characteristics, and water-related ecosystem services spatially interconnected within Guatemala?
2. To what extent does Guatemala’s national economy depend on water-related ecosystem services provided by the landscape’s biophysical characteristics?
3. What territorial governance processes and land use planning mechanisms can effectively minimize trade-offs between ecosystem services and economic activities to reduce systemic vulnerability?
This study aims to link economic and environmental variables through a landscape approach (Arts et al., 2017) to reinterpret the economic system’s dependency on ecosystem functioning and emerging ES. Water-related ecosystem (de)services as defined in this study (i.e., runoff water as provisioning ES; sediment retention as regulating ES; exported sediment, i.e., sediment reaching streams; and deposited sediment, i.e., sediment that moves within the landscape but does not reach streams) are intricately linked to the hydrological cycle and are particularly relevant in Guatemala due to its dense network of water bodies, frequent extreme climatic events causing infrastructure and human losses, high levels of pollution in all water bodies, inadequate water collection and channeling infrastructure, significant hydropower potential, increasing water scarcity, and widespread food insecurity and child malnutrition (Carrera and Mosquera, 2023; Funcagua, 2022; IARNA-URL, 2011; 2012; Incyt URL, 2018; Isaac et al., 2023). We use the basin as the fundamental analytical spatial unit to capture the morphological and topographical factors that shape hydrological processes and their influence on economic activities.
The results of this study can inform governance processes related to land use planning, landscape multifunctionality, and territorial governance while reducing systemic vulnerability. Our findings can also offer insight into sectoral investments for landscape restoration, such as soil, forest cover, and water body rehabilitation. These initiatives require considering landscapes’ structure and ecological functionality as these transcend political boundaries like municipalities or states (Bürgi et al., 2022; Hersperger et al., 2021). Thus, analyzing the economy at the basin level highlights the urgent need to align human activities with the biophysical characteristics of land systems and the carrying capacity of ecosystems. This approach emphasizes the importance of nature and ecological functioning as the foundational substrate for all economic and human activities.
3 Materials and methods
To answer the research question of this study, we followed four steps: 1) we applied the Integrated Valuation of Ecosystem Services and Tradeoffs (InVEST) suite of tools (Sharp et al., 2020; Sharp et al., 2014) to quantify the supply of runoff water (m3) and sediment retention (T) as ES and deposited and exported sediment (T) as landscape disservices per basin; 2) we used nighttime light (NTL) imagery (Chen and Nordhaus, 2011; Sutton et al., 2007; Tilottama et al., 2010) and land use and land cover (LULC) maps to disaggregate national GDP (US$) per basin; and 3) we performed a cluster analysis to group Guatemala’s basins (n = 62) according to results from steps 1 and 2. Finally, 4) we generated a Table of supply and water use, as well as water use intensity indices per each one of the basin types we derived in step 3. Our analysis captures a snapshot of the economy in 2020, the most recent year, with complete data for the four step-process. This year was atypical, with the economy contracting by 1.5% due to the COVID-19 pandemic. Sectors such as telecommunications, finance, health services, agriculture, and real estate did not experience a decline (Cámara de Industria de Guatemala and Banco de Guatemala, 2020). As agricultural GDP estimations relied on land use and land cover (see Section 3.2), which remained stable, the spatial distribution of economic activities stayed consistent. Furthermore, given the reduced economic size in 2020, our results may underestimate the demand for ecosystem services and their impact on natural capital. Our InVEST model outputs are used as proxies for ecosystem services, specifically for water supply and sediment retention. Although we acknowledge the absence of use-side information regarding the actual allocation and consumption of these services, the model provides a practical approach to estimating their biophysical availability. Therefore, InVEST offers a standardized method to approximate these values at a national scale.
3.1 Modeling the supply of runoff water and sediment retention with InVEST
The InVEST modeling package (Sharp et al., 2020; Sharp et al., 2014) is a suite of tools that quantify and map ecosystem services (ES), taking spatially explicit environmental data as inputs. The InVEST hydrological models are based on simplified but well-known hydrological relationships that break down the landscape into pixels according to the scale of the input data; calculations are, therefore, provided at the pixel level as GIS maps, along with the corresponding tabular data (Vigerstol and Aukema, 2011). InVEST has been applied in different parts of the world at basin, national, and regional scales to assess trade-offs between ecosystem services and LULC changes (Benra et al., 2021; McMahon et al., 2022; Pechanec et al., 2018; Xiang, 2018; Zarandian et al., 2018; Zhang et al., 2017).
3.1.1 Quantifying runoff water with the InVEST water yield model
The InVEST Water yield (WY) model quantifies the relative yield of each basin as a function of land use change and precipitation. The WY model determines the amount of water leaving each pixel as precipitation minus the fraction of water that undergoes evapotranspiration. The model does not distinguish between surface runoff, subsurface flow, and baseflow, and it assumes that all water yield from a pixel reaches the point of interest through one of these pathways. The model then sums and averages water volume at the basin level. The pixel-scale calculations represent key drivers for water yield, such as precipitation, soil type, vegetation type, or land morphology. Although the model was initially designed to estimate hydropower production, the information to quantify runoff water helps analyze the contribution of the landscape to supply surface water (Natural Capital Project, 2022).
The WY model is based on the Budyko curve and average precipitation to estimate the amount of potential water yield per pixel (Sharp et al., 2020). The model estimates evapotranspiration, AET (x), and subtracts it from the total amount of precipitation water, P(x), that a pixel receives:
where Y(x) represents the total annual water yield (Y) for each grid or pixel square of the basin (x), P represents the total basin annual rainfall, and AET represents the total basin annual actual evapotranspiration.
The model estimates AET from potential evapotranspiration (PET) based on Budyko (1974) and adapted by Zhang et al. (2004); PET is estimated as the product of reference evapotranspiration and crop coefficients for each pixel (see Sharp et al., 2015, 2020 for further details).
InVEST requires biophysical input parameters as a georeferenced raster. We obtained these from various sources (see Table 1). All data are for the year 2020. Regarding the 2020 LULC map from the Ministry of Environment, we used level 4 of this map and reclassified it where necessary to simplify the analysis into 15 LULC classes (Table 2). Additional tabular data required by the model included rooting depth and plant evapotranspiration coefficients (Kc) obtained from Allen et al. (1998). Regarding the water volume estimated using this model, we acknowledge that it includes water that may not necessarily enter an economic process as defined by the SEEA. However, our justification for using this model is that the portion of water volume that does not enter an economic process, such as water lost to infiltration, is nevertheless essential for all human activities, even if it is not directly used to produce accountable goods and services. This underscores the need for new metrics that go beyond GDP or the inclusion of such benefits through mechanisms like payment for ecosystem services schemes.
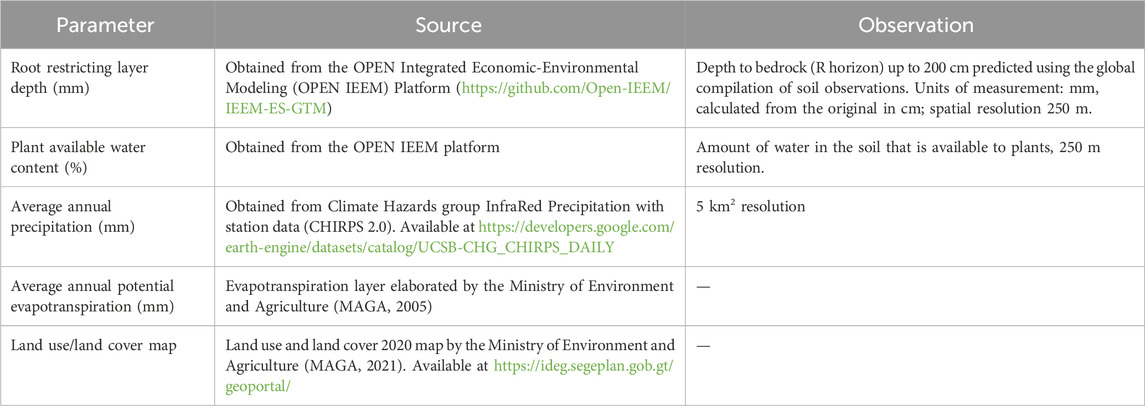
Table 1. Parameters required by the InVEST water yield model and data sources.
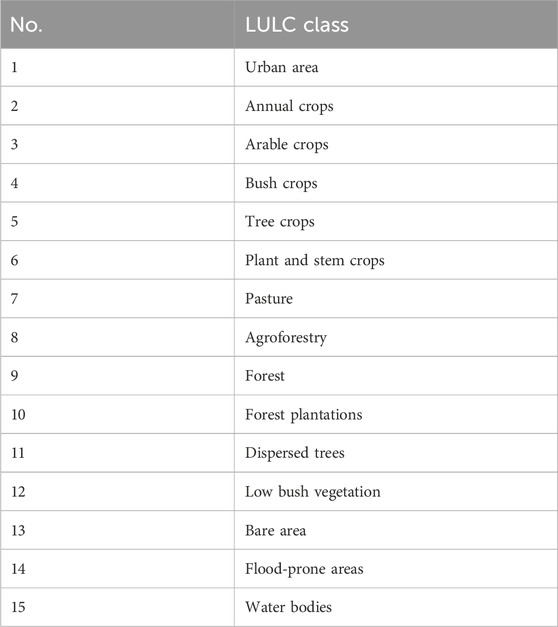
Table 2. Land use and land cover classes used to quantify ecosystem services and GDP per basin.
3.1.2 Quantifying sediment retention and exported sediments using the InVEST sediment retention model
In order to apply this model, we adopted the assumption that the service of retaining sediment indirectly supports economic activities by maintaining soil productivity, infrastructure integrity, and water quality. Even though sediment retention does not translate directly into measurable economic outputs, its role in preserving ecosystem function justifies its inclusion in the analysis as a proxy for a supporting service to the economy. We quantified sediment retention (T) as a regulating ecosystem service (i.e., avoided sedimentation). The InVEST Sediment Delivery Ratio (SDR) model also provides results on exported (i.e., the sediment that is not retained by the landscape and reaches the stream) and deposited (sediment eroded into the basin and retained by vegetation and topography) sediment as disservices of the landscape due to land cover conditions. Thus, we applied the SDR to estimate the amount of sediment exported to water bodies and the sediment retained by the land within basin boundaries at pixel scale. The model assumes that sediment flows into the stream regardless of location and focuses only on surface erosion; it does not model gully, bank, or mass erosion. To quantify sediment export and retention, the SDR applies the revised universal soil loss equation (RUSLE) and a sediment delivery ratio factor (SDRi) to estimate the sediment delivered per pixel. USLEi calculates the total sediment export per pixel as a function of rainfall erosivity (Ri), soil erodibility (Ki), slope length gradient factor (LSi), crop management factor (Ci), and supporting practice factor (Pi) (Natural Capital Project, 2022). The SDR factor for each pixel is a function of the connectivity index (Ci), which is affected by upslope factors. The SDR model follows the approach developed by Borselli et al. (2008), which applies the RUSLE equation. The model considers hydrologic connectivity and land cover changes within the landscape when estimating the total amount of sediment exported to streams. Furthermore, parameters IC0 and kb define the relationship between the connectivity index and the SDR (Natural Capital Project, 2022).
First, the amount of annual soil loss per pixel (i) is estimated using the RUSLE equation as follows:
where Ri represents rainfall erosivity in M J * mm (ha* hr * yr)−1, Ki represents soil erodibility in ton * ha * hr (M J * ha * mm)−1, LSi represents the slope length gradient factor (unitless), Ci represents the cover management factor (unitless), and Pi represents the support practices factor (unitless).
Sediment export (Ei) is then estimated as the amount of sediment eroded from pixel i that reaches the stream:
SDRi is the sediment retention ratio for pixel i, derived from a conductivity index (IC) and a maximum theoretical sediment retention ratio of 0.8. Avoided export of sedimentation (AEXi) refers to the vegetation’s contribution in reducing erosion from a pixel originating upslope, i.e., from pixel i, thereby preventing sediment from entering the stream. This avoided export into the streams indicates the ecosystem service, quantified as the total sediment retained on pixel i from the perspective of downstream water users:
where AEXi represents total sediment retention provided by a given pixel, accounting for both on-pixel and upslope contributions. RKLS represents the benefits of vegetation and good management practices (i.e., USLE minus cover and practice factors c and p), which, together with SDRi, quantify the amount of erosion prevented from entering the stream. Ti represents the amount of upslope sediment that is trapped on pixel i.
Finally, default values were assigned to the remaining parameters according to Borselli et al. (2008): K parameter (2), ICo (0.5), maximum SDR value (0.8), and maximum L value (122). Additional data inputs and sources are specified in Table 3.
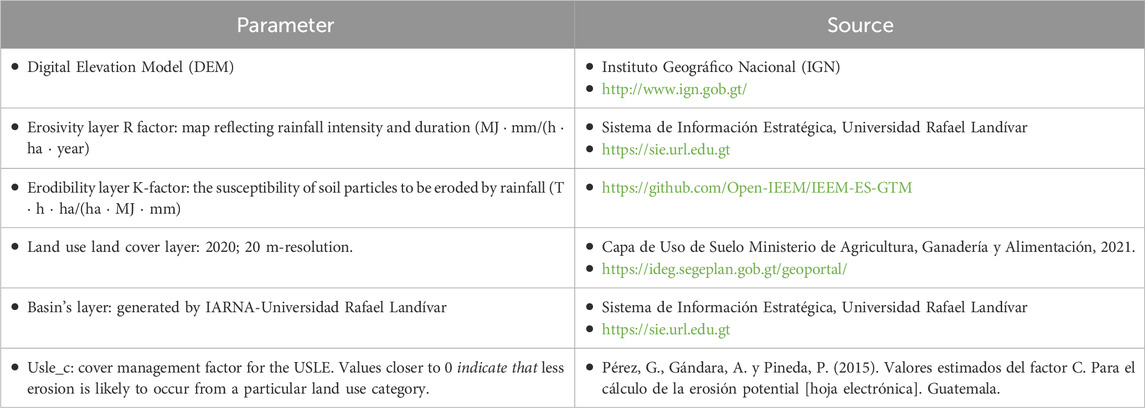
Table 3. Data inputs required by the InVEST Sediment retention model and sources.
3.2 Estimating economic activities at the basin level
To estimate economic activities at the basin level, we spatially disaggregated national GDP figures reported by Guatemala’s Central Bank (Banguat) and identified areas where specific economic activities occur, based on NTL imagery and LULC classes. First, we obtained official economic data reported by Banguat in its Supply and Use Table (SUT) for 2020, with a base year of 2013. We used 2020 to match the more recent LULC map the Ministry of Agriculture produced. The Guatemalan SUT offers a detailed picture of the economy by providing the elements of the production process, the use of the goods and services (products), and the income generated in that production. In the SUT, columns represent economic activities and other transactions, while rows display corresponding products. On the supply side, the columns present production at basic values, detailed in groupings of market production industries, production for own final use, and other non-market production, with a breakdown into 143 activities at its most detailed level (classified by ISIC). Additionally, imports have been disaggregated into imports of goods and services. The rows display products and product groups, with up to 217 products at the most detailed level. The use side is recorded at purchaser prices. It contains, in the columns, intermediate consumption by industries and the components of final demand, while in the rows, it displays products (and product groups). Additionally, the use side presents exports disaggregated into goods and services and columns corresponding to final consumption expenditure, which has been broken down into household consumption, non-lucrative industries consumption, and individual and collective government consumption. This side includes three columns for gross capital formation: gross fixed capital formation (GFCF), changes in inventories, and acquisitions less disposals of valuables. The gross value-added table disaggregates national income by economic activity, with the sum of value-added plus net taxes representing the total annual GDP, which serves as the basis for our analysis.
We conducted a two-fold process to spatially disaggregate economic activities and corresponding products that made up the national GDP in 2020. Since NTL cannot account for agricultural activities in rural areas with no or low luminosity, we separated agricultural and non-agricultural economic activities (i.e., industrial activities). Therefore, the economic contribution of agricultural activities was estimated based on land use and land cover patterns at the national scale. In contrast, the contribution of non-agricultural activities was based on nighttime light imagery. Following other studies (Elvidge et al., 2009; Sutton et al., 2007; Tilottama et al., 2010), we split, i.e., agricultural and non-agricultural economic activities, land uses, and land cover, to generate corresponding separate databases from the SUT.
3.2.1 Distributing agricultural GDP across basins
After splitting the SUT database into two separate datasets (agricultural and non-agricultural activities), we added an LULC column to the agricultural dataset to indicate the associated agricultural land use and land cover (LULC) class. Agricultural land-use categories were grouped according to their corresponding economic activities. The GDP for each resulting polygon (a combination of agricultural activity and LULC category) was then calculated based on the polygon’s area proportion relative to its LULC class. This proportion was multiplied by the reported monetary value for the respective agricultural economic activity. As a result, the GDP contribution of agricultural activities per basin was determined by the area size (ha) of the corresponding agricultural activity-LULC polygons.
3.2.2 Distributing non-agricultural GDP across basins
To desegregate non-agricultural GDP per basin, we used NTL as a proxy for economic growth. NTL has a significantly high correlation with regional socio-economic activities measured by GDP or energy consumption (Doll et al., 2000; Goldsmith, 2008; Henderson et al., 2012; Sutton et al., 2007; Tilottama et al., 2010; Xiao et al., 2021). This is because industrial economic activities taking place in urban areas with observable luminosity can be captured by satellite NTL. Based on nighttime light intensity’s strong correlation with economic activity, the use of NTL has proven helpful in measuring economic growth in developing countries, conflict zones, or areas where official statistics are unreliable or unavailable (Henderson et al., 2012). Furthermore, NTL can be helpful in estimating economic activities at non-traditional, non-administrative spatial units, such as river basins, ecological zones, conflict-affected regions, and cross-border regions (Chen and Nordhaus, 2011; Henderson et al., 2012).
To obtain NTL imagery for Guatemala, we used global satellite raster images captured by the NASA/NOAA Visible Infrared Imaging Radiometer Suite (VIIRS) following Suarez et al. (2016). This image was obtained in TIFF format after cropping satellite images with a shapefile vector file of Guatemala’s political borders obtained from the open database generated by UIE (2020). The VIIRS nighttime light raster has a resolution of 464 m per pixel and was then vectorized to shapefile format to visualize and extract radiation values. VIIRS imagery contains radiation data for Guatemala in 2020 within the 0–1,223 nW/cm2/sr range. Subsequently, a shapefile was generated by joining the NTL shapefile with the layer of basins obtained from UIE (2020) and the 15 LULC classes we defined previously. GDP per polygon was estimated by multiplying the total GDP, in Guatemalan currency (Q), by the percentage of light intensity estimated for each polygon. The results were then transformed to US$ using a US$1 = 7.80 Q exchange rate.
3.3 Grouping basins according to GDP and water-related ecosystem services
We conducted a multivariate analysis combining factor and cluster analysis to group basins and delineate spatial units based on water-related ES, landscape disservices, and GDP. This approach enhances reproducibility, comparability, and data manageability (Blashfield and Aldenderfer, 1978; Kuivanen et al., 2016; Rao and Srinivas, 2006). First, factor analysis was used to identify underlying factors explaining the correlations among variables. The variables significantly associated with each factor were determined. In this study, the units of analysis were Guatemala’s basins. Data processing employed the maximum likelihood principal component method with rotation in SPSS statistical software (IBM Corp., 2017). Next, cluster analysis grouped basins based on the variables linked to the identified factors. Using Ward’s method with Euclidean distance, the clusters were derived using SPSS statistical software (IBM Corp., 2017), enabling a spatially explicit classification of Guatemala’s basins.
3.4 Linking the supply and use of water per agricultural activities in each basin cluster
Following the principles of SEEA-EA, we compiled a water supply table linking ecosystem services to economic activities. Using the database generated in previous steps, we assigned a physical water supply value (m3) to each land use type associated with its corresponding economic sector in each basin cluster. This enabled the development of a water supply matrix in which economic sectors and industries are represented in the rows, spatial clusters in the columns, and the corresponding physical volumes of water supplied populate the matrix cells. This structure allowed for the construction of a spatially explicit disaggregated water supply table, providing a relatively detailed representation of the flows of water provisioning services from ecosystems and land uses to economic sectors, consistent with SEEA-EA standards.
In addition to developing a supply table, we introduced a set of water use intensity indices as indicators for each cluster. This allowed us to clearly outline dependencies by showing which sectors are more dependent on water and will be more at risk given their subnational use of water in the production process. These indicators quantify the volume of water used per unit of economic output for each industry within each cluster, thereby highlighting industries with higher water dependencies, greater exposure to resource availability risks, and higher impact on water availability. This dependency serves as a first approximation of the final ecosystem service under the assumption that the final ecosystem service corresponds to the actual flow of water entering the economy to produce goods and services.
The use intensity indicator thus reflects the pressure exerted by economic activities on water resources and serves as a proxy for water-use efficiency. It was calculated by dividing the physical volume of water supplied to each economic activity in each cluster by the corresponding economic output (e.g., gross value added or total production value). The water use intensity indicator Ii,c for the economic sector (i.e., land use and associated industry) in cluster c is expressed as follows:
where Wi,c represents the volume of water supplied (in m3) to economic activity i in cluster c and Ei,c denotes the economic output of that industry in monetary units (USD). This metric allows for the identification of sectors with high water dependency and low efficiency, thereby supporting assessments of ecosystem service sustainability and informing resource management strategies at national and subnational scales. According to the SEEA-Ecosystem Accounting framework, the final ecosystem service corresponds to the actual flow of services entering the economy and used by beneficiaries to produce goods and services. This actual use is constrained by demand and access and is, therefore, generally lower than the ecosystem’s capacity to supply the service. The capacity reflects the sustainable provision of the corresponding intermediate ecosystem service, representing the ecosystem’s ability to generate these services over time.
4 Results
4.1 Supply of ecosystem services per basin
4.1.1 Runoff water supply
In 2020, national runoff water was estimated at 90,204 million (M) m3. The Motagua Bajo basin recorded the highest runoff volume (4,922 M m3), while the Suchicul-Beljeyá basin had the lowest (0.153 M m3). When adjusted for area size, the Livingston basin showed the highest runoff per hectare (23,207 m3/ha) and the Candelaria basin showed the lowest (1,620 m3/ha). Basins with the lowest runoff volumes are concentrated in Guatemala’s Dry Corridor, where supply does not exceed 1,500 M m3 (Figure 1).
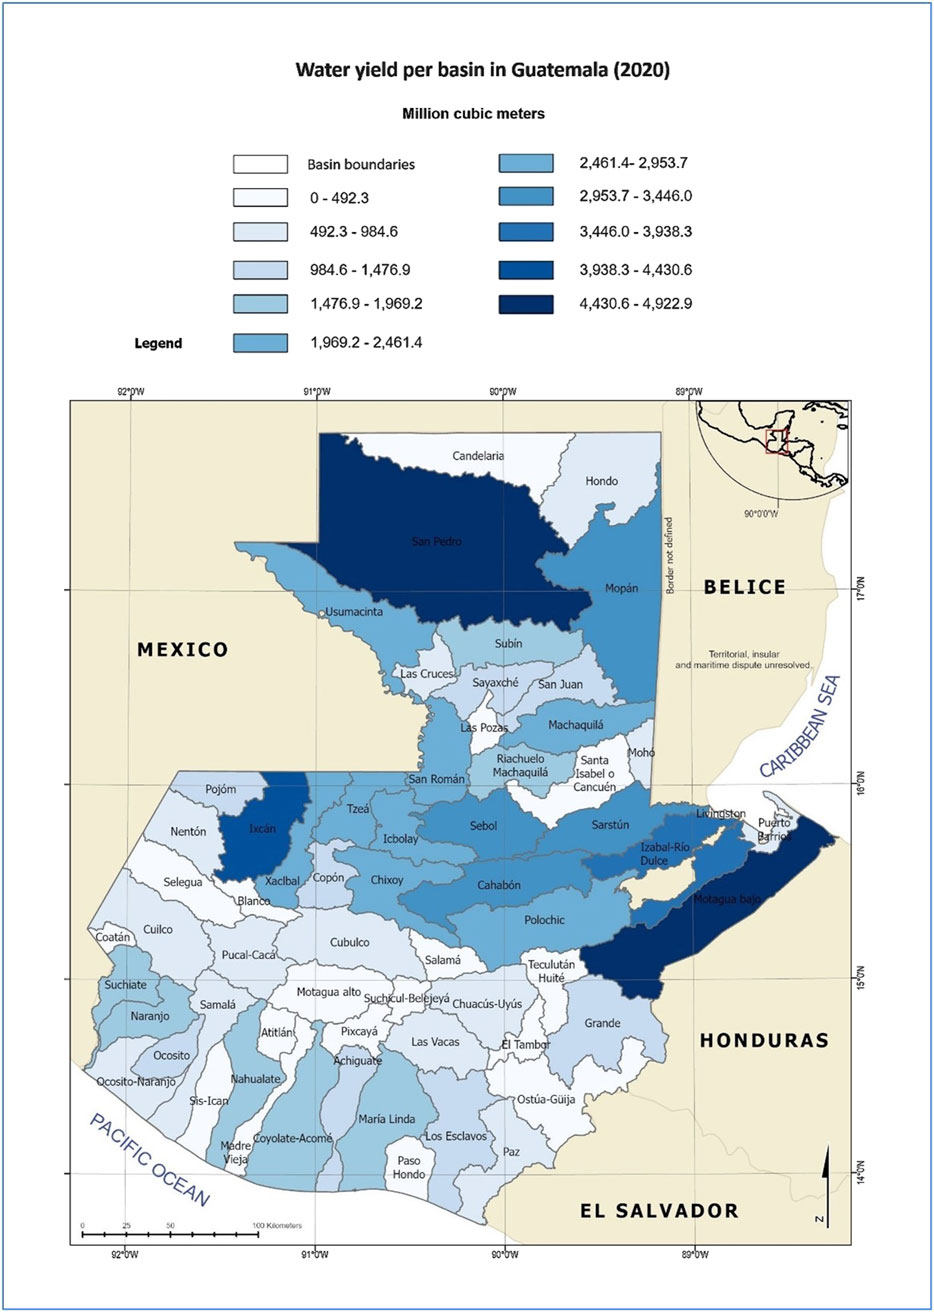
Figure 1. Available runoff water at the basin level in 2020 at the national scale.
4.1.2 Avoided, exported, and deposited sediment per basin
Sediment retention (i.e., avoided sediment) at the national level was estimated at 3,179 million (M) T. The Polochic basin recorded the highest avoided sediment (225,126,459 T), followed by the Cubulco basin (202,015,851 T). Basins with the smallest volumes of avoided sediment were Livingston (71,391 T) and Candelaria (149,806 T) (Figure 2). Landscape disservices—exported and deposited sediment—were estimated nationally at 306 MT and 1,704 MT, respectively. The Livingston, Las Cruces, and Candelaria basins recorded the lowest volumes, with less than 355 T for exported sediment and under 140,000 T for deposited sediment (Figure 3).
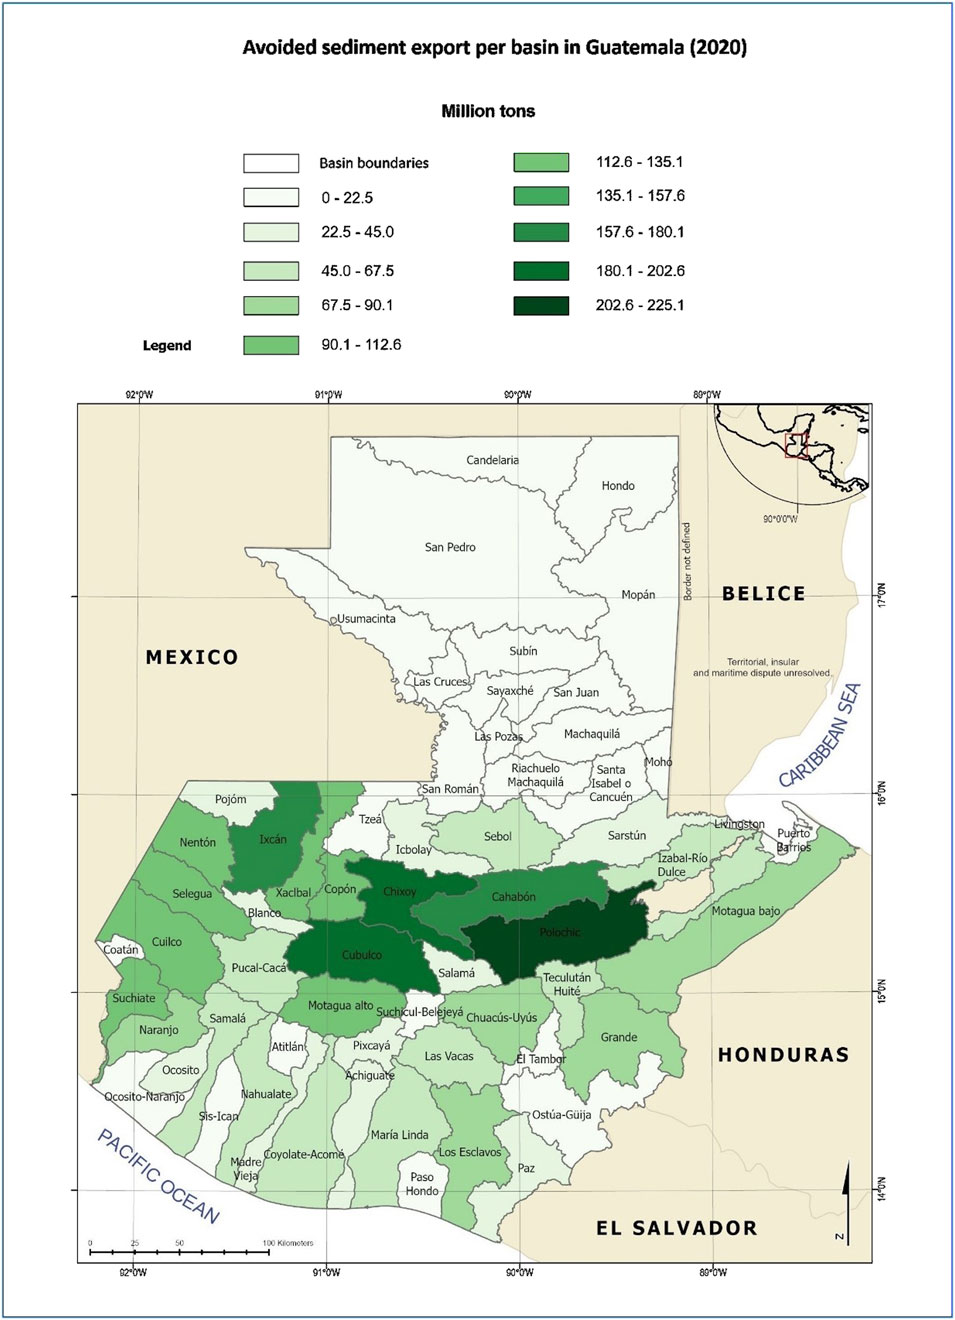
Figure 2. Avoided sediment per basin in 2020 at the national scale.

Figure 3. Landscape disservices: exported and deposited sediment per basin in 2020 at the national scale.
4.2 GDP per basin
The two wealthiest basins, María Linda and Las Vacas, account for 60% of Guatemala’s national economic output. The next nine basins contribute a combined 21% of GDP, ranging between 2% and 5%. The remaining 51 basins comprise the remaining 19% of GDP, each contributing 1% or less. When comparing GDP relative to area as a measure of efficiency, Las Vacas leads with $146,621/ha, followed by María Linda at $100,580/ha. The remaining basins average $3,825/ha, ranging from $34,342 to as low as $0.5/ha. The high concentration of economic activity and GDP per basin is linked to urban areas, particularly Guatemala City and the surrounding metropolitan municipalities, including Mixco, Villa Nueva, Chinautla, San Miguel Petapa, Amatitlán, Villa Canales, Santa Catarina Pinula, Fraijanes, and San José Pinula (Figure 4).

Figure 4. Spatial distribution of GDP per basin in 2020.
4.3 Grouping basins in terms of GDP and water-related ecosystem services
According to the cluster analysis, three factors explained 87.5% of the variance among basins. The first factor, strongly correlated with exported and deposited sediment and erosion (0.962, 0.847, and 0.957, respectively), was interpreted as the slope of the basins (F1), explaining 40.2% of the variance. The second factor, correlating with avoided sediment, water yield, avoided erosion, and the area size of each LULC category per basin (0.636, 0.894, 0.813, and 0.806, respectively), was associated with vegetation and land cover (F2), explaining 34.7%. The third factor, correlated with GDP only (0.998), represented economic output (F3), explaining 12.5% of the variance. The hierarchical clustering algorithm identified five clusters based on GDP, water yield, and sediment dynamics (Figure 5). Table 4 summarizes each cluster’s characteristics, and Figure 6 illustrates their distribution in Guatemala.
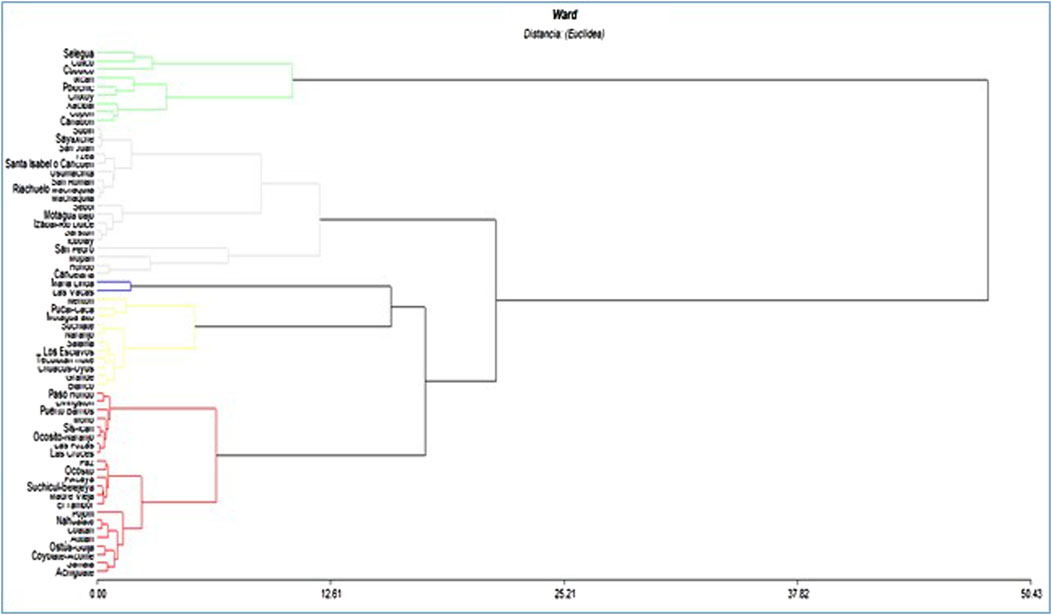
Figure 5. Dendrogram displaying cluster solutions from Ward’s method of cluster analysis for basins in Guatemala in terms of GDP, water yield, and avoided, exported, and deposited sediment.
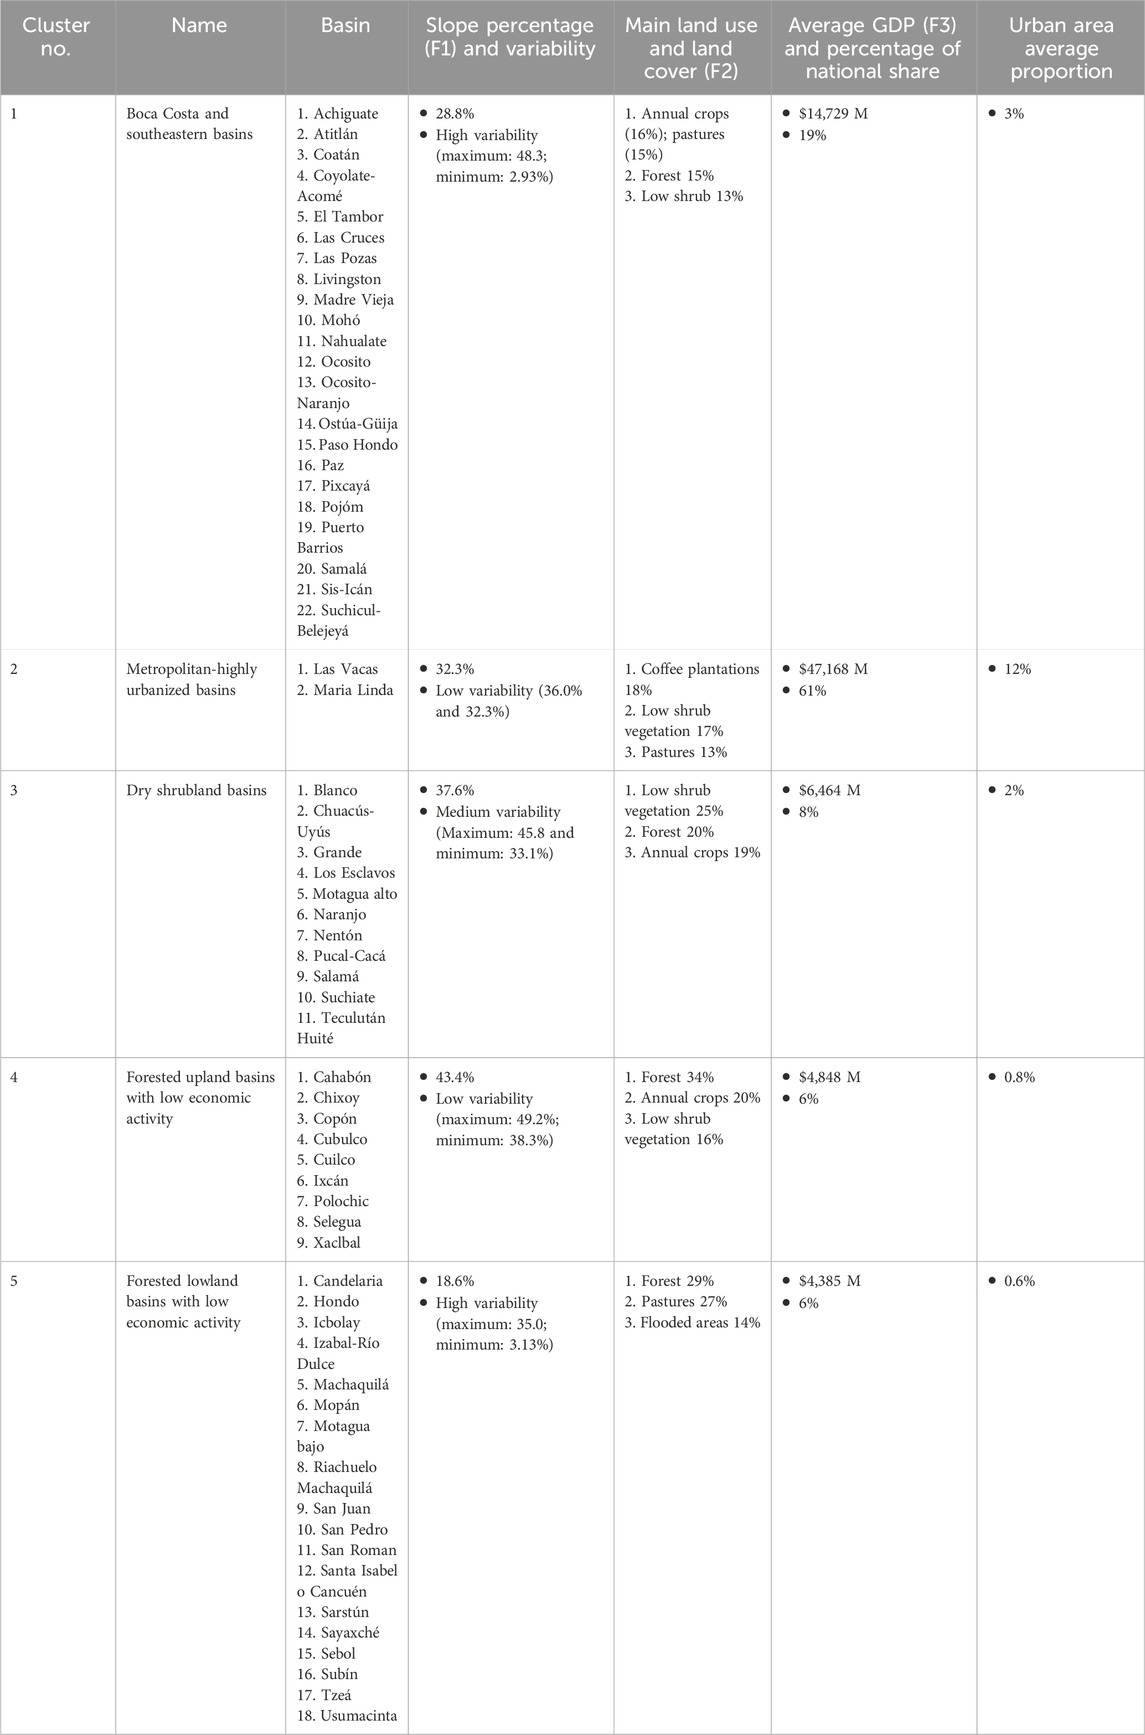
Table 4. Cluster solutions from Ward’s method of cluster analysis for basins in Guatemala and main discerning characteristics in terms of resulting factors.
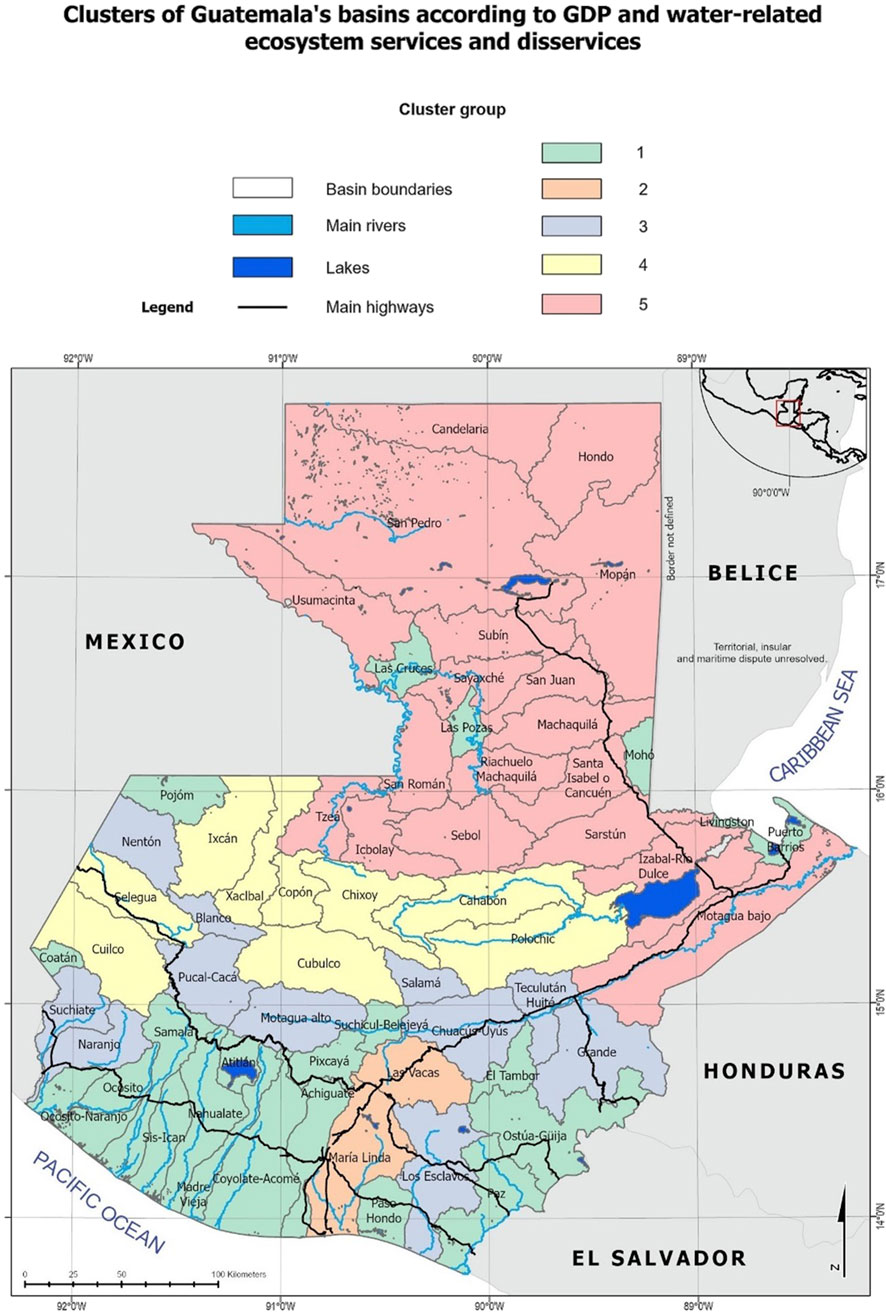
Figure 6. Cluster of basins in Guatemala in terms of GDP, water yield, and avoided, exported, and deposited sediment.
4.3.1 Cluster 1: Boca Costa and southeastern basins
Cluster 1 (C1) includes basins primarily located in the Boca Costa region, spanning the Altiplano mountains to the Pacific coastline. The slope percentage (F1) in this cluster is 25.8%, with high variability. For instance, Coatán and Atitlán have the highest slope, 48.3% and 42.6%, respectively, while Las Pozas and Las Cruces have the lowest at 4.33% and 2.93%, respectively. In terms of water yield, these basins supplied 15.74 km3 (15,744,915,062 m3), equivalent to 17% of the national supply. Avoided sediment in C1 amounted to 485.2 M T, while the exported and deposited sediment amounted to 47.4 and 268.7 M T, respectively. Per hectare, these basins ranked second in terms of avoided sediment (221.8 T) and exported and deposited sediment (21.7 and 122.8 T, respectively). The most common LULC (F2) in C1 is annual crops (16%, mainly maize and beans accounting for 12%), followed by pastures (15%), forest and low shrub vegetation (15% and 13%, respectively), and sugarcane (12%) and rubber (4%) plantations. Urban areas and perennial crops account for 3% of the area each. In terms of GDP (F3), C1 ranks second in the proportion of national GDP at 19% ($14,729 M). C1 extends over 2,187,654 ha, equivalent to 20% of the national territory. Economic output per area unit C1 generates an average of $0.673 M/km2.
4.3.2 Cluster 2 Metropolitan-highly urbanized basins
Cluster 2 (C2) includes only two basins (Maria Linda and Las Vacas) that comprise Guatemala’s metropolitan area (Guatemala City and other municipalities such as Villa Nueva, Amatitlán, San Lucas Sacatepéquez, Villa Canales, and San Miguel Petapa). This cluster’s average slope (F1) percentage is 32.3% (Maria Linda: 28.6% and Las Vacas: 36.0%). In terms of water yield, it is the cluster with the smallest water volume, accounting for only 3% (2.5 km3) of the national supply. However, relative to its size, it is not the smallest contributor, supplying 6,327 m3/ha. In terms of avoided, exported, and deposited sedimentation, absolute values are the smallest among clusters, accounting for 3% of national values (102.3, 9.6, and 59.3 M T, respectively). Performance per hectare, however, is not the lowest: 255.9, 24.1, and 148.2 M T for avoided, exported, and deposited sedimentation, respectively. In terms of land uses (F2), C2 is composed mainly of coffee plantations (18%), low shrub vegetation (17%), pastures (13%), urban areas (12%), sugarcane plantations (12%), forest (12%), and annual crops (9%). C2 has the most significant proportion of urban areas and is the richest cluster in GDP (F3), accounting for 61% ($47 168 M) of national GDP. It is also the smallest cluster, extending over 4% of the national territory. C2 produces an average of $ 0.118 M/ha (or $11.8 M/km2; the national average is $0.718/km2), making it the most efficient cluster in terms of economic output per area unit.
4.3.3 Cluster 3 Dry shrubland basins
Cluster 3 (C3) spans geographically from east to west. It encompasses what is known as the dry corridor of Guatemala, a region characterized by prolonged dry seasons as an effect of global climate change and the region’s land morphology. The average slope (F1) percentage in C3 is 37.6%, with Suchiate having the highest slope (45.8%) and Los Esclavos the lowest (33.1%). Water yield in this cluster represents 11% of the national supply (9.9 km3) but has the lowest water output per area unit (6,259 m3/ha). In terms of avoided, exported, and deposited sedimentation, it ranks second among clusters with 405.7, 133.2, and 703.6 M T, respectively. This is also the case when comparing avoided, exported, and deposited sedimentation relative to area size (509.0, 61.9, 291.2 T/ha, respectively). Land use composition in this cluster is dominated by low shrub vegetation (25%), forest (20%), annual crops (19%, particularly maize and beans at 15%), coffee plantations (13%), dispersed trees, and pastures (each with 8%). Urban areas account for 2%. C3 accounts for 8% of the national GDP ($6,464 M) and 15% of the national territory, and it has the third-largest economic output per area unit ($0.409 M/km2).
4.3.4 Cluster 4: Forested upland basins with low economic activity
Cluster 4 (C4) is localized in Guatemala’s Altiplano (high plains) region, a mountainous region with scarped and pronounced declivities and high plains in between. The southern part of this region is demarcated by the volcanic chain that separates it from the Boca Costa. The average slope percentage (F1) in C4 is 43.4% with little variability (Polochic is the highest with 49.2% and Cahabon 38.3%). Water yield in this cluster amounts to the second largest proportion, with 21% (18.8 km3), and the highest water yield per area unit (10,409.5 m3/ha). Absolute values for avoided, exported, and deposited sedimentation are the highest among clusters, with 44% (1,405.7 M T), 44% (133.2 M T), and 41% (703.6 M T). The same is the case when observing these values relative to area size: 777.5, 73.7, and 389.2 T/ha. The land use composition in C4 is dominated by forest (34%), annual crops (20%, particularly maize and beans with 15%), low shrub vegetation (16%), cardamom and coffee plantations (5% each), and agroforestry and pastures (4%, each). Urban areas account for 0.8% of the total area in C4, which has the second-lowest GDP output, accounting for 6% ($4,848 M) of the national total. Nevertheless, it represents 17% of the national territory; it has the second-lowest economic output per area unit ($0.268/km2).
4.3.5 Cluster 5 : Forested lowland basins with low economic activity
Cluster 5 (C5) comprises all basins in the lowlands of the northern part of Guatemala, characterized by extensive flat areas of low elevation and calcareous soils covered by rainforest. It is the country’s region with the lowest population density. The average percentage slope in this cluster is 18.6%; the Sebol basin has the highest slope percentage (35.0%), and Candelaria has the lowest (3.13%). C5 accounts for the country’s largest portion of water yield with 43.2 km3, equivalent to 48% of all national supply; water yield per hectare (8,951 m3/ha) is only surpassed by C4. Avoided, exported, and deposited sedimentation in C5 are the second lowest after C2, with values of 381.5, 17.9, and 212.4 M T, respectively; the same variables per area unit are by far the lowest, with 79.0, 3.7, and 44.0 T/ha, respectively. In terms of land uses, C5 is mostly conformed by forest (29%), pastures (27%), flooded areas (14%), low shrub vegetation (14%), maize and bean cultivation (8%), and oil palm plantations (3%). Urban areas account for only 0.6% of the total cluster area. C5 has the lowest economic 6% share ($4,385 M) but comprises almost half of the country (45%) and, therefore, the lowest economic output per area unit ($0.091 M/km2, way below the national average of $0.718/km2).
4.4 Accounting tables: linking the supply and water use per basin cluster
Table 5 presents the spatial distribution of water provisioning services linked to specific land uses and their corresponding economic sectors. Higher water supply volumes are predominantly associated with forests and low shrub vegetation, particularly in cluster 5 (indicated by dark blue). Other land uses such as natural grasslands (notably in cluster 5), oil palm plantations, cultivated pastures, coffee monocultures, banana cultivation, and urban areas also exhibit significant water supply volumes, as shown by light blue shades across clusters.
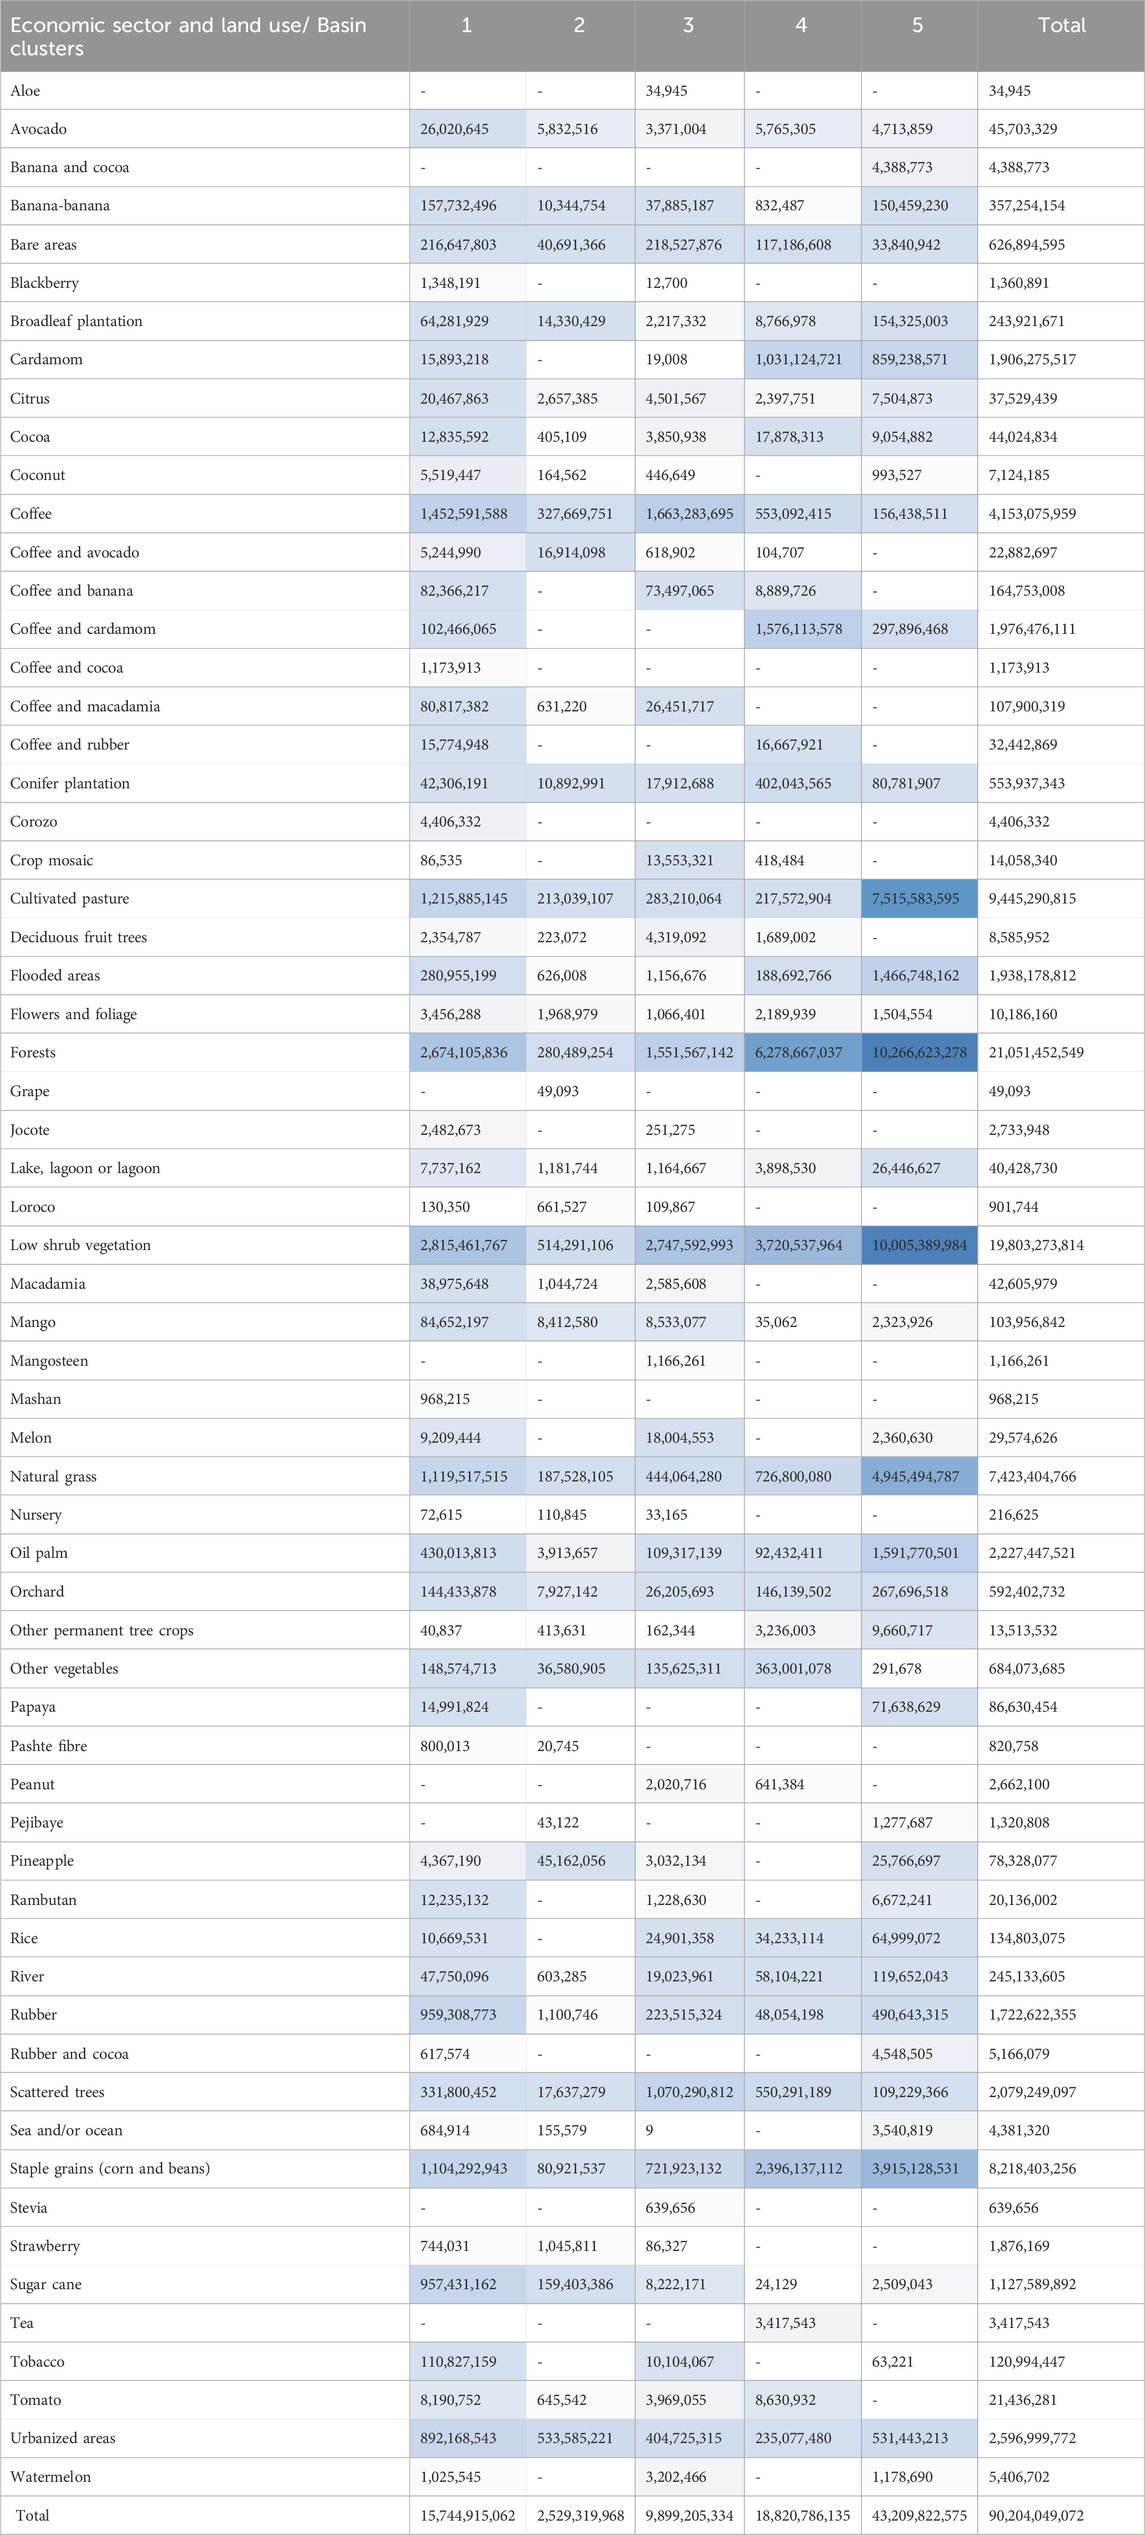
Table 5. Supply table of water ecosystem services in physical terms (m3) per basin cluster.
The water use intensity indicators (Ii,c) reveal high water use intensity for rice and coffee monocultures and cardamom in clusters 1, 4, and 5; coffee and rubber in clusters 1 and 4; sugarcane in cluster 5; rubber consistently across clusters; corn and beans, particularly in cluster 5; oil palm, especially in cluster 3; cultivated pastures, notably in clusters 2 and 4; and natural grasslands in all clusters, with particularly high values in cluster 4. These results highlight the sectors and regions where economic activities are most reliant on water provisioning services relative to their economic returns (Table 6).
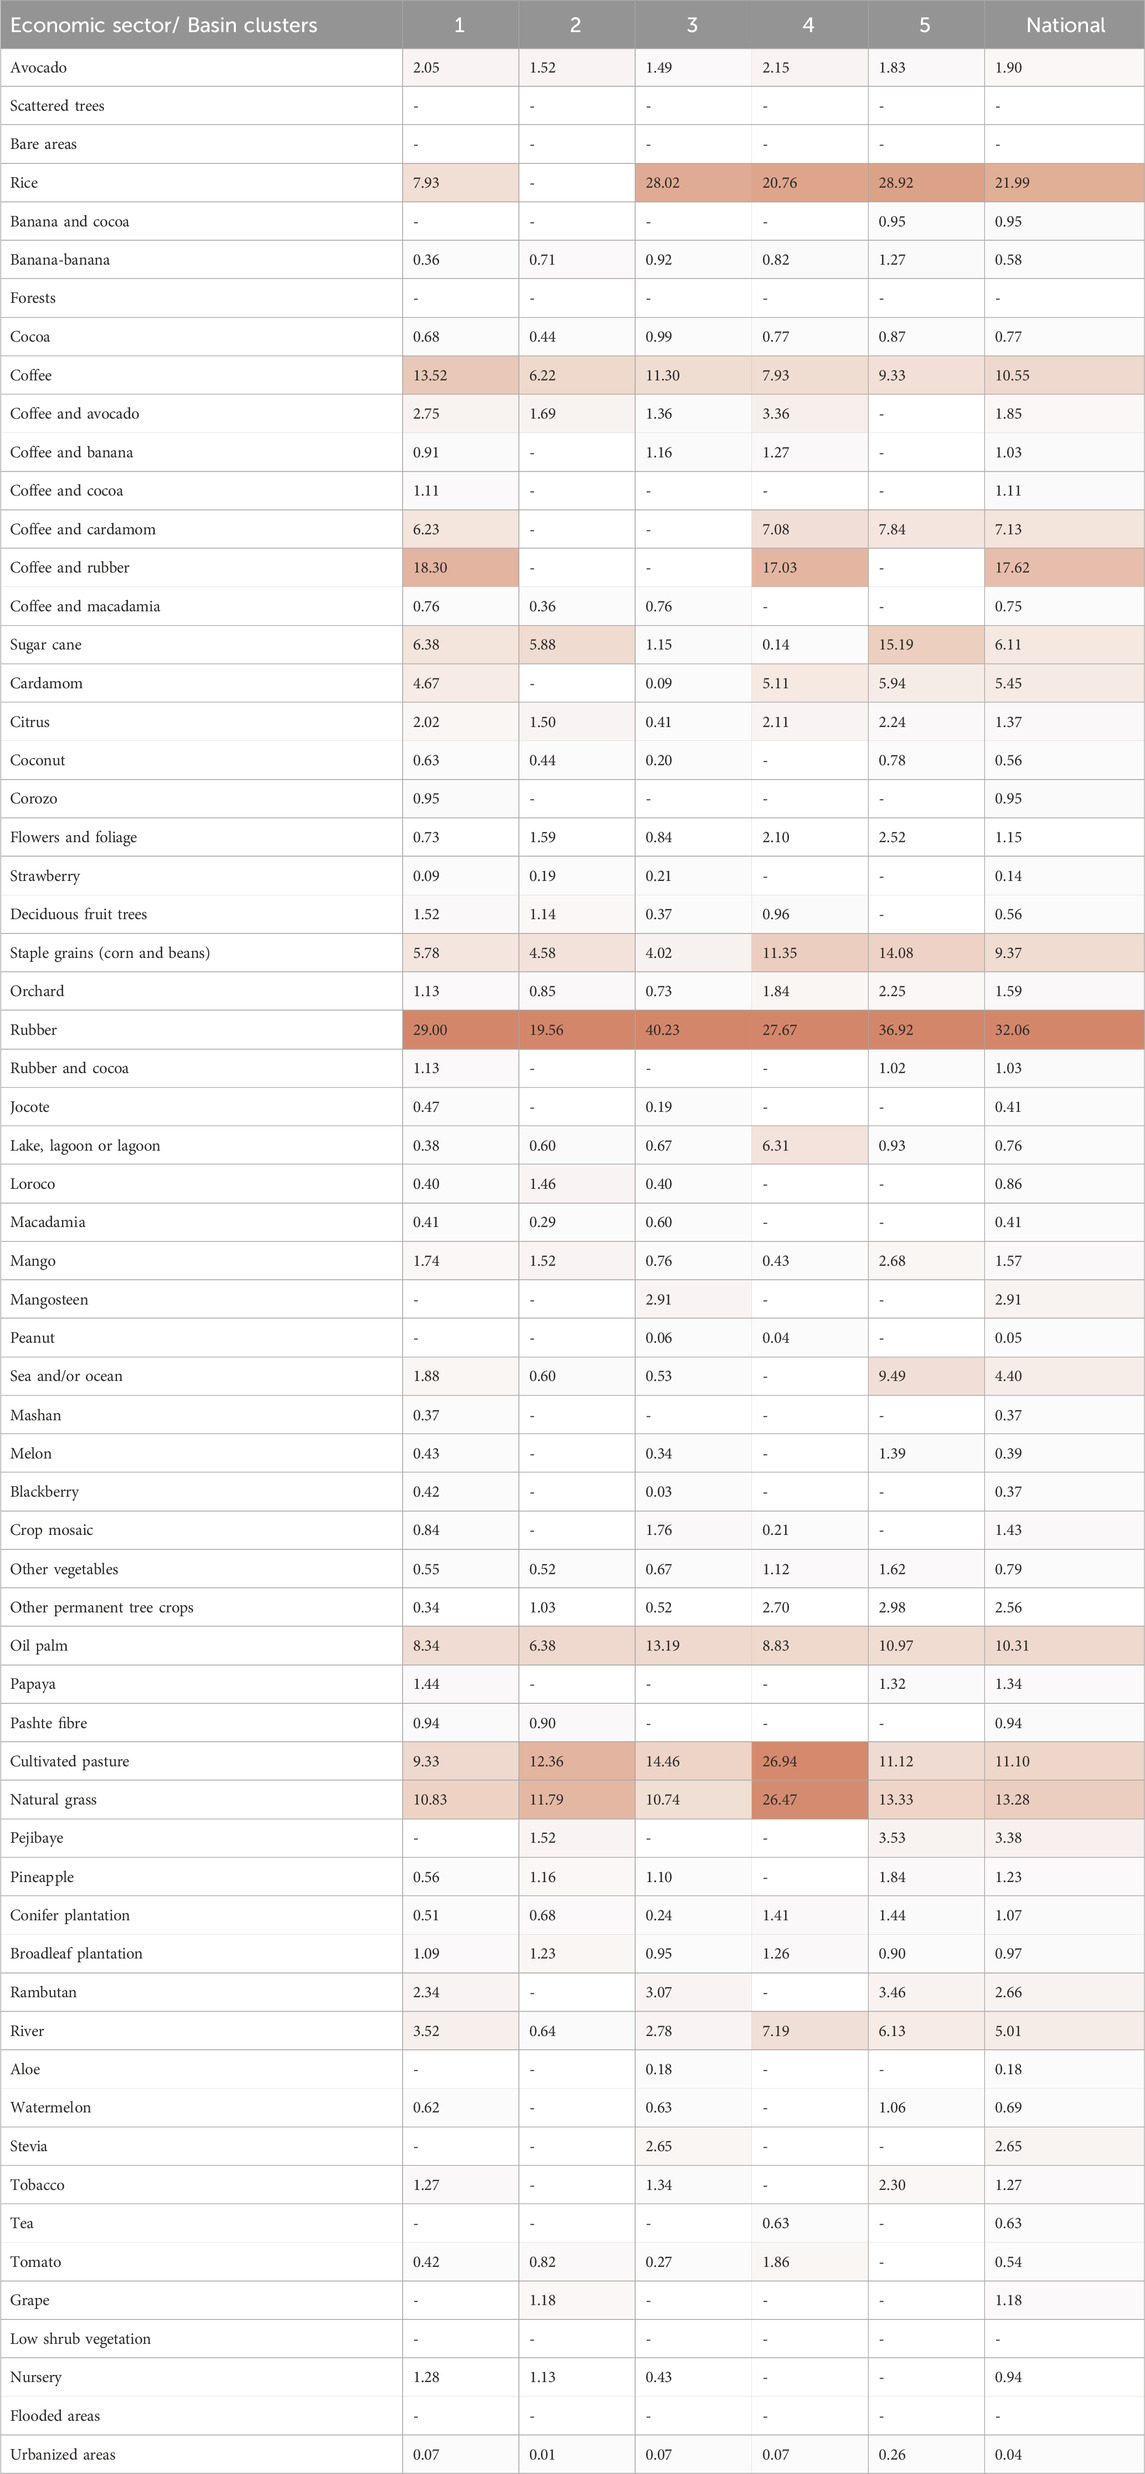
Table 6. Water use intensity index for economic sectors across different basin clusters in Guatemala.
5 Discussion
In this study, we integrated economic and water-related ecosystem services and disservices data to find different patterns at the basin level in Guatemala. A cluster analysis of these data delivered a typology of basins based on GDP (USD), water yield (m3), and avoided, deposited, and exported sediment (T): 1) Boca Costa and southeastern basins, 2) Metropolitan-highly urbanized basins, 3) Dry shrubland basins, 4) Forested upland basins with low economic activity, and 5) Forested lowland basins with low economic activity. The most important variables explaining 90% of this variability were slope, land use and land cover, and GDP. By focusing on Guatemala as a national case study, our analysis highlights the critical role of biophysical features in shaping economic activities, aligning with approaches that emphasize the intersection of geography, ecology, and development at the national scale. These linkages align with neo-environmental determinism, which explores how geographic and ecological factors influence economic growth, institutional frameworks, and responses to climate change (Meyer and Guss, 2017). Environmental and geographical determinism has been critiqued for oversimplifying complex interactions and potentially legitimizing colonial practices (Sluyter, 2003). However, within the SEEA framework, analyzing the economy through geographical and biophysical perspectives is essential. This approach provides a foundation for spatial planning to harmonize ecological processes with economic systems, advancing a more integrated and sustainable development paradigm in Guatemala and beyond.
According to data from the Central Bank used in our analysis, 9.8% of Guatemala’s GDP is linked to agricultural LULC categories, which occupy 47.6% of the country’s territory. These categories also correspond to the sectors with the highest water use intensity, as shown by the darker red shades in Table 6. This indicates inefficiency in water use relative to the total economic output, signaling the need for a more sustainable allocation of water resources within these sectors. On the other hand, GDP associated with urban areas accounts for 90.2% of the national total while occupying only 1.7% of the country’s area. Urban areas in the María Linda and Las Vacas basins alone account for 60.4% of the national GDP but represent less than 1% of the country’s area. Although urban areas exhibit low water use intensity, this may be largely due to their relatively high economic output, which reduces the index value. Finally, 50.7% of Guatemala’s territory is either forest, flooded, or abandoned lands where the Central Bank’s SUT database reports no GDP. Although this assumption overlooks income generated by illegal activities or the informal economy, it is still surprising that more than half of the country’s area does not contribute to the official GDP. At the same time, these areas are critical for ecological functioning and concomitant ecosystem services. For instance, according to our results, forests account for 25% of the national territory and deliver 32% and 23% of national water yield and avoided sediment, respectively. Low shrub vegetation accounts for 16% of the country, 22% of yielded water, and 16% of avoided sediment. Abandoned areas with dispersed trees, bared areas, and flooded areas account for 10% of the national territory. This suggests the importance of managing these areas for landscape and ecological functioning restoration. Areas where no GDP is reported could also be incorporated into payment for ecosystem service schemes to integrate ecosystem services into national accounting.
In this study, water yield and avoided, exported, and deposited sediment per basin were used as proxies of water-related ecosystem services due to their connection to the hydrological cycle. Our estimation for water yield using the InVEST Water Yield (WY) model for 2020 at the national scale (90,204 M m3) aligns with a 2013 study that projected 96,545 M m3 for 2020 (Saubes et al., 2015). The same study estimated a water volume of 110 M m3 for 2013, predicting a 12.5% water yield reduction during 2013–2020. Even though this study applied a different model (i.e., WEAP model), our estimations could suggest an even more significant reduction of water yield availability at the national scale. Importantly, the InVEST WY model provides a coarse estimation of precipitate minus the water lost to evapotranspiration. This estimated volume, nevertheless, is an estimation per basin of the potential water that could be captured, channeled, and distributed for human consumption while preventing runoff water from transporting sediment into water bodies.
We also estimated avoided, exported (volume that reaches the stream), and deposited (volume that does not reach the stream) sediment per LULC in each basin. Exported sediments (305 million tons) and deposited sediments (1,704 million tons) are landscape disservices. Analyzing these as negative effects of nature on human wellbeing complements the assessment of ecosystem services (Blanco et al., 2019). It is important to recognize, however, that ecosystem disservices are generated and driven by human activities and LULC changes (Lyytimäki et al., 2008; Shackleton et al., 2016). Our findings suggest an average national erosion rate of 186 tons per hectare per year, with 35 tons per hectare of exported sediment and 156 tons per hectare of deposited sediment. A 2009 study estimated the highest potential erosion rates in the Huehuetenango region at 183 tons per hectare per year (IARNA-URL, 2009). Our results indicate that this value is closer to the national average rather than the maximum level. Additionally, a global study identified Guatemala as one of the countries with the highest annual soil erosion rates (Borrelli et al., 2017).
Finally, in this study, we developed a water supply table for all Ecosystem Accounting Areas (EAAs, See Section 5.1) and land use categories (Table 5). This served as the basis for estimating water use intensity indicators, which were then used to construct a dependency and use table (Table 6) for each EAA and land use. The water use intensity indicator, calculated as the ratio of physical water use (m3) to economic output (USD) for each land use and sector, serves as an indicator of ecosystem service use intensity. This index highlights the sectors and regions most dependent on ecosystem-based water resources, providing insights into the relative intensity of water dependency across spatial units.
Although our study does not directly quantify each sector’s overall economic dependency on water-related ecosystem services, the spatial analysis of GDP per basin acts as an important diagnostic tool. The magnitude of the indices identifies priority areas and sectors where economic activities exhibit particularly high reliance on water provisioning services, warranting further assessment and targeted policy interventions. For instance, agricultural industries such as rice, coffee, rubber, sugarcane, and pastures emerge as particularly water-dependent activities, exhibiting the highest ratios of physical water use per unit of economic output across all EAAs (see Section 5.2 for a more detailed discussion). This underscores their significant reliance on ecosystem-based water supply relative to their economic contribution (see Table 6). Urban areas, on the other hand, display low water dependency ratios largely due to their high economic output as urban regions contribute approximately 60% of Guatemala’s national GDP. However, it is important to note that our dependency indices may not fully capture the extent of water dependency in urban areas, especially when compared to agricultural activities. Urban areas within the highly urbanized basin cluster (C2) are economically significant, hosting a wide range of industries such as food processing, agrochemicals, cement, cleaning products, metals, textiles, paper, plastics, and glass manufacturing, as well as financial, telecommunications, and insurance services.
Therefore, despite their lower water dependency ratios, the María Linda and Las Vacas basins, which are part of the C2 cluster, remain critical areas of concern. In these predominantly urban settings, water availability and quality are under significant pressure due to factors such as water contamination, insufficient sewage treatment, and reduced infiltration caused by extensive pavement coverage. These issues raise serious concerns in terms of both water quantity and quality. Water yield in these urbanized zones was estimated at 533 million m3, with an annual exported sediment load of approximately 12,057 tons. Since 12% of the C2 cluster consists of urbanized, paved areas with very limited soil infiltration, a large proportion of the water yield in these zones does not infiltrate into the ground. Instead, it is likely that it becomes surface runoff, reducing groundwater recharge and carrying significant sediment loads into rivers and streams, contributing to the pollution of water bodies on an annual basis. Furthermore, a study conducted in Guatemala’s metropolitan area surveyed 139 underground wells and determined that in 2018, only 2% of these wells retained the same water depth (100–201 m) compared to 1978 (Funcagua, 2022). Moreover, the water quality of the main rivers in this area (Villalobos and Las Vacas, a tributary to the Motagua River) is highly contaminated with solid waste, microbiological contamination, and Escherichia coli, making most of this water volume unsuitable for human consumption (Carrera and Mosquera, 2023).
On the other hand, Dry shrubland basins (C3), dominated by low-shrub vegetation, exhibit the lowest water output per unit area (6,259 m3/ha). The region identified as Guatemala’s Dry Corridor is part of this cluster, where food security and climate change adaptation represent critical challenges (Beveridge et al., 2019). The implementation of climate-smart agricultural practices, such as agroforestry, hedgerows, conservation tillage, mulching, contour ditches, crop rotation, the use of pest- and heat-resistant crop varieties, water reservoirs, and drip irrigation, has shown positive effects in addressing these issues (Sain et al., 2017). These practices can enhance biodiversity, improve soil health, and support temperature regulation and moisture retention, providing sustainable strategies to mitigate climate-related risks and support agricultural resilience (Gobbi and Casasola, 2003). With appropriate incentives and support mechanisms to encourage technological innovation, implementing these agricultural practices at the landscape scale can enhance resilience and improve food security. Such innovative measures should foster long-term adoption by addressing economic and structural barriers faced by local farmers in this region (Sain et al., 2017). C1 (Boca Costa and southeastern basins) holds a substantial portion of Guatemala’s GDP (almost 20%), mostly due to economically important urban areas and agricultural activities related to vegetables, coffee, pineapple, and sugar exports. These extensive land uses, along with large areas of maize and beans (mainly subsistence agriculture), may influence the amount of sediment exported and deposited per hectare. Forested upland basins with low economic activity (C4) and Forested lowland basins with low economic activity (C5), on the other hand, represent 61% of the country’s area size and 69% and 56% of the country’s total water yield and avoided sediment, respectively. However, the combined contribution of these two clusters is only 12% of the national GDP.
In summary, basins in cluster 2 are vital for Guatemala’s industrial and service activities; however, their sustainability is uncertain due to their LULC configuration and impacts on water connectivity and quality beyond those basins. Conversely, a strategic integration of basins from clusters 1, 3, 4, and 5 into the national economy, given their vulnerabilities and role in water yield and sediment control, could help optimize the landscape and create multifunctional landscapes that support both socio-economic and ecological goals. Achieving this will require a detailed, multisectoral discussion, and our typology can serve as an initial, structured spatial analysis that incorporates land uses, economic activities, GDP, and water use intensity indicators. Our study responds to the widely recognized need to incorporate natural capital into policy, resource conservation, and land use decisions on a large scale (Daily et al., 2009; Tallis and Polasky, 2009). This is of utmost importance in a country such as Guatemala, with severe and increasing socio-ecological vulnerability and profound social inequality (Gini Index of 48.7) (Gálvez and et al., 2015; IARNA-URL., 2009, 2011, 2012; Isaac et al., 2023; Pérez Irungaray et al., 2020; Statista, 2024).
5.1 Basin clusters as Ecosystems Accounting Areas (EAAs) with distinctive Ecosystem Assets (EAs) configurations: a framework for research and policy agendas
The goal of the SEEA is to measure the contribution of the environment to the economy and the impacts the economy has on the environment (Edens et al., 2022; Grondard et al., 2021; Hein et al., 2015; United Nations, 2012; 2021). To achieve this, the SEEA methodology requires integrating economic and ecological data by establishing a basic spatial structure and two interrelated spatial units that accommodate varying scales, methods, and units of measurement: Basic Spatial Units (BSUs), Ecosystem Assets (EAs), and Ecosystem Accounting Units (EAAs) (United Nations, 2021).
BSUs are geometrical constructs representing a specific and small spatial area for gathering data. Examples of BSUs are grid cells or polygons that follow a relevant criterion to capture landscape diversity and fulfill analytical requirements (United Nations, 2012; 2021). In this study, BSUs were defined as pixels from different raster images required by the models we applied, each providing different types of information, e.g., nighttime light imagery, erosivity, erodibility, and precipitation layers. EAs are contiguous spaces of a specific ecosystem type with specific biotic and abiotic conditions and interactions following the CBD’s definition of ecosystems (United Nations, 2021). EAs are the statistical units for ecosystem accounting, such as the extent and conditions of ecosystem services; key delineation drivers for terrestrial ecosystems include topography, geomorphology, vegetation, precipitation, evapotranspiration, and human activities (United Nations, 2021). We captured these variables to generate EAs in Guatemala as the combination of LULC categories and economic activities defined by Guatemala’s Central Bank. Finally, EAAs are geographical territories for which an ecosystem account is compiled (United Nations, 2021). EAAs are typically large, fixed regions that can be designated as management zones for significant natural features, such as river basins, national parks, or protected areas (United Nations, 2012; 2021). In this study, our cluster analysis identified five distinct clusters that align with the conceptual definition of EAAs. Based on these findings, we propose that each identified cluster represents EAAs in Guatemala.
Conceptually, EAAs are socio-ecological systems that integrate ecological functions with institutional, social, and economic dimensions (United Nations, 2012; 2021). An EAA may encompass multiple ecosystem assets, each representing contiguous ecosystem types. The resulting accounting structures aggregate EA by type, presenting measures of ecosystem extent, condition, and service flows (United Nations, 2021). To analyze EAAs, it is essential to scale down to the spatial units of EAs, distinguished from neighboring assets by the strength of interactions between biotic and abiotic components, which are reflected in composition, structure, and function variations; as such, EAs should be delineated and classified based on ecosystem processes, built environments, and human activities (United Nations, 2021).
In this study, EAs are combinations of LULC categories and economic activities. Therefore, a key implication of our basin typology is that each EEA consists of a distinct EA configuration. For example, in cluster 1, 65% of the area consists of forests, low shrub vegetation, cattle pastures, sugarcane cultivation, annual crops, legumes, and oilseeds. In cluster 2, the main EAs, representing 70% of the area, include (all in descending order) permanent shrub crops, low shrub vegetation, urbanized areas, sugarcane cultivation, and forests. Cluster 3 is dominated by low shrub vegetation, forests, annual crops, legumes, oilseeds, and coffee cultivation (72%). In cluster 4, forests, low shrub vegetation, annual and leguminous crops, oil and stem crops, and oilseeds cover 71% of the area. In cluster 5, forests, cattle pastures, flooded areas, and low shrub vegetation comprise more than three-quarters of its area (77%). It is important to note that these listed spatial units per cluster are EAs and not merely LULC categories as they also encompass specific economic activities that generate goods and services included in Guatemala’s System of National Accounts (SNA). Furthermore, they distinguish natural land cover types like forests and low shrub vegetation, which have distinct ecological functions and biotic and abiotic conditions.
A second important implication of the distinct EA configurations within each EEA (i.e., basin cluster) in Guatemala is that the research questions concerning collecting and analyzing primary data to measure economic activities’ dependence on and impact on natural capital will differ. These questions must focus on the extent and spatial configuration of each EA within its EAA, allowing for a targeted approach to evaluate how each configuration influences ecosystem functioning. For example, research in cluster 1 should focus on soil and forest conservation and the effect of agricultural monocultures for exports on ecological processes such as forest regeneration, water regulation and quality, and soil fertility (Munguía et al., 2022). In cluster 2, questions may explore the effects of urbanization, infrastructure, real estate development, and massive untreated amounts of solid waste and sewage water on local ecosystem services, hydrological connectivity, and transboundary cooperation for land use planning at the basin level (Dauvergne and Poole Lehnhoff, 2024; Kauffer, 2014). Cluster 3’s research agenda should emphasize how agricultural practices can overcome extreme and changing dry conditions for climate change adaptation, food security within the context of poverty traps, soil health, and water management (Buckner, 2020; Isaac et al., 2023; Beazley et al., 2019). Cluster 4 may require further examination to determine how traditional knowledge of diversified agricultural systems could be implemented at scales that can further support food sovereignty, economic development, hydrological connectivity, carbon sequestration, and erosion control in the highlands of Guatemala (Anderson, 2022; Corrigan and Hay-Edie, 2013; DeYoung et al., 2017; Isakson, 2009; Ariana Bielek, 2011; Widders et al., 2017). Finally, Cluster 5 could further explore the sustainability of community forestry as a forest management approach, particularly in the context of expanding monocultures, grasslands, illegal activities, and surrounding subsistence agricultural practices (Devine et al., 2021; Hervas, 2020; VanderWilde, 2023).
Current recovery efforts often overlook the vital role of natural capital, missing opportunities to align economic recovery with long-term sustainability goals (Lucas and Vardon, 2021). To address this gap, natural capital accounting (NCA), supported by the SEEA framework, provides essential tools for integrating ecological and economic considerations into national decision-making (Lucas and Vardon, 2021). However, for NCA to be truly effective, it must be grounded in spatially explicit units that reflect local ecological and socio-economic dynamics. The delineation of EAAs offers a practical mechanism for achieving this by enabling the clustering of basins or other relevant regions based on ecosystem assets and ecological functionality, along with social, institutional, and economic variables. This spatial approach facilitates the identification of investment opportunities, supports cross-sectoral coordination, and facilitates policies for biodiversity, climate, and green recovery that are tailored to real-world conditions. Leveraging existing data, fostering stakeholder cooperation, and mainstreaming NCA across public and private sectors can enable the development of more effective and inclusive policies. Furthermore, integrating NCA into biodiversity, climate, and green recovery agendas can foster synergies and enhance policy coherence (Lucas and Vardon, 2021).
5.2 Ecosystem Accounting Areas (EAAs) as socio-ecological land systems for landscape multifunctionality and territorial governance
We further conceptualize EAAs as socio-ecological land systems, representing the interactions between humans and nature as reflected in land organization, configuration, land uses, and land cover (Piquer-Rodríguez et al., 2021). Therefore, landscape planning must be approached as a dynamic, adaptive, and inherently political process that fosters negotiation and harmonizes conflicting goals across land systems (Oliveira and Hersperger, 2019). These objectives are often shaped by unequal power dynamics, influencing the accessibility and distribution of benefits (Hersperger et al., 2021). Landscape multifunctionality is a concept that recognizes the potential to minimize trade-offs and identify potential win–win–win solutions for climate change mitigation and adaptation, food security, and sustainable economic growth (Bolliger et al., 2011; Gimona and van der Horst, 2007; Schindler et al., 2014; Selman, 2009; Slotterback et al., 2016). Landscape multifunctionality should aim for optimization in terms of ES as a more pragmatic approach than attempting to maximize all ES simultaneously. This socio-technical process should include a spatially explicit analysis of societal demands for ES and concomitant goods and benefits alongside the biophysical capacity of the landscape to supply them (Schulte et al., 2014; Schulte et al., 2015). Therefore, territorial governance for landscape multifunctionality should integrate goal setting based on connectivity and spatial patterns (Bürgi et al., 2022; Hersperger et al., 2021; Oliveira and Hersperger, 2019) involving establishing goals, analyzing alternatives, fostering participation, ensuring communication, and implementing monitoring systems (Hersperger et al., 2021).
From the SEEA perspective, goods and services are classified as either SNA benefits, which are captured monetarily within the System of National Accounts (SNA), or non-SNA benefits, which are non-tradable benefits unrelated to economic accounted outputs (e.g., clean air, sediment regulation, and greenhouse gas reduction). Moreover, both SNA and non-SNA benefits derived from ecosystem services can be public or private (United Nations, 2012). For instance, privately owned economic assets may yield private benefits, such as agricultural production—a private SNA benefit—or public benefits, like carbon sequestration in privately owned forests. Similarly, publicly owned areas like national parks can produce public non-SNA benefits, such as water purification or oxygen generation (United Nations, 2012).
A carefully designed, degrowth-oriented landscape optimization strategy in Guatemala could aim to maintain overall GDP stability by balancing sectoral reductions or targeting technological innovations in high water intensity agricultural sectors such as rice, coffee, sugarcane, pastures, and rubber. Rubber stands out as a sector with particularly high-water use intensity. As a water-dependent tree species (Chiarelli et al., 2020; Mangmeechai, 2020), well-managed rubber plantations can still simulate the cooling effects and water regulation functions of tropical rainforests; they also enhance soil moisture retention and improve some biological and physical soil characteristics compared to short-term rainfed crops (Achumi and Johar, 2024; Sungthongwises et al., 2019). This case exemplifies the need for sector-specific discussions to identify and evaluate potential trade-offs between private and public, as well as SNA and non-SNA, benefits at the landscape scale—while acknowledging the context-specific combinations of these factors. As SEEA-aligned accounting tables, Tables 4 and 5 demonstrate the comparability and consistency of environmental and economic data across different sectors and spatially explicit units (i.e., EAAs), making them valuable tools for evidence-based policymaking (United Nations, 2021). A structured presentation of environmental-economic data also aids in identifying long-term trends and assessing the economic implications of environmental degradation (Vardon et al., 2018). A SEEA approach also allowed us to integrate a wide variety of data to be synthesized so that regular information and indicators are produced and can feed into decision-making processes. The accounting recognizes that although there may be discrepancies between different data sources and data gaps, governments and businesses must continually make decisions (Vardon et al., 2018).
Furthermore, monitoring the water use intensity indicator over time enables the evaluation of how effectively an economy decouples water use from economic growth, guiding policies aimed at sustainable water management. Values from Table 6, for instance, show that export-oriented agriculture products are significantly dependent on water per unit of added value, making them vulnerable to sudden changes in the flow of this ecosystem service, which could lower productivity and production levels in the medium and long term. An eco-modernist perspective emphasizes technologies that facilitate the development of new, resource-efficient sectors by redistributing or expanding public benefits and reallocating resources at national and regional levels. Reducing ecosystem service consumption in highly water-intensive sectors could create opportunities for alternative economic activities, technologies, and land uses that promote a more favorable balance between public and private benefits while minimizing the environmental impacts of specific economic sectors.
The debate between ecomodernism and degrowth could benefit from the analytical tools offered by the SEEA framework, which provides a potential strategy for integrating creative innovations of both approaches to support just and sustainable social-ecological land system transformations (Paulson, 2024). Although the SEEA framework may arguably reflect an ecomodernist and utilitarian perspective of nature, its conceptual and analytical tools can also provide a pragmatic foundation for landscape planning and optimization. Diverse development and sustainability strategies could be tested through planned experimentation at the national level, integrating multiple variables, sectors, and actors. This process must function as a governance-driven, socio-technical endeavor grounded in territorial perspectives to foster productive socio-technical processes. Such efforts would facilitate the creation of land system mosaics, economic activities, and diverse human–nature interactions within paradigms such as ecomodernism or degrowth. Ultimately, the goal ought to be catalyzing territorial intelligence, understood as the ability to integrate knowledge, governance, and innovation at a regional scale to address socio-ecological challenges and promote sustainable development tailored to specific territorial contexts (Bertacchini, 2012; Bertacchini et al., 2012; Bertacchini et al., 2013).
5.3 Limitations and further research
Regarding our ecosystem services estimations, the InVEST WY model operates on annual averages, omitting extreme events and seasonal variability, such as Guatemala’s pronounced rainy season from May to September. It also overlooks complex land use patterns and geology, including the spatial distribution of land uses and their impact on water supply. Regarding the estimation of water volumes using the InVEST model, we acknowledge that the resulting values represent the total water supply from ecosystems, including flows that do not necessarily enter direct economic production processes, such as water undergoing infiltration or contributing to groundwater recharge. Although these volumes may not translate into immediate SNA benefits, they are nonetheless fundamental to sustaining the ecological functions that underpin all human activities and economic production over time. Recognizing these broader ecosystem contributions is critical as conventional economic indicators like GDP typically fail to account for the value of such non-market benefits. This methodological choice reflects our aim to develop metrics that capture the full spectrum of ecosystem service flows, beyond what is directly monetized, thereby providing a more comprehensive basis for assessing ecosystem dependencies and informing mechanisms such as payments for ecosystem services (PESs). Consequently, our approach aligns with the need for complementary indicators that extend beyond SNA boundaries, supporting more holistic environmental-economic accounting and policymaking. On the other hand, we acknowledge that the application of different models can produce varying results. In other studies, the InVEST water yield model has been shown to overestimate water yield volumes and underestimate sediment retention compared to other models (Chen and Vardon, 2024). Although effective for regional applications, the InVEST water yield model is highly sensitive to variations or errors in input parameters (Gashaw et al., 2022; Redhead et al., 2016). These findings highlight the need for further primary data collection and model calibration in the context of Guatemala to reduce reliance on proxy variables and indicators, as was necessary for this study regarding the final use of ecosystem services entering the economy.
For sediment estimates, the InVEST SDR model excludes gully erosion, streambank erosion, and landslides, which are relevant in Guatemala’s rugged terrain and high precipitation conditions. Both models require minimal data, making them sensitive to input parameters. Regarding our GDP estimations per basin, industrial GDP estimations used VIIRS NTL data, which has limitations, including sensor calibration issues, insensitivity to rural economic activity, and interference from non-economic light sources. Non-economic light sources, such as public infrastructure and cultural events, could distort the relationship between light emissions and economic output, leading to an oversimplified interpretation of economic conditions (Gibson et al., 2000; Henderson et al., 2012). Moreover, the relationship between NTL, urbanization, and GDP strengthens when considering urban infrastructure volume rather than land extent (Shi et al., 2020). Refining results may thus require incorporating gray infrastructure volume in urban Guatemala.
This study did not directly quantify the flows of ES contributing to the SNA and non-SNA benefits in Guatemala. Instead, the research focused on delineating critical spatial units to integrate ecological and economic data, establishing Ecosystem Accounting Units (EAAs) and Ecosystem assets (EAs) as a foundation for future ecosystem services flow measurements. While EAAs and EAs enable the integration of diverse spatial data, further techniques are needed to account for ES’s temporality and associated accounting periods. This highlights the importance of exploring trade-offs between ES supply and demand, private and public benefits, SNA and non-SNA outputs, and green infrastructure (GI)1 potential in Guatemala through time. Additionally, questions on how land use planning and GI can address climate vulnerability, fund restoration, and mitigate environmental costs of economic growth per sector require future investigation. These inquiries are crucial for advancing economic growth, managing environmental degradation, and reducing systemic vulnerability in Guatemala.
6 Conclusion
In this study, we applied the SEEA framework to advance the understanding of concepts and data required to link ecosystem service flows and economic activities spatially. Using Guatemala as a case study, we delineated spatial terrestrial units relevant to ecosystem functioning, economic activities, and land uses. The methodological steps we employed – including spatially explicit models for ecosystem services estimation, nighttime light imagery, and cluster analysis- offer a structured approach for delineating Ecosystem Assets (EAs) and Ecosystem Accounting Areas (EAAs), as required by the SEEA framework. This addresses an important gap in the operationalization of ecosystem accounting, i.e., the lack of standardized procedures for EAA delineation (Boyd and Banzhaf, 2007; Wentland et al., 2020). The basin typology derived in this study serves as a replicable tool to analyze the relationship between economic activities and water-related ecosystem service flows and disservices in Guatemala and other regional or national studies. Furthermore, this study provides a methodological example for integrating diverse models, techniques, scales, units, geospatial data, and indicators for ecosystem services used by the economic sector. This approach responds to recognized research gaps in consolidating protocols to measure the economy’s dependency and environmental impacts.
As a set of EAAs, our basin typology can also serve as a management and negotiation tool for policy-making and territorial governance, particularly in areas of interest for landscape restoration, optimization, and ecosystem service valuation in Guatemala. These critical, multilevel, and multisectoral discussions are required to restore hydrological connectivity and ecological functionality, especially in the face of increasing systemic vulnerability in the country. While economic growth is crucial for society’s wellbeing, unplanned economic growth that disregards spatial and ecological considerations risks unfulfilling socio-economic objectives and depleting the country’s natural capital. Therefore, landscape planning and territorial governance for sustainability in Guatemala involve recognizing the challenge of minimizing the economic impact on the environment. Land system planning should focus on reducing these impacts until a certain level of economic prosperity is reached. This requires acknowledging the impossibility of eliminating the economic impact entirely while planning for a period when sufficient surplus can be reinvested in natural capital once socioeconomic and development goals have been secured. We propose combining a targeted sector degrowth approach with an ecomodernist focus on high-efficiency sectors by applying the principles of ecosystem accounting and land system science. This approach should have a spatial manifestation in the extent and spatial configuration of economic activities and land uses. The transdisciplinary approach can help develop the necessary research and data to co-produce boundary objects, such as Ecosystem Accounting Areas, which bridge science, the practice, and policy for complex decision-making at national, basin, and landscape scales. It can also shift the traditional human-centered environmental planning model toward one that properly manages landscapes to synthesize people and nature. This concept is relevant not only to Guatemala but also to any other country.
Data availability statement
The raw data supporting the conclusions of this article will be made available by the authors, without undue reservation.
Author contributions
DP: Conceptualization, Data curation, Formal Analysis, Funding acquisition, Investigation, Methodology, Project administration, Resources, Software, Supervision, Validation, Visualization, Writing – original draft, Writing – review and editing. PR: Data curation, Formal Analysis, Software, Validation, Visualization, Writing – review and editing. VB: Formal Analysis, Software, Visualization, Writing – review and editing. PP: Data curation, Formal Analysis, Software, Writing – review and editing. JG: Conceptualization, Data curation, Formal Analysis, Investigation, Methodology, Project administration, Supervision, Validation, Writing – review and editing. RS: Conceptualization, Supervision, Validation, Writing – review and editing. JC: Conceptualization, Supervision, Validation, Writing – review and editing, Data curation, Formal Analysis, Funding acquisition, Investigation, Methodology, Project administration, Resources.
Funding
The author(s) declare that no financial support was received for the research and/or publication of this article.
Acknowledgments
The authors gratefully acknowledge the support of the Fondo de Investigación Landivariano (FIL, Landivariano Research Fund) from Universidad Rafael Landívar for funding the publication of this manuscript.
Conflict of interest
Author JG was employed by Fideres Partners LLP.
The remaining authors declare that the research was conducted in the absence of any commercial or financial relationships that could be construed as a potential conflict of interest.
Generative AI statement
The author(s) declare that Generative AI was used in the creation of this manuscript. The initial draft of this manuscript was written entirely without the use of AI tools. Following the first submission, the authors used ChatGPT (OpenAI, 2025 version) to assist in refining grammar and sentence structure in selected paragraphs only. The tool was not used to generate content. All scientific reasoning, interpretation, and final revisions remain the sole responsibility of the authors.
Publisher’s note
All claims expressed in this article are solely those of the authors and do not necessarily represent those of their affiliated organizations, or those of the publisher, the editors and the reviewers. Any product that may be evaluated in this article, or claim that may be made by its manufacturer, is not guaranteed or endorsed by the publisher.
Footnotes
1Green infrastructure refers to natural and semi-natural systems that deliver ecosystem services for water management, including flood regulation, water purification, and groundwater recharge. It complements or substitutes grey infrastructure by harnessing vegetation, soils, and natural processes to enhance climate resilience and sustainability; examples include wetlands, green roofs, permeable pavements, and restored watersheds (Bertule et al., 2014; Browder et al., 2019).
References
Achumi, W. S., and Johar, V. (2024). Eco-climatic challenges and innovations: navigating the future of rubber plantations. Inter. J. Adv. Biochem. Res. 8 (6), 459–467.
Allen, R. G., Pereira, L. S., Raes, D., and Smith, M. (1998). Crop evapotranspiration-guidelines for computing crop water requirements-FAO Irrigation and drainage paper 56. 300, Rome: Fao, D05109.
Anderson, K. (2022). Maya women, non-traditional agriculture and “care”: rethinking feminist geographies of “care” from the Guatemalan Highlands. Canada: University of Toronto.
Ariana Bielek, C. M. (2011). From seeds to syndicates: explorations in collective actions for food sovereignty and resiliency in Guatemala Department of Sociology and Anthropology. Faculty of Arts and Social Science Simon Fraser University. Master of Arts, 112.
Arriaza, A., Hambidge, K. M., Krebs, N. F., Garcés, A., and Channon, A. A. (2022). The trend in mean height of Guatemalan women born between 1945 and 1995: a century behind. J. Health Popul. Nutr. 41 (1), 43. doi:10.1186/s41043-022-00324-8
Arts, B., Buizer, M., Horlings, L., Ingram, V., van oosten, C., and Opdam, P. (2017). Landscape approaches: a state of the art review. Annu. Rev. Environ. Resour. 42, 439–463. doi:10.1146/annurev-environ-102016-060932
Asafu-Adjaye, J., Blomqvist, L., Brand, S., Brook, B., DeFries, R., Ellis, E., et al. (2015). An ecomodernist manifesto. doi:10.13140/RG.2.1.1974.0646
Banco Mundial, Gobierno de la República de Guatemala, Alianza Mundial para la Contabilidad de la Riqueza y la Valoración de los Servicios de los Ecosistemas e Instituto de Investigación en Ciencias Naturales y Tecnología/Vicerrectoría de Investigación/Universidad Rafael Landívar, (2021). Cuenta de Ecosistemas de Guatemala.
BanguatURL, I. (2009). Cuenta Integrada de Tierras y Ecosistemas (CITE). Sistema de Contabilidad Ambiental y Económica Integrada de Guatemala. Available online at: https://www.url.edu.gt/publicacionesurl/FileCS.ashx?Id=40336.(Accessed April 15, 2023).
Beazley, R., Solórzano, A., and Barca, V. (2019). Study on shock-responsive social protection in latin america and the caribbean: summary of key findings and policy recommendations. Oxford, UK: Oxford Policy Management and World Food Programme.
Benra, F., De Frutos, A., Gaglio, M., Álvarez-Garretón, C., Felipe-Lucia, M., and Bonn, A. (2021). Mapping water ecosystem services: evaluating InVEST model predictions in data scarce regions. Environ. Model. Softw. 138, 104982. doi:10.1016/j.envsoft.2021.104982
Bertacchini, Y. (2012). Between information and communication process, the territorial intelligence, as a network concept and a framework to shape local development. Int. J. Humanit. Soc. Sci. 2, 2220–8488.
Bertacchini, Y., Maurel, P., and Deprez, P. (2012). “The territorial intelligence: a network concept and an info-communication process framework,” in Proceedings book of ISCL 2012, 969–979.
Bertacchini, Y., Maurel, P., Déprez, P., and Plant, R. (2013). The territorial intelligence: A network concept and an info-communication process framework. New Research into Culture, Media, Communication and Socialization, Book of Proceedings International Symposium on Language and Communication: Exploring Novelties.
Bertule, M., Lloyd, G. J., Korsgaard, L., Dalton, J., Welling, R., Barchiesi, S., et al. (2014). Green infrastructure guide for water management: Ecosystem-based management approaches for water-related infrastructure projects. Rep. No. 9280734040. UNEP-DHI, IUCN, TNC, WRI, Green Community Ventures, U.S. Army Corps of Engineers. Available at: https://wedocs.unep.org/bitstream/handle/20.500.11822/9291/-Green%20infrastructure%3a%20guide%20for%20water%20management%20%20-2014unep-dhigroup-green-infrastructure-guide-en.pdf?sequence=3∧isAllowed=y.
Beveridge, L., Whitfield, S., Fraval, S., van Wijk, M., van Etten, J., Mercado, L., et al. (2019). Experiences and drivers of food insecurity in Guatemala's dry corridor: insights from the Integration of Ethnographic and Household Survey Data. Front. Sustain. Food Syst. 3. doi:10.3389/fsufs.2019.00065
Blanco, J., Dendoncker, N., Barnaud, C., and Sirami, C. (2019). Ecosystem disservices matter: towards their systematic integration within ecosystem service research and policy. Ecosyst. Serv. 36, 100913. doi:10.1016/j.ecoser.2019.100913
Bolliger, J., Baettig, M., Gallati, J., Kläy, A., Stauffacher, M., and Kienast, F. (2011). Landscape multifunctionality: a powerful concept to identify effects of environmental change. Reg. Environ. Change 11, 203–206. doi:10.1007/s10113-010-0185-6
Borrelli, P., Robinson, D. A., Fleischer, L. R., Lugato, E., Ballabio, C., Alewell, C., et al. (2017). An assessment of the global impact of 21st century land use change on soil erosion. Nat. Commun. 8 (1), 2013. doi:10.1038/s41467-017-02142-7
Borselli, L., Cassi, P., and Torri, D. (2008). Prolegomena to sediment and flow connectivity in the landscape: a GIS and field numerical assessment. CATENA 75 (3), 268–277. doi:10.1016/j.catena.2008.07.006
Boyd, J., and Banzhaf, S. (2007). What are ecosystem services? The need for standardized environmental accounting units. Ecol. Econ. 63 (2-3), 616–626. doi:10.1016/j.ecolecon.2007.01.002
Browder, G., Ozment, S., Rehberger Bescos, I., Gartner, T., and Lange, Glenn, M. (2019). Integrating Green and Gray: Creating Next Generation Infrastructure. © World Bank and World Resources Institute. Available at: http://hdl.handle.net/10986/31430
Buckner, M. K. J. (2020). The strategic implications of climate change in central America: an assessment. Fort Leavenworth, KS: School of Advanced Military Studies, US Army Command and General Staff College.
Budyko, M. I. (1974). Climate and life: English ed. Editor David H. Miller. New York: Academic Press.
Bürgi, M., Celio, E., Diogo, V., Hersperger, A. M., Kizos, T., Lieskovsky, J., et al. (2022). Advancing the study of driving forces of landscape change. J. Land Use Sci. 17 (1), 540–555. doi:10.1080/1747423X.2022.2029599
Cámara de Industria de GuatemalaBanco de Guatemala (2020). Perspectivas económicas 2020–2021. Banco de Guatemala. Available online at: https://banguat.gob.gt/sites/default/files/banguat/Publica/conferencias/cbanguat751.pdf.(Accessed June 21, 2024).
Carrera, J. L., and Mosquera, V. (2023). Agua (Perfil Ambiental de Guatemala, Issue. C. Parens). Available online at: https://www.url.edu.gt/publicacionesurl/FileCS.ashx?Id=138781. (Accessed November 28, 2024).
Castellanos, E., Lemos, M. F., Astigarraga, L., Chacón, N., Cuvi, N., Huggel, L., et al. (2022). Central and South America (climate change 2022): impacts, adaptations and vulnerability. contribution of working group ii to the sixth assessment report of the intergovernmental panel on climate change, issue. Cambridge, United Kingdom and New York, NY, United States: IPCC.
Chen, X., and Nordhaus, W. D. (2011). Using luminosity data as a proxy for economic statistics. Proc. Natl. Acad. Sci. U. S. A. 108 (21), 8589–8594. doi:10.1073/pnas.1017031108
Chen, Y., and Vardon, M. (2024). Accounting for water-related ecosystem services to provide information for water policy and management: an Australian case study. Ecosyst. Serv. 69, 101658. doi:10.1016/j.ecoser.2024.101658
Chiarelli, D. D., Passera, C., Rulli, M. C., Rosa, L., Ciraolo, G., and D'Odorico, P. (2020). Hydrological consequences of natural rubber plantations in southeast Asia. Land Degrad. Dev. 31, 2060–2073. doi:10.1002/ldr.3591
Corrigan, C., and Hay-Edie, T. (2013). A toolkit to support conservation by Indigenous Peoples and local communities: building capacity and sharing knowledge for Indigenous peoples’ and community conserved territories and areas (ICCAs). Cambridge, UK: UNEP-WCMC.
Daily, G. C., Polasky, S., Goldstein, J., Kareiva, P. M., Mooney, H. A., Pejchar, L., et al. (2009). Ecosystem services in decision making: time to deliver. Front. Ecol. Environ. 7 (1), 21–28. doi:10.1890/080025
Dauvergne, P., and Poole Lehnhoff, K. (2024). The power of biojustice environmentalism in the global south: insights from the politics of reducing single-use plastics in Guatemala. J. Environ. Plan. Manag., 1–21. doi:10.1080/09640568.2024.2386550
Destiche, C. (2024). Growing resistance: indigenous food sovereignty and the need for a paradigm shift. The University of Arizona. Available online at: https://crfs.arizona.edu/growing-resistance-indigenous-food-sovereignty-and-need-paradigm-shift.(Accessed December 12, 2024).
Devine, J. A., Wrathall, D., Aguilar-González, B., Benessaiah, K., Tellman, B., Ghaffari, Z., et al. (2021). Narco-degradation: cocaine trafficking’s environmental impacts in central America’s protected areas. World Dev. 144, 105474. doi:10.1016/j.worlddev.2021.105474
DeYoung, D. J., Reyes, B., Osorno, J., Mejia, G., Villatoro, J. C., and Maredia, M. K. (2017). An overview of bean production practices, varietal preferences, and consumption patterns in the milpa system of the Guatemalan highlands: results of a farm household survey. Staff Paper Series 268951, Michigan State University, Department of Agricultural, Food, and Resource Economics.
Doll, C. H., Muller, J.-P., and Elvidge, C. D. (2000). Night-time imagery as a tool for global mapping of socioeconomic parameters and greenhouse gas emissions. AMBIO a J. Hum. Environ. 29 (3), 157–162. doi:10.1579/0044-7447-29.3.157
Edens, B., Maes, J., Hein, L., Obst, C., Siikamaki, J., Schenau, S., et al. (2022). Establishing the SEEA ecosystem accounting as a global standard. Ecosyst. Serv. 54, 101413. doi:10.1016/j.ecoser.2022.101413
Ellis, E., Lynas, M., and Nordhaus, T. (2023). Ecomodernism: a clarifying perspective. Anthropocene Rev. 11, 684–685. doi:10.1177/20530196231221495
Elvidge, C., Sutton, P., Tilottama, G., Tuttle, B., Baugh, K., Bhaduri, L., et al. (2009). A global poverty map derived from satellite data. Comput. Geosciences 35, 1652–1660. doi:10.1016/j.cageo.2009.01.009
Fenelon, J., and Alford, J. (2020). Envisioning Indigenous models for social and ecological change in the anthropocene. J. World-Systems Res. 26 (2), 372–399. doi:10.5195/jwsr.2020.996
Funcagua (2022). Informe del estado del agua de la Región Metropolitana de Guatemala. El agua nos une. Available online at: https://funcagua.org.gt/2022/03/22/2022-informe-del-estado-del-agua-de-la-region-metropolitana-de-guatemala-2022-funcagua-url-uvg-wwf. (Accessed November 02, 2023).
Gálvez, J., Andrews, K. L., Buch, M., Vargas, H., Pineda, P., Delgado, A. S. R, et al. (2015). Perfil del agro y la ruralidad de Guatemala 2014: situación actual y tendencias. Instituto de Agricultura; Recursos Naturales y Ambiente (IARNA); Instituto Interamericano de Cooperación para la Agricultura (IICA), Editorial Cara Parens. Available online at: https://www.url.edu.gt/publicacionesurl/FileCS.ashx?Id=40392.(Accessed February 18, 2023).
Gashaw, T., Worqlul, A. W., Dile, Y. T., Sahle, M., Adem, A. A., Bantider, A., et al. (2022). Evaluating InVEST model for simulating annual and seasonal water yield in data-scarce regions of the abbay (upper Blue Nile) basin: implications for water resource planners and managers. Sustain. Water Resour. Manag. 8, 170. doi:10.1007/s40899-022-00757-3
Gibson, C. C., Ostrom, E., and Ahn, T. K. (2000). The concept of scale and the human dimensions of global change: a survey. Ecol. Econ., 32(2), 217–239. doi:10.1016/S0921-8009(99)00092-0
Gimona, A., and van der Horst, D. (2007). Mapping hotspots of multiple landscape functions: a case study on farmland afforestation in Scotland. Landsc. Ecol. 22, 1255–1264. doi:10.1007/s10980-007-9105-7
Gobbi, J., and Casasola, F. (2003). Financial behaviour of investments in silvopastoral systems in cattle farms of Esparza, Costa Rica. Agroforestería en las Américas 10, (39–40). 52–60. Available online at: http://hdl.handle
Goldsmith, P. D. (2008). “Soybean production and processing in Brazil,” In Soybeans: Chemistry, production, processing and utilization. Editors Johnson, L., White, P., and Galloway, R. 773–798. Champaign: AOCS Press.
Grondard, N., Hein, L., and Van Bussel, L. G. J. (2021). Ecosystem accounting to support the common agricultural policy. Ecol. Indic., 131, 108157. doi:10.1016/j.ecolind.2021.108157
Hein, L., Obst, C., Edens, B., and Remme, R. (2015). Progress and challenges in the development of ecosystem accounting as a tool to analyse ecosystem capital. Curr. Opin. Environ. Sustain. 14, 86–92. doi:10.1016/j.cosust.2015.04.002
Helland, L. F. (2022). Indigenous pathways beyond the “Anthropocene”: biocultural climate justice through decolonization and land rematriation. NYU Env’t LJ 30, 347.
Henderson, J. V., Storeygard, A., and Weil, D. N. (2012). Measuring economic growth from outer space. Am. Econ. Rev. 102 (2), 994–1028. doi:10.1257/aer.102.2.994
Hersperger, A. M., Grădinaru, S. R., Pierri Daunt, A. B., Imhof, C. S., and Fan, P. (2021). Landscape ecological concepts in planning: review of recent developments. Landsc. Ecol. 36, 2329–2345. doi:10.1007/s10980-021-01193-y
Hervas, A. (2020). Cultivating vulnerability: oil palm expansion and the socio-ecological food system in the lachuá ecoregion, Guatemala. Reg. Environ. Change 20 (2), 45. doi:10.1007/s10113-020-01630-9
Hickel, J. (2021a). The anti-colonial politics of degrowth. Polit. Geogr. 88, 102404. doi:10.1016/j.polgeo.2021.102404
Hickel, J. (2021b). What does degrowth mean? A few points of clarification. Globalizations 18 (7), 1105–1111. doi:10.1080/14747731.2020.1812222
Hueting, R. (2010). Why environmental sustainability can Most probably not be attained with growing production. J. Clean. Prod., 18(6), 525–530. doi:10.1016/j.jclepro.2009.04.003
IARNA-URL (2009). Perfil Ambiental de Guatemala 2008–2009. Las señales ambientales críticas y su relación con el desarrollo. Available online at: http://www.infoiarna.org.gt/publicacion/perfil-ambiental-de-guatemala-2008-2009-las-senales-.ambientales-criticas-y-su-relacion-con-el-desarrollo/. (Accessed November 25, 2022).
IARNA-URL (2011). Cambio climático y biodiversidad Elementos para analizar sus interacciones en Guatemala con un enfoque ecosistémico (vol. 37). Available online at: http://www.infoiarna.org.gt/publicacion/cambio-climatico-y-biodiversidad-elementos-para-analizar-sus-interacciones-en-guatemala-con-un-enfoque-ecosistemico/. (Accessed November 25, 2022).
IARNA-URL (2012). Perfil Ambiental de Guatemala 2010-2012. Vulnerabilidad local y creciente construcción de riesgo (C. CLeaves, Ed.). Available online at: https://www.url.edu.gt/publicacionesurl/pPublicacion.aspx?pb=42. (Accessed November 21, 2022).
Incyt URL (2018). Perfil energético de Guatemala: bases para el entendimiento del estado actual y tendencias de la energía. Available online at: http://www.infoiarna.org.gt/wp-content/uploads/2019/03/Perfil-Energetico-de-Guatemala.pdf.(Accessed December 06, 2022).
INE (2021). Información estadística con enfoque de género y pueblos a nivel municipal del Censo XII de poblacíon y VII de vivienda 2018. Available online at: https://www.ine.gob.gt/ine/wp-content/uploads/2022/07/Republica-de-Guatemala.pdf. (Accessed April 15, 2023).
Isaac, J., Carrera, J. L., Monterroso Rivas, O., Gálvez Ruano, J., Rueda Martínez, M., Khowaja, A., et al. (2023). Evaluating and mitigating locally and nationally variable food security dynamics in Guatemala through participatory causal loop diagram building. Syst. Dyn. Rev. 39 (3), 239–276. doi:10.1002/sdr.1739
Isakson, S. R. (2009). No hay Ganancia en la milpa: the agrarian question, food sovereignty, and the on-farm conservation of agrobiodiversity in the Guatemalan highlands. J. Peasant Stud. 36 (4), 725–759. doi:10.1080/03066150903353876
Kallis, G. (2011). In defence of degrowth. Ecol. Econ., 70(5), 873–880. doi:10.1016/j.ecolecon.2010.12.007
Kallis, G., Kerschner, C., and Martinez-Alier, J. (2012). The economics of degrowth. Ecol. Econ. 84, 172–180. doi:10.1016/j.ecolecon.2012.08.017
Kauffer, E. (2014). Cuencas transfronterizas y gestión del agua: estados y actores sociales, entre conflictos y cooperación. Guest Editors: Edith Kauffer and Lucile Medina. Regions Cohes. 4, 30–53. doi:10.3167/reco.2014.040203
Kosoy, N., Brown, P. G., Bosselmann, K., Duraiappah, A., Mackey, B., Martinez-Alier, J., et al. (2012). Pillars for a flourishing Earth: planetary boundaries, economic growth delusion and green economy. Curr. Opin. Environ. Sustain., 4(1), 74–79. doi:10.1016/j.cosust.2012.02.002
Kuivanen, K., Alvarez, S., Michalscheck, M., Adjei-Nsiah, S., Descheemaeker, K., Mellon-Bedi, S., et al. et al. (2016). Characterising the diversity of smallholder farming systems and their constraints and opportunities for innovation: a case study from the northern region, Ghana. NJAS-Wageningen J. Life Sci. 78, 153–166. doi:10.1016/j.njas.2016.04.003
Lang, M. (2024). Degrowth, global asymmetries, and ecosocial justice: decolonial perspectives from Latin America. Rev. Int. Stud. 50 (5), 921–931. doi:10.1017/S0260210524000147
Lucas, P., and Vardon, M. (2021). Greening the recovery to make it last. A report prepared for the 5th policy forum on natural capital accounting for better decision making. The Hague: PBL.
Lyytimäki, J., Kjerulf Petersen, L., Normander, B., and Bezák, P. (2008). Nature as nuisance? Ecosystem services and disservices to urban lifestyle. Environ. Sci. 5, 161–172. doi:10.1080/15693430802055524
MAGA (2005). Atlas temático de la república de guatemala Serie de Recursos Naturales, Sociales, Productivos, Amenazas y Vulnerabilidad, Issue. G. y. A. Ministerio de Agricultura. Available online at: https://www.maga.gob.gt/download/atlas-tematico.pdf. (Accessed May 16, 2023).
MAGA (2021). cobertura vegetal y uso de la tierra. Available online at: https://apps.maga.gob.gt/sieagro/Normativas?sortOrder=Descripcion&categoriaId=38&clasificacionId=6&tipoId=1#:∼:text=GUATEMALA%2C%20A%C3%91O%202020-,OFRECE%20INFORMACION%20DE%20LA%20COBERTURA%20VEGETAL%20Y%20USO%20DE%20LA,AGROPECUARIA%2C%20RECURSOS%20NATURALES%20O%20AMBIENTALES
Mangmeechai, A. (2020). Effects of rubber plantation policy on water resources and landuse change in the northeastern region of Thailand. Geogr. Environ. Sustain. 13, 73–83. doi:10.24057/2071-9388-2019-145
Mazzocchi, F. (2020). A deeper meaning of sustainability: insights from Indigenous knowledge. Anthropocene Rev. 7 (1), 77–93. doi:10.1177/2053019619898888
McMahon, J., Hasan, S., Brooks, A., Curwen, G., Dyke, J., Saint Ange, C., et al. (2022). Challenges in modelling the sediment retention ecosystem service to inform an ecosystem account – examples from the mitchell catchment in northern Australia. J. Environ. Manag. 314, 115102. doi:10.1016/j.jenvman.2022.115102
Meyer, W. B., and Guss, D. M. T. (2017). Neo-environmental determinism, 39, 96. doi:10.1007/978-3-319-54232-4_5
Mittal, I., and Gupta, R. K. (2015). Natural resources depletion and economic growth in present era. SOCH-Mastnath J. Sci. Technol. (BMU, Rohtak) 10 (3).
Mulok, D., Kogid, M., Asid, R., and Lily, J. (2012). Is economic growth sufficient for poverty alleviation? Empirical evidence from Malaysia. Cuad. Econ. 35 (97), 26–32. doi:10.1016/s0210-0266(12)70020-1
Munguía, G., Gálvez, , and Juventino, . (2022). Tierras (Perfil Ambiental de Guatemala, Issue. C. Parens). Available online at: https://biblior.url.edu.gt/wp-content/uploads/publichlg/IARNA/serie_ambi/978-9929-54-446-8.pdf
Oliveira, E., and Hersperger, A. M. (2019). Disentangling the governance configurations of strategic spatial plan-making in European urban regions. Plan. Pract. Res. 34 (1), 47–61. doi:10.1080/02697459.2018.1548218
Parrique, T. (2019). The political economy of degrowth. Economics and Finance. Université Clermont Auvergne [2017-2020]; Stockholms universitet.
Parrique, T., Barth, J., Briens, F., Kuokkanen, A., and Spangenberg, J. (2019). Evidence and arguments against green growth as a sole strategy for sustainability. Eur. Environ. Bur.
Paulson, S. (2024). World-making technology entangled with coloniality, race and gender: ecomodernist and degrowth perspectives. Environ. Values 33 (1), 71–89. doi:10.1177/09632719231209741
Pechanec, V., Purkyt, J., Benc, A., Nwaogu, C., Štěrbová, L., and Cudlín, P. (2018). Modelling of the carbon sequestration and its prediction under climate change. Ecol. Inf., 47, 50–54. doi:10.1016/j.ecoinf.2017.08.006
Pérez de la Fuente, B. (2016). Economic growth and poverty reduction in a rapidly changing world, European Economy. Economic Brief. 19, 2–17. doi:10.2765/730208
Pérez Irungaray, G., Gálvez, J., Pineda, P., Gándara, A., and Herrera, D. (2020). Bases conceptuales y metodológicas para el análisis territorial del riesgo en Guatemala: Énfasis en vulnerabilidad sistémica y amenazas climáticas. Universidad Rafael Landívar, Editorial Cara Parens.
Piquer-Rodríguez, M., Gasparri, N., Aráoz, E., Grau, R., and Zarbá, L. (2021). Land systems’ asymmetries across transnational ecoregions in South America. Sustain. Sci. doi:10.1007/s11625-021-00967-2
Rao, A. R., and Srinivas, V. (2006). Regionalization of watersheds by hybrid-cluster analysis. J. Hydrol. 318 (1-4), 37–56. doi:10.1016/j.jhydrol.2005.06.003
Redhead, J. W., Stratford, C., Sharps, K., Jones, L., Ziv, G., Clarke, D., et al. (2016). Empirical validation of the InVEST water yield ecosystem service model at a national scale. Sci. Total Environ. 569–570, 1418–1426. doi:10.1016/j.scitotenv.2016.06.227
Richardson, K., Steffen, W., Lucht, W., Bendtsen, J., Cornell, S. E., Donges, J. F., et al. (2023). Earth beyond six of nine planetary boundaries. Sci. Adv., 9(37), eadh2458. doi:10.1126/sciadv.adh2458
Rodrik, D. (2000). Growth versus poverty reduction: a hollow debate. Finance Dev. 37 (4). Available online at: https://www.imf.org/external/pubs/ft/fandd/2000/12/rodrik.htm.
Sain, G., Loboguerrero, A. M., Corner-Dolloff, C., Lizarazo, M., Nowak, A., Martínez-Barón, D., et al. (2017). Costs and benefits of climate-smart agriculture: the case of the dry corridor in Guatemala. Agric. Syst., 151, 163–173. doi:10.1016/j.agsy.2016.05.004
Saubes, N., Gálvez, J., Pérez, G., and Gándara, A. (2015). Balance hidrológico de las subcuencas de la República de Guatemala. Bases fundamentales para la gestión del agua a largo plazo. Guatemala: Instituto de Agricultura, Recursos Naturales y Ambiente de la Universidad Rafael Landívar de Guatemala.
Schindler, S., Sebesvari, Z., Damm, C., Euller, K., Mauerhofer, V., Schneidergruber, A., et al. (2014). Multifunctionality of floodplain landscapes: relating management options to ecosystem services. Landsc. Ecol. 29, 229–244. doi:10.1007/s10980-014-9989-y
Schmelzer, M., and Nowshin, T. (2023). Ecological reparations and degrowth: towards a convergence of alternatives around world-making after growth. Development 66 (1), 15–22. doi:10.1057/s41301-023-00360-9
Schneider, F., Kallis, G., and Martinez-Alier, J. (2010). Crisis or opportunity? Economic degrowth for social equity and ecological sustainability. Introduction to this special issue. J. Clean. Prod., 18(6), 511–518. doi:10.1016/j.jclepro.2010.01.014
Schulte, R. P. O., Bampa, F., Bardy, M., Coyle, C., Creamer, R. E., Fealy, R., et al. (2015). Making the Most of our land: managing soil functions from local to Continental scale. Front. Environ. Sci. 3 (81). doi:10.3389/fenvs.2015.00081
Schulte, R. P. O., Creamer, R. E., Donnellan, T., Farrelly, N., Fealy, R., O’Donoghue, C., et al. (2014). Functional land management: a framework for managing soil-based ecosystem services for the sustainable intensification of agriculture. Environ. Sci. Policy, 38, 45–58. doi:10.1016/j.envsci.2013.10.00215
Segeplan (2019). Guatemala urbana rural políticas y financiamiento. Montevideo. Secretaria de Planificación y Programación de la Presidencia. Available online at: https://crp-ilpes.cepal.org/17/sites/crpilpes17/files/presentations/pres_guatemala_urb-rural.pdf.
Selman, P. (2009). Planning for landscape multifunctionality. Sustain. Sci. Pract. Policy 5 (2), 45–52. doi:10.1080/15487733.2009.11908035
Shackleton, C., Ruwanza, S., Sinasson, G., Bennett, S., Lacy, P., Modipa, R., et al. (2016). Unpacking pandora’s box: understanding and categorising ecosystem disservices for environmental management and human wellbeing. Ecosystems 19, 587–600. doi:10.1007/s10021-015-9952-z
Sharp, R., Douglass, J., Wolny, S., Arkema, K., Bernhardt, J., Bierbower, W., et al. (2020). “InVEST 3.8.9.User’s guide,” in The natural capital project (Stanford University, University of Minnesota, The Nature Conservancy, and World Wildlife Fund).
Sharp, R., Tallis, H., Ricketts, T., Guerry, A., Wood, S., Chaplin-Kramer, R., et al. (2015). “InVEST 3.2. 0 user’s guide,” in The natural capital project, 133. Stanford University, University of Minnesota, The Nature Conservancy, and World Wildlife Fund.
Sharp, R., Tallis, H. T., Ricketts, T., Guerry, A. D., Wood, S. A., Chaplin-Kramer, R., et al. (2014). InVEST 3.8.9.post10+ug.gf658986 user’s guide. The Natural Capital Project, Stanford University, University of Minnesota, The Nature Conservancy, and World Wildlife Fund.
Shi, L., Foody, G. M., Boyd, D. S., Girindran, R., Wang, L., Du, Y., et al. (2020). Night-time lights are more strongly related to urban building volume than to urban area. Remote Sens. Lett. 11 (1), 29–36. doi:10.1080/2150704X.2019.1682709
Silburt, A. (2019). Complex systems theory and the maya cosmovision: empowering Indigenous knowledge holders to advance interdisciplinary research. Canada: University of Waterloo.
Slotterback, C. S., Runck, B., Pitt, D. G., Kne, L., Jordan, N. R., Mulla, D. J., et al. (2016). Collaborative geodesign to advance multifunctional landscapes. Landsc. Urban Plan. 156, 71–80. doi:10.1016/j.landurbplan.2016.05.011
Sluyter, A. (2003). Neo-environmental determinism, intellectual damage control, and nature/society science. Antipode 35, 813–817. doi:10.1046/j.1467-8330.2003.00354.x
Statista (2024). Income distribution inequality based on gini coefficient in Latin America as of 2022, by country. Statista. Available online at: https://www.statista.com/statistics/980285/income-distribution-gini-coefficient-latin-america-caribbean-country/.
Steffen, W., Richardson, K., Rockström, J., Cornell, S. E., Fetzer, I., Bennett, E. M., et al. (2015). Planetary boundaries: guiding human development on a changing planet. Science 347 (6223), 1259855. doi:10.1126/science.1259855
Suarez, E., Chatenoux, B., and De Bono, A. (2016). Estimation of the regional GDP using VIIRS nighttime lights. Internship at GRID-Geneva as part of the Geomatics Certificate UNIGE. Available online at: https://ise.unige.ch/geomrapport/rapports/ENA-SUAREZ-MEMOIRE-GEOMATIQUE.pdf.
Sungthongwises, K., Taweekij, S., Mok, P.-K., Ho, W.-S., Hamim, H., Mutyandini, A., et al. (2019). Soil fertility and diversity of microorganism under rubber plantation. Asian J. Plant Sci. 18, 148–152. doi:10.3923/ajps.2019.148.152
Sutton, P. C., Elvidge, C. D., and Ghosh, T. (2007). Estimation of gross domestic product at sub-national scales using nighttime satellite imagery. Int. J. Ecol. Econ. Statistics 8 (S07), 5–21.
Tallis, H., and Polasky, S. (2009). Mapping and valuing ecosystem services as an approach for conservation and natural-resource management. Ann. N. Y. Acad. Sci. 1162 (1), 265–283. doi:10.1111/j.1749-6632.2009.04152.x
Tilottama, G., Powell, R., Elvidge, C., Baugh, K., and Sutton, P. (2010). Shedding light on the global distribution of economic activity. Open Geogr. J. 3, 147–160. doi:10.2174/1874923201003010147
UIE (2020). Unidad de Información Estratégica para la Investigación y Proyección Viccerectoría de Investigación y Proyección Universidad Rafael Landívar. Available online at: https://sie.url.edu.gt/publicaciones-iarna/.
UNEP (2011). Decoupling natural resource use and environmental impacts from economic growth. A report of the working group on decoupling to the international resource panel. United Nations Environment Programme. Editors M. Fischer-Kowalski, M. Swilling, E.U. von Weizsäcker, Y. Ren, Y. Moriguchi, W. Crane, et al. United Nations Environment Programme. Available online at: http://resourcepanel.org/reports/decoupling-naturalresource-use-and-environmental-impacts-economic-growith.
United Nations (2012). System of environmental-economic accounting 2012. Available online at: https://seea.un.org/ecosystem-accounting.
United Nations (2021). System of Environmental-Economic Accounting—Ecosystem Accounting (SEEA EA). White cover publication, pre-edited text subject to official editing. New York: The United Nations, European Union, Food and Agriculture Organization of the United Nations, International Monetary Fund Organisation for Economic Co-operation and Development, The International Bank for Reconstruction and Development/The World Bank.
van den Bergh, J., and Kallis, G. (2012). Growth, A-growth or degrowth to stay within planetary boundaries? J. Econ. Issues 46, 909–920. doi:10.2753/JEI0021-3624460404
VanderWilde, C. (2023). Deforestation, certification, and transnational supply chains: a study of the palm oil sector. University of Michigan. Doctorate.
Vardon, M., Castaneda, J.-P., Nagy, M., and Schenau, S. (2018). How the system of environmental-economic accounting can improve environmental information systems and data quality for decision making. Environ. Sci. Policy 89, 83–92. doi:10.1016/j.envsci.2018.07.007
Vardon, M. J., Le, T. H. L., Martinez-Lagunes, R., Pule, O. B., Schenau, S., May, S., et al. et al. (2025). Accounting for water: a global review and indicators of best practice for improved water governance. Ecol. Econ. 227, 108396. doi:10.1016/j.ecolecon.2024.108396
Vigerstol, K., and Aukema, J. (2011). A comparison of tools for modeling freshwater ecosystem services. J. Environ. Manag. 92, 2403–2409. doi:10.1016/j.jenvman.2011.06.040
Wentland, S. A., Ancona, Z. H., Bagstad, K. J., Boyd, J., Hass, J. L., Gindelsky, M., et al. (2020). Accounting for land in the United States: integrating physical land cover, land use, and monetary valuation. Ecosyst. Serv., 46, 101178. doi:10.1016/j.ecoser.2020.101178
Widders, I., Flores, L., and Castellanos, S. (2017). “Community seed depots–achieving dual objectives of sustainable bean seed access and nutritional security in Guatemalan highlands,” in Proceedings of the New Models for Legume Seed Business: Resilience, Nutrition and Reaching Farmers at the Last Mile. Washington, DC: USAID, CRS, and Seed Systems. March 1-2, 2017.
Wiedmann, T., Lenzen, M., Keyßer, L. T., and Steinberger, J. K. (2020). Scientists’ warning on affluence. Nat. Commun. 11 (1), 3107. doi:10.1038/s41467-020-16941-y
World Bank (2024). The world bank in Guatemala. World Bank Group. Retrieved October 14 from Available online at: https://www.worldbank.org/en/country/guatemala/overview#:∼:text=Guatemala%20is%20the%20largest%20economy,of%20%24104.4%20billion%20in%202023.
Xiang, H., Jia, M., Wang, Z., Li, L., Mao, D., Zhang, D., et al. (2018). Impacts of land cover changes on ecosystem carbon stocks over the transboundary tumen river basin in northeast Asia. Chin. Geogr. Sci. 28 (6), 973–985. doi:10.1007/s11769-018-1006-y
Xiao, Q.-L., Wang, Y., and Zhou, W.-X. (2021). Regional economic convergence in China: a comparative study of nighttime light and GDP. Front. Phys. 9. doi:10.3389/fphy.2021.525162
Yusuf, A. Z. A., Komarulzaman, A., and Sumner, A. (2023). Will economic growth be sufficient to end global poverty? New projections of the UN sustainable development goals. WIDER Working Paper. WIDER Working Paper 2023/123. Helsinki: UNU-WIDER. doi:10.35188/UNU-WIDER/2023/431-1
Zarandian, A., Badamfirouz, J., Musazadeh, R., Rahmati, A., and Azimi, S. B. (2018). Scenario modeling for spatial-temporal change detection of carbon storage and sequestration in a forested landscape in northern Iran. Environ. Monit. Assess. 190 (8), 474. doi:10.1007/s10661-018-6845-6
Zhang, F., Zhan, J. Y., Zhang, Q., Yao, L. N., and Liu, W. (2017). Impacts of land use/cover change on terrestrial carbon stocks in Uganda. Phys. Chem. Earth 101, 195–203. doi:10.1016/j.pce.2017.03.005
Keywords: water yield, sediment, system of environmental-economic accounting, landscape multifunctionality, water use intensity, ecosystem accounting areas, socio-ecological land systems
Citation: Pinillos D, Reyes P, Barrera V, Pineda P, Goyzueta JM, Schulte R and Castaneda J-P (2025) Economic system impacts and dependencies on water-related ecosystem services: defining analytical spatial units from an ecosystem accounting perspective in Guatemala. Front. Environ. Sci. 13:1459828. doi: 10.3389/fenvs.2025.1459828
Received: 04 July 2024; Accepted: 04 June 2025;
Published: 03 September 2025.
Edited by:
Pedro Cabral, Nanjing University of Information Science and Technology, ChinaReviewed by:
Zahid Hussain, Liaoning University, ChinaNatavan Namazova, Azerbaijan Technical University, Azerbaijan
Copyright © 2025 Pinillos, Reyes, Barrera, Pineda, Goyzueta, Schulte and Castaneda. This is an open-access article distributed under the terms of the Creative Commons Attribution License (CC BY). The use, distribution or reproduction in other forums is permitted, provided the original author(s) and the copyright owner(s) are credited and that the original publication in this journal is cited, in accordance with accepted academic practice. No use, distribution or reproduction is permitted which does not comply with these terms.
*Correspondence: Daniel Pinillos, ZGFuaWVsYWxmcmVkb3BpbmlsbG9zQGdtYWlsLmNvbQ==