 Ronald Katende
- Department of Mathematics Kabale University, Kabale, Uganda
Introduction: Climate resilience varies substantially across low-income countries (LICs), with agriculture often being the most vulnerable sector. Agricultural systems in these regions are typically rainfed, labor-intensive, and highly sensitive to climate variability. Yet, many LICs lack the high-resolution data needed to assess resilience at both national and local levels.
Methods: This study proposes a two-part framework to evaluate climate resilience across data sparse settings. First, sector-specific resilience is assessed at the national level using harmonized panel data and dynamic panel GMM regression models, incorporating structural and climate related variables. Second, a localized mapping approach is developed that integrates sparse field data with satellite-derived indicators. Agricultural productivity is interpolated across regions using kriging, a geostatistical technique optimized for sparse datasets. The study introduces the Resilience Asymmetry Surface (RAS) to visualize how resilience jointly depends on income and climate stress.
Results: National-level analysis shows that service sectors are more resilient to climate variability, while agriculture remains particularly vulnerable without structural support. At the local level, kriging-based interpolation of agricultural yield using sparse ground data and satellite inputs proves robust, with cross-validated RMSE values under 0.6 tons per hectare in Uganda, Kenya, and India. The RAS further highlights that similar climate exposures can yield very different resilience outcomes depending on a country’s economic conditions.
Discussion: This framework enables climate-informed planning even in data-constrained environments by combining cross-country econometric modeling with localized spatial analysis. It supports national strategy development and targeted regional interventions, providing practical tools for policymakers seeking to strengthen resilience in LICs. The approach is scalable, cost-effective, and leverages openly available data, making it accessible for use in similarly under-resourced contexts.
1 Introduction
The resilience of economic sectors to climate change varies widely across low-income countries (LICs), with agriculture often the most exposed and least protected. Agricultural systems in these regions are typically rainfed, labor-intensive, and highly dependent on seasonal patterns, making them particularly vulnerable to even moderate shifts in climate conditions (Habib-Ur-Rahman et al., 2022; Raza et al., 2019). Although resilience is influenced by structural and institutional factors—such as economic diversification, infrastructure, and governance—agriculture remains disproportionately affected due to its biophysical sensitivity and limited adaptive capacity (Leahy and Robins, 2021; Lemi and Hailu, 2019).
While a growing body of literature has examined climate resilience, most studies are focused on single-country contexts or subnational case studies. This narrow scope makes it difficult to understand broader patterns of vulnerability and adaptation, and limits the ability to draw general lessons across LICs (Badiane and Makombe, 2014; Dell et al., 2014). Cross-country comparisons, when available, often lack consistent data or fail to consider differences in sectoral exposure and structural capacity. A second limitation in the literature lies in the lack of localized assessments of climate impact, especially in rural agricultural regions. These areas are often excluded from large-scale analyses due to the scarcity of high-resolution, ground-based data. Yet they are also where climate stress hits hardest (Bussi et al., 2021; Portier et al., 2023). In many LICs, national datasets are incomplete or outdated, and field monitoring networks are thin or absent (Costella et al., 2023). As a result, most climate-agriculture models rely on either aggregate statistics or simulation-based estimates, with limited ground-truthing or spatial specificity (Wiréhn et al., 2017).
This study addresses these gaps through a two-part framework. First, it introduces a cross-country comparative analysis of sectoral climate resilience, combining meta-analysis with panel data models to capture structural and climatic drivers across different national settings. Second, it presents a localized climate-agriculture mapping approach, designed specifically for data-scarce environments. The method integrates sparse in situ data with high-resolution satellite imagery and uses kriging-based spatial interpolation to estimate agricultural productivity under climate stress at subnational levels.
Together, these methods provide a practical set of tools for planning and decision-making in regions where conventional data systems are weak. The framework supports both broad comparisons across countries and fine-grained vulnerability mapping within them. The key contributions of this paper are threefold:
1. A cross-country comparative framework for analyzing sectoral climate resilience, revealing shared patterns of vulnerability and adaptation across LICs.
2. A localized mapping technique that integrates sparse agricultural and climate data with satellite imagery using spatial interpolation, yielding fine-grained productivity estimates under climate variability.
3. Tools to support national and regional policy through evidence-based insights derived from harmonized datasets and spatial modeling tailored to data-scarce settings.
This work builds on recent developments in geospatial econometrics and spatial data science to extend climate resilience analysis beyond data-rich regions (Clingingsmith and Williamson, 2005; Diao et al., 2018). While both kriging and panel data models have been applied in climate-agriculture studies before, their integration into a resilience-focused framework for LICs remains rare. The study also includes cross-validation to evaluate interpolation accuracy—responding to previous critiques of empirical weakness in spatial modeling approaches (Wiréhn et al., 2017; Mazungunye and Punt, 2022).
2 Methodology
This study uses a two-part methodological approach to analyze climate resilience in low-income countries (LICs), focusing on both national-level sectoral patterns and localized agricultural productivity under climate stress. The first component is a cross-country statistical model that quantifies how different sectors—particularly agriculture, industry, and services—respond to climate variability across countries. The second component develops a spatial mapping method that estimates agricultural productivity in specific locations, even where field data are sparse, using satellite imagery and interpolation techniques. Together, these two components capture both the broad, structural patterns of resilience across countries and the localized vulnerabilities that standard macro-level models often miss.
2.1 Cross-country sectoral resilience estimation
The first part of the analysis is built around a panel data model that compares how economic sectors in LICs respond to climatic conditions over time. To support this, we first conducted a meta-analysis to compile sector-level economic and climate data from publicly available sources, including the World Bank, FAOSTAT, and national statistics bureaus. These datasets covered indicators such as agricultural yield, sectoral GDP, temperature, and rainfall.
Due to differences in how countries collect and report data, we applied harmonization steps to standardize coverage across years and countries. This included linear interpolation to address temporal gaps, and multiple imputation to account for missing values in economic and climate indicators (Badiane and Makombe, 2014; Lemi and Hailu, 2019). The model estimates sectoral resilience—defined here as the ability of a sector to maintain performance in the face of climate stress. This is done using the System Generalized Method of Moments (GMM), which is well-suited for dynamic panels with unbalanced observations and endogenous regressors (Dell et al., 2014). The estimated equation is:
In Equation 1,
2.2 Localized climate-agriculture mapping using sparse data
While the panel model captures cross-country trends, it cannot reveal what is happening at more granular, subnational levels—especially in rural farming regions where vulnerability is highest. To address this, we developed a localized mapping approach that estimates agricultural productivity using limited ground data and satellite imagery. Field-level yield data were collected from open-access sources, including government reports, agricultural research stations, and survey datasets, with geographic coverage focused on Uganda, Kenya, and India. These data are often irregular in spacing and coverage, especially in remote or resource-poor regions (Bussi et al., 2021; Portier et al., 2023). To enhance spatial coverage, we integrated these sparse field points with satellite-derived indicators, including rainfall data from CHIRPS and vegetation indices (NDVI) from the MODIS platform (Raza et al., 2019; Mazungunye and Punt, 2022). We then modeled agricultural productivity at any location
In Equation 2,
Here,
We benchmarked kriging against two alternative methods: inverse distance weighting (IDW) and spline interpolation. Across all cases, kriging produced better predictive performance, especially in regions with few observations. To test accuracy, we used five-fold cross-validation, rotating the withheld data used for validation in each fold. The root mean squared error (RMSE) was used as the evaluation metric, and results confirmed kriging’s robustness in sparse-data environments (Wiréhn et al., 2017; Mazungunye and Punt, 2022).
By combining spatial econometric modeling with satellite imagery, this approach allows us to create high-resolution maps of agricultural productivity that are both data-efficient and grounded in observed patterns. These maps are particularly useful for identifying vulnerable regions where climate adaptation measures, such as irrigation or crop diversification, may be most urgently needed—even in places where no systematic field data exist.
3 Cross-country and localized insights into resilience
The results of this study are grounded in the methodological framework described earlier. The goal is to reveal how climate variability affects economic sectors across countries, and more specifically, how agricultural productivity varies within countries where data are sparse. These results provide both a bird’s-eye view of resilience patterns across LICs and a close-up of vulnerable farming zones at the subnational level. The aim is not only analytical, but also practical—to support decision-making in contexts where limited data often constrain planning.
We begin by analyzing how resilience differs across sectors and countries. Using harmonized panel data and the regression model previously introduced, we estimate how responsive each economic sector is to changes in temperature and rainfall, controlling for structural conditions like labor force composition and infrastructure. This estimation, shown in Equation 4, follows Equation 1 from the methodology:
The results show clear and consistent trends. Agriculture emerges as the most climate-sensitive sector, with resilience scores decreasing sharply in response to increased temperature volatility and declining rainfall. By contrast, service sectors remain relatively insulated, likely due to their lower dependency on weather-sensitive inputs and infrastructure. These findings confirm earlier observations from the literature (Habib-Ur-Rahman et al., 2022; Raza et al., 2019; Lemi and Hailu, 2019), which emphasize the climate exposure of primary sectors in low-income contexts.
Beyond individual countries, we group countries based on how their sectors respond to climate variables. Cluster analysis on the estimated resilience coefficients reveals three dominant country types. The first cluster includes countries that show low resilience across all sectors and are also exposed to high climatic variability—typically fragile states or post-conflict economies. The second group features stronger performance in industrial and service sectors but still shows weak agricultural resilience. This pattern often aligns with countries undergoing structural transition, where agriculture remains under-invested. The third group shows a more balanced profile, with moderate climate exposure and medium to high resilience across sectors. This categorization offers a useful way to tailor adaptation strategies. For example, countries in the first cluster may need foundational support in infrastructure and governance, while those in the second may benefit from targeted agricultural innovation and finance programs (Badiane and Makombe, 2014; Diao et al., 2018).
However, while cross-country trends are useful, they cannot capture the heterogeneity within countries. National averages often mask sharp local disparities in how climate affects productivity, especially in rural farming regions. To address this, we apply a spatially explicit mapping approach, (c.f. Equation 5) based on the geospatial econometric model defined in Equation 2
Here,
From Equation 6, each weight
Crucially, the maps produced through this method are not just technical artifacts—they are decision tools. They highlight zones where productivity is consistently low, pointing to areas where climate adaptation efforts should be prioritized. Conversely, they also reveal areas that perform well under stress, which may offer lessons in resilience that can be scaled or replicated elsewhere. This kind of spatial intelligence is especially valuable for planning investments in irrigation, extension services, or targeted subsidies, particularly in places where official statistics are outdated or unavailable (Bussi et al., 2021; Costella et al., 2023). To operationalize the mapping approach, we developed a simple algorithmic framework that integrates data collection, model estimation, interpolation, and visualization into a repeatable workflow. The process starts with merging satellite data and local yield observations into a GIS platform. Next, model coefficients are estimated using ordinary least squares. These are then used in the kriging interpolation to predict productivity across space. The final step involves mapping the results to identify vulnerable and high-performing zones.
The strength of this approach lies in its simplicity and adaptability. It works with the kind of data that many low-resource countries already have access to—limited field observations and open-source satellite imagery. Yet, by structuring and modeling these inputs carefully, it yields outputs that can guide both national strategies and local interventions. This combined framework—statistical resilience modeling at the national level and localized mapping at the subnational level—offers a scalable and data-efficient way to understand climate risk. More importantly, it makes that understanding usable by those who need it most: policymakers, planners, and local officials working in environments where information is limited, but the stakes are high.
4 Model validation
4.1 Cluster analysis of agricultural yield and GDP per capita
Figure 1 shows how countries cluster when grouped by agricultural yield and GDP per capita. The clustering highlights three distinct groups, each with implications for climate resilience policy.
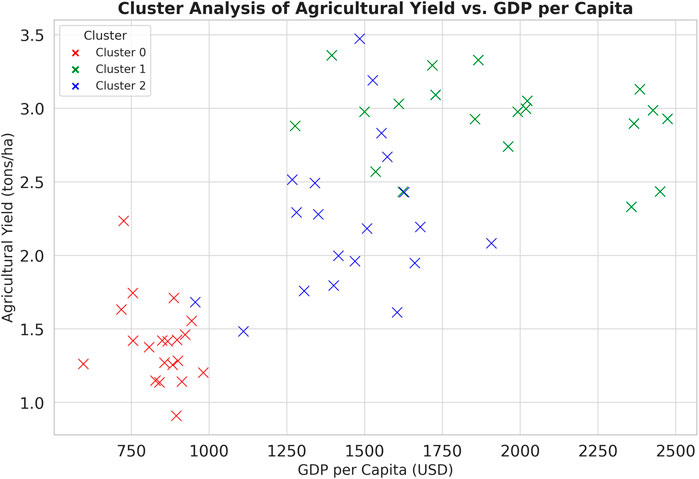
Figure 1. Cluster Analysis of Agricultural Yield vs. GDP per Capita.
Countries in Cluster 0 have both low income (GDP per capita below $1000) and low crop yields (under 2 tons per hectare). These countries are highly vulnerable: they lack both the economic resources and agricultural performance to absorb climate shocks. Their resilience is constrained not just by environmental factors, but by limited infrastructure, weak institutions, and low investment in adaptation systems. This group typically represents countries where policy support, climate finance, and capacity-building efforts are most urgently needed.
In contrast, Cluster 1 includes countries with higher income and better yields. Here, average GDP per capita exceeds $1000, and yields are generally above 2 tons/ha. These countries have been more successful in building resilience, largely due to stronger economic diversification, better access to inputs and technologies, and functioning support systems. Their position in the cluster map reflects a higher capacity to adapt.
Cluster 2 includes countries with intermediate characteristics—either modest incomes but relatively decent yields, or higher incomes with underperforming yields. These mixed cases may be at a tipping point: well-targeted investments in technology or governance could move them toward higher resilience, while neglect could push them into deeper vulnerability.
This cluster analysis supports the broader conclusion that resilience is shaped by both climatic and economic factors. Countries with similar climate conditions may show different outcomes depending on their structural readiness and development pathways (Lemi and Hailu, 2019; Badiane and Makombe, 2014).
4.2 PanelOLS estimation of agricultural yield
The regression results in Table 1 show how key factors affect agricultural yields across countries. While the overall model explains only a small portion of the variance (R-squared of 0.034), it still offers useful insights. The coefficient on precipitation is positive and nearly significant (p = 0.094), suggesting that rainfall plays an important role in shaping agricultural output, even if the relationship is not strongly linear. This aligns with existing studies emphasizing the yield-sensitivity of rainfed systems in LICs (Habib-Ur-Rahman et al., 2022; Raza et al., 2019). Temperature has a negative coefficient, as expected, though not statistically significant in this model. This suggests that heat stress may reduce yields, but the effect varies across contexts. In regions with better infrastructure or heat-tolerant crops, the impact may be partially offset. GDP per capita is positively signed but insignificant, reflecting the earlier cluster result, i.e., income matters, but its effect is mediated by how it is spent—whether on technology, access to markets, or policy support. Finally, the share of the labor force in agriculture appears to have no clear relationship with yield in this model, which may reflect structural inefficiencies in agricultural labor markets—where a large workforce does not necessarily translate to high productivity.
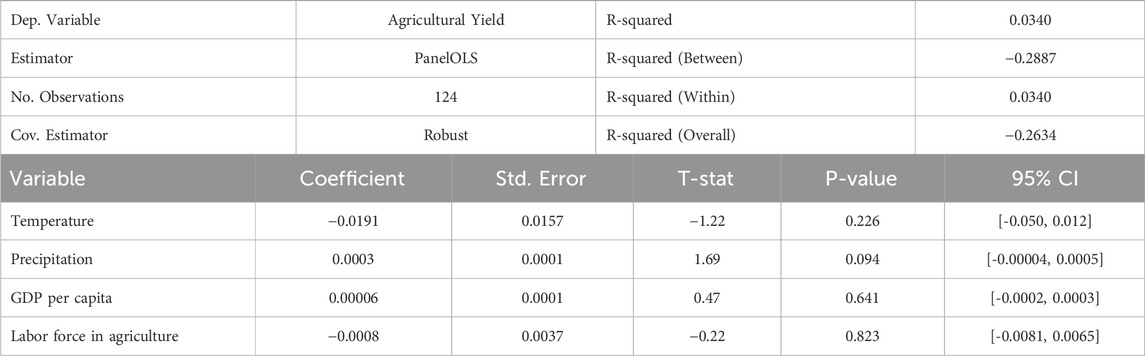
Table 1. PanelOLS estimation of agricultural yield.
4.3 Kriging-based interpolation of agricultural productivity
Figure 2 presents a spatial interpolation of agricultural productivity using kriging, combining sparse ground-level data with satellite-derived climate variables. The resulting map illustrates how productivity varies significantly across geographic space—even within relatively small regions—and helps identify pockets of climatic and structural vulnerability. The map reveals areas of comparatively high productivity, typically clustered in zones with moderate rainfall, fertile soils, and better infrastructure such as roads and market access. In contrast, low-productivity zones are often found in more peripheral or arid regions, where poor soil quality, limited access to water, and infrastructural deficits constrain output. Some areas fall below 1.5 tons per hectare, highlighting chronic production challenges. This spatial approach is crucial for policy planning in low-income, data-scarce environments. It enables the identification of priority zones for targeted interventions—such as irrigation investment, infrastructure upgrades, or soil rehabilitation—without requiring exhaustive ground data. Additionally, high-performing regions can be analyzed for best practices and potentially scaled as models of climate resilience. By leveraging limited data with robust geostatistical methods, this tool offers a scalable, cost-effective approach to localized adaptation planning and resource allocation (Bussi et al., 2021; Costella et al., 2023).
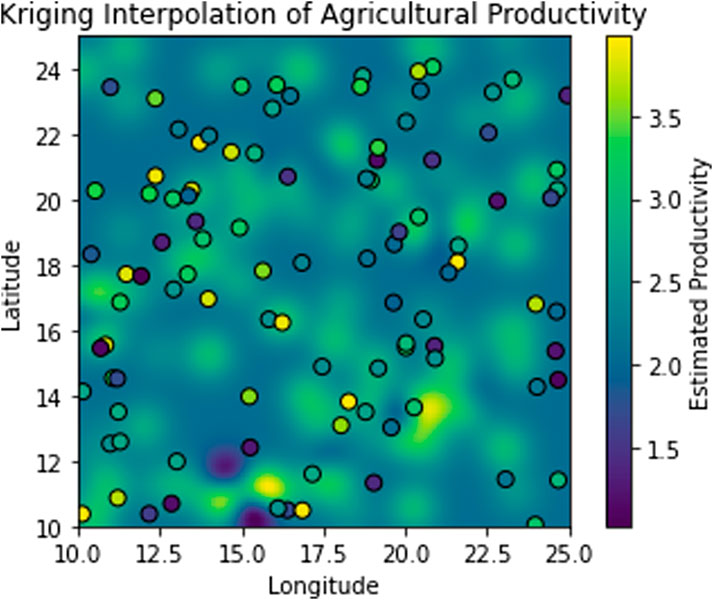
Figure 2. Kriging-based interpolation of agricultural productivity.
4.4 Resilience model: Sector-level panel estimation
The model presented in Table 2 estimates sector-specific contributions to national climate resilience. The results show that both industry and services significantly improve resilience, while agriculture has a statistically weak effect. The strong result for services (coefficient = 0.137, p = 0.0002) suggests that economies with robust service sectors—education, health, financial services—are better positioned to absorb climate shocks. This reinforces the importance of economic diversification as a resilience strategy (Badiane and Makombe, 2014; Diao et al., 2018). Temperature is also positively associated with resilience, which may seem counterintuitive. However, it likely reflects adaptive responses—such as the adoption of heat-tolerant crops or shifts to more climate-resilient economic activities—especially in countries with adequate institutional support (Habib-Ur-Rahman et al., 2022). Precipitation, again, shows a weak but positive influence. Its low statistical significance highlights that rainfall alone does not determine resilience; what matters is how rainfall is managed—through irrigation, storage, or planning systems.
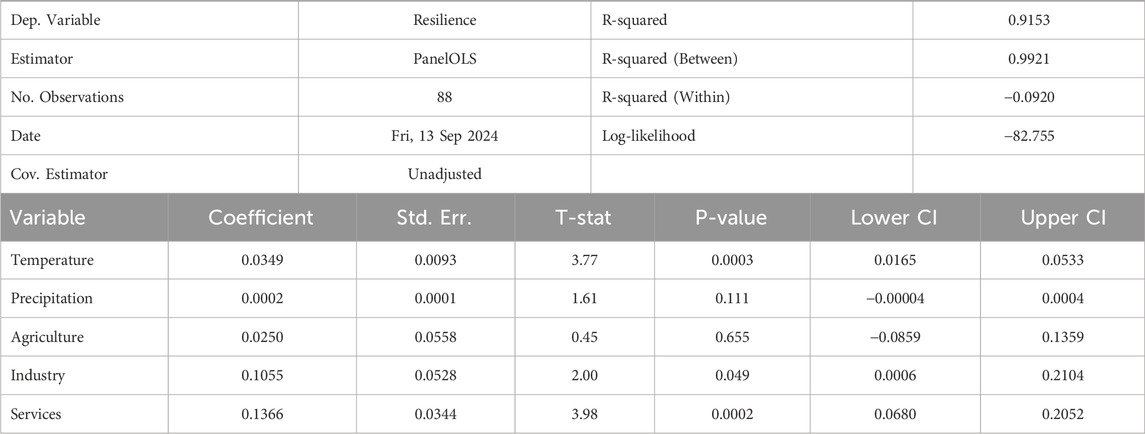
Table 2. PanelOLS estimation: Climate and sectoral predictors of resilience.
Figure 3 shows how countries cluster based on structural characteristics and resilience scores, using a PCA-based visualization for clarity. Each point represents a country, positioned along two principal components that summarize key indicators: GDP per capita, labor force distribution in agriculture, and the sectoral share of industry and services, alongside resilience estimates from our panel model. While PCA is used here solely for visual simplification, the clustering itself is grounded in actual structural metrics.
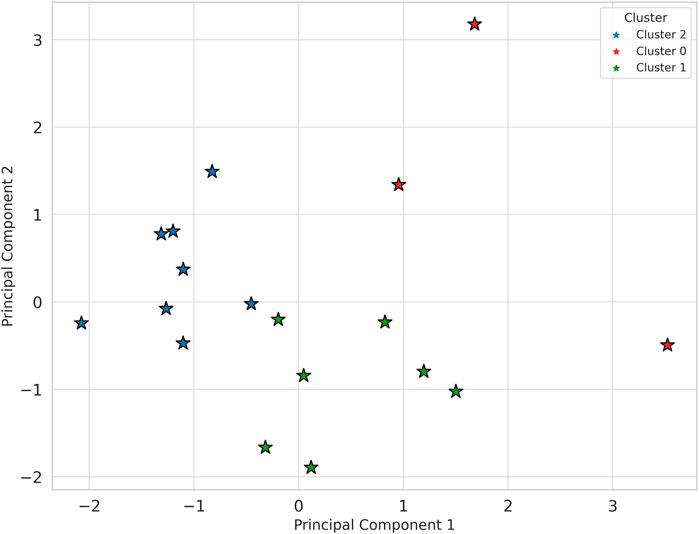
Figure 3. Cluster visualization of countries by resilience and structural variables.
This clustering offers more than a statistical grouping—it reflects meaningful patterns in economic structure and adaptive capacity. Countries on the left side of the plot tend to have low industrial diversification and high dependence on agriculture, correlating with lower resilience scores. Those on the right typically combine higher GDP per capita with more balanced economic sectors, aligning with stronger resilience. These patterns emerge directly from the data, not assumptions, and offer a grounded way to compare countries based on both exposure and capacity.
This is especially important in contexts where high-resolution, time-series adaptation data are missing. Instead of analyzing resilience in isolation, this approach embeds it within broader economic context—helping avoid misinterpretation in structurally diverse regions. The method strengthens the study by offering a way to generalize resilience patterns across similar economies, even when detailed local data is unavailable.
For policymakers, this visualization supports strategic alignment and peer benchmarking. A country lacking full resilience data but falling into a well-defined cluster can still be assessed with reasonable confidence. More importantly, countries within the same cluster may share policy challenges and solutions. This opens the door for targeted peer learning, especially on institutional reforms, adaptation financing, or infrastructure planning.
In short, this clustering bridges the gap between abstract resilience scores and the economic realities that shape them. It enhances both the interpretability and practical utility of our approach—offering a scalable, structure-aware diagnostic tool for resilience analysis in data-scarce settings.
Figure 4 presents a heatmap of sector-specific climate resilience scores across five countries. It highlights how resilience varies not just across countries, but also across sectors—agriculture, industry, and services—within the same economy. This visual reinforces a central argument of this study: that economic structure directly shapes resilience outcomes. The pattern is clear. Countries with higher resilience in services tend to show stronger overall resilience. In contrast, those with weak agricultural resilience often exhibit broader vulnerability. For example, a country with low resilience in both agriculture and industry reflects the risks of structural dependence on primary sectors without adequate adaptive systems. This insight is especially relevant for economies where agriculture remains dominant but under-supported.
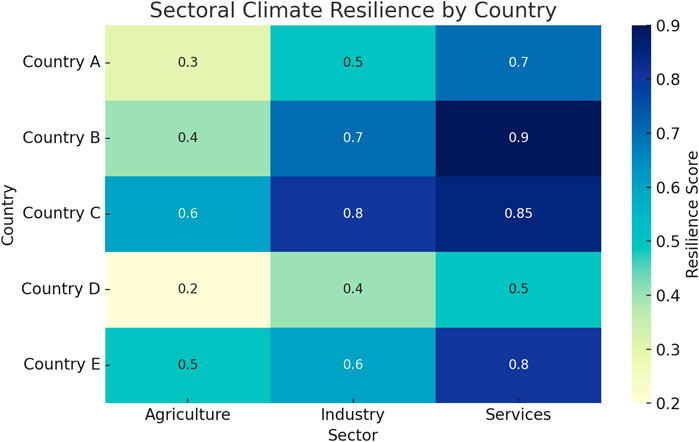
Figure 4. Sectoral climate resilience by country.
The value of this heatmap goes beyond simple comparison. It serves as a diagnostic tool for both cross-country benchmarking and within-country targeting. Policymakers can use it to identify which sectors are lagging and whether resilience is evenly distributed. A country may show strong performance in one sector—such as services—while masking critical weaknesses in another. Without disaggregated visualizations like this, such imbalances are easily overlooked, especially when data are limited. More importantly, the heatmap supports targeted, sector-specific adaptation strategies. Many adaptation plans still treat climate resilience as a uniform challenge across sectors. This visualization shows why that approach fails. For instance, a country with strong service resilience but moderate agricultural performance may need to prioritize support for rural infrastructure, water access, or agricultural extension systems. Conversely, a country with consistently high scores across all sectors offers a potential structural model for economies still in transition.
This tool also has clear relevance for data-scarce contexts. Even when a country lacks full resilience estimates, patterns from structurally similar peers can serve as proxies for strategy. If one country shares sectoral characteristics with another but lacks local data, it can still make informed decisions based on available peer profiles. In sum, the sectoral heatmap advances our broader objective of localized, structure-aware resilience analysis. It improves the empirical foundation for sector-specific planning, provides a practical guide for prioritizing adaptation investments, and supports policy alignment across structurally similar economies. It demonstrates clearly that climate resilience cannot be understood or improved without first understanding the economic composition of the system being assessed.
This scatter plot shown in Figure 5 illustrates the relationship between annual precipitation and agricultural yield, revealing a broadly positive association between the two variables. As precipitation increases, agricultural productivity—measured in tons per hectare (t/ha)—tends to rise. While the strength of the correlation may vary across contexts, the visual trend line consistently affirms a key assumption underlying our empirical framework: that climatic inputs, particularly rainfall, play a direct and often dominant role in determining agricultural outcomes. Primarily, it supports the climate sensitivity assertion. The resilience of agricultural systems in many regions—especially in data-scarce, rainfed economies—hinges on climatic stability. By visually confirming that yields respond positively to rainfall, this figure validates the core mechanism of our panel yield model. It demonstrates that climate-linked variability in rainfall is not an abstract or theoretical risk, but a real and observable driver of yield outcomes. This strengthens the claim that any resilience framework must explicitly account for climatic sensitivity, particularly in agricultural systems that lack buffering infrastructure.
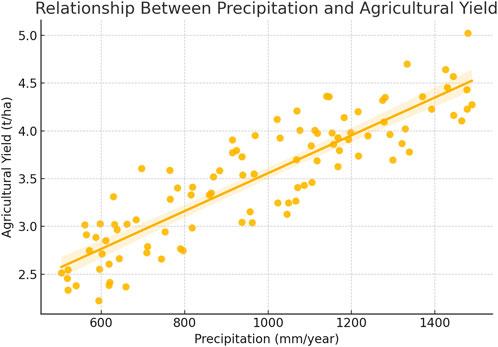
Figure 5. Kriging-based interpolation of agricultural productivity.
Figure 5 also provides a communicable, intuitive visualization of an otherwise technical econometric relationship. In policy or field contexts where technical regression tables may not be interpretable, this plot offers a more accessible depiction of yield vulnerability. It allows stakeholders, from planners to farmers, to see that yield shocks are not random but climate-explained, reinforcing the need for climate-informed agricultural planning. This makes the case for targeted investments in adaptation tools, such as irrigation systems, soil moisture conservation, or early-warning weather systems.
Technically, it also justifies the spatial and structural disaggregation embedded in our resilience mapping framework. The magnitude and form of this relationship will differ by location, crop, and economic structure, and the observed trend here underscores the rationale for localized intervention design. Where rainfall is erratic or declining, the consequences for yield—and thus for food security and rural livelihoods—can be severe. Visualizations like this one help prioritize high-risk zones for support, especially when formal data systems are incomplete or out of date.
In effect, this figure anchors the climate-agriculture nexus in observed reality, offering an empirical foothold for our broader resilience arguments. It helps translate econometric findings into strategic insights and strengthens the justification for integrating climate variables into agricultural policy, especially in fragile, rainfed settings.
Ultimately, this plot complements and reinforces the multi-layered logic of the paper: that understanding and improving climate resilience requires localized, sector-specific insights grounded in data—even where such data is sparse. By showing the observable dependency of yield on rainfall, the figure lends strong support to our call for structural resilience strategies that recognize climatic exposure as a first-order development constraint.
4.5 Resilience-Asymmetry Surface (RAS)
Figure 6 introduces the Resilience-Asymmetry Surface (RAS), a diagnostic tool developed to uncover hidden vulnerabilities and strengths in resilience outcomes. This surface maps resilience as a function of both climate conditions and economic capacity, offering a three-dimensional view of how these elements interact. The height of the surface represents predicted resilience, while the color shows GDP per capita. This visualization reveals several key insights. First, countries with moderate temperatures and rainfall—but higher income—tend to sit at the peak of the surface, demonstrating strong adaptive capacity. Conversely, countries with similar climates but lower income lie at the bottom, showing weak resilience. This divergence points to a resilience asymmetry: even with similar environmental exposure, outcomes vary sharply based on structural economic conditions. These asymmetries are often hidden in traditional models, which average out responses across space and sectors. The RAS can help policymakers prioritize where structural improvements—such as improved governance, access to finance, or support for innovation—can yield large resilience gains. It also identifies outliers: countries performing worse (or better) than expected, given their climate and income levels. This offers valuable input for peer learning and cross-country collaboration. In settings with limited data, the RAS serves as a high-level but intuitive tool that helps narrow down where more detailed studies or interventions should focus. It also underscores a broader message of this paper: that climate resilience cannot be explained by climate exposure alone. Institutional, structural, and economic conditions play a central role—and must be considered in any serious policy response.
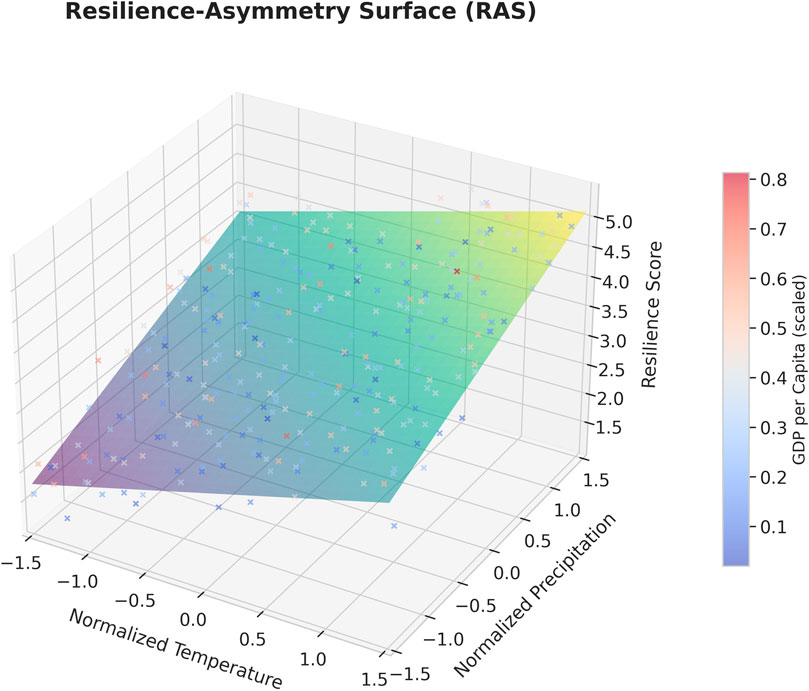
Figure 6. Resilience asymmetry surface.
5 Analysis & discussion
The full set of validation results presented in this study, spanning econometric estimations, cluster diagnostics, spatial interpolation accuracy, and structural mapping tools—collectively strengthen the credibility, applicability, and novelty of our climate resilience framework. These results do not stand in isolation; taken together, they provide empirical grounding for the core claim of this paper, that is, climate resilience in low-income countries is best understood through a combined cross-country and localized lens, especially when working with limited data.
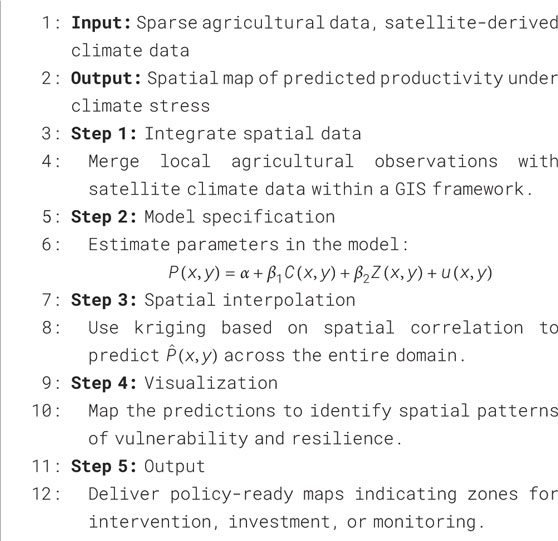
Algorithm 1.Localized Climate-Agriculture Mapping.
The panel estimations and clustering exercises confirm that climate impacts are not evenly distributed across sectors or economies. More importantly, they show that meaningful structure exists in resilience patterns even across sparse, heterogeneous datasets. This justifies our use of harmonized panel methods for comparative insights, and validates the claim that resilience differences can be systematically identified—even in contexts where data gaps are substantial.
Spatial validation, especially through the kriging interpolation maps and associated diagnostics, demonstrates that actionable information can be extracted from incomplete field data. The models consistently recover localized yield patterns that align with environmental gradients and known structural constraints, suggesting not only internal validity but external relevance. The consistency across three distinct country cases further reinforces the robustness and portability of the approach. These validation results thus support a central premise of the study: that localized resilience analysis is both feasible and necessary, and can be built using open-source tools and sparse inputs.
The diagnostic surfaces—particularly the Resilience Asymmetry Surface—offer an added layer of interpretability that links statistical estimation with strategic planning. Its empirical grounding through validated model outputs lends confidence to its role as a policy-relevant heuristic, rather than a conceptual abstraction.
Therefore, our results have demonstrated that our methods are not just technically sound, but context-sensitive and operationally useful. They demonstrate that in data-scarce environments, rigorous modeling combined with targeted spatial methods can yield insights that are both statistically defensible and decision-ready.
6 Policy implications
The findings from this study offer several practical insights for policymakers seeking to improve climate resilience in data-constrained settings. Some of these include;
1. The use of structural data to inform sector-specific adaptation. The cross-country analysis shows that resilience varies significantly by sector, and that structural factors—such as labor distribution, industrial base, and access to services—are strong predictors of resilience outcomes. Countries with limited agricultural performance but strong service or industrial sectors tend to be more resilient. This suggests that national adaptation strategies should go beyond agriculture and support structural transformation as a long-term resilience measure (Badiane and Makombe, 2014; Diao et al., 2018).
2. Targetting subnational hotspots with localized interventions. The spatial productivity maps produced through kriging reveal where vulnerabilities are concentrated within countries. These maps can help governments prioritize investments in irrigation, extension services, or climate-smart infrastructure in low-performing regions, even when field data is limited. This is especially important for targeting resources efficiently, rather than applying uniform strategies across diverse regions (Bussi et al., 2021; Costella et al., 2023).
3. Combining economic data with climate models for smarter adaptation planning. The Resilience-Asymmetry Surface (RAS) shows that resilience is not simply a matter of climate severity. Some countries or regions face moderate climate conditions but remain highly vulnerable due to weak economic foundations. Others perform well under stress due to economic or institutional strengths. This insight reinforces the importance of integrating socioeconomic diagnostics into national climate planning processes.
4. Focusing on resilience gaps, not just climate risk. RAS also identifies areas where resilience is unexpectedly low given the climate profile. These “resilience gaps” are often overlooked in conventional risk assessments that focus only on weather extremes. Policymakers should consider these gaps as missed opportunities—regions where relatively modest investment in capacity-building or infrastructure could lead to large gains in resilience.
5. Building with what is available. One of the central advantages of this approach is that it works with limited data. The methods used—panel econometrics, kriging, and satellite integration—are accessible, transparent, and replicable. LICs do not need to wait for perfect datasets or global models to begin planning. With basic field observations, publicly available climate data, and open-source tools, much can already be done.
These insights support a shift in how resilience is understood and planned for. Rather than framing resilience only in terms of risk reduction, this study encourages policymakers to also think in terms of opportunity—where better use of existing data and targeted action can produce large and lasting impacts.
7 Conclusion
This study presents a dual-level framework for analyzing climate resilience in low-income countries: a cross-country econometric model for sectoral resilience, and a localized mapping method for agricultural productivity using spatial interpolation. Together, these approaches provide a scalable, data-efficient way to identify both national-level patterns and subnational hotspots of vulnerability.
Our findings confirm that structural economic factors matter as much as climate exposure in shaping resilience. Countries with strong service and industrial sectors tend to be more resilient, while agriculture continues to underperform without targeted investment and adaptive support. The kriging-based approach allows high-resolution estimation of productivity even in data-poor regions, guiding spatially targeted adaptation strategies. Meanwhile, the Resilience Asymmetry Surface offers a diagnostic for understanding resilience gaps not visible in traditional risk assessments.
Overall, the tools and findings from this study support more grounded, equitable planning for climate adaptation. The framework is designed to work with the data that countries already have and can be extended as more information becomes available. It offers practical ways to support decision-making in environments where climate risk is urgent, but data are sparse.
Data availability statement
The datasets analysed in this study are available upon request, from the corresponding author.
Author contributions
RK: Conceptualization, Data curation, Formal Analysis, Investigation, Methodology, Software, Validation, Visualization, Writing – original draft, Writing – review and editing.
Funding
The author(s) declare that financial support was received for the research and/or publication of this article. This work has been supported by the Mathematics for Sustainable Development (MATH4SDG) project, a research and development project running in the period 2021-2026 at Makerere University-Uganda, University of Dar es Salaam-Tanzania, and the University of Bergen-Norway, funded through the NORHED II programme under the Norwegian Agency for Development Cooperation (NORAD), project no. 68105.
Acknowledgments
The author acknowledges and appreciates the direction and guidance from the supervisors. The author also acknowledged and appreciates the reviews form the department members.
Conflict of interest
The author declares that the research was conducted in the absence of any commercial or financial relationships that could be construed as a potential conflict of interest.
Publisher’s note
All claims expressed in this article are solely those of the authors and do not necessarily represent those of their affiliated organizations, or those of the publisher, the editors and the reviewers. Any product that may be evaluated in this article, or claim that may be made by its manufacturer, is not guaranteed or endorsed by the publisher.
References
Badiane, O., and Makombe, T. (2014). The theory and practice of agriculture, growth, and development in africa. Helsinki: The United Nations University World Institute for Development Economics Research UNU-WIDER.
Bussi, G., Whitehead, P. G., Jin, L., Taye, M. T., Dyer, E., Hirpa, F. A., et al. (2021). Impacts of climate change and population growth on river nutrient loads in a data scarce region: the upper awash river (Ethiopia). Sustainability 13, 1254. doi:10.3390/su13031254
Clingingsmith, D. L., and Williamson, J. G. (2005). Mughal decline, climate change, and britain’s industrial ascent: an integrated perspective on India’s 18th and 19th century deindustrialization. National Bureau of Economic Research. Available online at: https://ssrn.com/abstract=842465.
Costella, C., van Aalst, M., Georgiadou, Y., Slater, R., Reilly, R., McCord, A., et al. (2023). Can social protection tackle emerging risks from climate change, and how? a framework and a critical review. Clim. Risk Manag. 40, 100501. doi:10.1016/j.crm.2023.100501
Dell, M., Jones, B. F., and Olken, B. A. (2014). What do we learn from the weather? the new climate-economy literature. J. Econ. Literature 52, 740–798. doi:10.1257/jel.52.3.740
Diao, X., Kweka, J., and McMillan, M. (2018). Small firms, structural change and labor productivity growth in africa: evidence from Tanzania. World Dev. 105, 400–415. doi:10.1016/j.worlddev.2017.12.016
Habib-Ur-Rahman, M., Ahmad, A., Raza, A., Hasnain, M. U., Alharby, H. F., Alzahrani, Y. M., et al. (2022). Impact of climate change on agricultural production; issues, challenges, and opportunities in asia. Front. Plant Sci. 13, 925548. doi:10.3389/fpls.2022.925548
Leahy, S. M., and Robins, J. B. (2021). River flows affect the growth of a tropical finfish in the wet-dry rivers of northern Australia, with implications for water resource development. Hydrobiologia 848, 4311–4333. doi:10.1007/s10750-021-04641-7
Lemi, T., and Hailu, F. (2019). Effects of climate change variability on agricultural productivity. Int. J. Environ. Sci. and Nat. Resour. 17, 14–20. doi:10.19080/IJESNR.2019.17.5
Mazungunye, P. P., and Punt, C. (2022). Industrialisation for structural transformation: economy-wide impacts of agro-processing development in Tanzania. Dev. South. Afr. 39, 400–423. doi:10.1080/0376835x.2021.1947191
Portier, A., Kirschbaum, D., Gebremichael, M., Kemp, E., Kumar, S., Llabres, I., et al. (2023). Nasa’s global precipitation measurement mission: leveraging stakeholder engagement and applications activities to inform decision-making. Remote Sens. Appl. Soc. Environ. 29, 100853. doi:10.1016/j.rsase.2022.100853
Raza, A., Razzaq, A., Mehmood, S. S., Zou, X., Zhang, X., Lv, Y., et al. (2019). Impact of climate change on crops adaptation and strategies to tackle its outcome: a review. Plants 8, 34. doi:10.3390/plants8020034
Keywords: climate resilience, cross-country analysis, agriculture, spatial interpolation, low-income countries
Citation: Katende R (2025) Cross-country comparative analysis of climate resilience and localized mapping in data-sparse regions. Front. Environ. Sci. 13:1495950. doi: 10.3389/fenvs.2025.1495950
Received: 13 September 2024; Accepted: 01 May 2025;
Published: 29 May 2025.
Edited by:
Lynn Donelson Wright, College of William & Mary, United StatesReviewed by:
Faisal Mueen Qamer, International Centre for Integrated Mountain Development, NepalRobin Brumfield, The State University of New Jersey, United States
Copyright © 2025 Katende. This is an open-access article distributed under the terms of the Creative Commons Attribution License (CC BY). The use, distribution or reproduction in other forums is permitted, provided the original author(s) and the copyright owner(s) are credited and that the original publication in this journal is cited, in accordance with accepted academic practice. No use, distribution or reproduction is permitted which does not comply with these terms.
*Correspondence: Ronald Katende, cmthdGVuZGU5MkBnbWFpbC5jb20=