 Mateus Henrique dos Santos Diniz
 Fernando César Ferreira
 Adão de Siqueira Ferreira
- Institute of Agrarian Sciences, Federal University of Uberlândia, Uberlândia, Brazil
Introduction: Soil biochemical transformation of urea has important impacts on nitrogen (N) use efficiency in agricultural systems and environmental pollution, mainly due to N losses through ammonia volatilization (AV).
Methods: The present study aimed to evaluate and model the biochemical transformation of urea and ammonia volatilization in response to different urea doses and temperature conditions over time in sandy loam (SL) and sandy clay loam (SCL) soils in the Brazilian Cerrado. Soil mesocosm experiments were conducted with the addition of 0.25% and 0.50% urea mixed into soils (100 g dry soil) and incubated at 20°C, 25°C, 30°C, and 35°C for six days.
Results: Urease activity increased rapidly on the first day of incubation, with the highest values occurring at the 0.50% urea dose and 25°C. However, there were no significant differences in activity between soils. Soil pH ranged from 8.2 to 8.6 and was not affected by soil type, temperature, or applied doses. Soil ammonium concentration was higher at the 0.50% urea dose and in SCL soil, and it was not affected by temperature conditions. AV increased with the rise in urea dose and temperature, with SL showing higher AV values than SCL. SL also demonstrated greater temperature sensitivity than SCL.
Discussion: The regression equation models used were efficient in demonstrating the parameters of biochemical transformations and AV in both soils. The N losses through AV may be greater than 60% in sandy soils and less than 30% in clay soils.
1 Introduction
Nitrogen (N) is a limiting nutrient for the growth and development of crops in the Brazilian agricultural system, usually requiring an application of 100–250 kg of N per hectare annually. Urea is a major source of N used in agricultural systems due to its high N content (>45% N). However, this N source can have low N use efficiency (NUE) for crops due to significant N losses, especially in tropical soils. Ammonia volatilization (AV) is a primary cause of low NUE, occurring soon after the application of urea to soil, with losses through this mechanism potentially exceeding 40% in agricultural systems (Pan et al., 2016; Coelho et al., 2022). AV is also a major environmental concern, causing an increase in ammonia (NH3) in the atmosphere and N deposition in natural ecosystems (Duff et al., 2022; Cassim et al., 2024; Kohira et al., 2024).
The biochemical reactions of AV occur quickly in the soil due to the hydrolytic reaction of urease on the urea substrate (Cordero et al., 2019). When urea is applied in granular form to the soil, it first dissolves and diffuses, forming a concentrated zone of urea molecules known as a soil-urea microsite (Coelho et al., 2022; Dawar et al., 2024). The hydrolysis of urea in this microsite results in the release of NH3 (Equation 1). However, urea hydrolysis depends on several abiotic factors, such as temperature, moisture, urease pool, and soil type (Nikolajsen et al., 2020; Coelho et al., 2022; Dawar et al., 2024). Chemically, NH3 reacts with water to produce ammonium (NH4+) and hydroxyl (OH−), which alkalizes the soil-urea microsite (Equation 2). High concentrations of NH4+ and OH− result in a strong chemical reaction that leads to more NH3 emissions to the atmosphere (Equation 3). The amount of NH4+ in the soil solution is initially the principal source of N for crops and can be converted to nitrite (NO2−) and nitrate (NO3−) by nitrifying microorganisms (Pertile et al., 2021; Duff et al., 2022).
Studies have shown that biochemical transformations are related to the abundance of urease-producing bacteria in the soil-urea microsite (Ciurli et al., 1996; Pertile et al., 2021; Coelho et al., 2022). Coelho et al. (2022) reported a high abundance of the genus Sporosarcina, suggesting that these organisms might play an important ecological role in the soil-urea environmental niche. The abundance of Sporosarcina also coincided with a significant increase in urease activity, which is associated with enzyme synthesis (Coelho et al., 2022). In addition to the urease pool, soil clay content can play an important role in the dynamics of AV and NH4+ concentrations. Furthermore, studies on the biochemical changes of urea and AV in tropical soil may help us better understand the NUE in agricultural ecosystems, including the environmental factors that regulate these biochemical processes.
The temperature response of soil biochemical processes is a critical regulating factor that has received significant attention in recent years due to global warming. Temperature increases can exponentially alter urease activity in the soil, and this response depends on the soil type (Moyo et al., 1989). Additionally, temperature can affect soil NH4+ concentration and AV in tropical soils, depending on the amount of urea applied (Schwenke et al., 2014a; Coelho et al., 2022) and soil textural classes (Soares and Cantarella, 2023). AV has been reported to be higher in sandy soils than in clayey soils in tropical regions (Soares and Cantarella, 2023).
In soil biochemical processes, temperature sensitivity (Q10) is often used as an index to predict responses to global warming (Yang et al., 2022). The commonly accepted Q10 value of 2.0 indicates that a 10°C increase in temperature doubles the chemical activity. However, Q10 values in soil biochemical processes, like soil respiration, range from 1 to 12 and vary depending on soil type and environmental conditions (Yang et al., 2022). Soil clay content is a physicochemical factor that regulates soil biochemical transformations and can significantly interfere with Q10 values in tropical soils (Vinhal-Freitas et al., 2017; Pan et al., 2021). Furthermore, soil moisture, organic matter, and nutrient application rate can change soil chemical reactions, directly impacting Q10 values (Liu et al., 2024). However, Q10 values for AV on urea addition have not been studied, nor have the regulatory factors influencing Q10 variation.
Modeling the soil biochemical process of urea transformation is of paramount importance for understanding the patterns of N losses in soil. Our hypothesis is that soil biochemical transformation of urea depends on type of soil, temperature, and dose, resulting in specific parameters on a temporal scale. The current study aimed to evaluate in the Brazilian Cerrado (1) soil biochemical changes of urea under different temperatures and doses in two soil textural classes; (2) modeling soil response to urea addition as a function of incubation period; and (3) temperature sensitivity changes of AV under urea doses in two soil textural classes.
2 Materials and methods
2.1 Site and soil sampling
The study was conducted in two agricultural areas located in the region of Uberaba City (Minas Gerais State), in southeastern Brazil. The two soils were classified as Oxisols (USDA, 1992) and identified as sand clay loam (SCL) and sandy loam (SL) according to the Soil Texture Triangle (USDA). Soil samples from each area were collected at 14 sites at a depth of 0–10 cm using a soil auger. The soil samples were then mixed and sieved (2 mm) for the experimental design. A portion of each soil sample was sent to the Federal University of Uberlândia’s Laboratory of Soil Physic-Chemical Analysis for evaluation of the physical and chemical properties of the soils (Table 1).
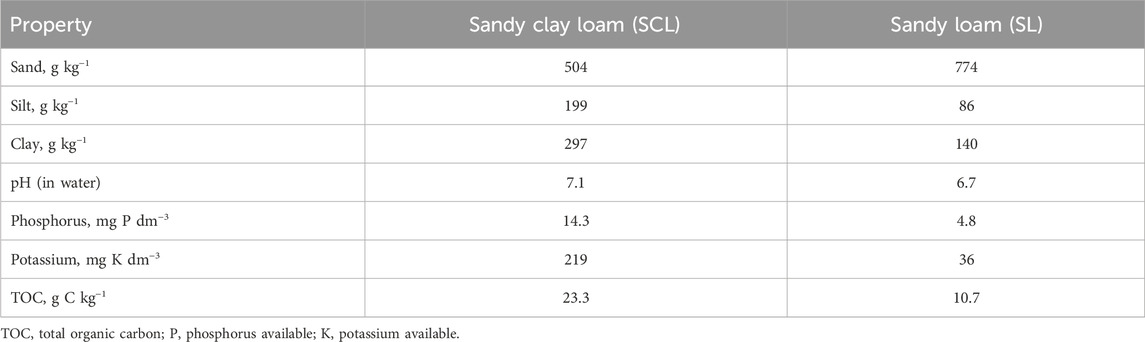
Table 1. Physical and Chemical properties of two Oxisols.
2.2 Mesocosm essay and experimental design
Mesocosm assays were conducted using 100 g of air-dried soil in hermetically sealed glass jars with a capacity of 0.600 dm3, totaling 432 flasks for destructive sampling (2 soils x 3 treatments x 4 temperatures x 6 days x 3 replicas). The following treatments with urea were implemented in the experiment: 1-control (without urea); 2%–0.25% urea (2.5 mg urea g−1 soil) and 3%–0.5% urea (5.0 mg urea g−1 soil). The urea was gently crushed in a porcelain flask to facilitate distribution and homogenization in the mesocosms. The urea was then weighed, transferred, and incorporated into the soil. After, soil moisture content was adjusted to 60% of the water holding capacity of the soils. The mesocosm assays were incubated at four different temperatures (20°C, 25°C, 30°C, and 35°C) simultaneously, using four biological chambers with temperature control (∼0.1°C). Urease activity, pH, and NH4+ were measured daily during the six-day incubation period. AV was measured daily for 10 days.
2.3 Urease activity
Urease activity was measured by the NH4+ produced in an incubation assay containing urea substrate (Kandeler and Gerber, 1988). Falcon tubes (50 mL) containing 1 g soil, 4 mL of citrate buffer (pH 6.7, containing 1.8 g of citric acid and 100 g citrate sodium per L) and 1 mL of urea solution (1.67 mol L−1 in citrate buffer). Then, the tubes were quickly shaken using a vortex and incubated for 2 h at 37°C. After this period of incubation, the reaction mixture was again shaken and dilated with distilled water to adjust the volume to 50 mL. After 15 min of time -out, 2 mL of extract was centrifuged at 8,000 x g for 5 min. The NH4+ concentration in the extract was measured according to Mulvaney et al. (1996), using a standard curve of NH4Cl and a spectrophotometer (Biomate 3, Thermo Fisher Scientific) at 670 nm. A sample control without urea was used to subtract the residual NH4+ in all treatments of mesocosm assays.
2.4 Soil pH and NH4+ analysis
Soil pH samples previously air-dried after each period of incubation were determined in water (1:2, soil:water) and readed a digital pHmetro. The NH4+ concentration in the samples was performed in 5 g fresh soil and extracted with 50 mL of potassium chlorate solution (KCl, 1 mol L−1) at 200 rpm for 30 min. The extracted solution was rested for 1 h and then centrifuged at 5,000 x g for 5 min. The NH4+concentration was determined as described above (Mulvaney et al., 1996), using a standard curve with NH4Cl eluted in KCl (1 M).
2.5 Ammonia volatilization (AV)
AV was measured for 10 days of incubation under some temperature conditions and for two soil types. The NH3 released in the glass jars was captured in a plastic cup (50 mL) containing 10 mL of boric acid (H3BO3, 0.32 M) and red methyl and blue bromocresol indicators (Bimuller et al., 2014). The plastic cups were removed daily and titrated with sulfuric acid (0.025 M) and a new cup was added again. AV was estimated using the following formula: calculated as described:
where AV is the NH3 volatilization (μgNH3 g−1 soil); S is the titration value (mL) of the sample; C is the titration value of the control (jar without soil); and M is the molar concentration of sulfuric acid (0.025 M). Number 17 is the molecular mass of NH3; Number two is the stoichiometric reaction between NH3 and H3BO3; and DSM is the dry soil mass used in the assays.
2.6 Statistical analysis
The data collected from the experimental assays were subjected to statistical analysis using R and Sigmaplot software. The data were initially subjected to Shapiro Wilk’s normality test. The data were then subjected to regression analysis to explain the variation in the biochemical transformations of urea in response to temperature. The parameters of the regression analysis of the chosen equations were statistically validated at the significance level (p < 0.05). The Q10 values of AV were determined for each repetition using the van’t Hoff equation (Equation 4) for determining the temperature response coefficient and the exponential equation (Equation 5).
where Y is the rate of AV (μg NH3 g-1 soil day-1); T is soil temperature of incubation conditions; and a and b are the exponential fitted parameters. The Q10 values were subjected to analysis of variance, and the means were compared using the LSD test at 5% probability.
3 Results
3.1 Effect of dose, temperature, and soil on urease activity
Urease activity values ranged from 0.1 to 200 μmol NH4+ g−1 h−1, with the highest values observed at a 0.50 dose. Urease activity was modeled using a regression equation defined as an exponential rise to maximum (Figure 1), determining maximum values of urease activity as a function of incubation period for dose and temperature variables within the soils. The results showed that greater urease activity was observed at the 0.50% dose compared to the 0.25% dose and occurred on the first day of incubation, except at 20°C of incubation (day 2). All variables showed significant values for maximum urease activity, highlighting the model’s importance for predicting urease production (Table 2). Our results also indicated that the highest urease activity occurred at 25°C in two soils and doses under incubation conditions, except for SCL with the 0.50% dose (where values were similar for three higher temperatures). At 25°C, there was no significant difference between the two soils, while at other temperatures, a slight difference was observed between SCL and SL.
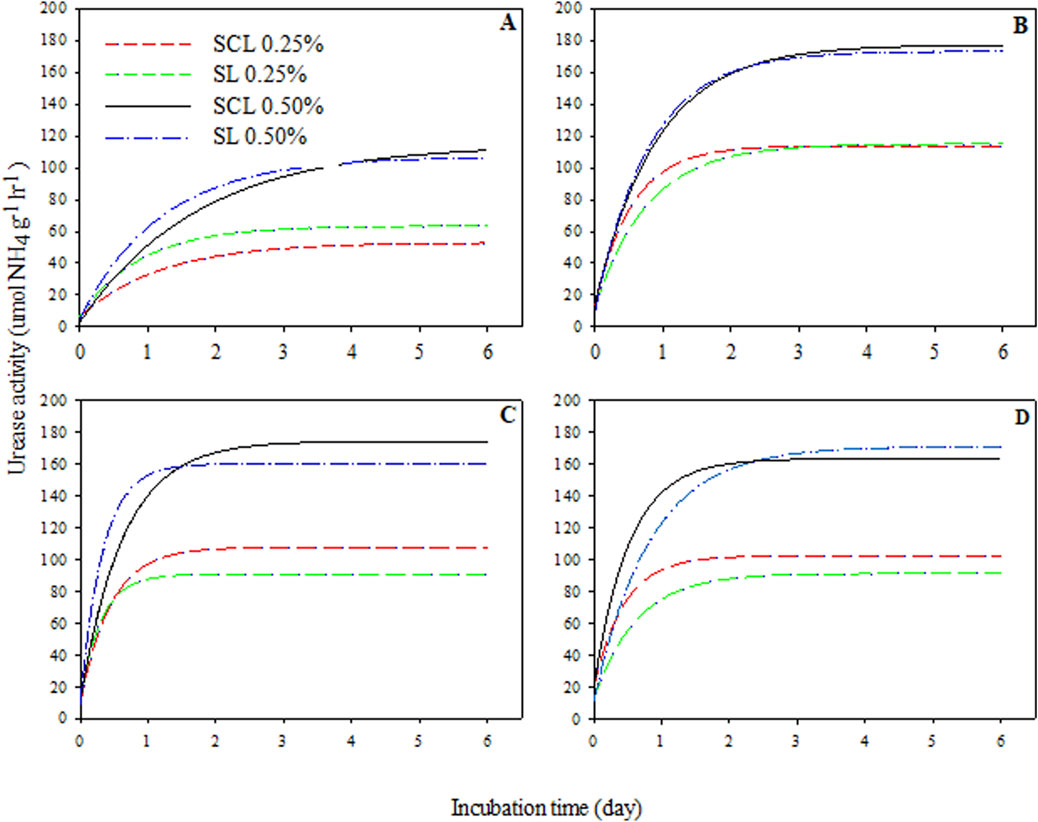
Figure 1. Regression analysis of urease activity in function of incubation period for variables doses, temperatures within the sandy clay loam (SCL) and sandy loam (SL). Temperature of 20°C (A), 25°C (B), 30°C (C) and 35°C (D). All regression analyses had a probability significant for model applied (p < 0.0001).
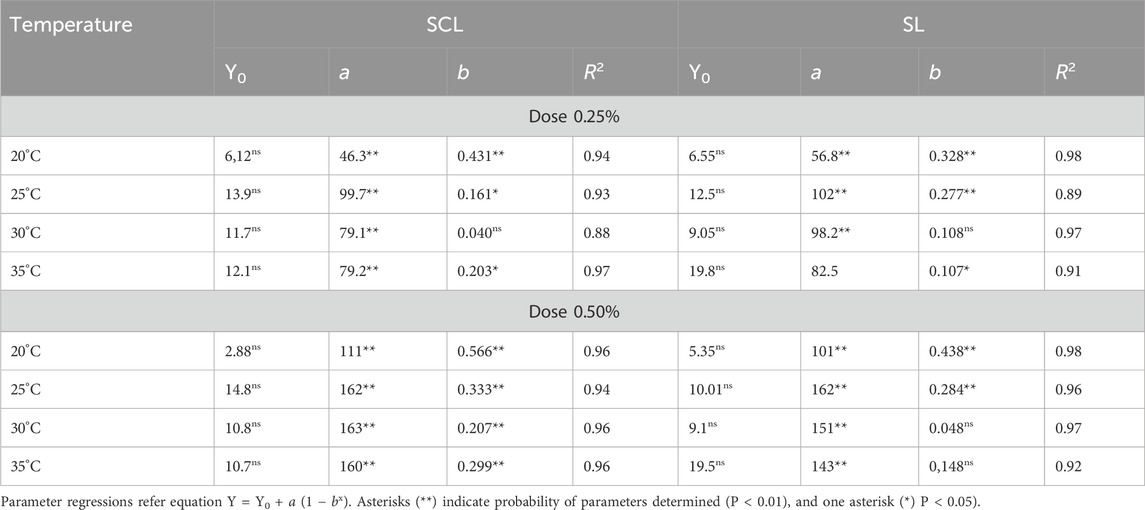
Table 2. Parameter regressions of urease activity in function of incubation period for dose and temperature variables with sandy clay loam (SCL) and sandy loam (SL).
3.2 Changes in soil pH
The addition of urea quickly changed the soil pH quickly, reaching values of 8.0 on the first day (Figure 2). The results indicated that soil pH was independent of the urea dose, as pH values did not vary with the applied dose. Although initial soil pH values differed between both soils in the control treatment, our results showed similar soil pH values between both soils over the incubation period. Temperature did not significantly affect soil pH changes in our experiments with both soils.
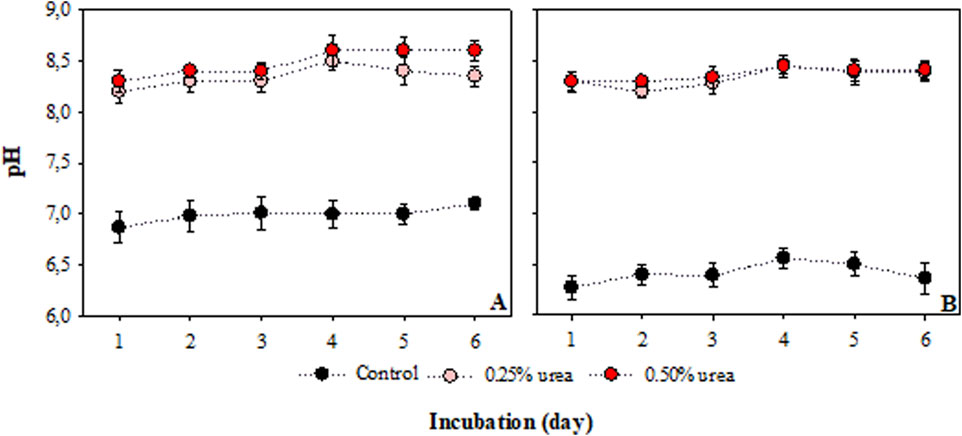
Figure 2. Effect the urea additions and incubation time on soil pH in the sandy clay loam (A) and sandy loam (B). The points represent the average of treatments (n = 3) with confidence interval at 5% significancy.
3.3 Temporal ammonium concentration in soils
The NH4+ concentrations in soils varied with the applied dose and incubation time, but there was no significant effect of temperature on treatments in both soils (Table 3). Difference in NH4+ concentration was only observed on the first day of incubation compared to the other incubation times. There was no significant difference in NH4+ concentration between incubation times after the first day. SCL had significantly higher NH4+ concentrations than SL at both doses.
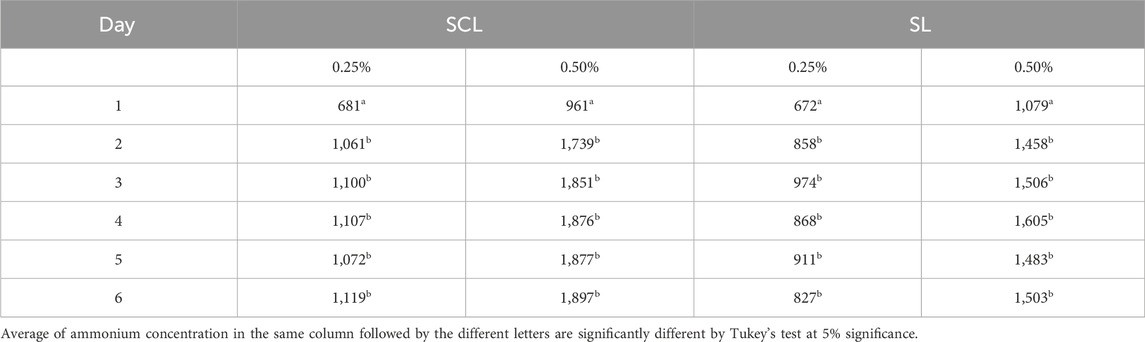
Table 3. Effects of urea doses and incubation time on NH4+ concentration in the sandy clay loam (SCL) and sandy loam (SL).
3.4 Effect of temperature, dose and soils on AV
AV was affected by applied doses, temperatures, and soil textural classes used in the assay. Gaussian’s model was used to explain AV in both soils, and all regression analyses were statistically significant for doses and temperature as function of period incubation (Figure 3). AV values were higher in SL than in SCL, and the 0.50% urea had higher AV than the 0.25% dose in both soils. Our results indicated that temperature had a stronger effect in SL than in SCL. The parameters of Gausian’s equation showed significant differences in AV with temperature changes (Table 3). Temperature had a greater effect on AV in SL than in SCL, showing that the increase in temperature led to an earlier peak AV from 1.13 to 3.75 days and from 1.33 to 5.17 days for doses of 0.50% and 0.25%, respectively (Table 4). Peak AV in SCL ranged from 3.86 to 5.17 days, with the lowest values at the highest temperatures.
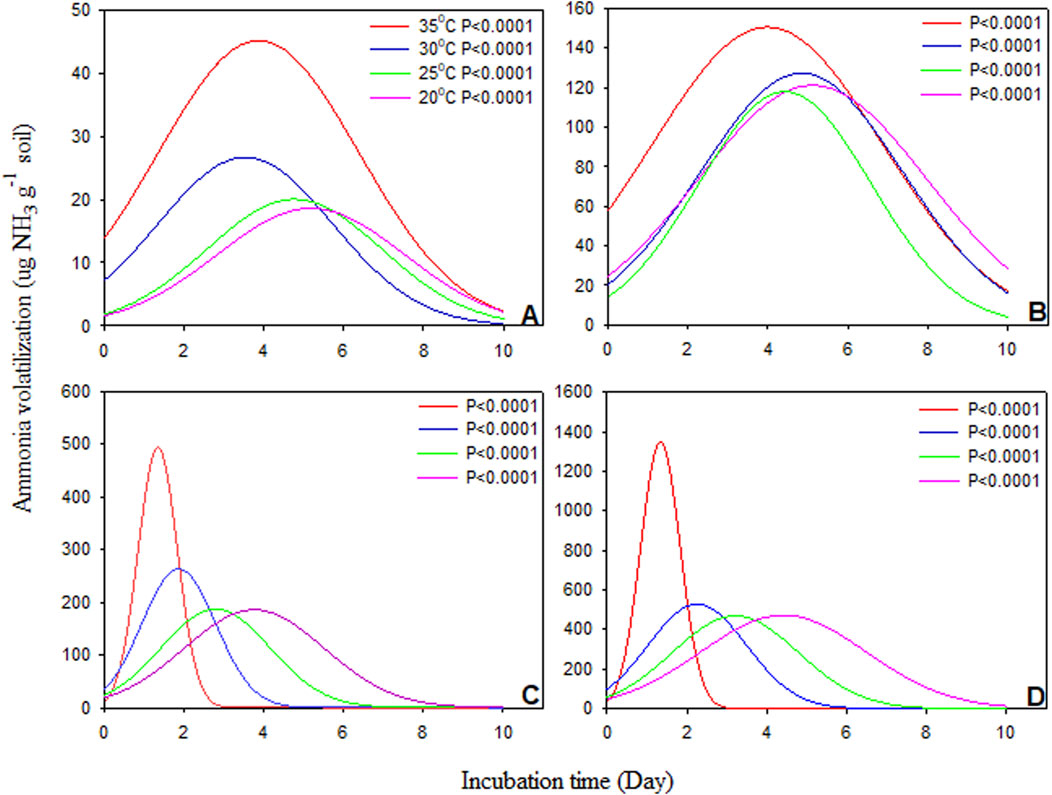
Figure 3. Gaussian’s model of the ammonia volatilization in function of incubation time (Days) for temperature and dose variables in sandy clay loam (A,B) and sandy loam (C,D). (A,C) represent the 0.25 % of urea, and (B,D) represent the 0.50% of urea. Regression analysis of Gaussian’s model was statistically significant as showed in (A–D) (n = 4).
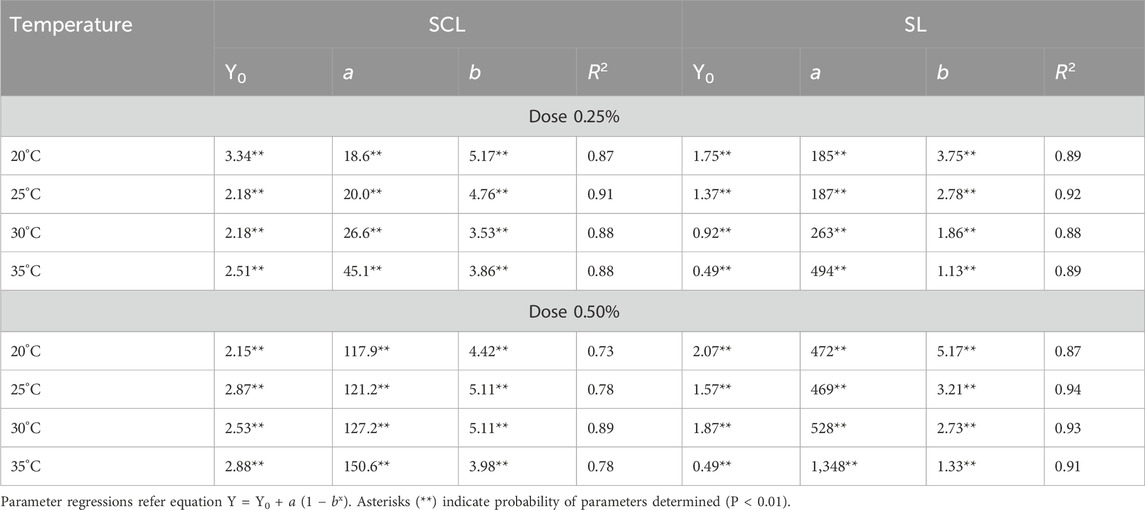
Table 4. Parameters of Gaussian’s equation of ammonia volatilization in function of temperature and urea dose within sandy clay loam (SCL) and sandy loam (SL) in the brazilian Cerrado.
3.5 Model of the van’t hoff equation and temperature sensitivity (Q10) of AV
AV values were used to model the response of both soils to temperatures and urea doses using the van’t Hoff equation. Our results demonstrated a significant effect of temperature on AV, with the response depending on soil type and dose applied (Figure 4). However, the highest determination coefficient (R2) was only achieved at the peaks of AV on day 1 and day 3 for SL and SCL, respectively. The parameters of the van’t Hoff equation were used to calculate Q10 values of both soils in relation to urea addition. Q10 values ranged from 1.75 to 10.85, with the highest values measured in SL and the higher dose applied (Figure 5). Results indicated significant differences in Q10 between soils and doses used in the experiment, though this difference was not observed between soils for the 0.25% urea dose.
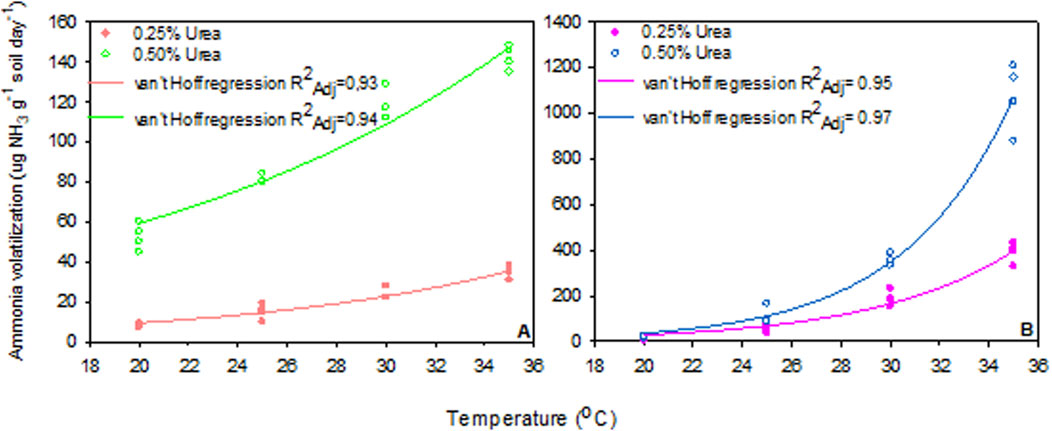
Figure 4. Van’t Hoff regression model of ammonia volatilization with two doses of urea in sandy clay loam (SCL, (A)) and sandy loam (SL, (B)) in relation to incubation temperature. In both soils and with applied doses of urea, the regressions (R2) were significant (P < 0.0001).
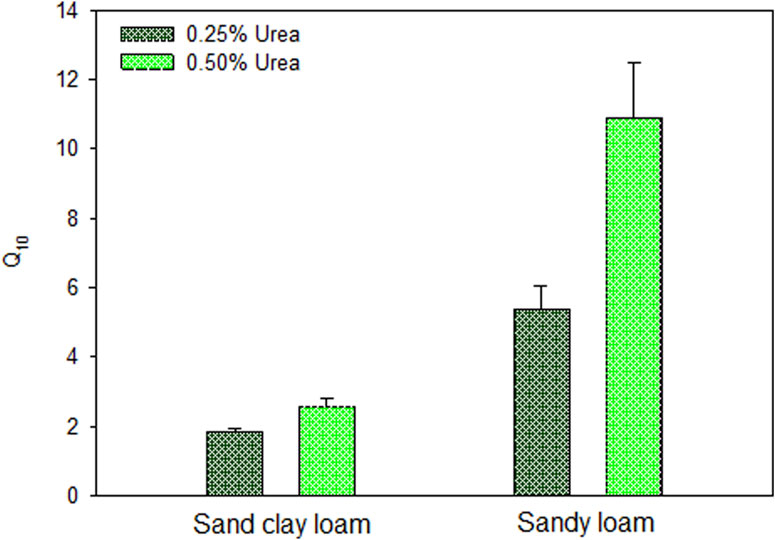
Figure 5. Temperature sensitivity (Q10) of ammonia volatilization in sand clay loam (SCL) and sandy loam (SL) in response to urea addition. The Q10 values represent the mean with the confidence interval (p < 0.05) of the simple for each treatment (n = 4).
4 Discussion
In the present study, we demonstrated the biochemical transformations of urea in response to varying doses and temperature incubations in two Cerrado soils. To our knowledge, the Q10 of AV in Brazilian savanna soils has not yet been reported.
Urease activity increased in response to the addition of urea to the soil, with the highest values observed at 0.50% urea in both soils studied. The increase probably occurred due to the synthesis of more enzymes, since urea can induce a specific microbial population in the urea-soil microsite (Coelho et al., 2022). Our results demonstrated that the two soils used presented similar urease activity at the two doses applied, showing little effect of the soil on urea hydrolysis. In addition, the results also suggest that there was no difference in the urease-producing microbial population. In addition, the results show that urease activity increases significantly on the first day of incubation, demonstrating that the synthesis of urea occurs quickly in the soil. These results are consistent with those found in the literature (Coelho et al., 2022; Soares and Cantarella, 2023). Under soil incubation, a temperature of 25°C presented higher values than of 20°C and a similar response to the other two temperatures during the incubation period. Reports have shown that temperatures 15–40°C increased the urease activity under enzymatic assays (Moyo et al., 1989; Krajewskaet al., 2012), but we did not find any information in the literature on soil incubation temperature to compare our results. Our findings demonstrated that urease activity under soil incubation was dependent on enzyme pool induced by substrate rather than soil type and temperature incubation in urea-soil microsite. In highlights, we emphasized that urease activity was performed at the same temperature conditions (37°C), which reinforces that the difference in activity was in the synthesis of more enzymes.
Soil pH increases in the urea-soil microsite as a result of urea hydrolysis (Singh and Nye, 1984; Dawar et al., 2011; Dawar et al., 2024). Our results showed that soil pH quickly increased on the first day of incubation, fluctuating between values of 8.2 and 8.6 during the incubation period. Alkaline soil pH is a chemical condition that promotes NH3 emission via the deprotonation of NH4+ by OH− in the urea-soil microsite (Dawar et al., 2011; Dawar et al., 2024). Nevertheless, our results showed that soil pH values remained high throughout the incubation period and were independent of soil type, dose applied, and temperature tested. Reports have shown that soil pH is directly related to NH3 volatilization and urease activity (Coelho et al., 2022; Dawar et al., 2024). In the assays with urea, we observed that soil NH4+ concentrations did vary with temperature and soil type. Soil NH4+ concentration was only dependent on urea doses. The results suggest that soil pH can be a major chemical regulator of the kinetic relationship between soil NH4+ concentration and NH3 volatilization in the soils tested, corroborating the results in the literature (Coelho et al., 2022; Dawar et al., 2024).
Our results showed that AV was affected by soil type, dose, and temperature, indicating that the losses of N by the AV were strangely regulated by these factors. Particularly, the SCL had a lower AV value than the SL due to a higher clay content. Ammonium absorption into clay particles can also explain higher NH4+ and lower NH3 volatilization in SCL soil (Soares and Cantarella, 2023). This process may be the main difference between SCL and SL because other biochemical processes showed small variations between these two soils. The results also showed that higher doses and temperatures anticipated the peaks of AV in the soils. There was also a difference between soils regarding the peak of AV during the incubation time. The peak of AV ranged from 3.53 to 5.17 days and from 1.13 to 5.17 days in SCL and SL, respectively. The results showed that soil textural class played an important role in the AV process. These findings corroborate those reported in the literature regarding the peak of AV, but our results demonstrate that clay content is an important factor in regulating N losses by AV. At a temperature of 35°C, N losses by AV estimated in our assays were more than 60% in SL and less than 30% in SCL. Surveys reported that N losses by AV can be more than 40%, but these losses depend on clay content, soil organic matter, and specific edaphic conditions (Singh et al., 2013; Pan et al., 2016). These results align with those observed by Drame et al. (2023), who found that increasing the temperature (35°C) raises soil N losses through AV.
We used the Q10 of AV to explain the sensitivity of N losses through the process of AV in two soils with different clay contents and two urea doses. Our findings showed that AV was sensitive to temperature and the higher values of Q10 were found in SL and with 0.50% of urea applied compared to SCL and with 0.25% of urea. Here, we demonstrated that the clay content of the soil strongly regulated the chemical reactions of soil N losses through AV. An explanation for this is that clay content affects diffusivity of NH3 and leads to stranger retention of NH3, decreasing N losses and response to temperature variation of AV. Reports in the literature on the Q10 of AV corroborate our results, indicating that N losses due to volatilization are highly sensitive to temperature increases (Adegoke and Ku, 2023; Wenzhu et al., 2023). Our study provides a valuable comparative reference for future research, significantly contributing to urea application management and offering a practical application of the Q10 in relation to NUE in tropical soils. In Brazilian Cerrado soils, the low NUE with the use of urea has been a major concern, especially with the strong global warming trends (Rojas et al., 2012; Cassim et al., 2024).
5 Conclusion
This study demonstrated that the biochemical transformation of urea in soil is significantly influenced by soil type, temperature, and urea dose, which have regulatory impacts on ammonia volatilization (AV) in the Brazilian Cerrado. Urease activity and soil NH4+ concentration peaked early during incubation, with the highest activity observed at a 0.50% urea dose and 25°C. Notably, urease activity was not significantly different between sandy loam (SL) and sandy clay loam (SCL) soils, although soil type affected AV. Soil pH remained alkaline and constant, showing no dependence on soil type, temperature, or urea dose. Higher urea doses and temperatures increased AV, with sandy loam soils experiencing greater AV losses and temperature sensitivity compared to sandy clay loam soils. The regression models employed effectively captured the dynamics of urea biochemical transformations and AV, suggesting that AV losses could be substantial in sandy soils, exceeding 60%, while remaining below 30% in clayey soils. These findings highlight the importance of considering soil texture, temperature, and urea dosage when developing strategies to improve N use efficiency and reduce environmental impacts in agricultural systems. The study also highlighted the need for further research involving the interaction between the soil microbial community and N losses in response to temperature in Cerrado soils.
Data availability statement
The datasets presented in this study can be found in online repositories. The names of the repository/repositories and accession number(s) can be found below: http://doi.org/10.14393/ufu.di.2022.160.
Author contributions
Md: Data curation, Investigation, Methodology, Validation, Visualization, Writing – original draft, Writing – review and editing. FF: Data curation, Formal Analysis, Methodology, Writing – review and editing. AF: Conceptualization, Data curation, Formal Analysis, Funding acquisition, Investigation, Methodology, Project administration, Resources, Supervision, Validation, Visualization, Writing – original draft, Writing – review and editing.
Funding
The author(s) declare that financial support was received for the research and/or publication of this article. Federal University of Uberlândia. We thank the Foundation for Research Support of Minas Gerais (FAPEMIG- Fundação de Amparo à Pesquisa do Estado de Minas Gerais, project APQ-3024–17) for financial support of the research project.
Conflict of interest
The authors declare that the research was conducted in the absence of any commercial or financial relationships that could be construed as a potential conflict of interest.
Publisher’s note
All claims expressed in this article are solely those of the authors and do not necessarily represent those of their affiliated organizations, or those of the publisher, the editors and the reviewers. Any product that may be evaluated in this article, or claim that may be made by its manufacturer, is not guaranteed or endorsed by the publisher.
References
Adegoke, T. O., and Ku, H. H. (2023). Temperature response of ammonia emission from sandy loam soil amended with manure compost and urea. Environ. Technol. Innov. 31, 103226. doi:10.1016/j.eti.2023.103226
Bimüller, C., Mueller, C. W., Lützow, M. V., Kreyling, O., Kölbl, A., Haug, S., et al. (2014). Decoupled carbon and nitrogen mineralization in soil particle size fractions of a forest topsoil. Soil Biol. biochem. 78, 263–273. doi:10.1016/j.soilbio.2014.08.005
Cassim, B. M. A. R., Lisboa, I. P., Besen, M. R., Otto, R., Cantarella, H., Inoue, T. I., et al. (2024). Nitrogen: from discovery, plant assimilation, sustainable usage to current enhanced efficiency fertilizers technologies – a review. Rev. Bras. Cienc. Solo 48, e0230037. doi:10.36783/18069657rbcs20230037
Ciurli, S., Marzadori, C., Benini, S., Deiana, S., and Gessa, G. (1996). Urease from the soil bacterium Bacillus pasteurii: immobilization on ca-polygalacturonate. Soil Biol. biochem. 28, 811–817. doi:10.1016/0038-0717(96)00020-x
Coelho, M. A., Mesquita, A. C. O., Fusconi, R., Roesch, L. F. W., and Ferreira, A. S. (2022). Ammonia volatilization and Sporosarcina genus abundance in an Oxisol enriched with urea, compost, and biochar. Appl. Soil Ecol. 146, 104494. doi:10.1016/j.apsoil.2022.104494
Cordero, I., Snell, H., and Bardgett, R. D. (2019). High throughput method for measuring urease activity in soil. Soil Biol. biochem. 134, 72–77. doi:10.1016/j.soilbio.2019.03.014
Dawar, K., Dawar, A., Tariq, M., Mian, I. A., Muhammad, A., Farid, L., et al. (2024). Enhancing nitrogen use efficiency and yield of maize Zea mays L. through ammonia volatilization mitigation and nitrogen management approaches. BMC Plant Biol. 24 (1), 74. doi:10.1186/s12870-024-04749-7
Dawar, K., Zaman, M., Rowarth, J. S., Blennerhassett, J., and Turnbull, M. H. (2011). Urease inhibitor reduces N losses and improves plant bioavailability of urea applied in fine particle and granular forms under field conditions. Agric. Ecosyst. Environ. 144, 41–50. doi:10.1016/j.agee.2011.08.007
Drame, M., Carswell, A., Roberts, W., Hood, J., Jemo, M., Heuer, S., et al. (2023). Effects of hotter, drier conditions on gaseous losses from nitrogen fertilisers. J. Environ. Manag. 345, 118671. doi:10.1016/j.jenvman.2023.118671
Duff, M., Forrestal, P., Ikoyi, I., and Brennan, F. (2022). Assessing the long-term impact of urease and nitrification inhibitor use on microbial community composition, diversity, and function in grassland soil. Soil Biol. biochem. 170, 108709. doi:10.1016/j.soilbio.2022.108709
Kandeler, E., and Gerber, H. (1988). Short-term assay of soil urease activity using colorimetric determination of ammonium. Biol. Fertil. Soils 6, 68–72. doi:10.1007/BF00257924
Kohira, Y., Fentie, D., Lewoyehu, M., Wutisirirattanachai, T., Gezahegn, A., Addisu, S., et al. (2024). Mitigation of ammonia volatilization from organic and inorganic nitrogen sources applied to soil using water hyacinth biochars. Chemosphere 363, 142872. doi:10.1016/j.chemosphere.2024.142872
Krajewska, B., van Eldik, R., and Brindell, M. (2012). Temperature- and pressure-dependent stopped-flow kinetic studies of jack bean urease. Implications for the catalytic mechanism. J. Biol. Inorg. Chem. 17, 1123–1134. doi:10.1007/s00775-012-0926-8
Liu, H., Rezanezhad, F., Zhao, Y., He, H., Cappellen, P. V., and Lennartz, B. (2024). The apparent temperature sensitivity (Q10) of peat soil respiration: a synthesis study. Geoderma 443, 116844. doi:10.1016/j.geoderma.2024.116844
Moyo, C. C., Kissel, D. E., and Cabrera, M. L. (1989). Temperature effects on soil urease activity. Soil Biol. biochem. 21, 935–938. doi:10.1016/0038-0717(89)90083-7
Mulvaney, R. L., Sparks, D. L., Page, A. L., Helmke, P. A., Loeppert, R. H., Soltanpour, P. N., et al. (1996). “Nitrogen-inorganic forms,” in Methods of soil analysis. Part 3-chemical methods (Madison, WI: USDA), 1123–1184.
Nikolajsen, M. T., Pacholski, A. S., and Sommer, S. G. (2020). Urea ammonium nitrate solution treated with inhibitor technology: effects on ammonia emission reduction, wheat yield, and inorganic N in soil. Agronomy 10, 161. doi:10.3390/agronomy10020161
Pan, B., Lam, S. K., Mosier, A., Luo, Y., and Chen, D. (2016). Ammonia volatilization from synthetic fertilizers and its mitigation strategies: a global synthesis. Agric. Ecosyst. Environ. 232, 283–289. doi:10.1016/j.agee.2016.08.019
Pan, J., Liu, Y., He, N., Li, C., Li, M., Sun, O. J., et al. (2021). The influence of forest-to-cropland conversion on temperature sensitivity of soil microbial respiration across tropical to temperate zones. Soil Biol. biochem. 191, 109322. doi:10.1016/j.soilbio.2024.109322
Pertile, G., Lamorski, K., Bieganowski, A., Boguta, P., Brzezinska, M., Polakowski, C., et al. (2021). Immediate effects of the application of various fungal strains with urea fertiliser on microbiome structure and functions and their relationships with the physicochemical parameters of two different soil types. Appl. Soil Ecol. 163, 103972. doi:10.1016/j.apsoil.2021.103972
Rojas, C. A. L., Bayer, C., Fontoura, S. M. V., Weber, M. A., and Vieiro, F. (2012). Volatilização de amônia da ureia alterada por sistemas de preparo de solo e plantas de cobertura invernais no Centro-Sul do Paraná. Ci. Solo 36, 261–270. doi:10.1590/S0100-06832012000100027
Schwenke, G. D., Haigh, B. M., and Peoples, M. B. (2014a). Nitrous oxide emissions under different fertiliser management practices in irrigated cotton. Soil Res. 52 (6), 449–464. doi:10.1071/SR13154
Singh, J., Kunhikrishnan, A., Bolan, N. S., and Saggar, S. (2013). Impact of urease inhibitor on ammonia and nitrous oxide emissions from temperate pasture soil cores receiving urea fertilizer and cattle urine. Sci. Total Environ. 465, 56–63. doi:10.1016/j.scitotenv.2013.02.018
Singh, R., and Nye, P. H. (1984). The effect of soil pH and high urea concentrations on urease activity in soil. Eur. J. Soil Sci. 35, 519–527. doi:10.1111/j.1365-2389.1984.tb00609.x
Soares, J. R., and Cantarella, H. (2023). Dynamics of ammonia volatilization from NBPT-treated urea in tropical acid soils. Sci. Agric. 80 (1-8), e20220076. doi:10.1590/1678-992X-2022-0076
USDA (1992). “Soil Conservation Service. Soil Taxonomy: a basic system of soil classification for making and interpreting soil surveys,” in Agric. Handbook (Washington, DC: USDA), 436.
Vinhal-Freitas, I. C., Corrêa, G. F., Wendling, B. W., Bobuľská, L., and Ferreira, A. S. (2017). Soil textural class plays a major role in evaluating the effects of land use on soil quality indicators. Ecol. Indic. 74, 182–190. doi:10.1016/j.ecolind.2016.11.020
Wenzhu, Y., Hu, Y., Song, C., Yu, Y., and Jiao, Y. (2023). Interactive effects of soil moisture, nitrogen fertilizer, and temperature on the kinetic and thermodynamic properties of ammonia emissions from alkaline soil. Atmos. Pollut. Res. 14, 101805. doi:10.1016/j.apr.2023.101805
Keywords: temperature sensitivity of ammonia, van’t Hoff equation, urea doses, nitrogen losses, ammonia emission, savanna soils
Citation: dos Santos Diniz MH, Ferreira FC and Ferreira AdS (2025) Temporal change of urea biochemical transformations and temperature sensitivity of ammonia volatilization in soil textural classes in the brazilian Cerrado. Front. Environ. Sci. 13:1498282. doi: 10.3389/fenvs.2025.1498282
Received: 18 September 2024; Accepted: 25 April 2025;
Published: 08 May 2025.
Edited by:
Kazem Zamanian, Leibniz University Hannover, GermanyReviewed by:
Marieme Drame, Cranfield University, United KingdomScherger Leonardo Ezequiel, National Scientific and Technical Research Council (CONICET), Argentina
Copyright © 2025 dos Santos Diniz, Ferreira and Ferreira. This is an open-access article distributed under the terms of the Creative Commons Attribution License (CC BY). The use, distribution or reproduction in other forums is permitted, provided the original author(s) and the copyright owner(s) are credited and that the original publication in this journal is cited, in accordance with accepted academic practice. No use, distribution or reproduction is permitted which does not comply with these terms.
*Correspondence: Adão de Siqueira Ferreira, YWRhb3NmZXJyZWlyYUB5YWhvby5jb20uYnI=