 Zebin Liu
 Wei Xiang
 Jingjing Wang1,2*
- 1School of Finance and Mathematics, Huainan Normal University, Huainan, China
- 2School of Economics and Management, Nanjing University of Aeronautics and Astronautics, Nanjing, China
Existing studies predominantly explore the link between green finance and ecological environment but overlook their dynamic spatiotemporal evolution and regional disparities. This study optimizes the coupling coordination degree (CCD) model and employs methods such as the Dagum This study innovates by optimizing the CCD model and integrating spatial econometrics with dynamic distribution methodologies to measure the coupling coordination dynamics in China from 2013 to 2022. Findings reveal an overall upward trend but significant regional disparities. The Eastern region exhibits a “high-high” clustering effect, while the Central and Western regions face a “low-low” lock-in, reflecting a “Matthew effect.” Green innovation and environmental governance improve coordination level, whereas resource consumption hinders it, with varying regional impacts. These insights inform targeted strategies, emphasizing regional cooperation and innovation-driven policies for balanced development.
1 Introduction
Since the reform and opening up, China has achieved remarkable progress in its rapid industrialization and urbanization. With the swift development of its economy and society, China has successfully become the world’s second-largest economy. However, this development has also led to certain environmental degradation (Umar et al., 2020). In response to these environmental challenges, China has set ambitious policy objectives, notably the “dual carbon” goals aimed at achieving carbon peak by 2030 and carbon neutrality by 2060. The report from the 20th National Congress of the Communist Party emphasizes the need to firmly establish and practice the concept that “lucid waters and lush mountains are invaluable assets” (Bai et al., 2022). It stresses the importance of promoting a green transformation of the economy and society and outlines a blueprint for achieving the “dual carbon” development goals, all from the perspective of harmonious coexistence between humans and nature. At the global level, climate change poses serious and multifaceted challenges, prompting the international community to adopt policy frameworks such as the Paris Agreement and the United Nations Sustainable Development Goals (SDGs). These initiatives underscore the urgent need for sustainable, climate-resilient development paths, particularly in major economies like China. Within this policy context, green finance emerges as a pivotal mechanism that channels financial resources towards low-carbon, environmentally friendly, and sustainable projects through financial markets, directly aligning with China’s carbon neutrality objectives (Gao et al., 2023). Unlike traditional finance, it incorporates environmental impacts into investment and financing decisions, aligning with SDGs such as affordable and clean energy (SDG 7) and climate action (SDG 13). Since 2007, Chinese government has issued more than 50 policy documents—ranging from guiding opinions to detailed action plans—to incentivize capital flows into green sectors while restricting financing to high-pollution and energy-intensive industries (Zhong et al., 2022). Early initiatives, such as the Green Credit Policy, laid the foundation for a comprehensive framework that currently encompasses green credit, green bonds, investment funds, insurance, and environmental trading. Throughout the 13th Five-Year Plan period (2016–2020) and continuing into the 14th Five-Year Plan (2021–2025), these policy measures have matured substantially, providing robust financial and institutional support for China’s green and low-carbon transition (Evro et al., 2024). In particular, in China, the introduction of the “carbon neutrality” goal and the “dual carbon” strategy has positioned green finance as a critical policy tool for both economic development and environmental protection (Shi and Yang, 2024). At the same time, inter-regional disparities persist, making it essential to understand how green finance can help address these inequalities while contributing to national carbon neutrality targets. A key focus of both academia and policymakers is how to guide resource allocation through the development of green finance in order to drive ecological improvements. As one of the world’s largest economies, China faces dual pressures of economic growth and environmental protection (Wu et al., 2024). To achieve sustainable development, the Chinese government has, in recent years, actively promoted the establishment of a green financial system, aiming to leverage the power of financial markets to build a resource-efficient and environmentally friendly society (Li et al., 2024). However, in practice, the relationship between green finance and the ecological environment is not a simple linear one. The challenge lies in how to effectively couple and coordinate the development between green finance and environmental improvement. In light of China’s policy imperatives, such as the carbon neutrality pledge and the necessity to mitigate inter-regional disparities, this study aims to investigate the spatiotemporal patterns of coupling and coordinated development between green finance and ecological improvements. What is the current state of this coupling and coordination (Q1)? Are there discernible patterns in the spatiotemporal processes of this coordination (Q2)? Do different regions exhibit spatial clustering in this regard (Q3)? These questions provide important directions for future research and offer insights into how green finance can support both national sustainability goals and more equitable regional development, thereby contributing to broader global efforts to combat climate change and achieve the SDGs.
Existing studies on the relationship between green finance and the ecological environment primarily focus on two aspects: the direct environmental benefits of green finance and the positive feedback of ecological improvements on green finance. Firstly, regarding the impact of green finance on the environment, scholars argue that green finance can significantly enhance environmental protection outcomes (Zhou and Xu, 2022). Specifically, it directs financial flows toward environmentally friendly projects and restricts investment and financing for highly polluting industries, thereby supporting clean energy initiatives and green technological innovations, improving energy efficiency, and reducing carbon emissions (Agrawal et al., 2024; Nepal et al., 2024; Zhang and Zhao, 2024). Additionally, promoting financial instruments such as green bonds and green loans provides essential support for sustainable environmental governance (Gao et al., 2022). For instance, Huang et al. (Huang and Zhang, 2021) found that green financial instruments effectively bridge financial markets and policy objectives in resource allocation and environmental protection, channeling capital toward high-quality environmental projects and significantly enhancing ecological quality. Zhang et al. (2021a) evaluated China’s Green Credit Policy (GCP) and reported that the policy successfully reduced emissions of major pollutants and contributed to improved environmental quality. Furthermore, Ye et al. (2022) highlighted the notable role of green finance in ecological restoration and increased resource utilization efficiency (Migliorelli and Dessertine, 2019). However, several studies have pointed out that the environmental benefits of green finance are unevenly distributed across different regions and sectors However, some studies indicate that the promotion of green finance has been uneven across regions and industries (Liu H. et al., 2023). In regions characterized by lower economic development levels and insufficient policy support, the limited implementation of green credit has resulted in significant disparities in environmental performance (Zhang W. et al., 2021; Chen et al., 2023).
Secondly, ecological improvement exerts a positive feedback effect on the development of green finance. Enhanced environmental conditions and supportive policies not only reduce risks and costs associated with financial institutions’ investments in green projects but also significantly boost market demand for green financial products and services (Khan et al., 2024). On the one hand, a reduction in environmental risk helps decrease default risk and investment uncertainty in green projects, driving further expansion of green financial investments (Gupta et al., 2024). For instance, existing studies indicate that significant improvements in ecological environmental quality notably reduce corporate default probabilities, strengthen investor confidence, and consequently enhance capital market stability (Deschryver and de Mariz, 2020; Tsoukala and Tsiotas, 2021). On the other hand, continuous improvements in environmental quality enhance public awareness of environmental protection and sustainable development, thus generating more diverse and extensive market demand for green financial products and services (OECD, 2023; Yang et al., 2024). Simultaneously, rising environmental consciousness typically leads to stricter environmental policies and regulatory measures, prompting financial institutions to proactively develop and offer novel financial instruments, such as green loans and green bonds (Chin et al., 2024). Furthermore, ongoing advancements in clean energy technologies and effective implementation of environmental policies open up broader market opportunities for green finance, channeling increased financial capital toward sustainable industries (Polzin et al., 2019; Farooq et al., 2024; Yin et al., 2024). Collectively, these beneficial interactions create a positive feedback loop: “improved ecological environment—increased green finance demand—innovation in financial instruments and services,” which continually promotes innovation and development in the field of green finance (Viehs et al., 2014; Aslam et al., 2024).
Therefore, the existing studies primarily examine the direct relationship between green finance and ecological environment development and typically acknowledges both the positive impact of green finance on the ecological environment and the reverse feedback effect from the ecological environment on green finance. Some studies have addressed spatial heterogeneity and regional disparities in socioeconomic contexts (Roy et al., 2022; Majumder et al., 2023; Majumder et al., 2024; Roy et al., 2024c; Roy et al., 2024e). However, research specifically addressing the coupling coordination development between these two systems remains relatively scarce. Some studies have utilized the traditional CCD model to measure the coupling and coordinated development between ecological environment and other systems such as high-quality economic development (Zhang Y. et al., 2023), low-carbon economies (Chen et al., 2020), and energy efficiency (Khan et al., 2021). However, the traditional CCD model has some typical issues. The calculation of the coupling degree C in these traditional models raises validity concerns. Although the value of C is confined to the range, its probability distribution is not uniform and is heavily skewed toward the upper end, often clustering around 1. This uneven distribution biases the evaluation results, thereby compromising the accuracy of the assessment. To address this issue, Wang et al. (2021) attempted to optimize the traditional CCD model to enhance its precision, but it presents two notable theoretical limitations in its construction. Firstly, the original model measures the differences between subsystems by using squared differences (i.e.,
Overall, the current studies reveal the following research gaps. Firstly, existing studies primarily emphasize either the one-way positive impact of green finance on the ecological environment or the feedback effect of ecological improvements on green finance. However, they overlook the “coupling coordination” relationship, which characterizes the mutual influence and synergistic development between these two systems. Consequently, there is insufficient analysis from a systems-coordination perspective to thoroughly examine the dynamic interactions between green finance and the ecological environment. Secondly, although some research acknowledges uneven regional and industrial promotion of green finance and ecological practices, these analyses tend to remain at a macro level or are confined to simplified comparative studies. They fail to systematically identify and measure the spatiotemporal evolution of coupling coordination, making it challenging to accurately reveal detailed regional disparities and evolutionary trends. Thirdly, although certain scholars have proposed improvements to the traditional CCD model, the robustness and stability of these optimized models remain generally limited. Therefore, to address these research gaps, this study utilizes data from 30 provinces in China from 2013 to 2022 and optimizes the CCD model combined with additional quantitative methods to measure the coupling and coordinated development level between green finance and the ecological environment in China. Based on the measurement results, this research further explores the spatiotemporal evolution patterns of their coupled development. This study makes three key contributions: 1) It optimizes Wang’s CCD model, enhancing computational efficiency and interpretability while addressing distortions caused by extreme data, thereby improving model accuracy and robustness; 2) It reveals the dynamic spatiotemporal evolution characteristics of coupling and coordinated development between green finance and the ecological environment; 3) It provides policy recommendations aimed at achieving a mutually beneficial outcome for green finance and environmental sustainability.
2 Coupled and coordinated mechanism
There exists an intrinsic logic of mutual promotion and synergistic symbiosis between green finance and the ecological environment. Such a coupling and coordination relationship not only reflects environmental economics’ emphasis on the beneficial interaction between the economy and the environment, but also aligns with spatial development theories, which stress regional differences, resource endowments, and geographic spatial patterns (Roy et al., 2022; Roy et al., 2024a). The coupling and coordinated development mechanism between green finance and the ecological environment proposed in this paper is illustrated in Figure 1. As shown in the figure, green finance and the ecological environment serve as the two “Coupling Subjects,” linked via a “Coupling Process” characterized by both market-driven effects and feedback regulation effects. On the left, green finance comprises diverse instruments—green investment, green credit, green insurance, and ecological compensation—targeted at guiding capital toward low-carbon or eco-friendly industries. On the right, the ecological environment is framed by environmental characteristics, the promotion of environmental awareness, and the implementation of environmental policies. In the center, the market-driven mechanism highlights how differentiated credit policies, green financial product development, and ecological compensation are advanced, while the feedback regulation mechanism emphasizes how ecological improvements can foster further innovation in green financial products and services, cultivate green enterprises, and promote stricter oversight. Overall, Figure 1 underscores the dynamic interplay wherein environmental pressures drive the refinement of financial instruments, which in turn accelerate environmental governance. Specifically, its implementation process manifests as an interplay between market-driven effects and feedback regulation effects.
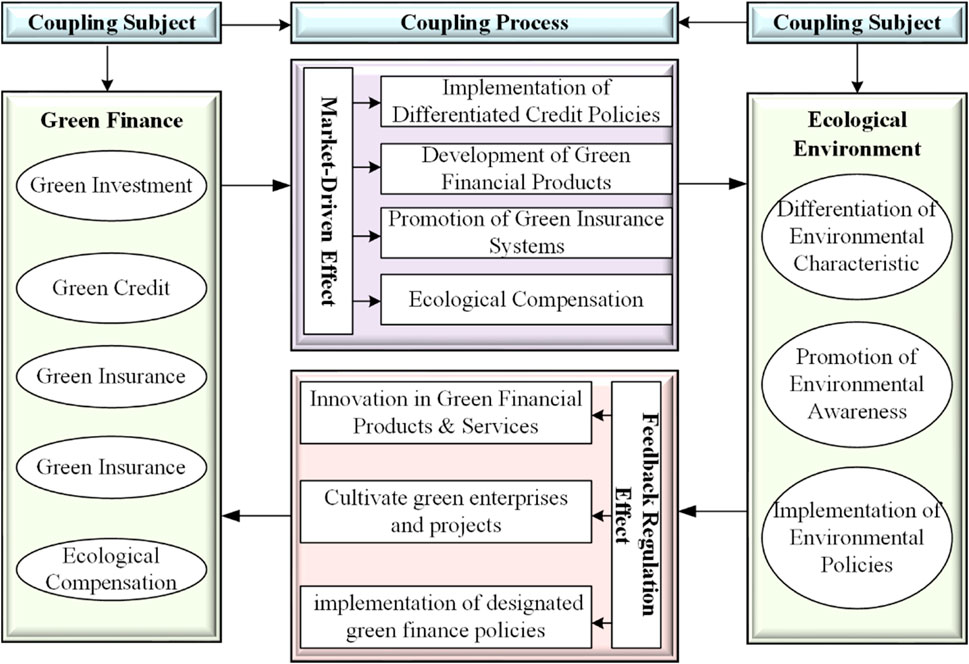
Figure 1. Coupled and coordinated development mechanism of green finance and ecological environment.
First, from the perspective of market-driven effects, green finance provides financial support and risk-sharing mechanisms for environmentally friendly and low-carbon projects through diverse instruments such as credit, investment, insurance, and trading (Zhou et al., 2020; Zhang S. et al., 2021; Zeng et al., 2022). Particularly, considering spatial heterogeneity (Roy et al., 2024d), ecological endowments and economic development levels across different regions directly shape the specific implementation pathways of green financial instruments. For instance, when banks apply differentiated credit policies targeting energy-intensive, high-emission enterprises, they need to comprehensively consider local industrial structures, environmental carrying capacity, and spatial layout characteristics. This approach prioritizes the adoption of clean technologies in regions facing greater environmental pressures. Conversely, in areas endowed with abundant natural resources and robust ecological foundations, financial instruments such as green bonds and green investments can more effectively promote the development and protection of ecological assets, thus fostering win-win scenarios between green production and ecological conservation (Khan et al., 2022). Meanwhile, carbon trading mechanisms can exhibit varying degrees of effectiveness across regions with different emission profiles. In industrialized zones with high carbon emissions, more active trading platforms and stricter emission caps can encourage firms to invest in cleaner production, resulting in significant emission reductions. In less industrialized or ecologically sensitive regions, carbon trading may play a supplementary role, for instance by facilitating the monetization of forest carbon sinks or wetland conservation, thereby transforming local environmental advantages into tradable credits. Simultaneously, by establishing ecological compensation mechanisms and environmental rights trading markets, governments can clarify property rights and achieve reasonable pricing of environmental resources, thereby transforming ecological assets like mountains, rivers, forests, and farmlands into investable financial products. This effectively guides social capital towards ecological restoration and environmental governance, highlighting the core economic principle of “internalizing externalities” emphasized by environmental economics (Li C. et al., 2022).
From the perspective of feedback regulatory effects, the state of ecological development can effectively stimulate innovation and growth in green finance. Regions with favorable ecological conditions can convert ecological resources—such as forests and rivers—into investable financial assets through clear property rights definitions and trading systems, thereby attracting additional social capital into the green finance sector (Fu et al., 2023). Conversely, areas with fragile ecological conditions or severe pollution can utilize mandatory green insurance schemes, emissions trading, and regulatory policies to encourage social investment in ecological restoration and environmental governance activities. This regionally differentiated governance strategy aligns with theoretical arguments from existing literature that emphasize leveraging spatial heterogeneity (Roy et al., 2021; Roy et al., 2024b) to implement regionally tailored environmental governance. In particular, under government policy support, initiatives such as the National Green Development Fund and carbon emissions trading projects exemplify targeted resource allocation based on regional ecological carrying capacities, resource endowments, and urban functional positioning. For example, carbon trading might yield the most direct emission-reduction benefits in heavily industrialized regions, whereas green bonds could be more effective in areas with cleaner industries yet vast ecological resources, thereby stimulating eco-friendly infrastructure and the conservation of natural assets.
In summary, the coordinated development of green finance and ecological environment requires not only the theoretical framework of environmental economics to internalize ecological externalities but also a deep integration with spatial development theory to comprehensively analyze regional disparities and ecological patterns. Through the dual mechanisms of market-driven dynamics and feedback regulation, green finance can achieve locally tailored resource allocation optimization, accelerate environmental governance, and promote green transformation, ultimately providing robust support for sustainable development.
3 Evaluation model
3.1 Optimized entropy weight model
This study utilizes the entropy weight model (Feng et al., 2019) to calculate the evaluation index for green finance and the ecological environment. Traditional entropy weighting methods do not adequately consider temporal variability when calculating information entropy, a factor that is crucial for analyzing economic data. The conventional formula presumes that data from all-time points contribute equally to the evaluation results, and therefore fails to capture the dynamic patterns in the time series. To address this issue, this study optimizes the traditional entropy method to ensure that the entropy calculation accurately reflects the temporal dynamics of the data, which enhances the model’s adaptability and precision in analyzing time-series data for green finance and the ecological environment. To improve the model’s responsiveness to temporal variations, this study proposes assigning differentiated weights to data from different time points. For instance, relative to earlier data, the most recent observations often provide a higher degree of relevance regarding the current state. Based on this consideration, we introduce a temporal weight, denoted as wθ, to assign higher weights to more recent data points. The specific calculation process is as follows.
(1)Data standardization:
(2) Calculate the standardized probability distribution:
(3) Calculate the entropy of each indicator, incorporating the time variable:
(4) Calculate the weights of each evaluation indicator:
(5) Calculate the evaluation index:
3.2 Optimized coupling coordination degree (CCD) model
Building on the research of Wang et al. (2021), this study further optimizes the CCD model, with the optimized formula as follows:
where n is the number of subsystems; Ui and Uj represent the evaluation indices of the subsystems; and α is the system weight. In this study, given that green finance and the ecological environment are considered equally important, α is set to 0.5. This assumption is grounded in the premise that sustainable regional development necessitates balanced progress in both green finance and ecological preservation. Empirical literature indicates that assigning equal importance mitigates potential biases favoring either economic or ecological objectives, thereby facilitating a holistic and balanced analysis. Furthermore, sensitivity tests conducted with varying α values confirmed that equal weighting (α = 0.5) yields stable and representative outcomes across diverse Chinese regions, substantiating the robustness and applicability of this assumption.
The optimized model has three primary advantages. First, it establishes a unified measurement framework that facilitates easier comparison and generalization. By introducing normalization through max Ui and quantifying average intra-system differences using
This study categorizes the CCD into six types based on the classification method proposed by Liu et al. (2023b), as shown in Table 1.
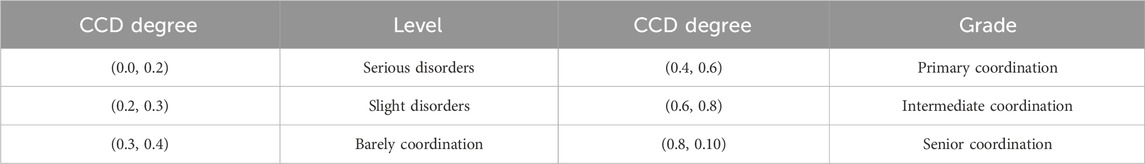
Table 1. Evaluation standard of CCD.
3.3 Dagum gini coefficient method
This study employs the Dagum Gini coefficient (Zhang et al., 2022) and its decomposition method to quantify regional disparities in the coupling coordination level of green finance and the ecological environment. Compared to traditional measures such as the Theil index or the conventional Gini coefficient, the Dagum Gini decomposition method explicitly separates regional disparities into intra-regional, inter-regional, and transvariation components, thus providing deeper insights into the structure and sources of regional inequalities. This approach allows for a detailed examination of the sources of inequality by decomposing disparities into intra-regional, inter-regional, and transvariation components, providing a comprehensive understanding of spatial imbalances. The overall Gini coefficient (G) is decomposed into three components: intra-regional disparities (Gw), inter-regional disparities (Gnb), and transvariation density between regions (Gt). The relevant calculation formulas are as follows:
3.4 Kernel density estimation
This study utilizes the Gaussian kernel function (Kamalov, 2020) to estimate the dynamic evolution of coupling coordination between green finance and the ecological environment across China’s eastern, central, and western regions. KDE is preferred over simpler distribution analysis methods such as histograms or empirical distribution functions, due to its capability to produce smooth, continuous density curves without prespecified binning intervals, thereby more accurately capturing subtle shifts and multimodal features in the data distributions over time. This method enables a smooth and continuous assessment of distributional changes over time, capturing regional disparities and trends in development. The formula is as follows:
where, K(x) is the kernel function; n is the total number of samples, and in this case, it pertains to the 30 provincial regions; h indicates the bandwidth used for the density estimation.
3.5 Moran’s I index
To further examine the spatial correlation among provinces, this study applies Moran’s I index (Roy et al., 2022; Majumder et al., 2023; Roy et al., 2024c) to perform a global spatial autocorrelation test, assessing the degree of spatial clustering in the coupling coordination of green finance and the ecological environment. Compared with alternative measures such as Geary’s C and Getis-Ord statistics, Moran’s I is widely recognized for its robustness in detecting global spatial autocorrelation, providing a clear and easily interpretable indication of whether the observed patterns reflect clustered, dispersed, or random spatial arrangements. Thus, it aligns better with the study’s objectives to identify overall spatial dependencies. The calculation formula is as follows:
In this analysis, n represents the total number of locations under consideration. The variables xi and xj denote the observed values at locations i and j, respectively. These values are crucial for assessing the spatial attributes and relationships within the dataset.
3.6 Spatial Markov Chain analysis
This study employs spatial Markov chain analysis to examine the dynamic evolution of coupling coordination between green finance and the ecological environment. Unlike standard Markov chain methods, spatial Markov chain analysis incorporates spatial dependencies into the transition probability matrix by utilizing spatial weight matrices, allowing it to account for spillover effects and neighborhood interactions explicitly. Compared to spatial panel models, spatial Markov chain analysis provides a clearer depiction of dynamic state transitions and probabilistic pathways between coordination levels over time, highlighting how regional interactions and spatial spillovers influence developmental trajectories. By incorporating spatial dependencies, this method adjusts each province’s initial coupling coordination level using a spatial weight matrix, allowing for an assessment of how regional interactions influence development transitions over time. The calculation formula is as follows:
4 Data sources and construction of indicator system
4.1 Data sources
This study utilizes data from 30 provinces in China spanning the years 2013–2022. The primary data sources include the CSMAR database purchased by the research institution, the China Statistical Yearbook, China Environmental Yearbook, China Insurance Yearbook, as well as the statistical yearbooks and statistical bulletins of various provinces and municipalities. For missing data in some provinces, this study employs the Lagrange interpolation method to complete the dataset. The proportion of missing data is relatively small in most cases. This interpolation method assumes a relatively stable progression of data points between observations, making it suitable for indicators with limited annual fluctuations during the analyzed period. Given that the indicators under study generally exhibit gradual annual changes, the interpolation approach maintains data consistency and integrity. Consequently, employing Lagrange interpolation minimally influences the empirical outcomes, ensuring the robustness and reliability of the analytical results.
4.2 Indicator system
This study adheres to the principles of comprehensiveness, scientific rigor, hierarchy, and operability in constructing a green finance and ecological environment coupling coordination evaluation index system, grounded in the theory of coupling coordination (see Tables 1, 2). When selecting indicators for the ecological environment system, the study adopts the Pressure-State-Response (PSR) model framework (Cheng et al., 2022), utilizing 14 indicators across three dimensions: ecological state, environmental pressure, and ecological response, to comprehensively reflect the ecological environment conditions in different provinces of China. The ecological state dimension focuses on assessing the fundamental health status of regional ecosystems (Pan et al., 2021). The environmental pressure dimension primarily reflects the extent of negative impacts caused by human activities on the ecosystem, which is used to reveal the potential risks and ecological pressures that economic and social development impose on environmental quality (Qi et al., 2020). The ecological response dimension, by capturing the inputs and efforts from various societal sectors in environmental protection, measures society’s overall response to ecological management initiatives (Bryhn et al., 2020). Indicator selection for the green finance system is aligned with the “dual carbon” goals and the green low-carbon development strategy, encompassing 13 indicators across five dimensions: green credit, green securities, green insurance, green investment, and carbon market. The green credit dimension primarily evaluates the performance of financial institutions in supporting environmental industries and financing green projects (Bao and He, 2022). The green investment dimension assesses the role of capital markets in driving green transformation and the extent of financial support for green industries (Zhang J. et al., 2023). The green insurance dimension measures the contribution of the insurance sector in mitigating environmental risks and providing compensation mechanisms (Svoboda, 2023). The carbon finance dimension evaluates the application of carbon finance by examining the development of the carbon trading market and the activity level of carbon asset trading (Guo et al., 2022).
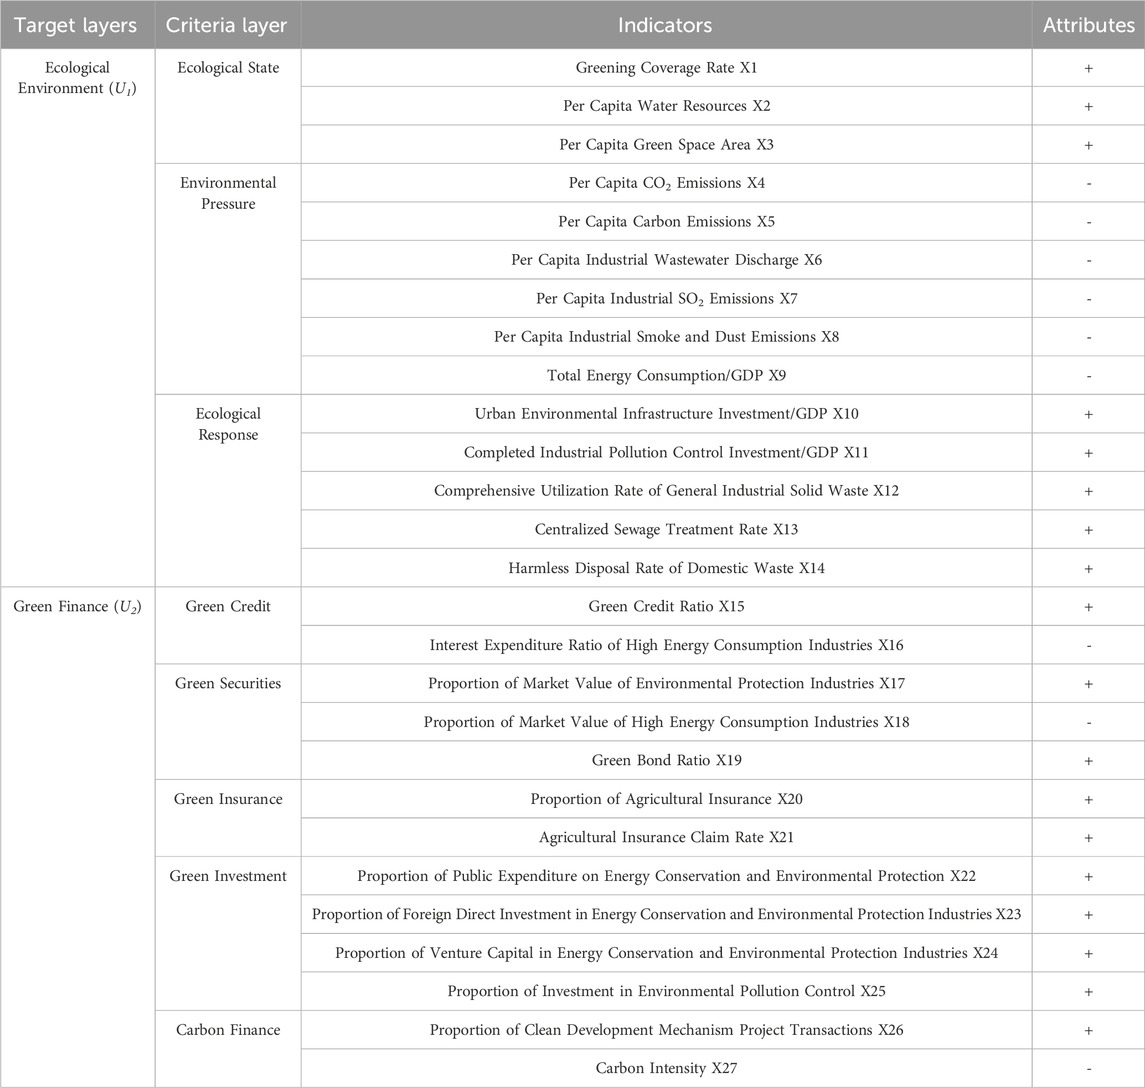
Table 2. Metrics of the green finance and ecological environment.
To quantify these indicators, this study employs an optimized entropy weight model that incorporates time-dependent weighting factors (wθ) to capture temporal variations, while also ensuring that regional data characteristics appropriately influence the resulting weight assignments. For instance, in regions facing extreme ecological pressures, ecological indicators (such as “environmental pressure” or “ecological response”) may exhibit more pronounced fluctuations, resulting in higher assigned weights. Conversely, in areas with limited green financial infrastructure, green finance-related indicators (e.g., green credit or green investment) might display distinct variation patterns, similarly influencing their weight calculations. Therefore, by adjusting weights based on actual data distributions, the model dynamically emphasizes the most critical indicators for each specific region and time period, effectively addressing potential concerns arising from varying regional contexts.
5 Empirical results analysis
This section provides a systematic empirical analysis based upon methodologies outlined previously. Firstly, the CCD model is employed to quantitatively assess the current coupling and coordinated development between green finance and the ecological environment, directly addressing the first research question (Q1) posed in the introduction. Subsequently, Kernel Density Estimation, Moran’s I Index, and Spatial Markov Chain Analysis are utilized to examine the spatiotemporal dynamics and evolutionary patterns of coupling coordination, explicitly corresponding to the second research question (Q2). Finally, regional disparities and spatial clustering characteristics are analyzed using the Dagum Gini Coefficient Method combined with clustering analysis, explicitly addressing the third research question (Q3). Collectively, the results of these analyses offer comprehensive insights into the present conditions, dynamic evolutionary trends, and regional differences associated with the coordinated development of green finance and the ecological environment across China.
5.1 Spatial distribution characteristics of coupled and coordinated development
Using the optimized CCD calculation method (Equations 1–9), this study computes the coupling coordination degree between green finance and the ecological environment, as shown in Table 3. For a clearer visualization of the changing trends in the coupling coordination levels of the two systems, we plotted a descriptive statistical chart. As illustrated in Figure 2, the annual median of the coupling coordination degree between green finance and the ecological environment exhibits a steady upward trend, which indicates a continuous improvement in the overall coupling and coordination level nationwide. Currently, the coupling and coordination level of the two systems is predominantly in the primary coordination stage. Specifically, the range between the upper and lower whiskers of the box plot gradually expands each year, suggesting an increasing volatility in the coupling coordination degree. Although substantial differences exist in the coupling coordination levels across provinces in different years, the overall development trend has become more stable since 2020.
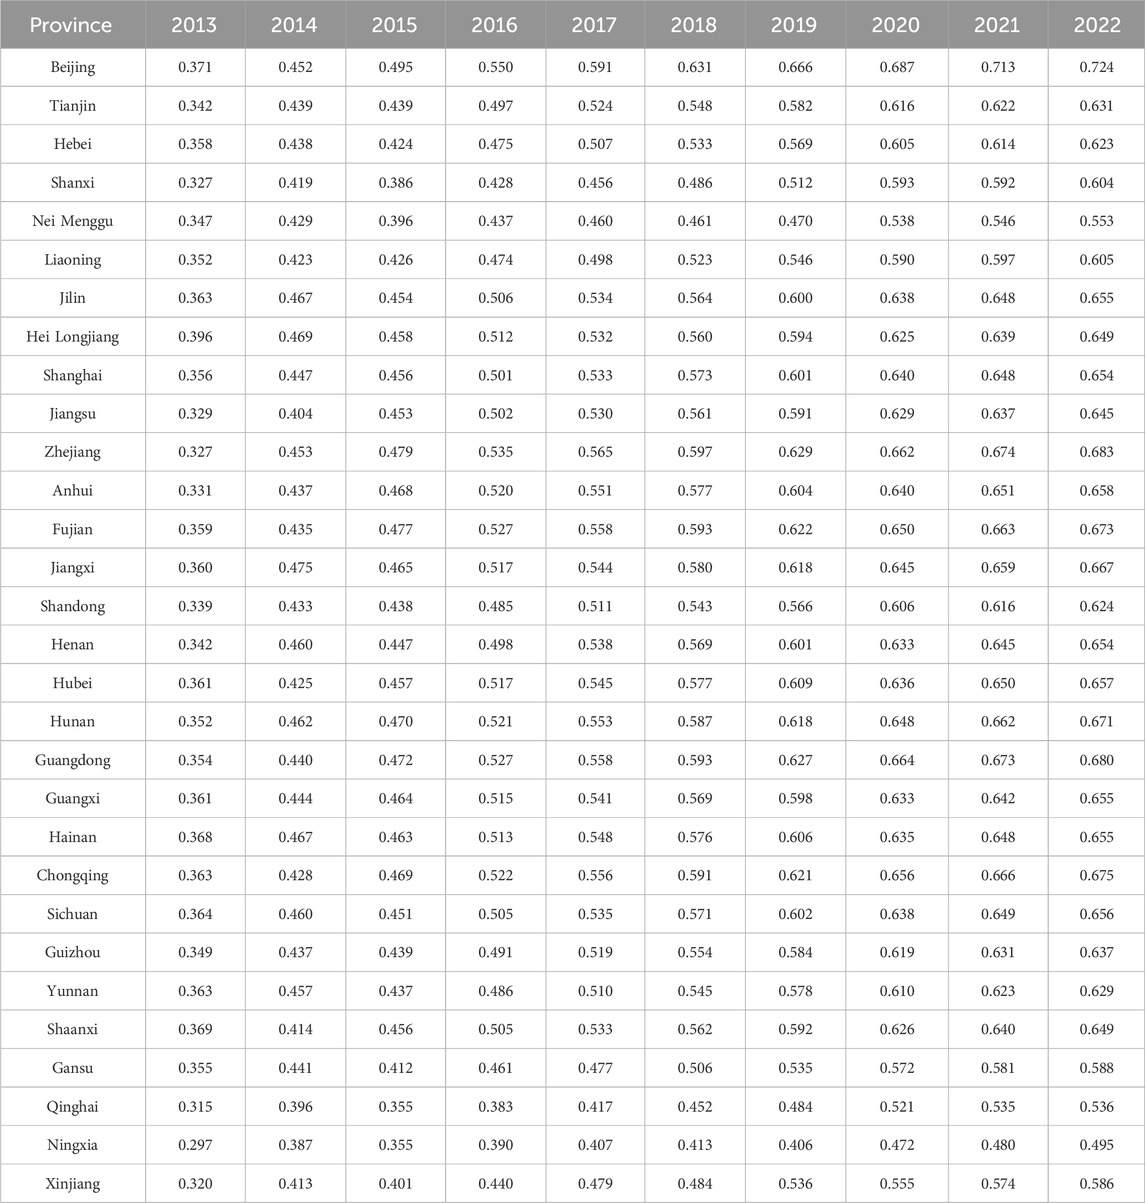
Table 3. Results of CCD between green finance and ecological environment from 2013 to 2022.
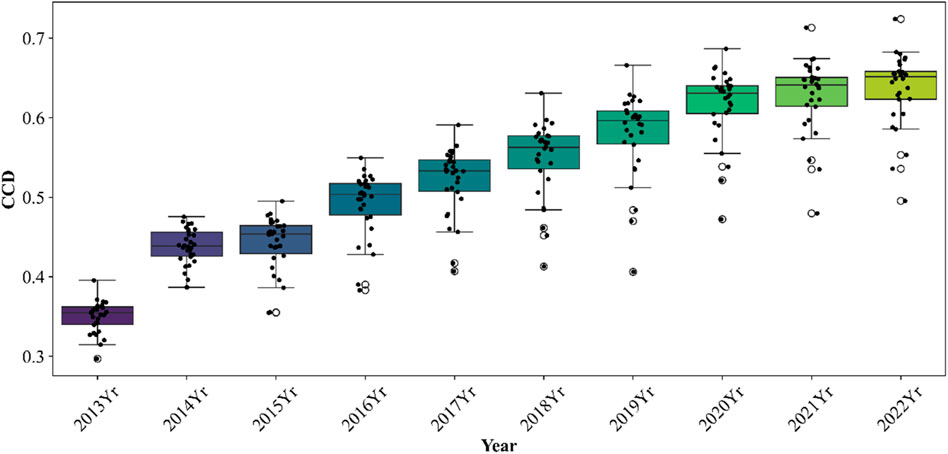
Figure 2. Descriptive statistics value of CCD from 2013 to 2022.
To more intuitively depict the spatiotemporal differentiation in the coupling coordination levels between the two systems, this study illustrates the spatial distribution map of the coupling coordination degree, as shown in Figure 3. Figure 3 indicates that provinces with higher CCD are primarily concentrated in the eastern provinces, such as Beijing, Jiangsu, and Shanghai. Conversely, provinces with lower CCD are primarily distributed across the central and western regions. Therefore, the coupling and coordinated development level between green finance and the ecological environment in China demonstrates significant regional disparities.
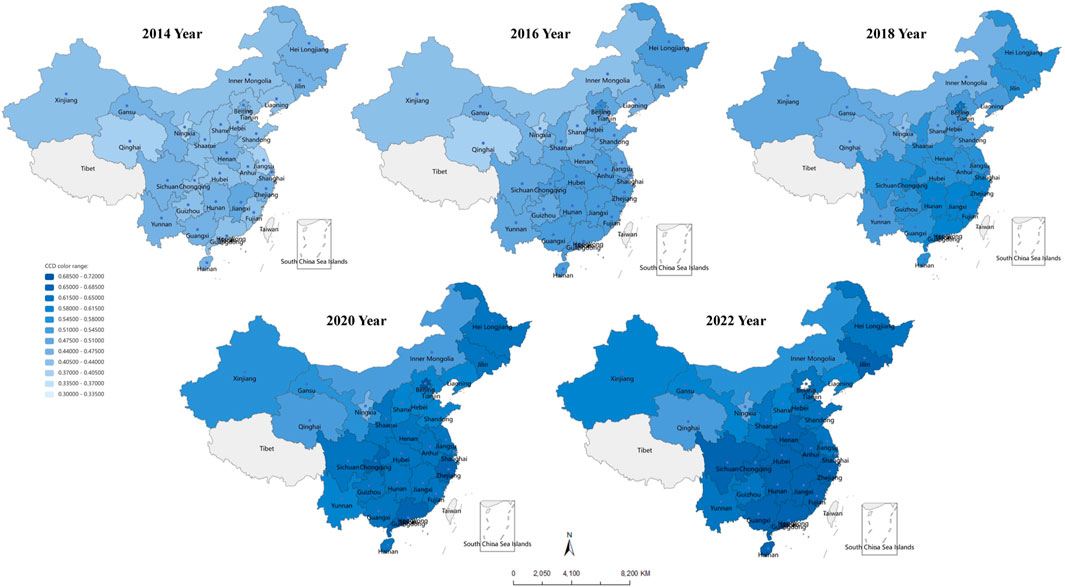
Figure 3. CCD value of 30 provinces of China for year 2013, 2016, 2019, and 2022.
To further investigate the spatial agglomeration and regional distribution patterns of the coupling coordination development between green finance and the ecological environment, this study employs Moran’s I index for spatial correlation analysis of the coupling coordination degree for 30 provinces. By calculating Moran's I index based on Equation 17, the study examines spatial clustering and statistical significance, and explores spatial differentiation and dependence of the coupling coordination levels across provinces. The Moran’s I result, calculated using the established formula, are shown in Table 4. As indicated in Table 4, the values of Moran’s I exhibit an upward trend, with all values passing the significance tests. This indicates a significant spatial clustering effect in the coupling coordination development between green finance and the ecological environment in China. To further analyze the spatial correlation characteristics of the coupling coordination development, the study uses Moran’s I index to generate a local Moran’s scatter plot, as illustrated in Figure 4. Analysis of the local Moran’s scatter plot reveals the spatial dependency features and potential spatial spillover effects of the coupling coordination between green finance and the ecological environment, providing a basis for subsequent regional development policy formulation. Figure 4 shows that the coupling coordination development between green finance and the ecological environment in China exhibits distinct regional characteristics and dynamic evolution patterns. At the provincial level, the coupling coordination development between the two systems generally displays a “high-high” and “low-low” spatial clustering pattern, indicating significant spatial disparities in development. Specifically, in earlier years, the distribution of the coupling coordination degrees across provinces was relatively dispersed, with a balanced distribution among the four quadrants, indicating weak spatial clustering. However, over time, provinces have gradually converged into high-high and low-low clusters. The study finds that most provinces in the eastern region fall into the first quadrant (H-H type), indicating that the coupling coordination development between green finance and the ecological environment is at a high level with strong spatial agglomeration effects. This suggests a positive synergy between green finance and the ecological environment in these regions. Conversely, most provinces in the central and western regions are located in the third quadrant (L-L type), signifying that the coupling coordination development between the two systems is at a relatively low level with negative spatial effects, making these areas the weak links in development. Further analysis of the 2013-2022 evolution reveals that the high-high agglomeration effect in the eastern coastal region has been gradually strengthening, while the low-low effect in the western region shows signs of becoming entrenched. This reflects a significant inter-regional imbalance in the coupling coordination development between green finance and the ecological environment.
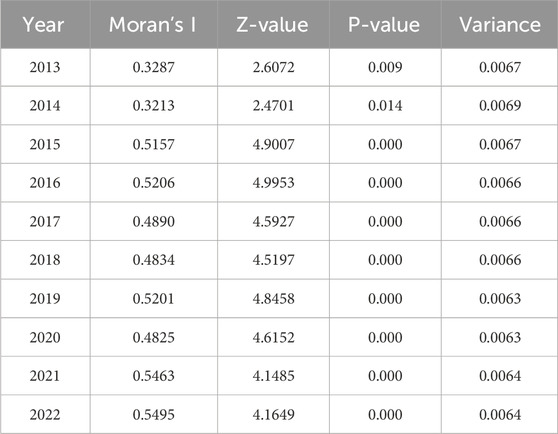
Table 4. Moran’s I index from 2013 to 2022.
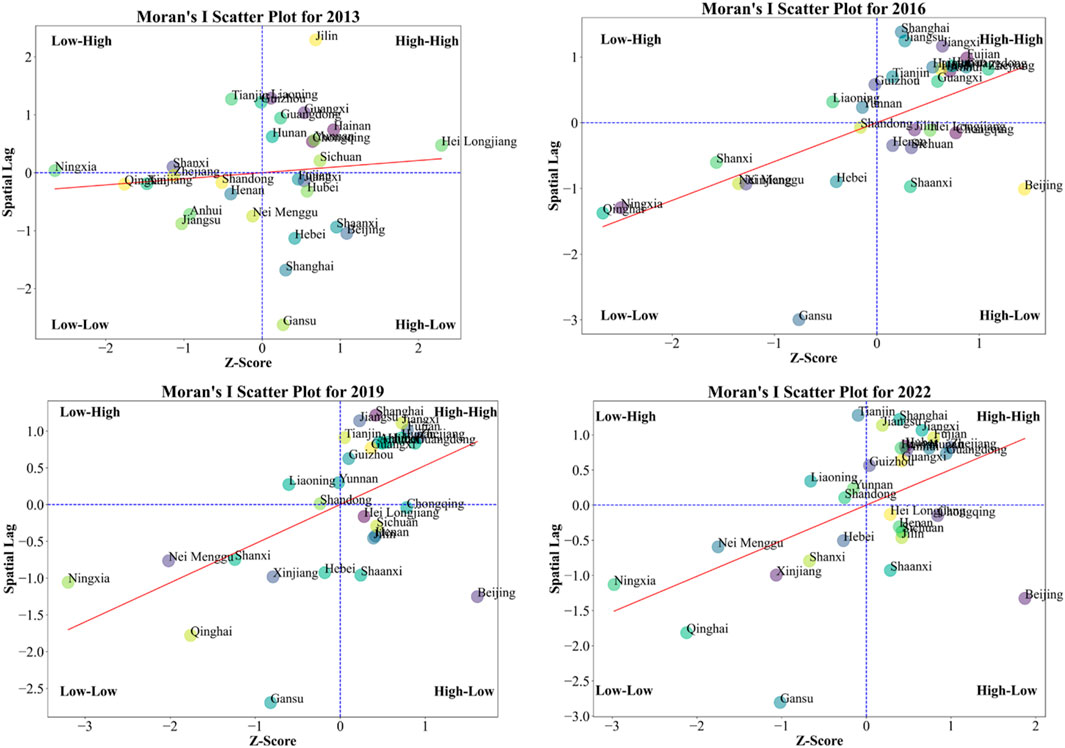
Figure 4. Local Moran’s scatter plot and spatial clustering analysis of coupling coordination development between green finance and ecological environment in 30 provinces (2013–2022).
Following the identification of spatial characteristics in the coupling coordination development between China’s green finance and ecological environment, this study employs hierarchical clustering algorithms to systematically categorize 30 provinces, to further explore the heterogeneity of coupling coordination development across different regions. The Silhouette coefficient is used to evaluate the clustering performance, as shown in Figure 5a. The closer the Silhouette coefficient is to 1, the better the clustering result. It can be observed from Figure 5a that the clustering is most effective when the provinces are divided into three categories. Figure 5b provides a visual representation of the clustering results. The first category primarily includes eastern and coastal provinces. These provinces are typically located in economically developed areas and are characterized by a high level of green finance development and strong ecological governance capabilities. Thus, in the clustering analysis, these provinces form a distinct “high-level” cluster. The second category mainly consists of provinces in central China, along with a few in the eastern region. These provinces exhibit relatively low levels of coupling coordination between green finance and the ecological environment, indicating a lagging development pattern with weak synergy between green finance and environmental governance. The third category primarily includes provinces in the western and remote regions. These provinces face significant challenges in green finance development, high ecological pressure, and constraints from geographical conditions and economic foundations, thereby forming a “low-level” cluster in the clustering analysis. The clustering results show that the third category forms a relatively independent “low-level” cluster, displaying strong internal cohesion but weak linkages with other provinces. This phenomenon suggests that the western region exhibits pronounced regional disparities in the development of green finance and the ecological environment. Overcoming this “low-low” lock-in effect necessitates coordinated inter-regional development policies and the introduction of additional green finance resources. Integrating the clustering results with the spatial patterns revealed by the prior Moran’s I analysis shows that provinces with “high coordination levels” are primarily concentrated in the eastern and coastal regions, corresponding to the “high-high agglomeration” spatial clustering pattern. Conversely, provinces with “low coordination levels” are concentrated in the central and western regions, displaying a “low-low agglomeration” pattern.
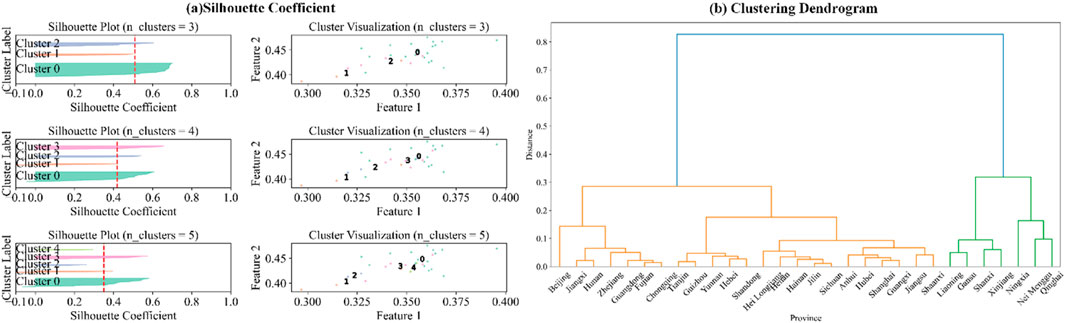
Figure 5. Clustering analysis results for 30 Chinese provinces (2013–2022): (a) silhouette-coefficient analysis; (b) hierarchical-clustering results.
5.2 Distribution dynamics and evolutionary patterns
To further investigate the spatial distribution and local clustering effects of the coupling coordination degree between green finance and the ecological environment, this study employs the Kernel Density Estimation (KDE) method based on Equation 16 for analysis. The results are shown in Figure 6. The KDE method effectively reveals evolutionary trends in regions with varying coupling coordination degrees, providing insights into the spatiotemporal evolution of coupling coordination across different regions and highlighting areas with distinct clustering characteristics. Figure 6 illustrates the temporal evolution of coupling coordination at both the global and local scales: Figure 6a presents the global scale results, while Figures 6b–d through display the local scale results.
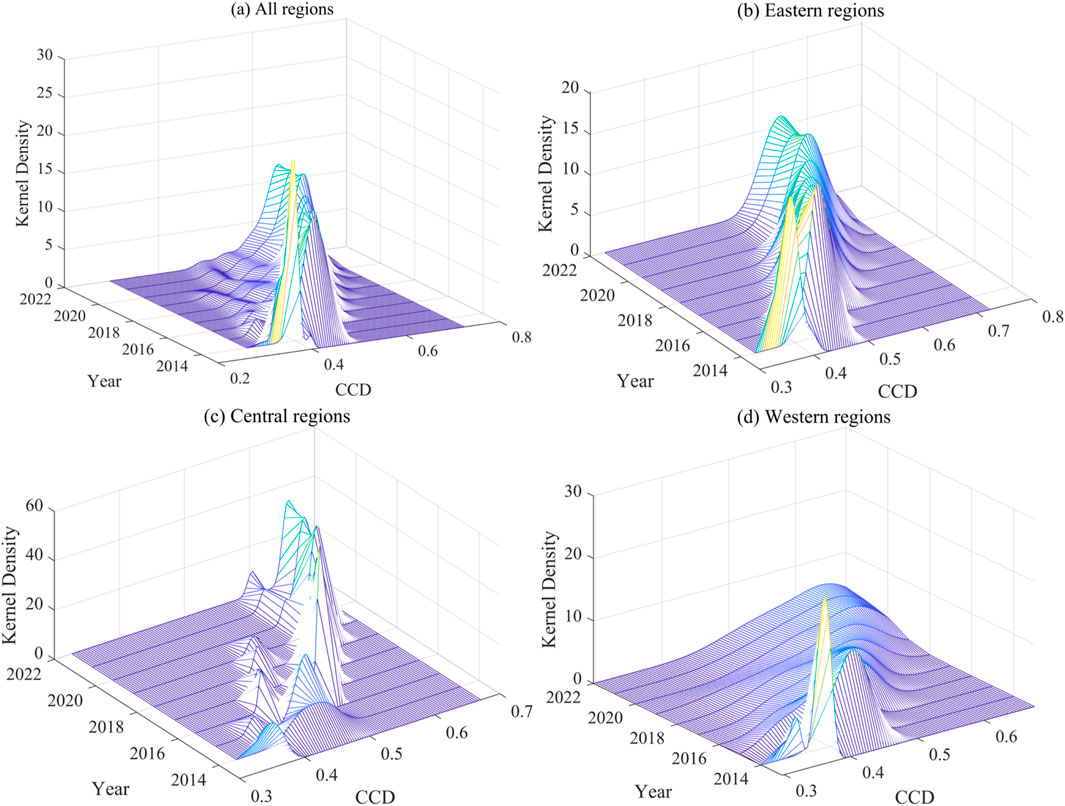
Figure 6. Kernel density curves of the CCD between green finance and the ecological environment (2013–2022): (a) all provinces; (b) eastern region; (c) central region; (d) western region.
At the global scale, the kernel density curves show a gradual rightward shift in the CCD during the study period, indicating an overall improvement in the coupling coordination level between green finance and the ecological environment nationwide. The main peak of the curve follows a “rise-stabilization-rise” pattern, with a slight widening of its range, suggesting an increase in absolute differences in coupling coordination levels across regions. The left tail of the curve shortens over time, while the right tail extends, indicating a reduction in the number of regions with low coupling levels and an increase in those with high coupling coordination levels. This pattern reflects a “strong get stronger” trend, where regions with high coupling levels exhibit stronger coordination capacities and faster growth. At the local scale, the kernel density curves for the three major regions—Eastern, Central, and Western China—exhibit a pronounced rightward shift during the study period, accompanied by a gradual increase in peak heights over time. This trend indicates a general enhancement in the coordination level between green finance and the ecological environment across all regions. The contraction of the left tail and the elongation of the right tail suggest a reduction in the number of cities with low coupling levels and an increase in the proportion of cities with high coupling levels, further supporting the emergence of the “strong get stronger” effect. Simultaneously, the kernel density curves in the Eastern, Central, and Western regions have evolved from a “single peak with a minor secondary peak” to a “single peak with multiple secondary peaks” pattern. The initial dominant single peak has gradually transitioned into a multi-peak structure, indicating a multi-modal distribution of coupling levels within each region. This transformation suggests that disparities in coupling coordination levels among cities within each region have intensified, resulting in the formation of multiple clusters at different development stages.
Relying solely on the Kernel Density Estimation (KDE) method may not fully capture the spatial dependencies and dynamic evolution patterns of inter-regional coupling levels. Therefore, to more effectively reveal the spatial interaction patterns and dynamic transition mechanisms of coupling coordination levels across regions, this study employs the Spatial Markov Chain Model for analysis. The 30 provinces are categorized into four groups based on the coupling coordination degree: low level, medium-low level, medium-high level, and high level, denoted as levels I, II, III, and IV, respectively. The calculated spatial Markov chain transition probability matrix based on Equation 18 is presented in Table 5. A heatmap of the transition probabilities is provided in Figure 7 to visually illustrate the transition patterns. Several key findings can be derived from Table 5 and Figure 7: 1) There is a stability effect, as evidenced by the largest probabilities appearing along the diagonal, indicating that provinces have the highest probability of remaining in their current states. This reveals a strong path-dependence effect in the provincial development of coupling coordination, where the likelihood of retaining the existing state consistently surpasses the probability of transitioning to other states; 2) Provinces characterized by high levels of coupling coordination exhibit pronounced stability and are less susceptible to neighboring provinces’ influences, suggesting that their advantages in coupling coordination have solidified and become resistant to erosion; 3) The evolution of coupled and coordinated development displays a “club convergence” phenomenon. When provinces at lower coordination levels border those at medium or medium-high levels, their probability of upward transition notably increases, highlighting the significant positive spatial spillover effects from neighboring higher-level provinces; 4) Across different lag periods, the probability of upward transitions generally exceeds that of downward transitions, indicating an overall upward-oriented evolutionary trajectory in coupling coordination. 5) There is an evident “Matthew effect.” Both low-level and high-level provinces demonstrate significantly higher self-stabilizing probabilities compared to provinces at intermediate levels. Remarkably, by the third lag period, the self-stabilizing probability of low-level provinces reaches 100%, reflecting strong persistence and reinforcing existing disparities; 6) The probability of inter-level transitions remains relatively low, particularly among low-level and medium-level provinces. The probability of directly transitioning into the high-level category is nearly zero, underscoring substantial structural differences across provinces with varying coupling coordination levels. Hence, achieving cross-category transitions continues to be a significant challenge in promoting coupling coordination between green finance and the ecological environment.
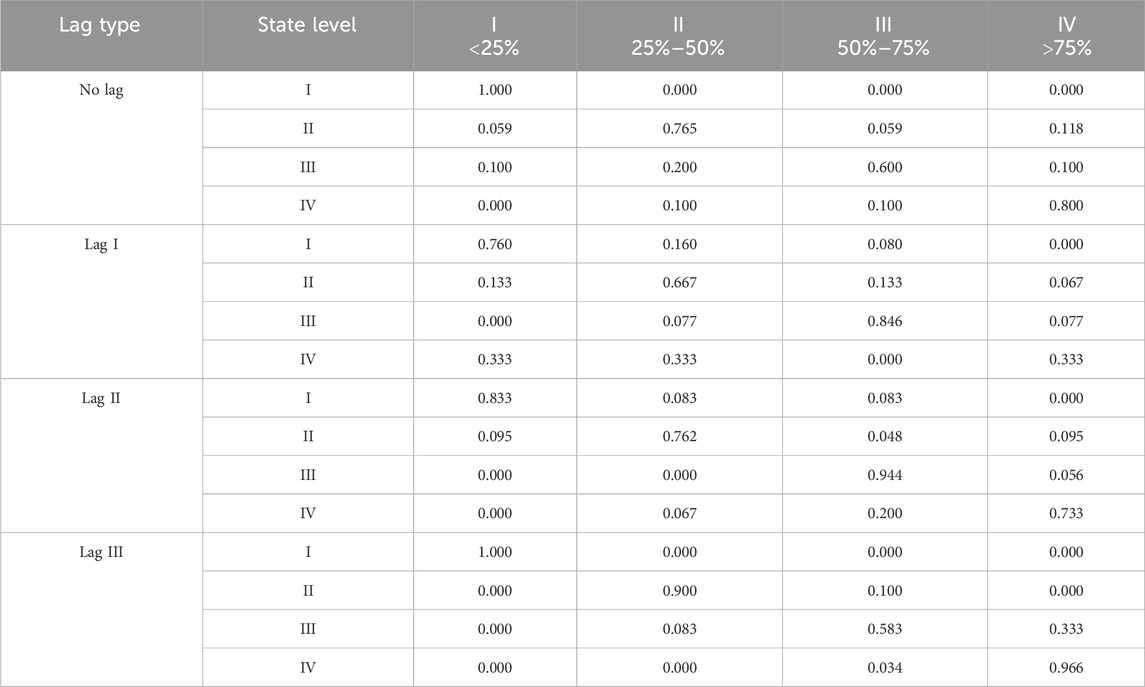
Table 5. Spatial Markov chain transition probability matrix.
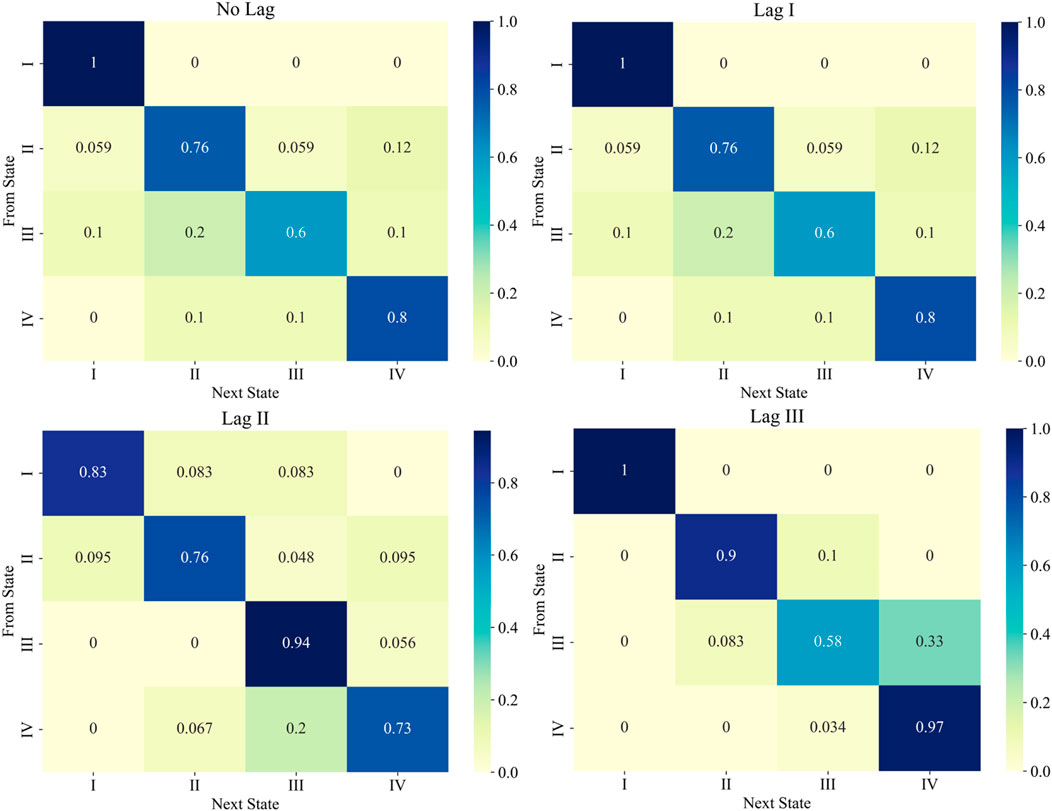
Figure 7. Spatial Markov chain transition probability matrix.
To verify the temporal robustness of the spatial Markov chain model, this study further conducted a bootstrap robustness test. Specifically, by performing 1,000 bootstrap resamples, the 95% confidence intervals for the transition probability estimates were derived. Figure 8 illustrates the transition probabilities for each state, accompanied by error bars representing their respective confidence intervals. The relatively narrow 95% confidence intervals observed across all states indicate that the model results are robust against random sampling variability, confirming strong statistical robustness. Specifically, the self-stabilization probabilities demonstrate particularly high stability, characterized by tightly concentrated confidence intervals, which further validates significant path dependence and the existence of a “Matthew Effect” in inter-provincial coupling coordinated development—regions in high-level or low-level states exhibit notably stronger stability. Although intermediate states (e.g., State III) show slightly wider confidence intervals, they remain relatively stable, reflecting minor fluctuations induced by spatial spillover effects. Taken together, these findings confirm that the spatial Markov chain model and its associated transition matrix employed in this research exhibit strong statistical robustness.
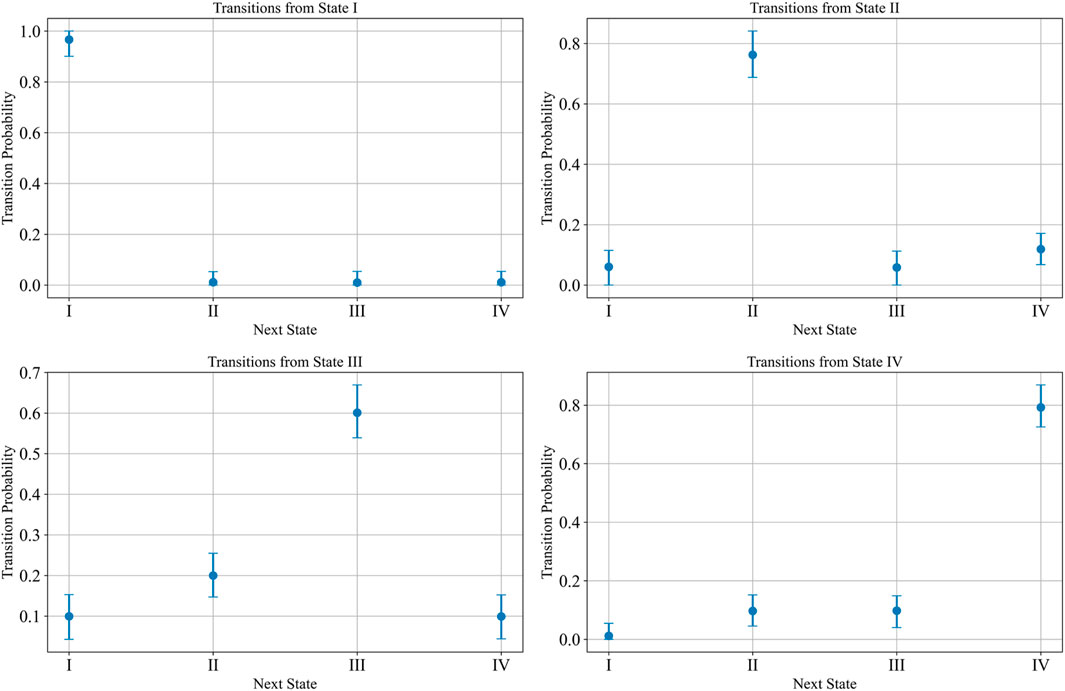
Figure 8. Bootstrap robustness check of spatial Markov-chain transition probabilities (95 % CI): (a) transitions from state I; (b) transitions from state II; (c) transitions from state III; (d) transitions from state IV.
5.3 Regional differences analysis
To further characterize intra- and inter-regional disparities in the coupling coordination development between green finance and the ecological environment, this study utilizes the Dagum Gini coefficient to quantify regional imbalances and identify their underlying sources based on Equations 10–15. Specifically, the Dagum Gini coefficient decomposes overall inequality into three components: intra-regional disparity (Gw), inter-regional disparity (Gnb), and transvariation (Gt), thereby revealing the structural features of regional disparities and their evolutionary trends. Table 6 and Figures 9a, b present the results of the overall Gini coefficient and its decomposition components. Notably, the overall disparity has increased from 0.028 in 2013 to 0.039 in 2022, reflecting persistent and widening regional imbalances. Although temporary reductions in disparities have occasionally been observed, the overall trend highlights the persistent challenge of achieving coordinated nationwide development. In terms of component contributions, inter-regional disparities dominate, whereas intra-regional disparities and transvariation exhibit comparatively lower impacts. Specifically, inter-regional disparities accounted for approximately 47% of the total inequality on average, reflecting substantial gaps between regions, notably between the more developed eastern region and the less developed western region. These findings indicate that structural imbalances rooted in differential regional development are the primary cause of disparities in green finance and ecological environment coordination.
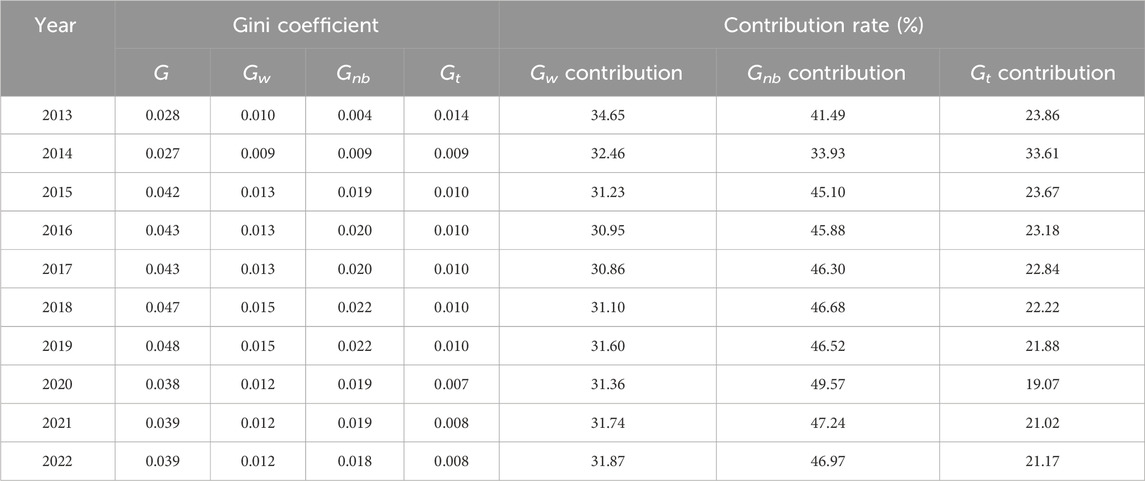
Table 6. Dagum Gini coefficient and contribution rate results.
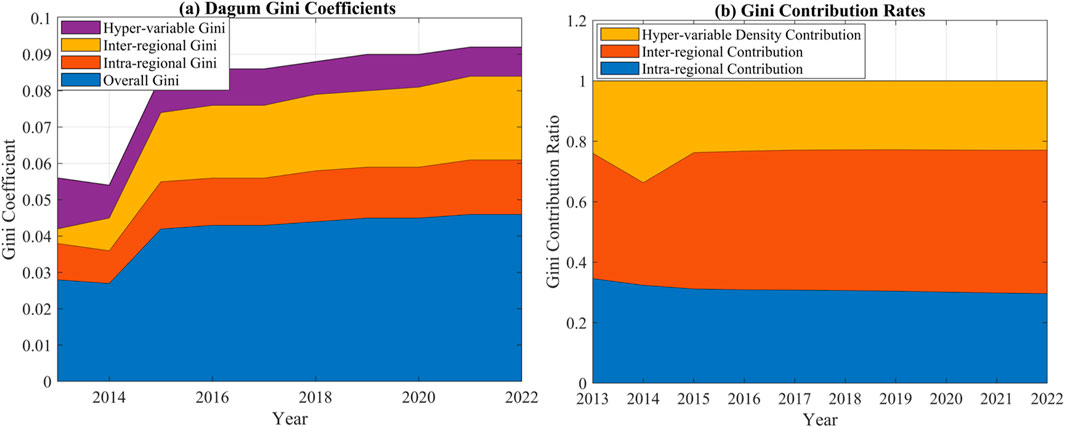
Figure 9. Dagum-Gini analysis of the coupling-coordination degree between green finance and the ecological environment in 30 provinces (2013–2022): (a) Dagum Gini coefficients; (b) Gini contribution ratios.
Table 7 and Figures 10a, b show the calculation results for intra- and inter-regional coefficients across each region. The intra-regional disparity levels differ among the three major regions, exhibiting heterogeneous development patterns. Notably, in 2022, the Gini coefficient of the western region (0.051) was more than three times that of the central region (0.016), highlighting a pronounced internal disparity within the west in contrast to the relatively modest gap within the central area. This indicates that the coordination gap between green finance and the ecological environment is most pronounced in the western region, while the central region experiences relatively smaller disparities. Over the study period, the intra-regional Gini coefficients in the eastern, central, and western regions generally exhibited a stable downward trend. However, the intra-regional disparities in the Western region follow a “raise-decline” fluctuating pattern, suggesting that the coordination development in some provinces within the western region significantly lags behind others, leading to an increase in intra-regional disparities. Regarding inter-regional disparities, the largest gap exists between the eastern and western regions, reflecting the most significant differences in the coordination development of green finance and the ecological environment. Conversely, the inter-regional disparity between the eastern and central regions is the smallest, and the overall gap remained stable throughout the study period, suggesting that differences in the coordination development of green finance and the ecological environment between these two regions are gradually narrowing. The cross-regional decomposition results of the Dagum Gini coefficient indicate a persistent and significant gap between eastern and western regions. This gap not only reflects differences in economic foundations and industrial structures but also highlights the imbalance in financial resource allocation and policy support. Without targeted policy interventions, the development bottlenecks faced by western regions—in areas such as green financial investment, ecological governance, and technological introduction—are likely to intensify further. Several structural and policy-driven factors explain why the central and western regions lag behind. First, although the central region has experienced some industrial transformation, it generally lacks the robust financial infrastructure and advanced service sectors necessary to effectively spur green investment. Meanwhile, the western region confronts significant geographical constraints and lower levels of economic diversification, limiting opportunities for large-scale green finance projects. These structural limitations—compounded by uneven policy support and insufficient technological innovation—set the foundation for deeper analysis in subsequent sections, which examine the specific drivers and potential policy interventions in greater detail.
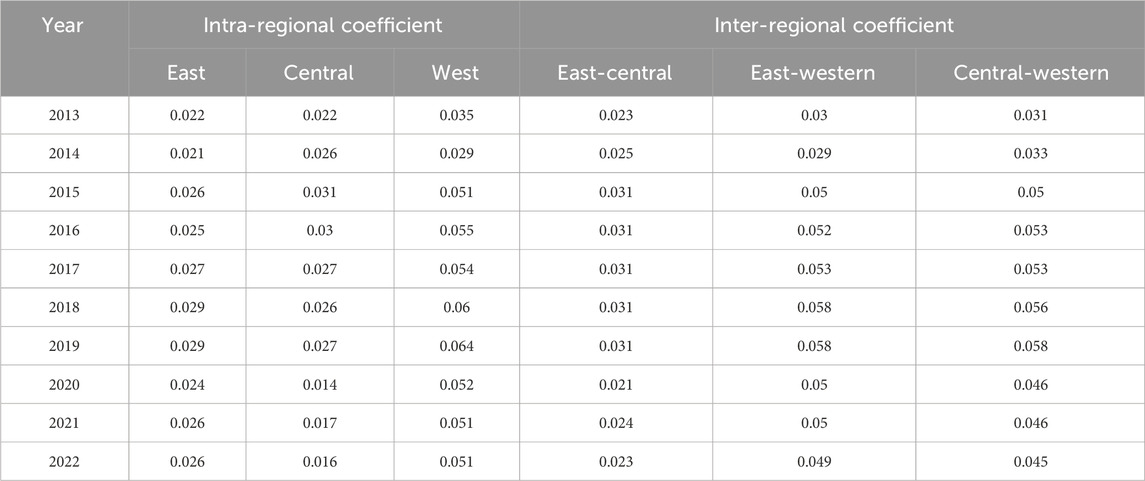
Table 7. Results of the Dagum Gini coefficient decomposition of differences.
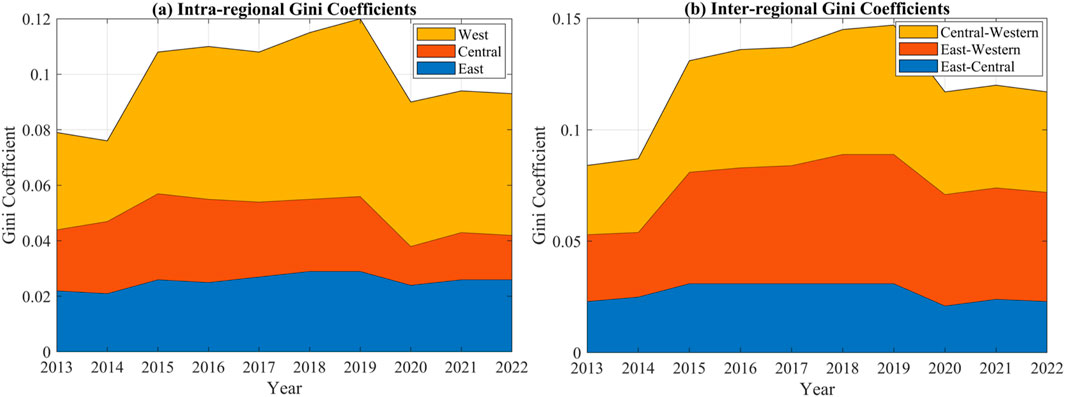
Figure 10. Dagum-Gini decomposition of regional disparities in the coupling-coordination degree between green finance and the ecological environment in 30 provinces (2013–2022): (a) intra-regional Gini coefficients (b) inter-regional Gini coefficients.
5.4 Analysis of the driving factors
To further identify key factors influencing the coupled and coordinated development between the ecological environment and green finance and to develop a precise and scientifically sound optimization strategy, this study, based on the previously established coupling coordination mechanism, analyzes five categories of influencing factors from the dual perspectives of market-driven effect and feedback regulation effect. The selected factors span multiple dimensions, as detailed in Table 8. In addition to the market-driven and feedback regulation effects, the regional institutional capacity, particularly local governments’ ability to enforce environmental regulations, also significantly influences the practical effectiveness of policies aimed at coupling and coordinated development. Differences in institutional capacities among regions can affect the translation of green finance and environmental policies into tangible ecological outcomes. Regions with higher institutional capabilities are typically more efficient in policy implementation, enforcement, and monitoring, thereby magnifying the positive impacts of green financial initiatives. Conversely, areas with weaker institutional frameworks may face barriers such as limited administrative resources, insufficient regulatory enforcement, and governance challenges, thus diminishing the efficacy of similar policy measures. To eliminate unit discrepancies and facilitate comparison of the impact magnitudes across various influencing factors, all explanatory variables were standardized using Z-score normalization.
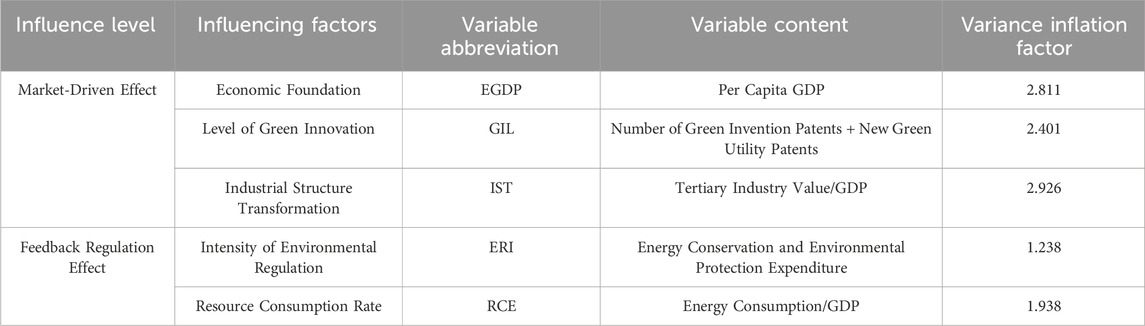
Table 8. The influencing factors and variable description of CCD.
To eliminate unit discrepancies and facilitate impact comparison across influencing factors, this study standardizes all explanatory variables using the Z-score method prior to incorporating them into a two-way fixed effects regression model. The results are presented in column (1) of Table 9. Directional analysis indicates that economic fundamentals, green innovation levels, industrial structure transformation, and environmental regulation intensity all passed the 1% significance level. These factors show a positive impact on the coupling coordination development between the ecological environment and green finance. However, the rate of resource consumption imposes a significant negative impact on the CCD. Green innovation exhibits the strongest positive impact on the coupling coordination level. To verify the reliability of the regression results, several robustness checks were performed, such as substituting explanatory variables, switching estimation models, and introducing a one-period lag of the explanatory variables. Specifically, GDP growth rate and per capita green invention patent applications were used as proxies for economic fundamentals and green innovation. Additionally, given that the dependent variable is a continuous but bounded variable, a Tobit model was employed to replace the original model for estimation (Brezigar-Masten et al., 2021). Lastly, considering the potential bidirectional causality, whereby improved coupling coordination may promote green technology innovation and economic development, a one-period lag of the explanatory variables was introduced to mitigate endogeneity (Bellemare et al., 2017). Columns (2) to (4) of Table 9 show that, aside from minor numerical differences in the coefficients, the significance levels and signs remain consistent with the original results, indicating the robustness of the model.
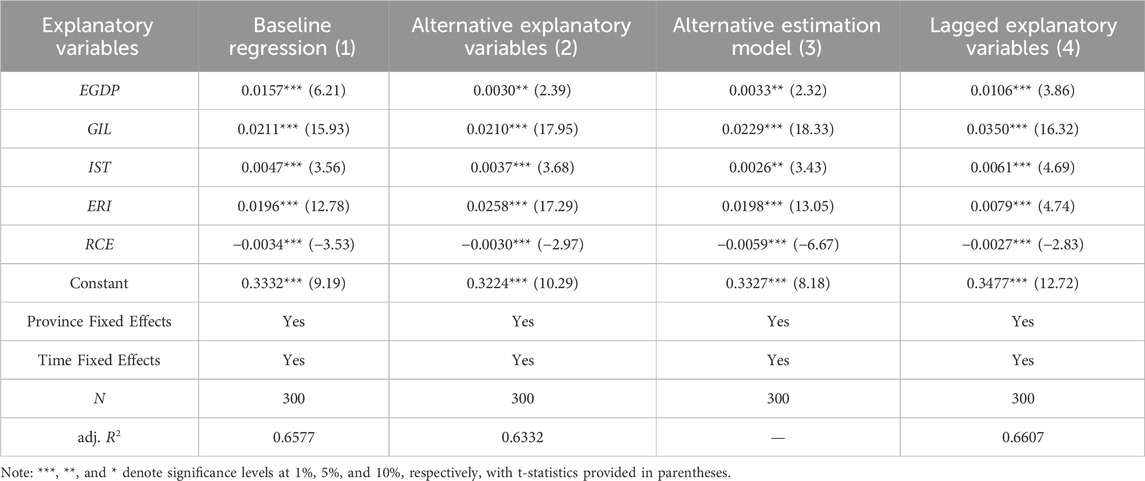
Table 9. Baseline regression and robustness test results.
The study divides the time period into two phases, with 2017 as the dividing point: the first phase covers 2013-2017, and the second phase spans 2018-2022. Separate regression analyses were conducted for each phase, with detailed results presented in columns (1) and (2) of Table 10. According to Table 10, in both phases, green innovation levels and environmental governance intensity consistently exhibit a significant positive impact. However, the impact of green innovation diminishes in the second phase, potentially due to diminishing marginal returns, while the effect of environmental governance intensity strengthens significantly, reflecting the growing effectiveness of government policies in recent years. The role of economic fundamentals remains relatively stable across the two phases, but its significance slightly decreases in the second phase, suggesting that as development progresses, the direct impact of economic fundamentals becomes more stabilized. Resource consumption exhibits a significant negative effect in both phases, with its suppressive impact becoming even more pronounced in the second phase. This indicates that, alongside economic and industrial development, resource consumption has increasingly become a critical obstacle to enhancing the coupling coordination level.
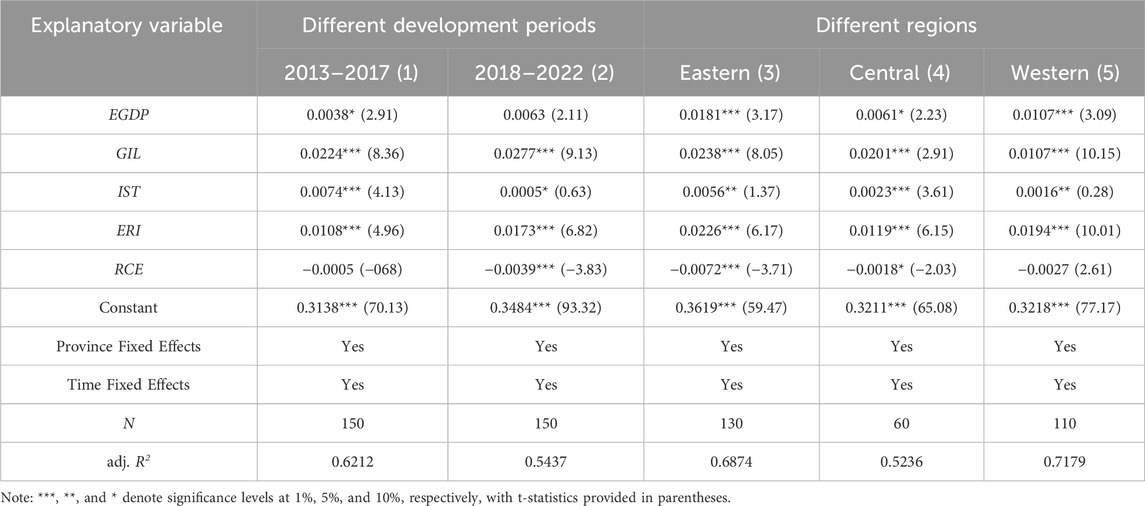
Table 10. Regression results of heterogeneity test.
To further investigate the heterogeneous effects across regions, this study conducts grouped regression analyses for the eastern, central, and western regions. The regression results indicate that the impact of various driving factors varies significantly among regions. Both green innovation and environmental governance intensity have a significant positive effect in all three regions, indicating that these factors are key drivers of coupling coordination between green finance and the ecological environment. Simultaneously, resource consumption has a significant negative impact across all regions, suggesting that excessive resource use universally constrains coupling coordination development. Therefore, reducing resource consumption and improving resource utilization efficiency are critical tasks for all regions. However, the specific impact magnitudes vary significantly among regions. The positive effect of green innovation is strongest in the eastern region, while its impact is weakest in the western region. This disparity can be attributed to the eastern region’s higher levels of green innovation technology and stronger innovation capacity. In contrast, the western region lacks sufficient innovation resources and technological reserves. The positive effect of economic fundamentals on coupling coordination is strongest in the eastern region but weaker in the central and western regions. This reflects the fact that the strong economic foundation in the eastern region more effectively supports green development processes, whereas lower economic development levels in the central and western regions still hinder their green development potential. Moreover, the positive impact of industrial structure upgrading is most prominent in the eastern region but nearly negligible in the western region. This is due to the western region’s relatively lower technological level and limited innovation capacity, coupled with a lack of scientific and technological resources, which impede the advancement of emerging and high-tech industries. Thus, the region faces greater challenges in industrial upgrading due to insufficient technological support.
Based on the panel Granger causality test (see Table 11) proposed by Dumitrescu and Hurlin (Dumitrescu and Hurlin, 2012), this study further clarifies the causal relationships among key drivers influencing the coupled coordinated development between green finance and ecological environment quality. Empirical results indicate that green innovation (GIL), economic development level (EGDP), environmental regulation intensity (ERI), resource consumption efficiency (RCE), and industrial structure transformation (IST) significantly affect CCD, indicating their predictive significance in driving coordinated development. Specifically, green innovation, economic development level, and industrial structure transformation exhibit significant positive effects on CCD, highlighting the essential role of market-oriented factors in facilitating coordinated development. Conversely, resource consumption efficiency displays a significant negative relationship with CCD, highlighting the importance of reducing resource consumption and improving resource efficiency to achieve coordinated development. Furthermore, the study identifies significant bidirectional Granger causality between CCD and both environmental regulation intensity (ERI) and green innovation (GIL). This finding suggests that the coordinated development between green finance and ecological environment quality is not only driven by environmental regulatory policies and green innovation activities but also reinforces the implementation of environmental regulations and stimulates further green innovation, forming a mutually beneficial feedback loop. Overall, these findings emphasize the reciprocal promotion between ecological environment improvement and green financial development, highlighting the synergy between policy-making and market-oriented innovation.

Table 11. Panel Granger causality test results between main variables.
6 Discussion
The interaction between green finance and the environment has received extensive attention in the existing literature. For instance, Li et al. (2022b), Liu et al. (2020), through analyses of green finance development across different provinces in China, found that green finance significantly promotes ecological environmental protection, particularly in the Eastern region, characterized by a strong coupling between green finance and environmental protection. Our findings align with these results, further validating the “high-high” agglomeration effect of green finance and ecological environment coupling coordination in the Eastern region. Furthermore, this study identifies a “low-low” lock-in effect in the Central and Western regions. This finding aligns with Shi (2022) regarding the spatial distribution characteristics of the coupling coordination between regional green finance and the regional ecological environment. Moreover, the results derived from Moran’s I analysis not only confirm the “high-high” clustering effect in eastern regions and the “low-low” lock-in effect in central and western regions but also highlight potential spatial dependencies. Ignoring these spatial dependencies could introduce biases into conventional regression or trend analyses. Thus, in exploring regional coupling coordination, this study employs Moran’s I to reveal overall spatial autocorrelation at a macro-level, complemented by a spatial Markov chain analysis to investigate cross-regional dynamic evolution mechanisms. This combined approach provides a more comprehensive understanding of inter-provincial interactions and path dependencies. Although similar regional imbalances and path dependencies have been observed in other large, regionally diversified economies (such as the United States and India), China’s “lock-in” effect exhibits distinctive institutional and historical characteristics. For instance, longstanding regional economic policies, resource endowments, and industrial specialization patterns in China have significantly widened the gaps in economic structure, technological capability, and financial investment between the eastern and central-western regions. When these gaps accumulate in green finance and ecological development, a more rigid path dependence characterized by “low-level investment—low improvement” emerges. In contrast, mature market economies such as the United States grant state and local governments greater autonomy in fiscal management and policymaking, allowing more flexible adjustments and interventions. However, in China’s context, regional financial and policy autonomy remains relatively constrained, causing a persistent low-level equilibrium characterized by a cycle of limited investment and marginal improvement once established (Feng et al., 2024). Consequently, central and western regions, once trapped in this low-level coupling state, face significant challenges in breaking free rapidly due to systemic constraints embedded within China’s hierarchical fiscal and policy framework. When these disparities accumulate within green finance development and ecological environment quality, a more rigid path dependence emerges, characterized by persistent low-level investment and marginal improvements. Furthermore, due to systemic constraints embedded within China’s hierarchical fiscal and policy framework, central and western regions face substantial barriers once trapped in such low-level equilibrium states. Unlike regions in Eastern China, which benefit from sustained policy support and abundant financial resources, these areas encounter considerable difficulties in rapidly transitioning out of a low-level coupling state. Consequently, central and western regions exhibit significant inertia in their coupled development between green finance and ecological environment quality, differentiating China’s regional developmental trajectories distinctly from other large economies. Differing from previous studies, this research optimizes the traditional CCD model, thereby improving both evaluation efficiency and accuracy. Moreover, by incorporating spatial Markov chain analysis and Gini coefficient decomposition, the study reveals a “Matthew Effect” in the coordinated development of green finance and the ecological environment across different regions. While Zhou et al. (2020) briefly touched upon this phenomenon, this study systematically investigates its dynamic evolution mechanism. It is noteworthy that spatial dependence manifests not only as similar or dissimilar coupling states across regions but also influences regional decisions on green financial investment and environmental governance through interactions with neighboring areas. Consequently, neglecting such spatial dependence could result in overestimating or underestimating the coupling degree in certain regions. In this study, we employ Moran’s I index to test the overall spatial correlation and further apply a spatial Markov chain approach incorporating spatial weights into the dynamic evolution analysis, thus controlling for potential spatial correlation bias.
Building on existing literature, this study systematically elaborates on the spatiotemporal dynamics and driving factors underlying the coupling coordination between green finance and the ecological environment. Notably, Wu (2023) observed that the coupling between green finance and the ecological development of China’s economy exhibits substantial regional heterogeneity, with drivers such as green innovation and environmental regulation intensity more pronounced in the Eastern region. This study extends this perspective using econometric models to demonstrate that the positive impact of green innovation on the CCD is most pronounced in the Eastern region, while its effect diminishes markedly in the Central and Western regions due to constrained resource allocation and weaker economic foundations. This regional disparity corroborates the findings of Zhang et al. (2021), who identified that the lag in green finance development in the Central and Western regions is a primary cause of low ecological governance effectiveness.
In addition, unlike prior research, which primarily focuses on overall coordination levels, this study incorporates multiple dimensions of driving factors—including green innovation, intensity of environmental governance, and resource consumption rate—into the coupling coordination model and validates their heterogeneous effects across different regions. This approach stands in sharp contrast to existing research, which often overlooks regional differences by focusing solely on aggregate coordination levels (Zhou et al., 2022). Our findings provide a theoretical basis for future studies to further investigate the mechanisms of regional heterogeneity. The driving factor analysis reveals that green innovation and environmental regulation have the most significant positive impacts on coupling coordination, whereas resource consumption serves as a major inhibitory factor. This finding aligns with the dual impact path theory proposed by Wang et al. (2022), which suggests that environmental regulation enhances corporate environmental standards, thereby reinforcing the role of green finance in resource allocation and risk management.
Although this study primarily focuses on China, the optimized CCD model demonstrates significantly enhanced computational robustness and flexibility, reducing its sensitivity to extreme data points. Therefore, the model holds substantial potential for broader application in other economies characterized by low green finance penetration and relatively lenient ecological policies. However, given significant international differences in institutional environments, financial market maturity, and ecological governance capacities, direct application of this model to other countries would necessitate localized adjustments in indicator selection, weight assignment, and temporal parameters. Despite possible limitations due to the policy-driven context inherent in conclusions drawn from the Chinese experience, the theoretical and methodological frameworks employed—coupling coordination analysis, dynamic spatial econometrics, and regional disparity assessment—still provide valuable methodological insights and practical references applicable to other emerging economies. Future research could further validate the applicability and generalizability of this model through comparative cross-country or cross-regional analyses, thus evaluating its practical value within diverse institutional contexts.
While this study concentrates on the spatiotemporal patterns of coupling coordination from 2013 to 2022, several evolving factors—including anticipated policy shifts, technological advancements, and intensifying climate crises—may substantially reshape these trends moving forward. First, from a policy perspective, China’s ambitious ‘dual carbon’ goals (achieving carbon peaking by 2030 and carbon neutrality by 2060) are expected to stimulate further policy innovations in green finance, environmental governance, and industrial restructuring. Such policy shifts could accelerate coupling coordination, particularly in underperforming regions, provided they are supported by targeted, regionally differentiated strategies and sufficient resource allocation. Second, technological advancements—such as breakthroughs in clean energy, digital finance innovations, and green technology applications—are likely to enhance significantly the efficacy and penetration of green finance initiatives. Regions capable of swiftly adopting and implementing these advancements could rapidly improve their coupling coordination. Conversely, regions slower to integrate emerging technologies may face widening disparities unless explicitly supported by national technology-transfer policies. Lastly, escalating impacts from the global climate crisis—including extreme weather events, resource scarcity, and environmental degradation—could either accelerate or hinder the development of coupling coordination. On one hand, increased ecological pressures may prompt stronger policy responses, heightened public awareness, and accelerated adoption of green finance instruments. On the other hand, acute climate shocks could disproportionately impact ecologically vulnerable and economically weaker regions, potentially exacerbating existing regional disparities and further complicating policy responses. Therefore, future coupling coordination trends will critically depend on governmental agility in policy adaptation, proactive deployment of technologies, and resilience-building strategies in response to climatic uncertainties. Policymakers should prioritize enhancing adaptive governance capacities, promoting widespread adoption of technological innovations, and implementing robust climate risk mitigation measures to ensure sustainable and equitable coupling development over the long term.
7 Conclusion
7.1 Research conclusions
Through optimizing the traditional CCD model and integrating multiple econometric methods—including the Dagum Gini coefficient, Moran’s I index, hierarchical clustering, Kernel Density Estimation (KDE), and the spatial Markov chain model—this study comprehensively reveals the spatiotemporal evolution patterns and regional disparities in the coupling coordination level between green finance and the ecological environment in China from 2013 to 2022. Additionally, by applying econometric models, the study investigates the influencing factors of coupling coordination and identifies their heterogeneous effects. The primary research findings are summarized as follows:
(1) Characteristics of temporal evolution: The CCD between green finance and the ecological environment in China shows an overall rightward shift, indicating a steady annual improvement in coordination levels. During the “14th Five-Year Plan” period, the number of provinces achieving medium-high coordination levels increased, while those at low coordination levels declined. The kernel density curve shifted from a “bimodal” to a “multimodal” shape, indicating increased differentiation in coordination levels across provinces, suggesting a trend toward multi-polarized development pathways. From an economic theoretical perspective, this evolutionary trend aligns well with the “internalization of externalities” theory in environmental economics. As the green finance mechanism matures, an increasing number of provinces can internalize environmental protection costs through financial instruments, thereby enhancing overall coordination levels;
(2) Significant regional disparities and clustering effects characterize the coupling coordination levels, following an overall pattern of “strong East, weak West.” The Eastern region demonstrates a “high-high” clustering effect, while the Central and Western regions show a “low-low” clustering pattern. Inter-regional disparities serve as the primary source of overall imbalances, whereas intra-regional disparities exert a relatively minor influence. Additionally, spatial Markov chain analysis uncovers a “Matthew effect” in the evolution of coupling coordination, whereby high-level regions further strengthen their advantages, while low-level regions face persistent lock-in effects. This Matthew effect corresponds closely with the “cumulative causation” theory in regional economics, which suggests that initial advantages in capital, technology, and human resources continuously amplify through factor agglomeration processes, enabling highly coordinated regions to maintain a stable leading position. Conversely, regions lacking sufficient resources or institutional support fall into path dependence, making it difficult to break free from the lock-in effect of a low-level equilibrium;
(3) Influencing factors: green innovation and environmental governance serve as key drivers of enhanced coupling coordination, with their impact being most pronounced in the eastern region. Conversely, resource consumption imposes a significant inhibitory effect on coordination levels, especially in the central and western regions. These findings suggest that reducing resource consumption and improving resource efficiency are crucial for overcoming the constraints on coupling coordination development in these regions.
7.2 Study limitations
This study has certain limitations in the analysis of spatial dependencies and heterogeneous influencing factors. First, although the use of Moran’s I index and the spatial Markov chain model reveals regional spatial clustering effects, it does not fully capture complex cross-regional interactions and multiple spatial effects, such as policy spillovers, industrial relocation, and environmental pollution diffusion. Future research could incorporate methods such as social network analysis to provide a more detailed characterization of inter-regional connection channels and diffusion mechanisms. This would not only enhance empirical analyses of regional green finance–ecological environment coupling but also offer clearer guidance for formulating inter-provincial or cross-regional collaborative governance policies. Additionally, advanced geographical models such as Geographically Weighted Regression (GWR) or Multi-scale Geographically Weighted Regression (MGWR) could be adopted in future studies to explore nuanced spatial patterns and spatial heterogeneity more comprehensively, thereby capturing region-specific variations in influencing factors and providing richer spatial insights. Second, while this study examines key influencing factors such as green innovation and environmental governance, the analysis of heterogeneous mechanisms across different provinces, industrial structures, and development stages remains insufficient. Future research could employ hierarchical regression and other methods to conduct more granular analyses at the regional and industrial levels, thereby providing a more comprehensive understanding of the influencing mechanisms and their varying characteristics under different conditions.
7.3 Suggestions
Based on the research findings, this study proposes the following policy recommendations to further enhance the coordination level between green finance and the ecological environment across China’s provinces:
(1) Develop region-specific green finance policies to promote balanced regional development: considering the significant disparities in coupling coordination levels across the eastern, central, and western regions, the government should implement strategies for green finance development tailored to each region to promote balanced regional growth. For the eastern region, the government should further leverage its “high-high” agglomeration effect to solidify its role as a pioneer in green finance. At the same time, policies should promote the orderly transfer of green finance resources to the central and western regions to drive green transformation and industrial upgrading in these areas. In the central and western regions, the government should increase support for green credit and green investment, actively guide high-tech enterprises to establish a presence, and optimize the traditional industrial structure to facilitate a transition from resource-dependent to low-carbon and efficient economic models. Additionally, the government should utilize policy support and regional cooperation to attract green technology and capital, thereby enhancing technological innovation capacity and green finance development in these regions, and gradually narrowing the inter-regional coupling coordination gap. Specifically, considering the identified “high-high” and “low-low” clustering effects, differentiated policies should be clearly formulated for each cluster. For the “high-high” clustering regions (Eastern provinces), policies should further encourage innovation in green financial instruments, such as green bonds and regional green development funds, while establishing demonstration zones for high-tech green industries and promoting knowledge-sharing mechanisms. For the “low-low” clustering regions (Central and Western provinces), targeted fiscal support and green finance incentives, including ecological compensation funds and preferential loans, should be intensified. Additionally, establishing cross-regional financial cooperation mechanisms, green technology transfer centers, and capacity-building initiatives for local governance can help these regions overcome existing developmental constraints and improve their coupling coordination levels effectively.
(2) Establish cross-regional green finance cooperation to address the “Matthew Effect”: given significant regional disparities and clustering effects, policymakers should implement explicit, actionable cross-regional collaboration mechanisms to enhance the coupling coordination between green finance and ecological environment across regions. Firstly, establishing joint green development funds co-financed by provincial governments, financial institutions, and enterprises from the economically developed Eastern regions in partnership with those from Central and Western regions would facilitate targeted investment in regional green projects and ecological initiatives. Secondly, policymakers should formalize technology transfer agreements, clearly outlining channels for transferring advanced green technologies and management practices from the Eastern to Central and Western provinces, supported by dedicated incentives such as subsidies or tax benefits. Lastly, creating cross-regional cooperation platforms that encourage partnerships among financial institutions, enterprises, and research institutions can foster the dissemination of successful green finance practices and promote mutual learning. These clearly defined collaborative mechanisms will effectively mitigate regional imbalances, foster resource and technology diffusion, and support balanced and sustainable ecological and financial development nationwide.
(3) Establish equity-oriented ecological compensation and regional assistance mechanisms: Given significant regional disparities highlighted in the analysis, the government should explicitly incorporate equity considerations into policy design. Policymakers can establish special ecological compensation and regional assistance mechanisms that directly channel resources from economically advanced, ecologically stable provinces to less developed regions facing ecological vulnerability and weaker institutional capacities. Such equity-oriented mechanisms not only provide essential financial and technical support for underperforming regions but also promote broader social justice and cohesive national development. Over the long run, these initiatives will help mitigate inter-regional disparities, ensuring that green finance contributes inclusively and equitably to China’s ecological and economic sustainability.
Data availability statement
The datasets presented in this study can be found in online repositories. The names of the repository/repositories and accession number(s) can be found below: CSMAR database: https://data.csmar.com/National Bureau of Statistics: https://www.stats.gov.cn/sj/ndsj/.
Author contributions
ZL: Conceptualization, Data curation, Formal Analysis, Methodology, Writing – original draft, Writing – review and editing. WX: Investigation, Resources, Software, Writing – review and editing. JW: Data curation, Methodology, Writing – review and editing. WC: Writing – review and editing. YZ: Investigation, Validation, Writing – review and editing.
Funding
The author(s) declare that financial support was received for the research and/or publication of this article. This study was financially supported by Humanity and Social Science Research Project of Anhui Educational Committee (2023AH051164 and 2023AH051512); This study was financially supported by Huainan Normal University School-Level Key Project on Quality Engineering Education and Teaching Reform (2023hsjyxm02, 2023hsjyxm08, and 2023hsjyxm18). This study was also financially supported by Huainan Normal University 2024 Key School-Level Scientific Research Project (2024XJZD005 and 2023XJZD018). This study was also financially supported by Research Project on Innovative Development of Social Sciences in Anhui Province (2023CX042).
Conflict of interest
The authors declare that the research was conducted in the absence of any commercial or financial relationships that could be construed as a potential conflict of interest.
Generative AI statement
The author(s) declare that Gen AI was used in the creation of this manuscript. Generative AI was used to assist with language translation and refinement as the authors are not native English speakers. Specifically, YouDao and DeepL were utilized for initial translation from Chinese to English and for polishing the language of the manuscript.
Publisher’s note
All claims expressed in this article are solely those of the authors and do not necessarily represent those of their affiliated organizations, or those of the publisher, the editors and the reviewers. Any product that may be evaluated in this article, or claim that may be made by its manufacturer, is not guaranteed or endorsed by the publisher.
References
Agrawal, R., Agrawal, S., Samadhiya, A., Kumar, A., Luthra, S., and Jain, V. (2024). Adoption of green finance and green innovation for achieving circularity: an exploratory review and future directions. Geosci. Front. 15 (4), 101669. doi:10.1016/j.gsf.2023.101669
Aslam, B., Zhang, G., Amjad, M. A., Guo, S., Guo, R., and Soomro, A. (2024). Towards sustainable initiatives: evidence from green finance mitigating ecological footprint in East Asia and Pacific nations. Energy and Environ., 0958305X241262937. doi:10.1177/0958305X241262937
Bai, Y., Wang, Q., and Yang, Y. (2022). From pollution control cooperation of lancang-mekong river to “two mountains theory”. Sustainability 14 (4), 2392. doi:10.3390/su14042392
Bao, J., and He, M. (2022). Does green credit promote green sustainable development in regional economies? empirical evidence from 280 cities in China. PLOS ONE 17 (11), e0277569. doi:10.1371/journal.pone.0277569
Bellemare, M. F., Masaki, T., and Pepinsky, T. B. (2017). Lagged explanatory variables and the estimation of causal effect. J. Polit. 79 (3), 949–963. doi:10.1086/690946
Brezigar-Masten, A., Masten, I., and Volk, M. (2021). Modeling credit risk with a Tobit model of days past due. J. Bank. and Finance 122, 105984. doi:10.1016/j.jbankfin.2020.105984
Bryhn, A., Kraufvelin, P., Bergström, U., Vretborn, M., and Bergström, L. (2020). A model for disentangling dependencies and impacts among human activities and marine ecosystem services. Environ. Manag. 65 (5), 575–586. doi:10.1007/s00267-020-01260-1
Chen, C., Zhong, S., Zhang, Y., and Bai, Y. (2023). The economic impact of green credit: from the perspective of industrial structure and green total factor productivity. Sustainability 15(2), 1224. doi:10.3390/su15021224
Chen, J., Li, Z., Dong, Y., Song, M., Shahbaz, M., and Xie, Q. (2020). Coupling coordination between carbon emissions and the eco-environment in China. J. Clean. Prod. 276, 123848. doi:10.1016/j.jclepro.2020.123848
Cheng, H., Zhu, L., and Meng, J. (2022). Fuzzy evaluation of the ecological security of land resources in mainland China based on the Pressure-State-Response framework. Sci. Total Environ. 804, 150053. doi:10.1016/j.scitotenv.2021.150053
Chin, M.-Y., Ong, S.-L., Ooi, D.B.-Y., and Puah, C.-H. (2024). The impact of green finance on environmental degradation in BRI region. Environ. Dev. Sustain. 26 (1), 303–318. doi:10.1007/s10668-022-02709-5
Deschryver, P., and de Mariz, F. (2020). What future for the green bond market? How can policymakers, companies, and investors unlock the potential of the green bond market? J. Risk Financial Manag. 13(3), 61. doi:10.3390/jrfm13030061
Dumitrescu, E.-I., and Hurlin, C. (2012). Testing for Granger non-causality in heterogeneous panels. Econ. Model. 29 (4), 1450–1460. doi:10.1016/j.econmod.2012.02.014
Evro, S., Oni, B. A., and Tomomewo, O. S. (2024). Global strategies for a low-carbon future: lessons from the US, China, and EU's pursuit of carbon neutrality. J. Clean. Prod. 461, 142635. doi:10.1016/j.jclepro.2024.142635
Farooq, F., Sajid, M., Faheem, M., and Khan, K. H. (2024). Evaluating the influence of green growth, foreign direct investment and financial development towards sustainable environment: evidence by green finance theory. Bull. Bus. Econ. (BBE) 13 (2), 44–52. doi:10.61506/01.00297
Feng, P., Yasar, M., and Rejesus, R. M. (2024). Innovation and regional economic convergence: evidence from China. Ann. Regional Sci. 72 (2), 535–559. doi:10.1007/s00168-023-01210-9
Feng, Y., Fanghui, Y., and Li, C. (2019). Improved entropy weighting model in water quality evaluation. Water Resour. Manag. 33 (6), 2049–2056. doi:10.1007/s11269-019-02227-6
Fu, C., Lu, L., and Pirabi, M. (2023). Advancing green finance: a review of sustainable development. Digital Econ. Sustain. Dev. 1 (1), 20. doi:10.1007/s44265-023-00020-3
Gao, D., Mo, X., Duan, K., and Li, Y. (2022). Can green credit policy promote firms’ green innovation? Evidence from China. Sustainability 14(7), 3911. doi:10.3390/su14073911
Gao, J., Wu, D., Xiao, Q., Randhawa, A., Liu, Q., and Zhang, T. (2023). Green finance, environmental pollution and high-quality economic development—a study based on China’s provincial panel data. Environ. Sci. Pollut. Res. 30 (11), 31954–31976. doi:10.1007/s11356-022-24428-0
Guo, Q., Su, Z., and Chiao, C. (2022). Carbon emissions trading policy, carbon finance, and carbon emissions reduction: evidence from a quasi-natural experiment in China. Econ. Change Restruct. 55 (3), 1445–1480. doi:10.1007/s10644-021-09353-5
Gupta, M., Kumar, P., and Ghai, S. (2024). “Impact of green finance on sustainability in India's commercial banks,” in Sustainable investments in green finance. Editors S. Taneja, P. Kumar, S. Grima, E. Ozen, and K. Sood (Hershey, PA, USA: IGI Global), 216–233.
Huang, H., and Zhang, J. (2021). Research on the environmental effect of green finance policy based on the analysis of pilot zones for green finance reform and innovations. Sustainability 13(7), 3754. doi:10.3390/su13073754
Kamalov, F. (2020). Kernel density estimation based sampling for imbalanced class distribution. Inf. Sci. 512, 1192–1201. doi:10.1016/j.ins.2019.10.017
Khan, D., Nouman, M., Popp, J., Khan, M. A., Ur Rehman, F., and Oláh, J. (2021). Link between technically derived energy efficiency and ecological footprint: empirical evidence from the ASEAN region. Energies 14 (13), 3923. doi:10.3390/en14133923
Khan, H. H. A., Ahmad, N., Yusof, N. M., and Chowdhury, M. A. M. (2024). Green finance and environmental sustainability: a systematic review and future research avenues. Environ. Sci. Pollut. Res. 31 (6), 9784–9794. doi:10.1007/s11356-023-31809-6
Khan, S., Akbar, A., Nasim, I., Hedvičáková, M., and Bashir, F. (2022). Green finance development and environmental sustainability: a panel data analysis. Front. Environ. Sci. 10. doi:10.3389/fenvs.2022.1039705
Li, C., Bao, Y., Li, Y., Yue, M., Wu, L., Mao, Y., et al. (2024). Assessment of the coupling coordination relationship between the green financial system and the sustainable development system across China. Sci. Rep. 14, 11534. doi:10.1038/s41598-024-62471-8
Li, C., Chen, Z., Wu, Y., Zuo, X., Jin, H., Xu, Y., et al. (2022a). Impact of green finance on China’s high-quality economic development, environmental pollution, and energy consumption. Front. Environ. Sci. 10. doi:10.3389/fenvs.2022.1032586
Li, S., Wang, G., Yang, L., Geng, J., and Zhu, J. (2022b). Analysis and prediction of the coupling and coordinated development of green finance–environmental protection in China. Sustainability 14 (15), 9777. doi:10.3390/su14159777
Liu, H., Zhu, Q., Muhammad Khoso, W., and Khalique Khoso, A. (2023a). Spatial pattern and the development of green finance trends in China. Renew. Energy 211, 370–378. doi:10.1016/j.renene.2023.05.014
Liu, N., Liu, C., Xia, Y., Ren, Y., and Liang, J. (2020). Examining the coordination between green finance and green economy aiming for sustainable development: a case study of China. Sustainability 12 (9), 3717. doi:10.3390/su12093717
Liu, Z., Zhang, X., Wang, J., Shen, L., and Tang, E. (2023b). Evaluation of coupling coordination development between digital economy and green finance: evidence from 30 provinces in China. PLOS ONE 18 (10), e0291936. doi:10.1371/journal.pone.0291936
Majumder, S., Roy, S., Bose, A., and Chowdhury, I. R. (2023). Multiscale GIS based-model to assess urban social vulnerability and associated risk: evidence from 146 urban centers of Eastern India. Sustain. Cities Soc. 96, 104692. doi:10.1016/j.scs.2023.104692
Majumder, S., Roy, S., Kayal, P., Bose, A., Barman, G., Basak, D., et al. (2024). Exploring spatial patterns and heterogeneity in rural household quality of living: insights from eastern India. Appl. Spatial Analysis Policy 18 (1), 13. doi:10.1007/s12061-024-09620-8
Migliorelli, M., and Dessertine, P. (2019). The rise of green finance in Europe. Opportunities and challenges for issuers, investors and marketplaces, 2. Cham: Palgrave Macmillan, 2019.
Nepal, R., Liu, Y., Wang, J., and Dong, K. (2024). How does green finance promote renewable energy technology innovation? A quasi-natural experiment perspective. Energy Econ. 134, 107576. doi:10.1016/j.eneco.2024.107576
Pan, Z., He, J., Liu, D., Wang, J., and Guo, X. (2021). Ecosystem health assessment based on ecological integrity and ecosystem services demand in the Middle Reaches of the Yangtze River Economic Belt, China. Sci. Total Environ. 774, 144837. doi:10.1016/j.scitotenv.2020.144837
Polzin, F., Egli, F., Steffen, B., and Schmidt, T. S. (2019). How do policies mobilize private finance for renewable energy? a systematic review with an investor perspective. Appl. Energy 236, 1249–1268. doi:10.1016/j.apenergy.2018.11.098
Qi, Y., Lian, X., Wang, H., Zhang, J., and Yang, R. (2020). Dynamic mechanism between human activities and ecosystem services: a case study of Qinghai lake watershed, China. Ecol. Indic. 117, 106528. doi:10.1016/j.ecolind.2020.106528
Roy, S., Bose, A., Basak, D., and Chowdhury, I. R. (2024a). Towards sustainable society: the sustainable livelihood security (SLS) approach for prioritizing development and understanding sustainability: an insight from West Bengal, India. Environ. Dev. Sustain. 26 (8), 20095–20126. doi:10.1007/s10668-023-03456-x
Roy, S., Bose, A., Majumder, S., Roy Chowdhury, I., Abdo, H. G., Almohamad, H., et al. (2022). Evaluating urban environment quality (UEQ) for Class-I Indian city: an integrated RS-GIS based exploratory spatial analysis. Geocarto Int. 38 (1), 2153932. doi:10.1080/10106049.2022.2153932
Roy, S., Bose, A., Singha, N., Basak, D., and Chowdhury, I. R. (2021). Urban waterlogging risk as an undervalued environmental challenge: an Integrated MCDA-GIS based modeling approach. Environ. Challenges 4, 100194. doi:10.1016/j.envc.2021.100194
Roy, S., Majumder, S., Bose, A., and Chowdhury, I. R. (2024b). GWPCA-based spatial analysis of urban vitality: a comparative assessment of three high-altitude Himalayan towns in India. J. Spatial Sci. 69 (2), 593–620. doi:10.1080/14498596.2023.2267011
Roy, S., Majumder, S., Bose, A., and Chowdhury, I. R. (2024c). The rich-poor divide: unravelling the spatial complexities and determinants of wealth inequality in India. Appl. Geogr. 166, 103267. doi:10.1016/j.apgeog.2024.103267
Roy, S., Majumder, S., Bose, A., and Chowdhury, I. R. (2024d). Spatial heterogeneity in the urban household living conditions: a-GIS-based spatial analysis. Ann. GIS 30 (1), 81–104. doi:10.1080/19475683.2024.2304194
Roy, S., Suranjan, M., Arghadeep, B., and Chowdhury, I. R. (2024e). GWPCA-based spatial analysis of urban vitality: a comparative assessment of three high-altitude Himalayan towns in India. J. Spatial Sci. 69(2), 593–620. doi:10.1080/14498596.2023.2267011
Shi, T. (2022). The spatiotemporal evolutionary trend and driving factors of the coupling coordinated development between regional green finance and ecological environment. Int. J. Environ. Res. Public Health 19 (10), 6211. doi:10.3390/ijerph19106211
Shi, Y., and Yang, B. (2024). The coupling and coordinated development of digital finance and green finance under the vision of “dual carbon” and the examination of carbon emission reduction effect. Sustain. Futur. 7, 100217. doi:10.1016/j.sftr.2024.100217
Svoboda, A. (2023). The role of financial services in the transition to a sustainable economy. J. Strategic Innovation Sustain. 18 (3). doi:10.33423/jsis.v18i3.6585
Tsoukala, A., and Tsiotas, G. (2021). Assessing green bond risk: an empirical investigation. Green Finance 3 (2), 222–252. doi:10.3934/GF.2021012
Umar, M., Ji, X., Kirikkaleli, D., Shahbaz, M., and Zhou, X. (2020). Environmental cost of natural resources utilization and economic growth: can China shift some burden through globalization for sustainable development? Sustain. Dev. 28 (6), 1678–1688. doi:10.1002/sd.2116
Viehs, M., Clark, G., and Feiner, A. (2014). From the stockholder to the stakeholder - how sustainability can drive financial outperformance. SSRN Electron. J. doi:10.2139/ssrn.2508281
Wang, S., W, K., L, R., and al, e. (2021). Research on misuses and modification of coupling coordination degree model in China. Ecol. Indic. (36), 793. doi:10.31497/zrzyxb.20210319
Wang, X., Elahi, E., and Khalid, Z. (2022). Do green finance policies foster environmental, social, and governance performance of corporate? Int. J. Environ. Res. Public Health 19 (22), 14920. doi:10.3390/ijerph192214920
Wu, G. (2023). Research on the spatial impact and coupling coordination of green finance on the ecological development of China’s economy. Econ. Change Restruct. 56 (5), 3353–3381. doi:10.1007/s10644-023-09504-w
Wu, T., Wen, L., and Yi, M. (2024). Balancing growth targets and environmental regulations: an empirical analysis of dual policy impact on corporate environmental responsibility–insights from China. J. Environ. Manag. 355, 120500. doi:10.1016/j.jenvman.2024.120500
Yang, Q., Ming, S., Zhang, R., and Yan, H. (2024). Green finance and corporate environmental investment: Scale Up or Efficiency up. PLOS ONE 19 (2), e0297456. doi:10.1371/journal.pone.0297456
Ye, T., Xiang, X., Ge, X., and Yang, K. (2022). Research on green finance and green development based eco-efficiency and spatial econometric analysis. Sustainability 14(5), 2825. doi:10.3390/su14052825
Yin, Y., Hussain, J., Gou, Q., and Wang, J. (2024). Green economic growth and environment: unveiling the role of environmental policy and cleaner energy in G-7 countries. Clean Technol. Environ. Policy 26, 4137–4156. doi:10.1007/s10098-024-02824-z
Zeng, Y., Wang, F., and Wu, J. (2022). The impact of green finance on urban haze pollution in China: a technological innovation perspective. Energies 15 (3), 801. doi:10.3390/en15030801
Zhang, J., Ding, X., Bao, L., and Zhang, Y. (2023a). Can the greening of financial markets Be transmitted to the real economy as desired in China? Systems 11 (3), 161. doi:10.3390/systems11030161
Zhang, L., Ma, X., Ock, Y.-S., and Qing, L. (2022). Research on regional differences and influencing factors of Chinese industrial green technology innovation efficiency based on dagum gini coefficient decomposition. Land 11 (1), 122. doi:10.3390/land11010122
Zhang, S., Wu, Z., Wang, Y., and Hao, Y. (2021a). Fostering green development with green finance: an empirical study on the environmental effect of green credit policy in China. J. Environ. Manag. 296, 113159. doi:10.1016/j.jenvman.2021.113159
Zhang, T., and Zhao, F. (2024). A study on the relationships among green finance, environmental pollution and economic development. Energy Strategy Rev. 51, 101290. doi:10.1016/j.esr.2023.101290
Zhang, W., Hong, M., Li, J., and Li, F. (2021b). An examination of green credit promoting carbon dioxide emissions reduction: a provincial panel analysis of China. Sustainability 13(13), 7148. doi:10.3390/su13137148
Zhang, Y., Fang, Z., and Xie, Z. (2023b). Study on the coupling coordination between ecological environment and high-quality economic development in urban agglomerations in the middle reaches of the yangtze river. Int. J. Environ. Res. Public Health 20(4), 3612. doi:10.3390/ijerph20043612
Zhong, Q., Ding, X., Sun, X., and Zhao, H. (2022). Green credit and market expansion strategy of high pollution enterprises—evidence from China. PLOS ONE 17 (12), e0279421. doi:10.1371/journal.pone.0279421
Zhou, H., and Xu, G. (2022). Research on the impact of green finance on China's regional ecological development based on system GMM model. Resour. Policy 75, 102454. doi:10.1016/j.resourpol.2021.102454
Zhou, T., Ding, R., Du, Y., Zhang, Y., Cheng, S., and Zhang, T. (2022). Study on the coupling coordination and spatial correlation effect of green finance and high-quality economic development—evidence from China. Sustainability 14 (6), 3137. doi:10.3390/su14063137
Keywords: green finance, ecological environment, coupling coordination degree, spatiotemporal evolution, regional disparities
Citation: Liu Z, Xiang W, Wang J, Chen W and Zhou Y (2025) Spatiotemporal patterns and regional disparities in the coupling and coordination between green finance and ecological environment in China. Front. Environ. Sci. 13:1508830. doi: 10.3389/fenvs.2025.1508830
Received: 10 October 2024; Accepted: 10 April 2025;
Published: 25 April 2025.
Edited by:
Michael Owusu Appiah, University of Cape Coast, GhanaReviewed by:
Subham Roy, University of North Bengal, IndiaSuranjan Majumder, University of North Bengal, India
Copyright © 2025 Liu, Xiang, Wang, Chen and Zhou. This is an open-access article distributed under the terms of the Creative Commons Attribution License (CC BY). The use, distribution or reproduction in other forums is permitted, provided the original author(s) and the copyright owner(s) are credited and that the original publication in this journal is cited, in accordance with accepted academic practice. No use, distribution or reproduction is permitted which does not comply with these terms.
*Correspondence: Wei Xiang, eGlhbmd3ZWkyN0AxMjYuY29t; Jingjing Wang, d2pqd2pqMTk4NUAxNjMuY29t