 Yi Du
Yi Du Xiaoyan Wang2*
 Tingting Li
 Yi Tang
- 1School of Emergency Management, Institute of Disaster Prevention, Sanhe, China
- 2College of Resources, Environment and Tourism, Capital Normal University, Beijing, China
- 3Hebei Key Laboratory of Resource and Environmental Disaster Mechanism and Risk Monitoring, Sanhe, China
- 4School of Environment and Resource, Xichang University, Xichang, Sichuan, China
This study investigated preferential flow infiltration patterns at three slope positions (upslope, mid-slope and downslope) of typical slopes in the Miyun Reservoir Basin. The evaluation was conducted by combining the multi-index evaluation method and the macropore flow classification method, based on the profile images obtained from dye tracer experiments. Multi-index analysis shows that preferential flow infiltration depth is 400 mm, and the average uniform infiltration depth is 56.6 mm. The preferential flow fraction quantified as the deviation from a perfectly homogeneous infiltration process on up, middle and down slopes are 56.6%, 74.8% and 67.5% respectively. Middle slope has higher preferential flow level due to higher weights of peak value, stained area and stable infiltration depth. Macropore flow classification results indicate at three slope positions, preferential flow is mainly macropore flow with mixed interaction with soil matrix. It is one of the five flow types and its proportion increases as elevation drops (79.31% on upper, 86.88% on middle and 95.31% on lower slope). With soil layer depth increasing, low-interaction macropore flow proportion rises and its interaction with matrix soil decreases. Correlation analysis reveals that macropore flow with low interaction negatively correlates with soil volumetric water content, porosity, but positively with soil bulk density. Macropore flow with high interaction positively correlates with soil volumetric water content. Matrix flow and fingering positively correlate with silt content. Matrix flow significantly positively correlates with soil saturated hydraulic conductivity. The difference between multi-index method and macropore flow classification lies in analysis scale. Since the calculation scale of the multi-index method encompasses the entire profile and treats the staining characteristics as a whole, it might result in an underestimation of preferential flow outcomes. On the other hand, the preferential flow classification method considering the interaction with soil matrix at pixel scale may lead to an overestimation of the calculated preferential flow results. Combining these two methods can help judge macropore flow characteristics and its interaction with soil matrix more accurately.
Highlights
Statistical methods are integrated with image processing to investigate the characteristics of preferential flow.
The vertical infiltration characteristics of the preferential flow were analyzed by stained path width.
The fraction of vertical preferential flow on the slope ranges between 56.6% and 74.8%, with variations observed at different slope positions.
1 Introduction
Soil preferential flow is a concept within the realm of soil hydrology. It refers to an inhomogeneous flow of water that infiltrates rapidly bypass the soil matrix (Beven and Germann, 1982). It is widely acknowledged and encompasses various types, such as macropore flow (which involves water moving through biopores, erosion cavities, cracks, or fissures), finger flow (characterized by non-uniform water movement driven by hydraulic instability or heterogeneity), and funnel flow (representing lateral flow along textural boundaries within the subsurface) (Allaire et al., 2009; Guo and Lin, 2018). Preferential flow exerts a significant influence on water loss, soil erosion as well as nutrient transport (Fuhrmann et al., 2019; Julich et al., 2017). Since the 1970s, preferential flow has garnered considerable attention, leading to a surge of studies delving into its mechanisms, the factors that influence it, and its implications for nutrient transport (Makowski et al., 2020; Simard et al., 2000; Toor et al., 2005) and hydrological response (Beven and Germann, 1982; Jarvis, 2007). Various scholars from diverse disciplines have offered their perspectives on the concept of preferential flow. Firstly, preferential flow is characterized by the rapid downward movement of water through macropores, bypassing the soil matrix (Beven and Germann, 1982). This concept narrowly attributes preferential flow to macropore flow. Second, based on the mechanism of soil water movement, Hendrickx and Flury (2001) proposed the concept of preferential flow relative to the equilibrium infiltration flow. The specific movement path bypasses some porous media and infiltrates downward, which also is a sign of the movement of soil water from homogeneous to heterogeneous areas. The third concept emerges from the perspective of scale quantification. Upon reviewing preferential flow quantification methods, it is proposed that preferential flow refers to flow mechanisms where transport of water together with dissolved or suspended matter is primarily associated with a smaller fraction of the total pore network, at any scale much larger than the microscopic (μm) scale (Allaire et al., 2009). The phenomenon consist of transmission in multiple pores. This perspective offers valuable insights into preferential flow by drawing comparisons from the vantage point of spatial network scale analysis. Currently, hydrologists widely acknowledge preferential flow as a distinctive soil water movement phenomenon where water or dissolved substances bypass the porous soil matrix, navigating through specific, spatially and temporally variable pathways within the soil (Demand et al., 2019; Guo and Lin, 2018).
Numerous investigations have consistently demonstrated that preferential flow is a ubiquitous phenomenon across diverse soils and landscapes, exhibiting notable heterogeneity across various spatial and temporal scales (Demand et al., 2019; Legout et al., 2009; Mälicke et al., 2019; Wiekenkamp et al., 2016). At present, research on preferential flow mainly focuses on field study to investigate the formation mechanism (Zhang et al., 2022; Ding et al., 2023; Chen et al., 2021; Cai et al., 2024; Hou et al., 2024) and modeling studies to explore influencing factors (Yi et al., 2023; Wang et al., 2017; Santra et al., 2021). Various factors are divided into two groups according to variability over time (Guo and Lin, 2018). One group is static factors that have little change with time, including soil properties, topography, and geological background and others (Wiekenkamp et al., 2016). The second group is dynamic factors which are greatly affected by changes over time, such as the chemical environment (Liu et al., 2021), land use and land cover (Demand et al., 2019), initial soil moisture conditions (Ding et al., 2023; Bogner et al., 2012), and input water characteristics (Wiekenkamp et al., 2016; Bogner et al., 2012), changes in the rhizosphere (Luo et al., 2018; Luo et al., 2019; Zhang et al., 2015), physical changes (e.g., freeze-thaw and wetting-drying processes) (Mao et al., 2024; Chen et al., 2024), biogenic factors (earthworks, burrowing animals) (Li et al., 2018), and others.
Researchers have conducted an in-depth exploration of the characteristics and influencing factors of preferential flow in a wide range of ecosystems, including semi-arid grasslands (Wu et al., 2022) and farmlands in the northern region (Zhang et al., 2022), vegetation cover in the Loess Plateau (Cai et al., 2024), karst rocky desertification areas (Ding et al., 2023; Bogner et al., 2012; Chen et al., 2024), tropical rainforest in the southwest (Chen et al., 2021), arid mountainous regions in the northwest (Xue et al., 2024), and the upper reaches of the Heihe River (Kang et al., 2022). Preferential flow within hillslopes plays a pivotal role in shaping the hydrological regime. Due to its open structure, which includes cracks and voids, soil particles can preferentially be carried into the drains, ultimately causing erosion (Øygarden et al., 1997). Soil conservation practices that treat surface runoff process alone may be ineffective if preferential flow is contributing (Wilson et al., 2008). Dai et al. (2020) pointed out that where preferential pathways were rich, that is, where hydrological connectivity was strong. “Hydrological connectivity” here refers to a characteristic that the soil pores, preferential flow channels (such as macropores formed by plant roots and other channels that allow water to flow rapidly), as well as the surrounding soil matrix and other elements related to water movement are interconnected and integrated with each other, enabling water to migrate in the soil relatively smoothly. Distinct from surface runoff, preferential flowpaths, can significantly increase the subsurface water flow and solute transport velocities and amounts in forested hillslopes (Laine-Kaulio et al., 2014; Jarvis, 2007; Anderson et al., 2009). Preferential flow in soils is widely acknowledged and encompasses various types, such as macropore flow, fingering flow, and funnel flow (Allaire et al., 2009; Guo and Lin, 2018). For macropore flow, it occurs through larger pores in the soil, such as those created by stones, roots, earthworms, or cracks. These macropores allow water to move more rapidly through the soil, bypassing the soil matrix in some cases (Beven and Germann, 1982). Regarding fingering flow, it is a form of unstable flow where water moves in finger - like patterns through the soil. This often happens when there are differences in soil properties, the water breaks into the subjacent layer through fingers (preferential flow paths) rather than uniformly through the entire layer (Liu et al., 2023; de Rooij, 2000; Rezanezhad et al., 2006). Funneled flow is an unique category of flow phenomena referring to the situation in which a capillary barrier develops above a coarse layer which underlies a relatively fine soil (Walter et al., 2000).
As the primary drinking water source for Beijing, supplying over 70% of the municipal demand, Miyun Reservoir is Beijing’s important water source and ecological conservation area. Mountainous areas account for over 80% of the Miyun reservoir Watershed. It faces significant soil-water challenges in its surrounding rocky mountainous areas. In the mountainous areas, the soil depth is around 20–60 cm, and in the soil there is a high proportion of gravel and the bottom part is mainly a gravel layer or mother rock. The well-developed fissures within the bedrock facilitate significant groundwater storage, serving as preferential flow pathways that respond promptly to precipitation events (Tian and Xu, 2024). Rainfall-driven application of pesticides and fertilizers facilitates the transport of nutrients and pollutants into subsurface systems or water bodies via preferential flow pathways. Given the critical role of Miyun Reservoir as a primary water source for Beijing, characterizing preferential flow dynamics in its upstream watershed is essential for developing effective water security strategies. Investigating the infiltration mechanisms of preferential flow and their interactions with soil properties enhances our understanding of hydrological processes governing the migration and distribution of water, nutrients, and contaminants in the ecosystem.
Dye tracer experiments, which facilitate the direct visualization of flow pathways within soils, have become a standard methodology for characterizing preferential flow phenomena (Widemann and Bogner, 2012). The image processing technique utilized in staining tracer experiments successfully emphasizes variations in the preferential flow pathways, however, it lacks the capability to quantitatively differentiate between the various types of preferential flow. Therefore, based on the analysis of the stain path and the width of the dyeing path, it is essential to further analyze the type and distribution of preferential flow (Bargués Tobella et al., 2014; Alaoui et al., 2011; Weiler and Naef, 2003). The objectives of this experimental investigation were as follows: (1) to quantitatively evaluate the preferential flow characteristics on a slope using image analysis and stained path width (SPW); (2) to uncover the characteristics of preferential flow at varying slope positions; and (3) to identify the influencing factors within a small watershed upstream of a drinking water reservoir. The findings of this study may provide valuable insights into the water quality, soil erosion and nutrient transportation.
2 Materials and methods
2.1 Study area
The Xitaizi Experimental Watershed (XEW) is situated in the mountainous northern region of Huairou District, Beijing, upstream of the Miyun Reservoir. It covers an area of 6.7 square kilometers and lies at an elevation ranging from 676 to 1,202 m above sea level. This region features a semi-humid continental climate with an annual average precipitation of 625 mm, predominantly occurring between May and September (Peng et al., 2016a; Zhao et al., 2019). The predominant soil type within the watershed is brown loam, ranging in thickness from absent to 1.5 m deep. Granite is the primary rock type found in this area. With a forest coverage rate of 98%, the watershed comprises 54.2% broad-leaved forest, 2.3% coniferous forest, 10.5% mixed coniferous and broad-leaved forest, and 33% shrubs (Zhao et al., 2019; Tie et al., 2018). The annual mean air temperature was 11.5°C from 2014 to 2023, with soils remaining frozen between late November and mid-March when the daily mean air temperature remained below 0°C (Cui et al., 2024). A typical hillslope in XEW was chosen as the study hillslope (named SH1, see Figure 1). The experimental site is a north-facing hillslope located at an elevation of 780–805 m above sea level, covered by a broad-leaf forest consisting of pure stands of Aspen. Based on actual measurements, the slope of the experimental terrain has an inclination of 38°. Dye tracer experiments were conducted at three sampling locations: downslope, mid-slope, and upslope.
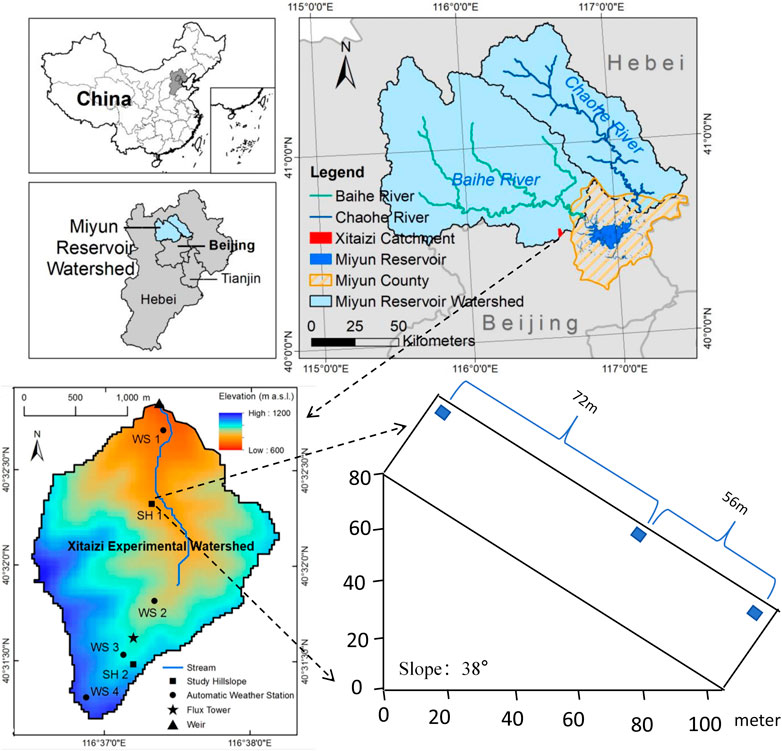
Figure 1. Location of the study area and schematic diagram of sampling points (Tie et al., 2018).
2.2 Dye tracer experiment
Dyes serve as valuable tracers for visualizing flow patterns and pathways within soil. On 27 October 2019, a dye tracer experiment was conducted at the downslope, mid-slope, and upslope locations, with five profiles established at each position. Prior to the experiment, litter from the surface layer was carefully removed to avoid any disruption to the surface layer structure. As shown in Figure 2, a 1 m2 square area surrounded by a self-made PVC board on the slope is used as an area to simulate rainfall. To mimic natural rainfall and eliminate any uneven distribution of the surface water head, a pressure-controlled sprayer was utilized. A 40-L dye tracer solution was crafted by dissolving 160 g of Brilliant Blue FCF powder in ordinary tap water, yielding a solution with a concentration of 4 g L−1 (Flury and Flühler, 1995; Alaoui et al., 2011; Guan et al., 2024) and was evenly sprayed on the test area at a height of 1 m for about 1 h. The spray flow was adjusted to ensure no water accumulation or confluence, serving as the benchmark for its control. Immediately after dye application, the upper layer of the test area was shielded with a waterproof plastic cover to prevent water evaporation. After 24 h, in order to check whether there is a parallel preferential flow along the slope, we dig a blank quadrate. The blank quadrate had the same size with the stained quadrate (1 m × 1 m),it is located downhill neighbor the stained quadrate. We assume that if a parallel flow is created, then this location will be the convergence region. If there is dyeing, it means that the parallel preferential flow happened along the slope, but we did not find any stained soil when digging 1 m depth of the blank quadrate. The vertical dyed profiles were excavated at intervals of 20 cm to a depth of 1 m, and five stained sections were excavated at each point as repeated controls. During the excavation process, boulders were handled with care; however, some were too large to be moved and were thus left in place. The excavated section was photographed using a Canon EOS 350D camera, with efforts made to minimize shadows caused by uneven lighting.
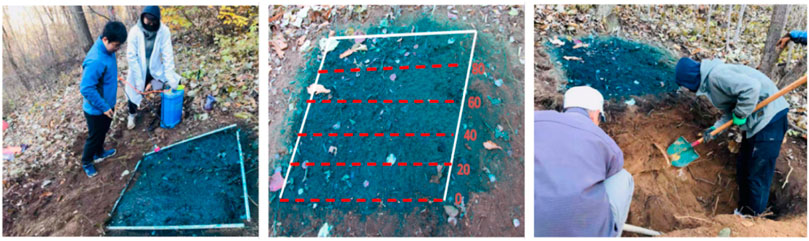
Figure 2. Field experiment of dye trace.
2.3 Site description
The length of the slope is about 130 m. The distance between the up slope and the mid-slope is about 72 m, and the distance between the mid-slope and the down slope is about 56 m. The corresponding contents have been added to the 2.1 study area. Table 1 presents the average values of soil properties, which were determined by taking three parallel soil samples 30 cm apart from each soil horizon at all three slope with the depth 0–10, 10–30, and 30–40 cm. Samples were collected using a 100-cubic-centimeter cylinder to determine bulk density and saturated hydraulic conductivity. For each soil depth, six parallel samples were prepared, with three used for measuring bulk density and three for measuring saturated hydraulic conductivity. Additionally, 500 g soil horizon samples were stored in PE self-sealing bags for soil texture analysis.
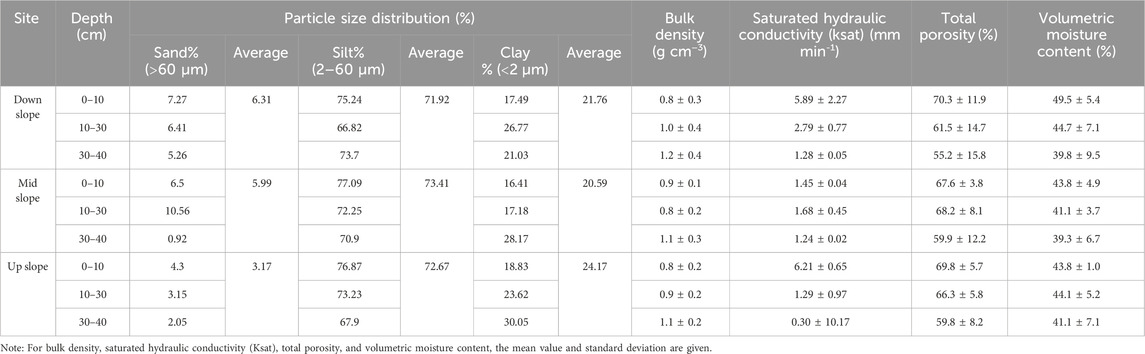
Table 1. Basic properties of soils at the slope sites.
After a 12-h drying in an oven at 105°C, soil bulk density was determined as the dry weight per unit volume of soil core. The soil particle size was analyzed in the laboratory utilizing the Microtrac S3500 (United States) laser particle size meter after sample dispersion treatment. The saturated hydraulic conductivity (Ksat) was measured through the constant head method. In the laboratory, a cutting ring is used to measure the amount of water that passes through a unit area per unit time under a unit water potential gradient. The soil volume moisture content was determined through a Spectrum TDR350 (United States) during excavation. Total porosity is derived from bulk density. Both were determined directly for each undisturbed sample after drying at 105°C for 24 h, assuming a particle density of 2.65 g cm3 (Alaoui, 2023; Benegas et al., 2014).
According to the international system of soil texture classification, the soil on this slope is characterized as silty loam, with a texture dominated by silt, comprising 66.82%–77.09% of its composition. The soil bulk density exhibits a range of 0.8–1.2 g cm−3. The saturated hydraulic conductivity ranges from 0.3 to 6.21 mm min−1. Total porosity ranges from 55.2% to 70.3% and volumetric moisture content ranges from 39.3% to 49.5%. As soil depth increased, soil bulk density showed an upward trend, whereas volumetric moisture content exhibited a downward trend.
2.4 The image processing
To determine an accurate measure of the stained areas, the processing of the dyed image is divided into four steps: geometric correction, white balance correction, color correction, and image denoising (Figure 3) (Forrer et al., 2000). In the first step, the image was corrected with DxO Optics Pro 11, the pixels of each profile image are 1,600 × 640 (1,000 mm × 400 mm). In the second step, the color was replaced with GIMP 2.10.14, replacing the dyed part with white and the undyed part with black. The Gaussian filter method is adopted for the process of Image Denoising in image processing. The mineral soil, organic soil, stones, roots, and stained areas were then manually identified in order to enhance the image truth of the analysis. In the third step, Matlab was used to convert the image into a TXT file of “0.255″through Raster Calculator and the Raster Converter Tool. Based on the TXT file, Excel were used to calculate the feature data of preferential flow path.
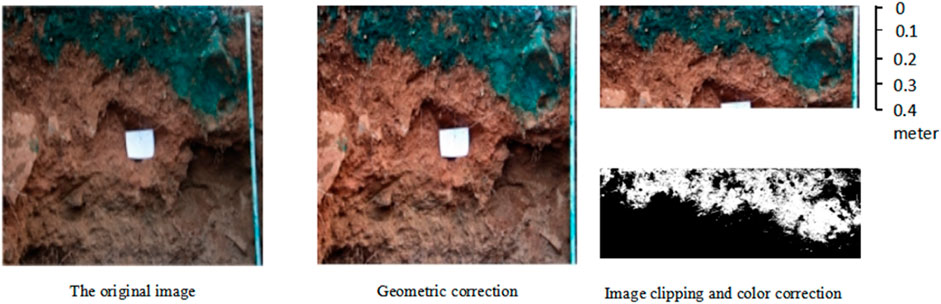
Figure 3. Image processing process.
The original dyed profiles of the three points are presented in Figure 4, where numerous roots and rocks can be observed in the stained areas of the profiles. Nimmo (2020) pointed out that macropore flow can be observed through simple observation. Its characteristic lies in continuity rather than the size of the aperture. As shown in Figure 4, stones and root systems can be observed with in the soil profile. To better characterize the distribution of stones, root systems, and macropores in soil profiles, we performed digital image processing using morphological operations (erosion and dilation) on binary images. After identifying the features of stones, roots, and macropores, we calculated the percentage of area they occupy in the soil layer.
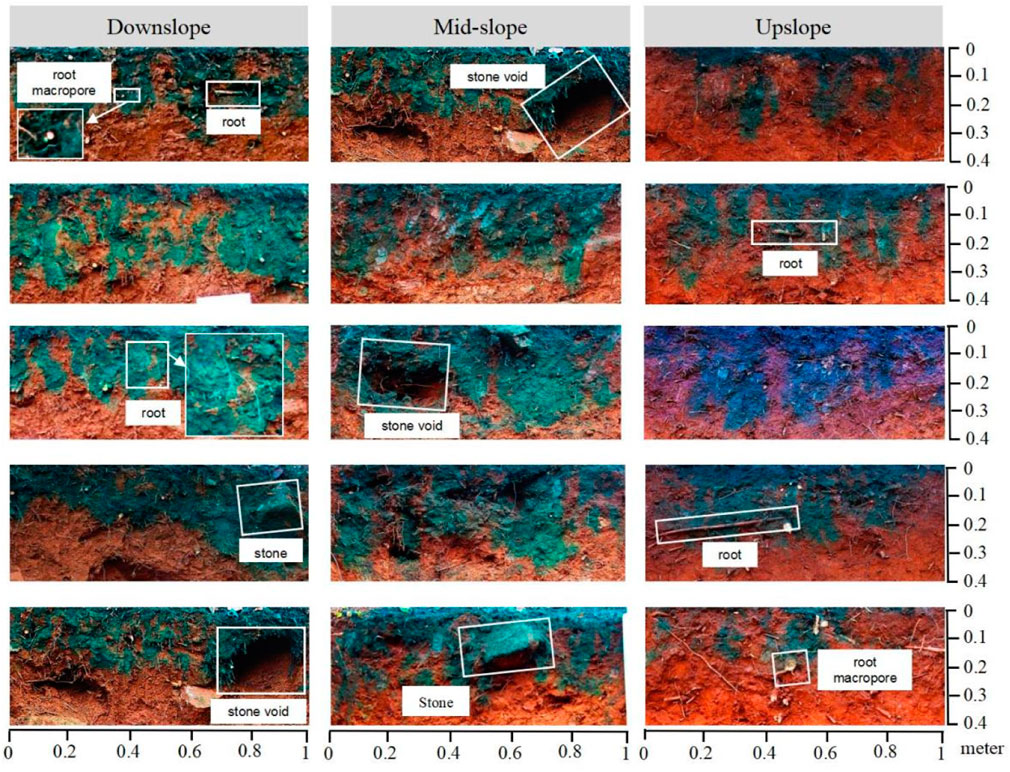
Figure 4. Profiles of three slope positions.
2.5 Characteristic indexes of preferential flow
To analyze the degree of preferential flow in soils, the dye coverage, total stained area, uniform infiltration depth, preferential flow fraction, coefficient of variation, length index, and peak index are commonly used as the indexes extracted from stained profiles (Bargués Tobella et al., 2014; Benegas et al., 2014; Zhang et al., 2017; Zhu et al., 2020). Five vertical profiles were excavated for each slope position. The parameters of each section are calculated as follows. The presented parameters are the average values of the five vertical soil profiles for each sampling location.
2.5.1 Dye coverage (DC)
It is calculated as the ratio of the dye-stained area to the sum of the dye-stained area and the non-stained area. Mathematically, this can be expressed as Equation 1 (Hendrickx and Flury, 2001).
Here, DC is the percentage of dye coverage, D signifies the area that has been stained by the dye, and ND represents the area that remains unstained. The DC depends on the maximum dyed depth that is 640 pixels.
2.5.2 Total stained area (TSA)
TSA defines as the sum of the cumulative areas of all dye units within a profile that is 100 cm wide and 40 cm deep (Cai et al., 2024).
2.5.3 Uniform infiltration depth (UID)
The uniform infiltration depth is where the stained area drops sharply below 80% and a clear infiltration front is visible. When the matrix’s infiltration capacity is not exceeded, macropore infiltration remains low. Therefore, matrix infiltration is key to triggering macropore flow (van Schaik, 2009).
2.5.4 Preferential flow fraction (PFF)
PFF is defined as the proportion of the total infiltration volume that specifically flows through preferential flow paths within the system or medium under consideration (Equation 2) (Benegas et al., 2014; van Schaik, 2009). This fraction quantifies the significance of preferential flow in the overall infiltration process.
where PFF is the preferential flow fraction (%), UID is the uniform infiltration depth (cm), which is multiplied by the width of the profile (100 cm).
2.5.5 Length index (LI)
LI refers to the cumulative measure of the absolute variations in dye coverage values as they vary with depth across a given profile (Equation 3). It represents the total deviation from uniformity or homogeneity in dye penetration along the depth profile. Stain patterns from soils where infiltration is dominated by preferential flow are more heterogeneous than those where uniform flow is predominant. Therefore, soils with a higher development of preferential flow tend to exhibit higher values of the length index (Bargués Tobella et al., 2014).
where LI is the length index; and i represents a given depth interval (or zone) in which dye coverage, same as the stained area (DC (%)) was calculated, and
2.5.6 Peak value (PV)
The number of times a vertical line based on total dye coverage (the maximum depth of staining is 640 pixel) intersects the dye coverage profile. This parameter reflects the heterogeneity of stained patterns; higher values suggest a greater degree of preferential flow (Bargués Tobella et al., 2014).
2.5.7 Coefficient of variation (CV)
CV is a measure of heterogeneity of the soil profile staining (Equation 4) (Zhang et al., 2017).
where
2.6 Multi-index evaluation of preferential flow
To accurately reflect the varying degrees of soil preferential flow across different slope positions and neutralize discrepancies among diverse indices, the range method was employed to standardize the preferential flow index, yielding a dimensionless value. This standardized value was then utilized to compute the mean square deviation for each index. Ultimately, the weight coefficients for each index were assigned through the mean square error decision-making approach (Zhang et al., 2017). The weights are calculated for seven indicators on three slopes, each indicator is calculated through 15 profiles, so i is the number of copies of the indicator (1–15) when standardizing, and j is the serial number (1–7) of the given indicator.
Utilizing the standardized values and respective weight coefficients, an evaluation index for preferential flow is derived. This integrated result encapsulates the contributions of all indices, effectively mirroring the extent of preferential flow development within the soil. A higher value signifies a high degree of preferential flow development.
Index normalization (Equation 5):
where
The mean of the normalized index
Mean square deviation of each index
Calculate the weight coefficient of each index
Preferential flow evaluation index
2.7 Classification of preferential flow
According to the SPW profiles, preferential flows were categorized into five distinct types, each representing a unique pattern of water movement within the soil. Five distinct vertical water transport patterns were characterized by specific soil properties and SPW distributions (Weiler and Flühler, 2004).
(1) Macropore flow with low interaction, occurring in low-permeability or saturated soil matrices, exhibits greater than 50% SPW in sub-20 mm zones and less than 20% SPW in zones exceeding 200 mm, indicative of limited pore-matrix connectivity.
(2) Macropore flow with mixed interaction (combining high and low interactions), observed in heterogeneous soils or variable macropore networks, demonstrates 20%–50% SPW in sub-20 mm zones while maintaining less than 20% SPW above 200 mm, reflecting transitional flow dynamics.
(3) Macropore flow with high interaction in permeable soil matrices (textured or aggregated) shows less than 20% SPW in sub-20 mm zones and under 30% SPW beyond 200 mm, consistent with strong hydraulic exchanges between macropores and the matrix.
(4) Heterogeneous matrix flow and fingering, driven by spatial variability in texture/aggregation, water repellency, or flow instability, retains less than 20% SPW in sub-20 mm zones but displays 30%–60% SPW in zones surpassing 200 mm, suggesting preferential flow pathway formation.
(5) Homogeneous matrix flow in permeable soils exhibits less than 20% SPW in sub-20 mm zones and over 60% SPW in zones greater than 200 mm, aligning with classical Darcian flow behavior. These patterns quantitatively link soil structural heterogeneity to transport mechanisms through systematic SPW signature analysis.
Three of them are related to macropore flow, including macropore flow and surrounding soil matrix with low interaction, mixed interaction, and high interaction; and two of them involve matrix flow, including heterogeneous matrix flow and fingering and homogeneous matrix flow. Interaction is defined as vertical water flow from preferential into the surrounding soil matrix.
2.8 Statistical analysis
2.8.1 Multiple comparison method
A statistical technique used to compare the mean values of multiple indicators simultaneously. Its aim is to identify significant differences among the mean values of indicators from different slope positions through a series of statistical tests, thereby providing a more precise understanding of the variations and relationships among slope positions.
2.8.2 Correlation analysis
A statistical method that assesses whether two variables change in the same direction (positive correlation) or opposite directions (negative correlation). The closer the correlation coefficient value is to 1 or −1, the stronger the relationship between the variables; whereas, a value closer to 0 indicates a weaker correlation. The Pearson correlation analysis assume that the variables follow a normal distribution. We performed tests for normality with the Shapiro - Wilk (Small - data samples generally refer to those with a sample size of less than 5,000) test on our data. If the data does not pass the normality test, appropriate methods were selected to transform the data so that it conforms to the normal distribution, and then perform Pearson correlation analysis.
3 Results
3.1 Analysis of preferential flow stained images
The qualitative visual analysis of flow patterns was conducted based on the binary images produced. The infiltration patterns are assessed semiquantitatively by analyzing the dye coverage distributions (Flury and Flühler, 1995). This involves counting the number of stained pathways that contribute to preferential flow, which provides a quantifiable measure of the extent and nature of preferential flow within the system. Figure 5 reveals that the soil preferential flow dye depth is similar at three locations on the slope. A distinct and pronounced staining of the upper soil layer was consistently observed across all positions. The dye depth is about 400 mm and the dye area decreases with the depth. At the upslope and mid-slope locations, with the increase of the depth, the dye area shows a trend of first decreasing, then keeping stable, and finally decreasing. The stabilization stage is between 150 and 250 mm. While, at the downslope location, the overall trend of the dye area is first decreasing, then increasing, and finally decreasing. The increasing stage was found between 100 and 125 mm. In stained profiles from 0 to 400 mm, upslope has higher dye coverage, i.e., total stain area is 1,962.1 cm2, accounting for 49%, where mid-slope and downslope have lower dye coverage, total stain areas are 1,879.7 and 1,917.4 cm2, accounting for 47% and 48%, respectively. But overall the differences in the total stain areas are not substantial.
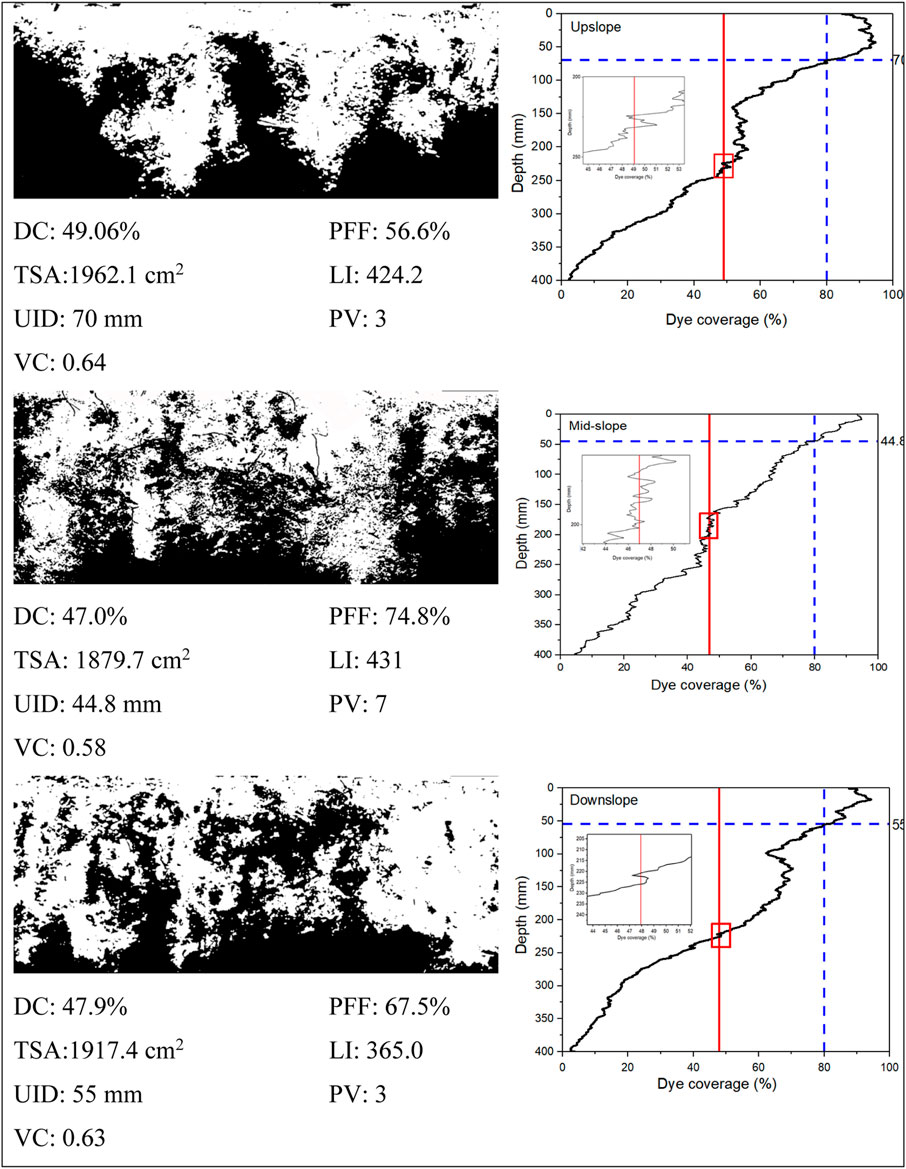
Figure 5. Images of examples vertical stained profiles and preferential flow parameters (White: stained area; black: unstained area; the blue line is the soil depth corresponding to DC = 80% (UID); the red line is the profile DC; the peak value can be seen in the red rectangle, and the details are shown to the left of the red rectangle).
Uniform infiltration depths are highest on upslope reaching to 70 mm and relatively lower at mid-slope and downslope, reaching 44.8 and 55 mm, respectively. So the average infiltration depth is 56.6 mm. High uniform infiltration depth indicates that there is a high matrix flow upslope. Accordingly, the result of the preferential flow fraction (PFF) is opposite to that of the uniform infiltration depth. The PFF is lowest at upslope accounting for 56.6%, while mid-slope and downslope have a relatively higher PFF, accounting for 74.8% and 67.5%, respectively. The elevated length index and peak value signify a considerable degree of preferential flow development. At mid-slope, the LI and PV are 431 and 7, respectively, indicating that the preferential flow development is more pronounced in the mid-slope region compared to the upslope and downslope areas. This is consistent with the PFF result at mid-slope.
Spatial variations in macropore flow potential across slope positions were linked to soil structural and hydraulic properties (Tables 1, 2). The mid-slope exhibited the highest potential for macropore-dominated flow, driven by its elevated stone content (17.01% in 0–10 cm) and silt-dominated matrix (73.41% silt), which promoted preferential pathways through inter-stone voids despite low matrix hydraulic conductivity (Ksat: 1.45 ± 0.04 mm min−1). The downslope showed intermediate potential, with higher sand content (6.31% sand) and Ksat (5.89 ± 2.27 mm min−1) supporting moderate macropore connectivity, yet compaction (bulk density: 1.0 ± 0.4 g cm−3 at 10–30 cm) likely restricted lateral flow continuity. In contrast, the upslope, despite the highest root density (12.68%) and macropore abundance (9.10%), prioritized vertical infiltration due to elevated Ksat (6.21 ± 0.65 mm min−1) and clay-enriched texture (24.17% clay), which enhanced water retention (volumetric moisture: 43.8% ± 1.0%) but limited lateral macropore activation. Vertical heterogeneity was evident across all positions, with macropore-related parameters (e.g., Ksat, roots) declining sharply below 10 cm depth.
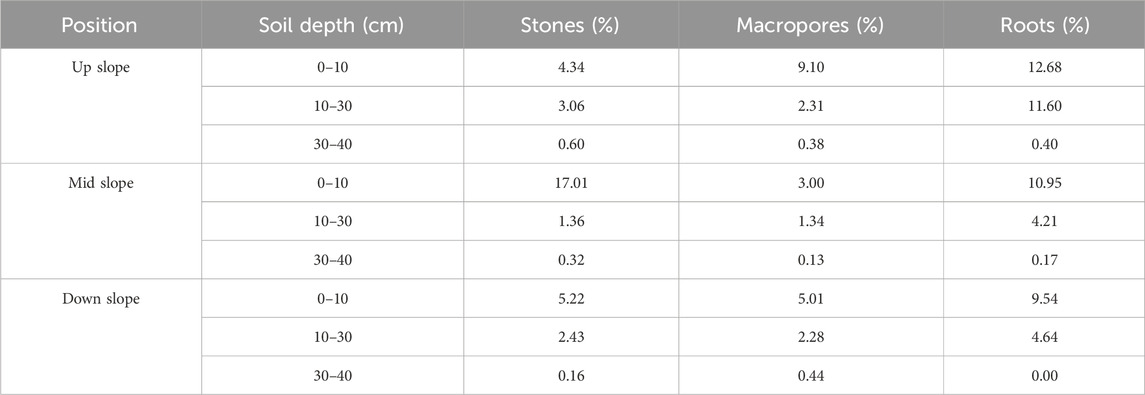
Table 2. Distribution of rocks, roots and large holes in soil layer.
3.2 Multi-indicator evaluation
The PFF and UID represent preferential flow and matrix flow, respectively. LI and PV indicate the heterogeneity of the flow pattern. Compared to the other slope positions, at mid-slope, high preferential flow fraction (PFF = 74.8%), low uniform infiltration depth (UID = 44.8 mm), high length index (LI = 431), and high peak value (PV = 7) are present. Figure 6 shows that uniform infiltration depth and preferential flow fraction have significant differences at mid-slope and upslope while downslope has no significant difference with the other two sites. The uniform infiltration depth upslope has the highest value and variation indicating that matrix flow is relatively well developed, but high variability indicates developmental instability, and preferential flow at mid-slope is well developed and stable. At the mid-slope, the preferential flow fraction exhibits significant differences compared to the upslope, whereas no significant differences are observed when compared to the downslope.
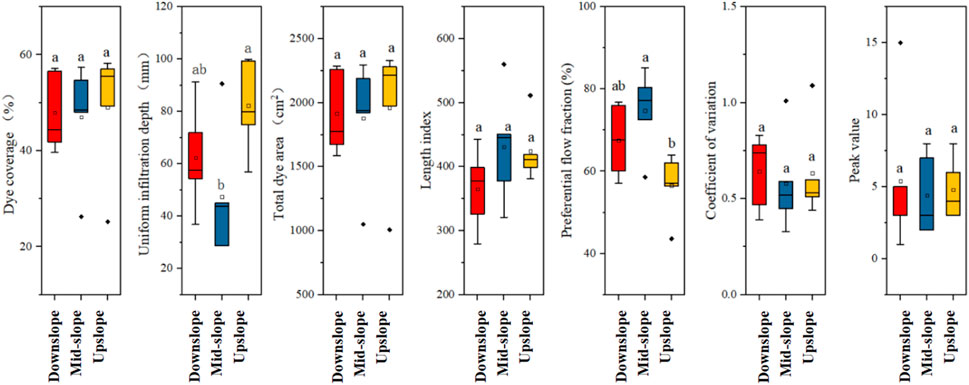
Figure 6. Boxplots of preferential flow parameters at each sampling position. Note: Within each indicator, if the boxes are labeled with different letters, it indicates that there are significant differences among slope positions; otherwise, there are no significant differences. The calculation of each slope position’s indicator is derived from the analysis of five profiles.
To calculate the weight of each indicator, we calculated the preferential flow indicator for 15 profiles at three locations according to Section 2.6. The calculation results of the standardized mean value, mean square deviation and weight coefficient of each indicator are listed in Table 3. It is evident that the weight of the uniform infiltration depth (0.16) and peak value (0.18) is higher when evaluating the development degree of the preferential flow, indicating that these two indicators play an important role in the evaluation of preferential flow. However, the distribution of the parameter weight coefficient is relatively uniform, and there is no decisive factor for excessive weight, which is related to the large variation of the distribution characteristics of preferential flow.
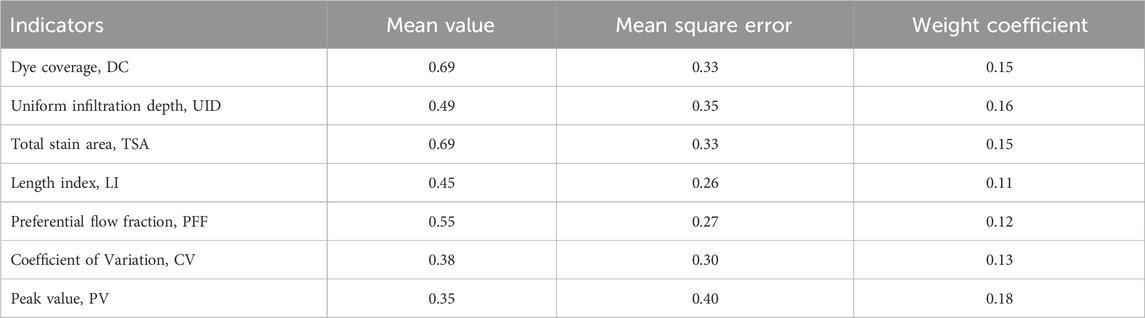
Table 3. The standardized mean value, mean square error, and weight coefficient of each index.
There are five soil profiles at each slope position. The preferential flow evaluation index at different slope positions was calculated according to the normalized value and weight coefficient of each index. As can be seen from Table 4, the evaluation index of preferential flow at upslope is between 0.23 and 0.62, with a mean value of 0.48 and standard deviation of 0.14. At mid-slope, the evaluation index of the preferential flow was between 0.41 and 0.73, with a mean value of 0.61 and a standard deviation of 0.10. The evaluation index of preferential flow at downslope ranged from 0.36 to 0.54, with an average value of 0.33 and a standard deviation of 0.16. Thus, it could be concluded that the preferential flow developed best at mid-slope followed by downslope. The development degree of preferential flow at upslope was the lowest.
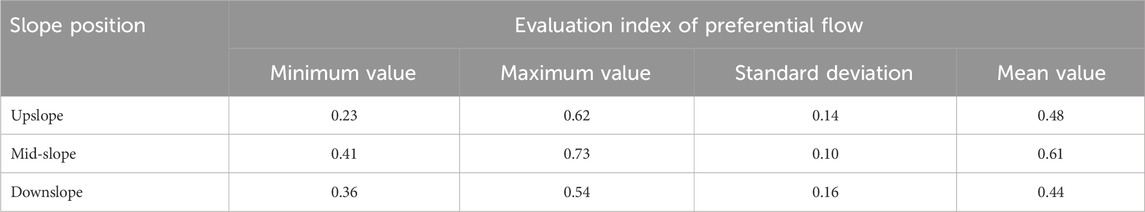
Table 4. The preferential flow evaluation index at three slope positions.
3.3 Classification of preferential flow
As we defined in Section 2.4, the preferential flow in this study is mainly macropore flow. According to Weiler and Flühler (2004), the SPW profile for each experiment is constructed by integrating all the vertical dye patterns obtained within that specific experiment. What is striking in Figure 7 is that the stain widths of the three experimental locations showed heterogeneity with the change of depth. With the increase of depth, the proportion of dye width less than 20 mm gradually increases, while the proportion of dye width greater than 200 mm tends to decrease. The proportion of dye width from 20 to 200 mm first increases and then decreases. The macropore flow width can be categorized into three distinct sections based on depth, with dividing points occurring at 100 and 275 mm (horizontal lines in Figure 7), respectively. In the depth ranges of 0–100 mm, the SPW greater than 200 mm has a certain advantage, but the advantage downslope is lower. In the range of 100–275 mm, the macropore flow with width of 20–200 mm is absolutely dominant. When the soil depth is greater than 275 mm the dye width mainly is less than 20 mm and macropore flow with a width greater than 200 mm seldom occurs.
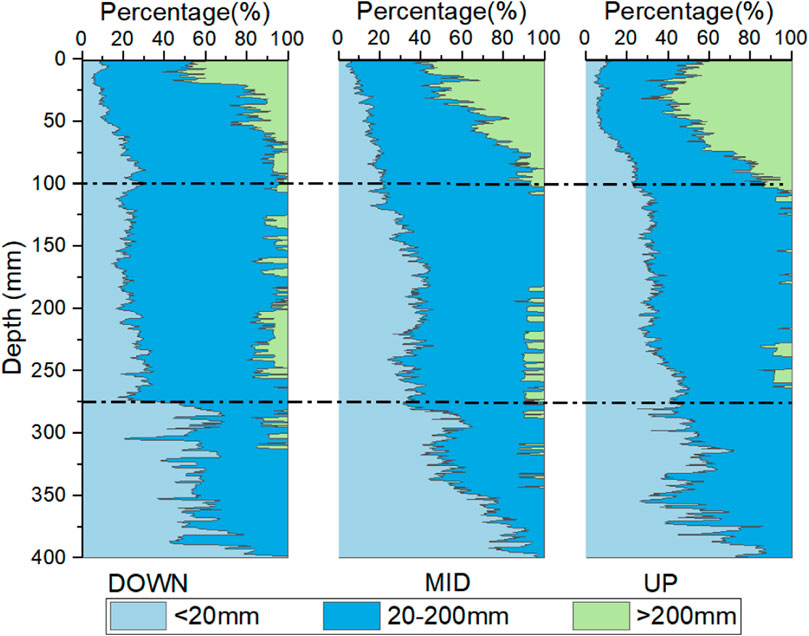
Figure 7. The distribution of soil stain width with depth (Weiler and Flühler, 2004).
Both matrix flow and macropore flow were observed at the three sampling locations (downslope, mid-slope, and upslope). Matrix flow, when present, occurred in the top 50 mm of the soil profile and no matrix flow was observed below this in either soil texture. Figure 8a shows that the macropore flow changes from matrix flow to macropore flow with the increase of depth, and the interaction between macropores and surrounding soil matrix decreases gradually indicating the degree of macropores increased. The three slope positions at 0–100 mm depth are mainly homogeneous matrix flow and finger flow. Macropore flow with mixed interaction (both high and low) is dominant at depths ranging from 100–275 mm, while macropore flow with mixed interaction primarily occurs between depths of 275–400 mm. As the depth increases, the types of macropore flow become more dispersed, particularly at the downslope location. The macropore flow regime transitions sequentially from mixed-interaction to high-interaction dominance, followed by a gradual shift toward low-interaction dynamics. At mid-slope and upslope, vertical macropore flow with mixed interaction is relatively homogeneously distributed.
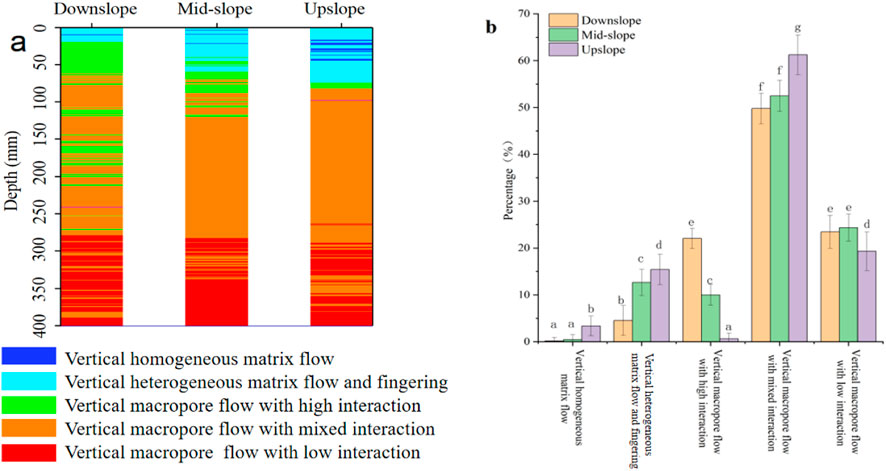
Figure 8. Macropore flow types at different slope locations. Note: (a) represents the change of macropore flow type with depth, and (b) represents the percentage of each macropore flow type at different positions. There is a significant difference between bar charts containing different lowercase letters.
Figure 8b shows vertical macropore flow especially with mixed interaction dominates the macropore flow on the slope and matrix flow is less prevalent. The total percentage of matrix flow at three slope position increases with the increase of elevation, accordingly accounting for 4.7, 13.2, and 18.8%, respectively. Accordingly, macropore flow accounts for 95.3, 86.8, and 81.2% when moving up the slope. As elevation increases, the proportion of vertical macropore flow characterized by high interaction with surrounding soil matrix decreases, with 22.1% observed at the downslope location and a negligible amount (0.6%) found at the upslope location. The proportion of vertical macropore flow featuring mixed interaction exhibits an upward trend with increasing elevation, comprising 49.8% at the downslope location, 52.5% at the mid-slope, and peaking at 61.3% at the upslope position.
Table 5 displayed the percentages of the five flow types within the soil layers. As depicted in Figure 8a, the vertical macropore flow with low interaction predominantly took place in the deep soil layer (ranging from 30 to 40 cm). Specifically, it accounted for 16.88%, 20.16%, and 18.59% at the down slope, mid slope, and up slope respectively. The vertical macropore flow with mixed interaction (both high and low) mainly occurred in the middle part of the stained soil layer (from 10 to 30 cm). At the down slope, mid slope, and up slope, its proportions were 48.13%, 44.22%, and 35% respectively. Elevational gradients positively correlate with both the progressive deepening of infiltration depths and the proportional increase of high-interaction macropore flow. On the contrary, the proportion of the matrix flow experiences a continuous decline. Matrix flow only occurred in topsoil (0–10 cm).
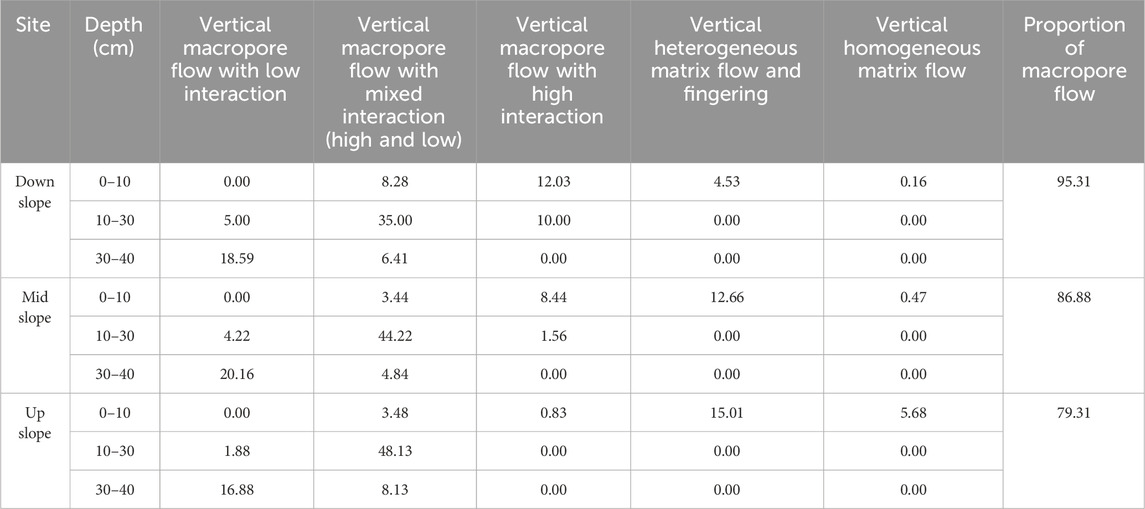
Table 5. The percentage of the five flow types for the soil layers (%).
As can be seen from Table 5, excluding the vertical heterogeneous matrix flow and fingering and vertical homogeneous matrix flow, the proportions of preferential flow related to macropores are 79.31%, 86.88%, and 95.31%, respectively, as the altitude decreases. Correspondingly, the percentages of preferential flow obtained by the multi-index evaluation method are 56.6%, 74.8%, and 67.5% (Figure 4), respectively. Both methods indicate that the upslope position has less pronounced preferential flow characteristics compared to the other positions.
3.4 The potential relationship between macropore flow types and soil properties
Based on the depth of soil property sample collection (0–10, 10–30, 30–40 cm), we have categorized and quantified the various types of macropore flow observed within distinct soil horizons. A Pearson correlation analysis (presented in Table 6) was conducted to investigate the association between the proportion of these macropore flow types and the soil properties. There’s a positive correlation between volumetric water content of the soil and vertical macropore flow with high interaction, while a negative one with low interaction. Higher high-interaction proportion means more matrix flow and higher moisture content; higher low-interaction proportion leads to more macropore flow but lower moisture content. The greater the soil bulk density, the smaller the porosity, and the greater the degree of soil compaction, which restricts water infiltration through the soil matrix (Karahan and Erşahin, 2017; Luo et al., 2020). In this case, once macropores (such as roots, stones, etc.) exist in the soil, these macropores will be relatively stable. When water flows through, the interaction with the surrounding soil is relatively small, resulting in a relatively high proportion of macropore flow with low interaction. Saturated hydraulic conductivity (Ksat) has a significant positive correlation with homogeneous matrix flow. High Ksat promotes matrix flow as large pores mainly handle water transport under saturation, causing uniform downward water movement. The silt content in the soil significantly affects the formation of heterogeneous matrix flow and fingering.
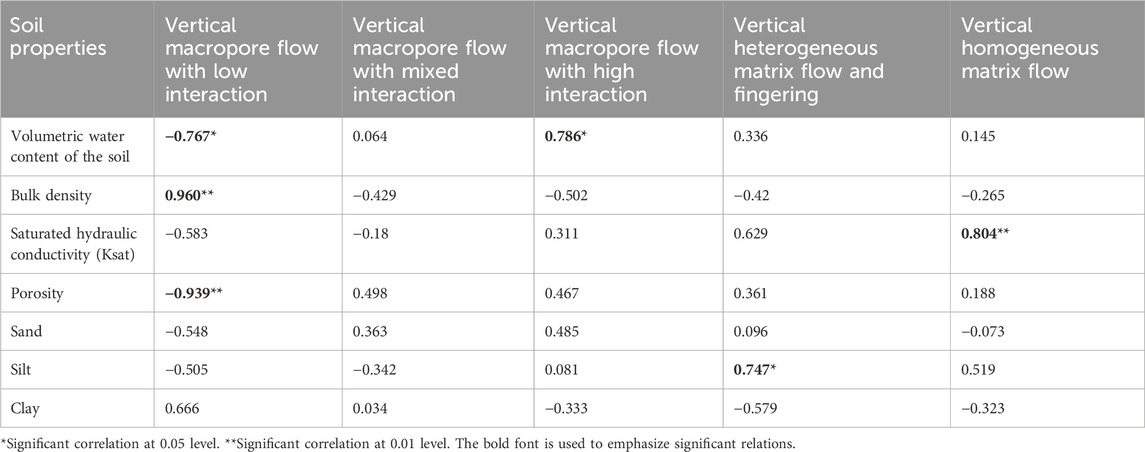
Table 6. Correlation between macropore flow type and soil properties.
4 Discussion
4.1 Dye patterns: hydrometeorological controls on preferential flow
Image analysis revealed distinct spatial heterogeneity in macropore flow characteristics across the slope profile, with differential flow classifications between slope positions. In this study, dye penetration depths consistently reached ∼400 mm, exceeding the <400 mm staining depth recorded under 250 mm simulated rainfall in Mount Maka (Zhang and Xu, 2016). Dye-tracing experiments demonstrated contrasting preferential flow penetration depths across ecosystems: 55 cm under 40 mm rainfall in Finland’s forested slopes (Laine-Kaulio et al., 2015) versus 300 mm with 88 mm rainfall in Chinese loess plantations (Mei et al., 2018). These studies collectively indicate that staining depth is governed by rainfall intensity and vegetation-soil interactions. In our silt loam slope, measured dye depths (∼400 mm) aligned with Grant et al. (2019), who reported 433–632 mm penetration in silt loam with no moisture-dependent variation. Preferential flow occurrence in this region exhibits strong hydrometeorological dependence, the average occurrence probability is 41%, surging to 71% when the rainfall events exceed 20 mm (Hu et al., 2019). This rainfall-intensity modulation amplifies with antecedent soil moisture, as demonstrated by Peng et al. (2016b) who documented 17.9%–74.3% frequency variations controlled by storm characteristics (amount/duration/intensity). Our measurements align with this pattern, showing 56.6%–74.8% preferential flow when soil moisture reached 40%–50%. Such moisture thresholds likely reflect macropore network interactions that elevate hydraulic pressure gradients, driving matrix-to-macropore water redistribution (Nieber and Sidle, 2010).
4.2 Slope position modulates preferential flow pathways
In our study, according to the applied quantification schemes, the flow at upslope position is less preferential compared to the mid-slope and downslope direction. Study on the effect of slope position on the spatial distribution of soil preferential flow paths in a subtropical evergreen broad-leaved forest area revealed that the middle slope was more likely to generate preferential flow than those at the upslope and the downslope (Li et al., 2024). The research on the slopes of tropical rainforest mountains also found that, combined with the infiltration capacity, the preferential flow increased with increasing hillslope elevation (Chen et al., 2021). While, some findings are opposite. In semiarid loess hillslopes, abundant rock fragments in the downslope locations resulted in higher preferential flow and infiltration variability (Mei et al., 2018). These results indicate that not only hillslope position but also other factors, such as soil type, properties, lithology and soil structure can influence the preferential flow (Tang et al., 2020). The multi-index evaluation of the entire soil profile revealed that the mid-slope position had the highest silt content (73.41%), which contributed to significant shrink-swell dynamics in the soil matrix. Frequent wet-dry cycles promoted macropores genesis at this position, potentially explaining the elevated preferential flow occurrence (74.8%). The relatively stable saturated hydraulic conductivity observed at mid-slope, compared to upslope and downslope areas, likely contributed to the maximum preferential flow peak (7) and highest preferential flow fraction. Stable saturated hydraulic conductivity values enhance structural connectivity through macropores and gravel, intensifying preferential flow through hydraulically efficient pathways.
4.3 Soil porosity and particle size dictate flow interaction
The correlation analysis shows that there is a significant negative correlation between soil porosity and macropore flow with low interaction. In stony soils of a small mountain catchment, assessed via Poiseuille’s equation, the number of macropores decreased with soil depth (Hlaváciková et al., 2019), which may be the direct reason for the decrease of macropore flow interaction with depth. Table 1 indicates that as the soil depth increases, the soil porosity decreases. Correspondingly, Table 5 shows that as the soil depth increases, the proportion of macropore flow with high interaction decreases, while the proportion of macropore flow with low interaction increases. The relationship between particle size and preferential flow revealed that in clay loam or sandy clay loam soil, they were prone to macropore and finger flow (Liu et al., 2021), sandy soil favours the flow of water from macropores to the surrounding sandy matrix, and that preferential flow was more prevalent in clays than in silt loams (Grant et al., 2019).
4.4 Methodological trade-offs in preferential flow quantification
The flow type profiles demonstrate the persistence of individual flow types and the prevalence of transitions between distinct flow types. Furthermore, they reveal both differences and similarities among the experiments (Weiler and Flühler, 2004). Traditional digital image analysis is well suited for visualizing and quantifying water infiltration into soil (Persson, 2005), thereby identifying various infiltration mechanisms in the soil, but cannot be directly used to distinguish the different flow processes of each soil layer (Weiler and Naef, 2003). This paper combines the evaluation indicators extracted from the dye tracer image and the preferential flow path classification standard proposed by Weiler and Flühler (2004) to identify and classify the preferential flow. Quantifying preferential flow using a dye tracer experiment, various sources contributed to the overall error. The detailed examination of the precision of various correction methodologies and their consequences on outcomes remains unexplored. Moreover, the selection of camera, lens, and camera settings plays a pivotal role in determining image quality, which subsequently impacts the accuracy with which preferential flow is evaluated (Persson, 2005). The results calculated by the preferential flow fraction (Equation 2) indicate that the proportion of preferential flow is 56.6% on the upper slope, 74.8% on the middle slope, and 67.5% on the lower slope. This index is relatively single. Thus, we evaluated the preferential flow through seven indexes. Among them, the length index, peak value, and coefficient of variation are all related to the heterogeneity of the stained images. Since the preferential flow is a non-uniform flow, the staining changes in the regions through which it flows are more obvious. These three indexes can accurately reflect the degree of change in the staining patterns among different soil layers. The larger the preferential flow evaluation index value obtained based on multiple indexes is, the higher the development degree of the preferential flow will be. The preferential flow evaluation index derived through the standardized treatment of indexes and the mean square deviation analysis method can only evaluate the relative development among different slope positions and cannot quantify the proportion of preferential flow in the soil. On the other hand, the multi-index evaluation method is an overall evaluation of the stained area and can reflect the development of the degree of the preferential flow in soil. However, it cannot reflect the interaction between the preferential flow and the soil during infiltration process due to a lack of rigorous calibration when conducted the dye tracer experiment. Flow type classification can make up for this deficiency. By calculating the staining width and staining proportion of each soil layer (at the pixel level), the macropore flow was divided into five types. Through flow type classification, the relationship between macropore flow and the soil matrix was further investigated. Finally, the flow type classification method shows that the proportion of macropore flow is 79.31% on the upper slope, 86.88% on the middle slope, and 95.31% on the lower slope. Our findings indicate that the occurrence of heterogeneous matrix flow and fingering flow in the forest topsoil during infiltration processes is primarily driven by spatial variations in soil texture, water repellency, and flow instability (Weiler and Flühler, 2004). Textural analysis across soil horizons revealed that the silt percentage in the 0–10 cm layer at three slope positions consistently exceeded that in the 10–30 cm layer. This vertical textural differentiation establishes a soil structure with finer-textured horizons overlying coarser-textured substrates, creating a positive matric potential gradient at the interface that promotes flow instability and subsequent fingering development (Baker and Hillel, 1990; Selker et al., 1992).
However, the proportion of preferential flow obtained by the preferential flow classification method is higher than that by the multi-index method. The main reason lies in the difference in the scale of analysis. In the multi-index evaluation method, the proportion of preferential flow is derived by subtracting the dyed area of the matrix flow region from the dyed area of the entire profile. The calculation process is relatively straightforward and reflects more the overall summative effect of the profile. During the operations such as large-scale integration and averaging at the macroscopic level, the advantages of local macropore flow will be weakened. In contrast, the preferential flow classification method takes the dyed width as the core judgment basis, it can precisely capture macropore flow at the microscopic level by carrying out analysis at the soil layer scale (pixel level). Consequently, it is more likely to present higher values in the results. By combining these two methods, the characteristics of macropore flow and its interaction with the soil matrix can be judged more accurately.
4.5 Limitations: lateral vs. vertical preferential flow dynamics
The limitations of the current study is the relationship between slope lateral preferential and vertical preferential flow. A pivotal challenge within hillslope hydrology lies in the conceptual framing and parameterization of the impacts exerted by lateral preferential flow (Weiler and McDonnell, 2007). Current research indicates that as the input intensity increases at sites with comparatively large macropores, the production of vertical preferential flow also intensifies, whereas the contribution of parallel macropores to slope runoff remains minimal (Buttle and McDonald, 2002). In relation to soil structure, subsurface lateral preferential flow typically arises when percolating water within a soil profile encounters a hydrologically constraining layer, for instance, an impeding soil stratum, a soil profile characterized by differing textures, or a bedrock of low permeability (Guo et al., 2014). With regards to soil moisture content and rainfall intensity, lateral flow generation was observed exclusively when the soil’s large storage capacity became saturated in conjunction with a minimum precipitation event exceeding a specific threshold amount (Todd et al., 2010). What’s more, from the perspective of research methods, dye tracer experiment are more direct for visualizing vertical preferential flow than lateral preferential flow. Hydrological connectivity resulting from such pathways may be overlooked unless a pronounced diffusion phenomenon is observed at a greater depth. This type of lateral hydrological connectivity is characterized by its instability and complexity (Dai et al., 2020). The intricate characteristics of lateral preferential flow, coupled with the absence of a suitable investigation methodology, have posed obstacles to direct observation of this phenomenon in the field (Guo et al., 2014).
5 Conclusion
In this study, the characteristics of preferential flow on the slope and the relationship between macropore flow and soil properties were determined through the multi-index evaluation method and the macropore flow classification method. The details are as follows:
(1) The multi-index analysis method shows that the infiltration depth of preferential flow is 400 mm, while that of the average uniform infiltration depth is 56.6 mm. It showed no significant difference from the average uniform infiltration depth of 56.6 mm obtained using the 80% stained area ratio. The proportion of the preferential flow component is 56.6% on the upper slope, 74.8% on the middle slope, and 67.5% on the lower slope. Through comprehensive analysis with multiple indexes, it is found that the level of preferential flow on the middle slope is higher than that on the upslope and downslope. The main reason is that the weights of the peak value, the stained area, and the stable infiltration depth are relatively high.
(2) The results of macropore flow classification show that the macropore flow at the three slope positions is mainly dominated by macropore flow with mixed interaction. As the elevation decreases, the proportion of macropore flow gradually increases. Specifically, the proportion of macropore flow is 79.31% on the upslope, 86.88% on the mid-slope, and 95.31% on the downslope. With the increase in the depth of the soil layer, the proportion of macropore flow with low interaction increases, and the interaction between macropore and the surrounding matrix soil decreases. Correlation analysis shows that macropore flow with low interaction has a significant negative correlation with soil volumetric water content and porosity, and a significant positive correlation with soil bulk density. Macropore flow with high interaction has a significant positive correlation with soil volumetric water content. Matrix flow and fingering have a significant positive correlation with the silt content in soil texture. Matrix flow has a significantly positive correlation with soil saturated hydraulic conductivity.
(3) The multi - index method and preferential flow classification method differ in analysis scales. The multi - index method gets the preferential flow proportion by subtracting the matrix flow dyed area from the whole profile dyed area. It is one sided in depicting preferential flow features and cannot well portray its dynamic changes in soil. In contrast, the preferential flow classification method, by calculating the proportion of different dyed widths at the pixel level, can more accurately judge macropore flow characteristics and its relationship with the soil matrix.
Data availability statement
The raw data supporting the conclusion of this article will be made available by the authors, without undue reservation.
Author contributions
YD: Conceptualization, Funding acquisition, Methodology, Visualization, Writing – original draft, Writing – review and editing. XW: Conceptualization, Funding acquisition, Project administration, Supervision, Writing – review and editing. ZN: Software, Writing – review and editing. TL: Validation, Visualization, Writing – review and editing. YT: Formal Analysis, Supervision, Validation, Writing – review and editing. LH: Validation, Visualization, Writing – review and editing.
Funding
The author(s) declare that financial support was received for the research and/or publication of this article. Funding for this research has been provided by the National Key Research and Development Program (No. 2018YFD0800902), Special fund for basic scientific research in central universities (No. ZY20220211, ZY20240227, ZY20220214), the Langfang City Science and Technology Bureau Scientific Research and Development Plan Self-funded Project (No. 2022013088, 2023013092), the Beijing Natural Science Fund - Beijing Municipal Education Commission jointly funded key projects (No. KZ201810028047), National Natural Science Foundation of China (No. 41271495), and the Sino-German PPP program (China Scholarship Council and German Academic Exchange Service).
Acknowledgments
The author would like to thank Professor Fuqiang Tian of Tsinghua University in particular for providing access to the Xitaizi Clean small watershed. The authors would like to thank Professor Charles S. Melching from Melching Water Solutions, Greenfield, Wisconsin, U.S for an internal review of the draft manuscript and for many useful comments and edits. The authors acknowledge the comments made by two reviewers which improve the quality of this paper.
Conflict of interest
The authors declare that the research was conducted in the absence of any commercial or financial relationships that could be construed as a potential conflict of interest.
Generative AI statement
The author(s) declare that no Generative AI was used in the creation of this manuscript.
Publisher’s note
All claims expressed in this article are solely those of the authors and do not necessarily represent those of their affiliated organizations, or those of the publisher, the editors and the reviewers. Any product that may be evaluated in this article, or claim that may be made by its manufacturer, is not guaranteed or endorsed by the publisher.
References
Alaoui, A. (2023). A simple method to assess key soil hydraulic properties. Water 15 (3), 467. doi:10.3390/w15030467
Alaoui, A., Caduff, U., Gerke, H. H., and Weingartner, R. (2011). Preferential flow effects on infiltration and runoff in grassland and forest soils. Vadose Zone J. 10 (2), 367–377. doi:10.2136/vzj2010.0076
Allaire, S. E., Roulier, S., and Cessna, A. J. (2009). Quantifying preferential flow in soils: a review of different techniques. J. Hydrology 378 (1-2), 179–204. doi:10.1016/j.jhydrol.2009.08.013
Anderson, A. E., Weiler, M., Alila, Y., and Hudson, R. O. (2009). Dye staining and excavation of a lateral preferential flow network. Hydrology Earth Syst. Sci. 13 (4), 935–944. doi:10.5194/hess-13-935-2009
Baker, R. S., and Hillel, D. (1990). Laboratory tests of a theory of fingering during infiltration into layered soils. Soil Sci. Soc. Am. J. 54 (1), 20–30. doi:10.2136/sssaj1990.03615995005400010004x
Bargués Tobella, A., Reese, H., Almaw, A., Bayala, J., Malmer, A., Laudon, H., et al. (2014). The effect of trees on preferential flow and soil infiltrability in an agroforestry parkland in semiarid Burkina Faso. Water Resour. Res. 50 (6), 3342–3354. doi:10.1002/2013WR015197
Benegas, L., Ilstedt, U., Roupsard, O., Jones, J., and Malmer, A. (2014). Effects of trees on infiltrability and preferential flow in two contrasting agroecosystems in Central America. Agric. Ecosyst. and Environ. 183, 185–196. doi:10.1016/j.agee.2013.10.027
Beven, K., and Germann, P. (1982). Macropores and water flow in soils. Water Resour. Res. 18 (5), 1311–1325. doi:10.1029/WR018i005p01311
Bogner, C., Borken, W., and Huwe, B. (2012). Impact of preferential flow on soil chemistry of a podzol. Geoderma 175-176, 37–46. doi:10.1016/j.geoderma.2012.01.019
Buttle, J. M., and McDonald, D. J. (2002). Coupled vertical and lateral preferential flow on a forested slope. Water Resour. Res. 38 (12). doi:10.1029/2001WR000773
Cai, L., Wang, F., Lin, Y., Long, Q., Zhao, Y., Han, J., et al. (2024). Changes in preferential flow caused by root effects in black locust plantations of different stand ages in the semi-arid region of the Loess Plateau. J. Hydrology 634, 131086. doi:10.1016/j.jhydrol.2024.131086
Chen, C., Zou, X., Singh, A. K., Zhu, X., Zhang, W., Yang, B., et al. (2021). Effects of hillslope position on soil water infiltration and preferential flow in tropical forest in southwest China. J. Environ. Manag. 299, 113672. doi:10.1016/j.jenvman.2021.113672
Chen, L., Yang, C., Wang, J., Meng, Q., and Tarolli, P. (2024). Variation in preferential flow features induced by desiccation cracks in physical crusts. J. Hydrology 634, 131118. doi:10.1016/j.jhydrol.2024.131118
Cui, Z., Tian, F., Zhao, Z., Xu, Z., Duan, Y., Wen, J., et al. (2024). Bimodal hydrographs in a semi-humid forested watershed: characteristics and occurrence conditions. Hydrology Earth Syst. Sci. 28 (15), 3613–3632. doi:10.5194/hess-28-3613-2024
Dai, L., Zhang, Y., Liu, Y., Xie, L., Zhao, S., Zhang, Z., et al. (2020). Assessing hydrological connectivity of wetlands by dye-tracing experiment. Ecol. Indic. 119, 106840. doi:10.1016/j.ecolind.2020.106840
Demand, D., Blume, T., and Weiler, M. (2019). Spatio-temporal relevance and controls of preferential flow at the landscape scale. Hydrology Earth Syst. Sci. Discuss. doi:10.5194/hess-2019-80
de Rooij, G. H. (2000). Modeling fingered flow of water in soils owing to wetting front instability: a review. J. Hydrology 231-232, 277–294. doi:10.1016/s0022-1694(00)00201-8
Ding, B., Cai, X., Wang, Y., Li, H., Zhao, X., Xiao, M., et al. (2023). Secondary vegetation succession following reforestation intensifies preferential flow by improving soil structure in the Chinese Karst region. Ecol. Indic. 156, 111166. doi:10.1016/j.ecolind.2023.111166
Flury, M., and Flühler, H. (1995). Tracer characteristic of brilliant blue FCF. Soil Sci. Soc. Am. J. 59 (1), 22–27. doi:10.2136/sssaj1995.03615995005900010003x
Forrer, I., Papritz, A., Kasteel, R., Flühler, H., and Luca, D. (2000). Quantifying dye tracers in soil profiles by image processing. Eur. J. Soil Sci. 51 (3), 313–322. doi:10.1046/j.1365-2389.2000.00315.x
Fuhrmann, S., Maarastawi, J., Neumann, J., Amelung, W., Frindte, K., Knief, C., et al. (2019). Preferential flow pathways in paddy rice soils as hot spots for nutrient cycling. Geoderma 337, 594–606. doi:10.1016/j.geoderma.2018.10.011
Grant, K. N., Macrae, M. L., and Ali, G. A. (2019). Differences in preferential flow with antecedent moisture conditions and soil texture: implications for subsurface P transport. Hydrol. Process. 33, 2068–2079. doi:10.1002/hyp.13454
Guan, N., Cheng, J., Bi, H., and Shi, X. (2024). Laboratory and field characterization of preferential flow under consideration of geometric fracture features in a karst region in Southwest China. J. Hydrology 631, 130851. doi:10.1016/j.jhydrol.2024.130851
Guo, L., Chen, J., and Lin, H. (2014). Subsurface lateral preferential flow network revealed by time-lapse ground-penetrating radar in a hillslope. Water Resour. Res. 50, 9127–9147. doi:10.1002/2013WR014603
Guo, L., and Lin, H. (2018). Addressing two bottlenecks to advance the understanding of preferential flow in soils. Adv. Agron. 147, 61–117. doi:10.1016/bs.agron.2017.10.002
Hendrickx, J. M. H., and Flury, M. (2001). “Uniform and preferential flow mechanisms in the vadose zone,” in Conceptual model of flow and transport in fractured vadose zone. Washington, DC: The National Academies Press. doi:10.17226/10102
Hlaváčiková, H., Holko, L., Danko, M., and Novák, V. (2019). Estimation of macropore flow characteristics in stony soils of a small mountain catchment. J. Hydrol. 574, 1176–1187. doi:10.1016/j.jhydrol.2019.05.009
Hou, F., Cheng, J., Zhang, H., Wang, X., Shi, D., and Guan, N. (2024). Response of preferential flow to soil-root-rock fragment system in karst rocky desertification areas. Ecol. Indic. 165, 112234. doi:10.1016/j.ecolind.2024.112234
Hu, H., Wen, J., Peng, Z., Tian, F., Tie, Q., Lu, Y., et al. (2019). High-frequency monitoring of the occurrence of preferential flow on hillslopes and its relationship with rainfall features, soil moisture and landscape. Hydrol. Sci. J. 64, 1385–1396. doi:10.1080/02626667.2019.1638513
Jarvis, N. J. (2007). A review of non-equilibrium water flow and solute transport in soil macropores: principles, controlling factors and consequences for water quality. Eur. J. Soil Sci. 58, 523–546. doi:10.1111/j.1365-2389.2007.00915.x
Julich, D., Julich, S., and Feger, K. (2017). Phosphorus fractions in preferential flow pathways and soil matrix in hillslope soils in the Thuringian Forest (Central Germany). J. Plant Nutr. Soil Sci. 180 (4), 407–417. doi:10.1002/jpln.201600305
Kang, W., Tian, J., Lai, Y., Xu, S., Gao, C., Hong, W., et al. (2022). Occurrence and controls of preferential flow in the upper stream of the Heihe River Basin, Northwest China. J. Hydrology 607, 127528. doi:10.1016/j.jhydrol.2022.127528
Karahan, G., and Erşahin, S. (2017). Relating macropore flow to soil parametric and morphological variables. Soil Sci. Soc. Am. J. 81 (5), 1014–1024. doi:10.2136/sssaj2016.10.0327
Laine-Kaulio, H., Backnäs, S., Karvonen, T., Koivusalo, H., and Lauren, A. (2015). Dye tracer visualization of flow patterns and pathways in glacial sandy till at a boreal forest hillslope. Geoderma 249-260, 23–34. doi:10.1016/j.geoderma.2015.05.004
Laine-Kaulio, H., Backnäs, S., Karvonen, T., Koivusalo, H., and McDonnell, J. J. (2014). Lateral subsurface stormflow and solute transport in a forested hillslope: a combined measurement and modeling approach. Water Resour. Res. 50, 8159–8178. doi:10.1002/2014WR015381
Legout, A., Legout, C., Nys, C., and Dambrine, E. (2009). Preferential flow and slow convective chloride transport through the soil of a forested landscape (Fougères, France). Geoderma 151 (3-4), 179–190. doi:10.1016/j.geoderma.2009.04.002
Li, M., Yao, J., Yan, R., Fan, Y., and Liu, S. (2024). Effect of slope position on the spatial distribution of soil preferential flow paths based on point pattern analysis. PLoS One 19 (12), e0315660. doi:10.1371/journal.pone.0315660
Li, T., Shao, M. A., Jia, Y., Jia, X., and Huang, L. (2018). Small-scale observation on the effects of the burrowing activities of mole crickets on soil erosion and hydrologic processes. Agric. Ecosyst. Environ. 261, 136–143. doi:10.1016/j.agee.2018.04.010
Liu, Y., Zhang, S., and Liu, H. (2023). The relationship between fingering flow fraction and water flux in unsaturated soil at the laboratory scale. J. Hydrology 622, 129695. doi:10.1016/j.jhydrol.2023.129695
Liu, Y., Zhang, Y., Xie, L., Zhao, S., Dai, L., and Zhang, Z. (2021). Effect of soil characteristics on preferential flow of Phragmites australis community in Yellow River delta. Ecol. Indic. 125, 107486. doi:10.1016/j.ecolind.2021.107486
Luo, L., Lin, H., and Schmidt, J. (2020). Quantitative relationships between soil macropore characteristics and preferential flow and transport. Soil Sci. Soc. Am. J. 74 (6), 1929–1937. doi:10.2136/sssaj2010.0062
Luo, Z. T., Niu, J. Z., Xie, B. Y., Zhang, L. N., Chen, X. W., Berndtsson, R., et al. (2019). Influence of root distribution on preferential flow in deciduous and coniferous forest soils. Forests 10 (11), 986. doi:10.3390/f10110986
Luo, Z. T., Niu, J. Z., Zhang, L., Chen, X. W., Zhang, W., Xie, B. Y., et al. (2018). Roots-enhanced preferential flows in deciduous and coniferous forest soils revealed by dual-tracer experiments. J. Environ. Qual. 48 (1), 136–146. doi:10.2134/jeq2018.03.0091
Makowski, V., Julich, S., Feger, K. H., Breuer, L., and Julich, D. (2020). Leaching of dissolved and particulate phosphorus via preferential flow pathways in a forest soil: an approach using zero-tension lysimeters. J. Plant Nutr. Soil Sci. 183 (2), 238–247. doi:10.1002/jpln.201900216
Mälicke, M., Hassler, S., Blume, T., Weiler, M., and Zehe, E. (2019). Soil moisture: variable in space but redundant in time. Hydrology Earth Syst. Sci. Discuss., 1–28. doi:10.5194/hess-2019-574
Mao, Z., Ma, X., Geng, M., Wang, M., Gao, G., and Tian, Y. (2024a). Development characteristics and quantitative analysis of cracks in root-soil complex during different growth periods under dry-wet cycles. Biogeotechnics 3, 100121. doi:10.1016/j.bgtech.2024.100121
Mei, X., Zhu, Q., Ma, L., Zhang, D., Wang, Y., and Hao, W. (2018). Effect of stand origin and slope position on infiltration pattern and preferential flow on a Loess hillslope. Land Degrad. and Dev. 29 (5), 1353–1365. doi:10.1002/ldr.2928
Nieber, J. L., and Sidle, R. C. (2010). How do disconnected macropores in sloping soils facilitate preferential flow? Hydrol. Process. 24 (12), 1582–1594. doi:10.1002/hyp.7633
Nimmo, J. R. (2020). The processes of preferential flow in the unsaturated zone. Soil Sci. Soc. Am. J. 85, 1–27. doi:10.1002/saj2.20143
Øygarden, L., Kværner, J., and Jenssen, P. D. (1997). Soil erosion via preferential flow to drainage systems in clay soils. Geoderma 76 (1-2), 65–86. doi:10.1016/S0016-7061(96)00099-7
Peng, Z., Hu, H., Tian, F., Tie, Q., and Zhao, S. (2016a). Impacts of rainfall features and antecedent soil moisture on occurrence of preferential flow: a study at hillslopes using high-frequency monitoring. Hydrology Earth Syst. Sci. Discuss. 2016, 1–22. doi:10.5194/hess-2016-112
Peng, Z., Tian, F., Hu, H., Zhao, S., Tie, Q., Sheng, H., et al. (2016b). Spatial variability of soil moisture in a forest catchment: temporal trend and contributors. Forests 7, 154. doi:10.3390/f7080154
Persson, M. (2005). Accurate dye tracer concentration estimations using image analysis. Soil Sci. Soc. Am. J. 69, 967–975. doi:10.2136/sssaj2004.0186
Rezanezhad, F., Vogel, H.-J., and Roth, K. (2006). Experimental study of fingered flow through initially dry sand. Hydrology Earth Syst. Sci. Discuss. 3, 2595–2620. doi:10.5194/hessd-3-2595-2006
Santra, P., Kumar, M., and Kumawat, R. N. (2021). Characterization and modeling of infiltration characteristics of soils under major land use systems in hot arid region of India. Agric. Res. 10 (3), 417–433. doi:10.1007/s40003-020-00511-1
Selker, J., Parlange, J. Y., and Steenhuis, T. S. (1992). Fingered flow in two dimensions: 2. Predicting finger moisture profile. Water Resour. Res. 28 (9), 2523–2528. doi:10.1029/92WR00962
Simard, R. R., Beauchemin, S., and Haygarth, P. M. (2000). Potential for preferential pathways of phosphorus transport. J. Environ. Qual. 29, 97–105. doi:10.2134/jeq2000.00472425002900010012x
Tang, Q., Duncan, J. M., Guo, L., Lin, H., Xiao, D., and Eissenstat, D. M. (2020). On the controls of preferential flow in soils of different hillslope position and lithological origin. Hydrol. Process. 34, 4295–4306. doi:10.1002/hyp.13883
Tian, F., and Xu, Z. (2024). Streamflow diurnal fluctuation and driving mechanism of headwater stream in a semi-humid mountainous region. J. Hydrology 641, 131803. doi:10.1016/j.jhydrol.2024.131803
Tie, Q., Hu, H., Tian, F., and Holbrook, N. M. (2018). Comparing different methods for determining forest evapotranspiration and its components at multiple temporal scales. Sci. Total Environ. 633, 12–29. doi:10.1016/j.scitotenv.2018.03.082
Toor, G. S., Condron, L. M., Cade-Menun, B. J., Di, H. J., and Cameron, K. C. (2005). Preferential phosphorus leaching from an irrigated grassland soil. Eur. J. Soil Sci. 56, 155–167. doi:10.1111/j.1365-2389.2004.00656.x
van Schaik, N. L. M. B. (2009). Spatial variability of infiltration patterns related to site characteristics in a semi-arid watershed. Catena 78 (3), 36–47. doi:10.1016/j.catena.2009.02.017
Walter, M., Kim, J., Steenhuis, T., Parlange, J., Heilig, A., Braddock, R., et al. (2000). Funneled flow mechanisms in a sloping layered soil: laboratory investigation. Water Resour. Res. 36 (4), 841–849. doi:10.1029/1999WR900328
Wang, T., Stewart, C. E., Ma, J., Zheng, J., and Zhang, X. (2017). Applicability of five models to simulate water infiltration into soil with added biochar. J. Arid Land 9 (5), 701–711. doi:10.1007/s40333-017-0025-3
Weiler, M., and Flühler, H. (2004). Inferring flow types from dye patterns in macroporous soils. Geoderma 120 (1-2), 137–153. doi:10.1016/j.geoderma.2004.08.014
Weiler, M., and McDonnell, J. J. (2007). Conceptualizing lateral preferential flow and flow networks and simulating the effects on gauged and ungauged hillslopes. Water Resour. Res. 43 (3), W03403. doi:10.1029/2006WR004867
Weiler, M., and Naef, F. (2003). An experimental tracer study of the role of macropores in infiltration in grassland soils. Hydrol. Process. 17 (3), 477–493. doi:10.1002/hyp.1136
Widemann, B. T. Y., and Bogner, C. (2012). “Image analysis for soil dye tracer infiltration studies,” in 2012 3rd International Conference on Image Processing Theory, Tools and Applications, 409–414. doi:10.1109/IPTA.2012.6469517
Wiekenkamp, I., Huisman, J. A., Bogena, H. R., Lin, H. S., and Vereecken, H. (2016). Spatial and temporal occurrence of preferential flow in a forested headwater catchment. J. Hydrology 534, 139–149. doi:10.1016/j.jhydrol.2015.12.050
Wilson, G. V., Cullum, R. F., and Römkens, M. J. M. (2008). Ephemeral gully erosion by preferential flow through a discontinuous soil-pipe. Catena 73 (1), 98–106. doi:10.1016/j.catena.2007.09.005
Wu, X., Dang, X., Meng, Z., Fu, D., Cong, W., Feiyan, Z., et al. (2022). Mechanisms of grazing management impact on preferential water flow and infiltration patterns in a semi-arid grassland in northern China. Sci. Total Environ. 813, 152082. doi:10.1016/j.scitotenv.2021.152082
Xue, D., Tian, J., Zhang, B., Kang, W., Zhou, Y., and He, C. (2024). Effects of vegetation types on soil wetting pattern and preferential flow in arid mountainous areas of northwest China. J. Hydrology 641, 131849. doi:10.1016/j.jhydrol.2024.131849
Yi, L., Jiaming, Z., Zhi, Z., and Victor, C. (2023). Modelling preferential flow induced by dynamic changes of desiccation cracks: a comparative numerical study. Geoderma 433, 116471. doi:10.1016/j.geoderma.2023.116471
Zhang, D., Zhang, H., and Cheng, J. (2017). Quantitative analysis of preferential flow in slope farmland soils based on multi-index evaluation and fractional dimension. Trans. Chin. Soc. Agric. Mach. 48 (12), 214–220. doi:10.6041/j.issn.1000-1298.2017.12.025
Zhang, J., Sun, Q., Wen, N., Horton, R., and Liu, G. (2022). Quantifying preferential flows on two farmlands in the North China plain using dual infiltration and dye tracer methods. Geoderma 428, 116205. doi:10.1016/j.geoderma.2022.116205
Zhang, J., and Xu, Z. (2016). Dye tracer infiltration technique to investigate macropore flow paths in Maka Mountain, Yunnan Province, China. J. Central South Univ. 23 (8), 2101–2109. doi:10.1007/s11771-016-3266-y
Zhang, Y. H., Niu, J. Z., Zhu, W. L., Du, X. Q., and Li, J. (2015). Effects of plant roots on soil preferential pathways and soil matrix in forest ecosystems. J. For. Res. 26 (2), 397–404. doi:10.1007/s11676-015-0023-2
Zhao, S., Hu, H., Harman, C. J., Tian, F., Tie, Q., Liu, Y., et al. (2019). Understanding of storm runoff generation in a weathered, fractured granitoid headwater catchment in northern China. Water 11 (1), 123. doi:10.3390/w11010123
Keywords: preferential flow, dye tracer, image analysis, flow type, hillslope
Citation: Du Y, Wang X, Nan Z, Li T, Tang Y and Huang L (2025) Assessment of the vertical preferential flow characteristics and flow types on a slope in a small headwater catchment. Front. Environ. Sci. 13:1515739. doi: 10.3389/fenvs.2025.1515739
Received: 23 October 2024; Accepted: 01 April 2025;
Published: 14 April 2025.
Edited by:
Jing Zhang, North China University of Water Conservancy and Electric Power, ChinaCopyright © 2025 Du, Wang, Nan, Li, Tang and Huang. This is an open-access article distributed under the terms of the Creative Commons Attribution License (CC BY). The use, distribution or reproduction in other forums is permitted, provided the original author(s) and the copyright owner(s) are credited and that the original publication in this journal is cited, in accordance with accepted academic practice. No use, distribution or reproduction is permitted which does not comply with these terms.
*Correspondence: Xiaoyan Wang, d2FuZ3h5QGNudS5lZHUuY24=