 Xin Huang1,2
 Hongbing Deng1,2*
- 1School of Economics and Management, China University of Geosciences (Wuhan), Wuhan, China
- 2Hubei Institutes of Soft Science on Regional Innovation Capacity Monitoring and Analysis, Wuhan, China
China is actively promoting the deep integration of digital technology and manufacturing and helping the manufacturing industry develop into high-end, intelligent, and green. As the concept of green development gradually deepens and the international situation becomes increasingly severe, it is necessary to discuss the coordinated development of digital technology and the manufacturing green transformation (MGT), which will better promote the realization of the goals of “double carbon,” “digital power” and “manufacturing power.” Based on this, this paper adopts the coupling coordination model, kernel density estimation, Dagum Gini coefficient decomposition, and spatial autocorrelation to conduct a spatiotemporal evolution analysis of the coupling coordination degree (the D-G system) of digital technology and MGT in 30 provinces (municipalities, autonomous regions) of mainland China from 2011 to 2020, and adopting the spatial Markov chain to predict its evolutionary trend. The key findings of the study are as follows: (1) Digital technology and MGT have been progressing steadily in China, with continuous improvements in the level of development; (2) The degree of coupling coordination has shown consistent growth over the years, yet the distribution remains relatively uneven, exhibiting a “trapezoidal” spatial pattern with higher values in the eastern regions and lower values in the western regions; (3) Regional differences play a crucial role in the overall differences of the D-G system; and (4) The traditional Markov chain results show that the probability of the D-G system maintaining the original state stage in the future is greater than 88.67%. The spatial Markov chain results show that the state type of the neighborhood background affects the state transition of the coupling coordination degree. The coupling coordination development of each province will not only be subjected to the “spatial drag” of the neighboring region but also show the phenomenon of “club convergence.“ These findings provide valuable theoretical insights and practical recommendations for fostering the simultaneous advancement of digital development and sustainable development.
1 Introduction
In the digital era, digital technologies, including big data and cloud computing, have experienced rapid growth and are widely applied across various fields (Zhou et al., 2024). They have gradually emerged as vital forces driving scientific and technological revolutions, facilitating industrial adjustments, and stimulating economic development (Fang and Liu, 2024). In particular, the digital economy, as a new model combining digital technology with the real economy, has injected new vitality into the economic development of countries around the world (Sun et al., 2024; Xu et al., 2024). The White Paper on the Global Digital Economy, titled “A New Era of Recovery in the Aftermath of the Epidemic,” published by the China Academy of Information and Communications Technology, highlighted that by 2022, the collective digital economy of five major nations—namely the United States, Germany, South Korea, China, and Japan had reached 31 trillion US dollars, accounting for 58% of GDP. Nations globally are expediting the advancement of pivotal sectors within the digital economy and proactively capitalizing on opportunities for growth in digital technologies, industrial digitalization, and data-driven industries. China is a big digital country with a large domestic market and a sound network infrastructure, and the potential for developing the digital technology is huge. The digital technology is profoundly transforming traditional modes of production and innovation (Hu et al., 2024). It has served as a driving force for China to enhance its innovation capacity and improve its competitive edge (Huo and Wang, 2022).
The manufacturing industry is a crucial indicator of a country’s comprehensive national strength and is closely linked to realizing high-quality economic development goals (Shi and Su, 2023). As China’s leading pillar industry and a significant contributor to carbon emissions, the manufacturing industry must deepen its innovation-driven strategy to promote the transition to high-end, intelligent, and greenization of traditional industries (Wu et al., 2022). Today, digital technology and the MGT have become central issues in the global economy and environmental policy. As countries continue to strengthen their efforts to achieve carbon neutrality, energy conservation, emission reduction and sustainable development, the rapid development of digital technology provides a new solution for the MGT. Digital technologies, especially artificial intelligence, Internet of Things, big data analytics and cloud computing, can significantly improve resource use efficiency, energy management and production optimization in manufacturing processes, thereby reducing carbon emissions and environmental pollution (Chen et al., 2024). On the other hand, the MGT not only relies on the innovation of environmental protection technology and the use of clean energy but also needs the support of digital means through intelligent production, optimized supply chain management and real-time monitoring, reduced waste, improved productivity, and achieve a win-win situation of environmental benefits and economic benefits (Huang and Ren, 2024). Therefore, digital technologies and the MGT are not simply complementary; they complement each other, forming a synergistic effect to promote the economic, social, and environmental sustainability of manufacturing. Digital technology makes every link in the process of MGT more intelligent and refined, improves resource allocation efficiency and reduces environmental costs through digital platforms. At the same time, MGT provides a wide range of scenarios and practices for applying digital technologies, and combining the two can create more innovative and ground-breaking solutions than a single technology path. Considering that the tense international situation and the need for economic recovery after the epidemic have posed significant challenges to economic development and green transformation (Ma et al., 2023), the collaborative development of digital technology and MGT may become a feasible path, which has important theoretical and practical significance for the promotion and green development of China’s regional and even the overall digital economy. Therefore, it is necessary to explore the level of interaction and coordinated development between digital technology and MGT. Based on this, this paper aims to take the panel data of 30 provinces in the Chinese Mainland (except Xizang) from 2011 to 2020 as the research sample, use the coupling coordination model to measure the level of collaborative development of digital technology and MGT and explore the spatiotemporal evolution characteristics and regional differences of the level of cooperative development of the two, predict the future development trend. Finally, based on relevant research conclusions, propose suggestions to promote the coordinated development of digital technology and MGT.
The rest of the structural design of this paper is as follows: The second chapter is a literature review, including the research status and mechanism analysis. The third chapter introduces the relevant research methods and data. Chapter four discusses the results of empirical analysis. Chapter 5 summarizes the conclusions of this study and puts forward relevant suggestions and limitations of the study. The specific research framework is shown in Figure 1.

Figure 1. Logic frame diagram.
2 Literature review
2.1 Research status
Green transformation is a development model based on a circular economy, led by ecological civilization construction, green innovation as the core, considering economic and social benefits, ecological environment improvement, and high-quality economic development, and is an important part of achieving China’s “carbon peak” and “carbon neutrality” goals (Gong et al., 2024). Digital technology, as the primary form of the new scientific and technological revolution, has penetrated various industries and promoted the transformation and development of the whole industrial chain (Zhao et al., 2024a). With the concept of green development and digital construction gradually gaining popularity, both have become the focus of many scholars (Zhao et al., 2023; Gong et al., 2024). However, although there has been abundant research on digital technology and the MGT, there are still the following problems in the existing research: (1) The effect of digital technology on the MGT has not reached a unified conclusion. Some scholars believe that digital technology can help companies transition to green. For example, Li W. et al. (2024) believed that digital technology can empower financial services to reduce the financial constraints enterprises face in green innovation, optimize the allocation of financial resources, and increase the tax rate to promote MGT. Wang et al. (2023) confirmed that digital technology could improve MGT by improving innovation capability based on enterprise data. However, other scholars believe that digital technology can inhibit the green transformation of enterprises. For example, Axenbeck et al. (2024) believed that using and developing digital technologies can increase electricity consumption. Wang et al. (2024b) believed that green transformation would reduce corporate profits. Therefore, corporate executives who focus on short-term benefits will hinder the positive impact of digital technologies on green innovation, undermining MGT’s development goals. (2) Current studies on the relationship between digital technology and the MGT mainly focus on the impact of digital technology on the MGT. For example, Wang et al. (2023) demonstrated that digital technology can promote the MGT by promoting technological innovation and reducing financing constraints. Zhao et al. (2024b) concluded that digital technology can help enterprises reduce pollution by improving productivity and expanding scale. However, few studies have explored the impact of the MGT on the digital technology, nor have they discussed the interaction between the two. Based on this, the contribution of this study may be: (1) Discussion on the theoretical level. This paper has enriched the mechanism analysis of interaction and synergistic development between digital technology and the MGT. (2) Innovation in a research perspective. In this study, the relationship between digital technology and the MGT is discussed from the perspective of coupling coordination. The spatiotemporal evolution characteristics and regional difference of the coupling coordination degree of the two are analyzed using the spatiotemporal evolution analysis, Dagum Gini coefficient, and the spatial Markov chain is used to predict it.
2.2 Mechanism analysis
This paper mainly analyzes the interaction between digital technology and MGT from the following two aspects.
2.2.1 The impact of digital technology on MGT
The effects of digital technology on MGT have the following aspects: (1) Innovation effect. The digital economy, driven by technologies like the Internet and blockchain, has given rise to novel development models such as the platform economy and sharing economy, facilitates the flow of capital, technology, and other resources (Zhao and Zhou, 2021) while enhancing the innovation capabilities of enterprises (Ning et al., 2022). Technological advancements enable companies to achieve resource and energy reduction at the same production scale (Huang et al., 2022). Moreover, technological innovation can improve energy-consuming technologies and develop clean energy sources, enhancing energy efficiency (Tan et al., 2019). Technological innovation also facilitates the adoption of clean energy (Liu and Liang, 2013) and the integration of clean production processes throughout traditional manufacturing activities (Ma et al., 2022). Consequently, digital technologies can reduce pollution emissions, phase out outdated energy-intensive technologies, and guide manufacturing to a cleaner and more environmentally friendly trajectory (Fu et al., 2020). (2) Allocation effect. At present, the integration of resources relies on the support of advanced communication and information technologies (Ranta et al., 2021). Digital technology enables the broader integration of internal and external resources and provides a resource foundation for green technology innovation (Ge et al., 2024). Through communication and information sharing, enterprises can decentralize and reorganize resources and aggregate and integrate diverse resources (Quan and Zhang, 2022), which can facilitate the avoidance of capability traps resulting from limited resource communication and sharing and unlocks the untapped value of potential and existing resources (Li et al., 2021). Consequently, the compound value of resources is generated, further driving green innovation within enterprises (Dai and Yang, 2022). (3) Monitoring effect. Today, information technology, such as big data and cloud computing, has been integrated into all aspects of the production process in traditional industries (Zhou et al., 2023). It not only increases the production efficiency of enterprises but also enables enterprises to obtain key parameters such as energy consumption, water consumption and emissions in the production process in real-time, providing essential support for the accurate identification of problems and dynamic adjustment of production strategies (Xu et al., 2022; Huo and Wang, 2023). At the same time, digital technology provides a powerful tool for pollutant emission tracking and management, making pollutant emission monitoring more accurate, and can simulate the implementation effect of different environmental protection measures to promote the optimization and upgrading of environmental protection programs and ultimately achieve the MGT.
2.2.2 The impact of MGT on digital technology
The effects of MGT on digital technology have the following aspects: (1) Development needs. Digital technology, as the primary manifestation of the new scientific and technological revolution, has been deeply integrated into all walks of life and promoted the transformation and development of all walks of life (Chen and Yang, 2024). The transformation of the manufacturing industry to the green direction requires a high level of digital technology to support its green transformation and development. Moreover, with the increasing public awareness of sustainable development (Gao et al., 2021), stakeholders, including individuals, investors, and governments, are increasing their concern and regulation of the degree of sustainable development (Wang, 2023). To better cater to the development concept of the market, government agencies, and the public, enterprises need a higher level of digital technology support. Therefore, MGT can react with digital technology to promote its development. (2) Capital accumulation. The government implements various policies to strengthen punishment measures against high-polluting enterprises and funds to enterprises that actively carry out green transformation (Guo et al., 2024). With the change in market development concept, investors’ keen perception of the market makes them prefer green enterprises with good transformation in corporate financing (He and Xie, 2024). Companies actively responding to sustainable development will also gain a good social reputation (Lin et al., 2016). When the enterprise gets more policy subsidies and financial support, the production scale of the enterprise will be further expanded, and the use and research and development of digital technologies will be further improved (Barnewold and Lottermoser, 2020). To enhance the market competitive advantage of the enterprise, the enterprise will also actively improve the development level of digital technology (Yuan and Pan, 2023). (3) Resources sharing. Since MGT is a long-term process, it requires significant research resources and investment in talent development (Bai et al., 2023). Digital technology, as the main driving force for the current high-quality economic and social development, plays a crucial role in green transformation (Wang et al., 2024a). Therefore, the resource elements accumulated in manufacturing’s transition to a green direction will certainly provide a certain amount of human capital, education, and technical support for developing digital technologies (Zhang L. et al., 2024). To promote the further development of digital technology.
In summary, digital technology can promote the MGT in three ways: innovation, allocation, and Monitoring effect, and the MGT can also improve the development of digital technology from three aspects: development demands, capital accumulation, and resources sharing. The two are interdependent and interconnected to promote the coordinated development of digital technology and MGT in the region.
3 Method and data
3.1 Model
3.1.1 Coupled coordination model
Based on the above analysis, digital technology and MGT may have a mutual influence relationship. Therefore, to explore the interaction between digital technology and MGT, this paper decides to use the coupling coordination degree model to analyze the development level of the D-G system. According to the setting, the coupling coordination degree model can study the interaction and coordination development level between multiple systems, and the higher the coupling degree, the stronger the correlation (Huang et al., 2024). Based on the research in this paper, two subsystems of digital technology and MGT are selected, so the coupling coordination degree model can be expressed as:
In the proposed model, the digital technology system is denoted by
In the formula,
Table 1. D-G system classification.
3.1.2 Kernel density estimation
Kernel density estimation is a non-parametric statistical method mainly used to estimate the probability density function of random variables, which can reflect the dynamic distribution and evolution of regional D-G systems (Han et al., 2023). Therefore, this paper uses the kernel density estimation method to draw the kernel density curve of the coordinated development of digital technology and the MGT. The specific formula can be expressed as follows Formula 3:
Where
3.1.3 Dagum Gini coefficient
The Dagum Gini coefficient is an analytical method to measure regional differences. It can be used to analyze regional differences in the coupling coordination degree between digital technology and MGT, decompose differences according to subgroup samples, and explore the sources of differences (Zhang H. et al., 2024). According to the Dagum Gini coefficient analysis method, regional differences can be divided into three parts: super variable density contribution (
Where
3.1.4 Spatial autocorrelation test
The Moran index is a statistical method used to measure spatial autocorrelation, mainly for analyzing geographic or spatial data patterns. Therefore, to examine the spatial correlation characteristics of the D-G system, this paper employs
The
3.1.5 Spatial Markov chain
The spatial Markov chain is used for further analysis to predict the future evolution trend of the D-G system. Compared with the traditional Markov chain, the spatial Markov chain introduces the concept of spatial lag based on the traditional Markov chain, strengthening the influence of regional spatial correlation (Liu et al., 2018). It can be used to reveal the internal relationship between the future development of the coupling coordination degree of the two systems and the regional spatial background and predict its evolution trend more accurately and comprehensively. The formula for the spatial lag value is as follows Formula 6:
In the formula,
3.2 Variable description
Three evaluation methods are commonly used to assess the digital technology level: the single index evaluation method, the keyword frequency number method, and the multidimensional index system evaluation method. Since digital technology is a comprehensive application system, adopting a multidimensional evaluation method is more appropriate. Digital technology mainly affects MGT through two aspects: information sharing and digital interconnection (Sun, 2024). Based on this, this paper measures digital technology from two dimensions of digital informatization and digital interconnection. Furthermore, considering the large differences in population and area in different regions, this paper selects relevant indicators for measurement; namely, the impact of population and area on the overall level is eliminated. All the original data are sourced from “China Statistical Yearbook”, “China Information Yearbook” and the statistical yearbooks of each province. Details of the specific index system can be found in Table 2.
Table 2. Digital technology development level evaluation index system.
Currently, most scholars use green total factor productivity to measure MGT, which chooses to examine the MGT level from the input-output perspective (Liu et al., 2022). However, MGT necessitates considering the environment, resources, and economic benefits (Miao and Zhao, 2023). Moreover, it is also crucial to promote the development and research of green technology innovation throughout the production process, which will be related to the continued advancement of MGT. Considering that the comprehensive evaluation index can comprehensively measure the MGT level, this paper constructs an index system to evaluate MGT from four dimensions: environment, resources, economy, and science and technology. All the original data are sourced from “China Statistical Yearbook,” the CEADS database and the statistical yearbooks of each province. The specific evaluation index system of MGT is shown in Table 3.
Table 3. MGT evaluation index system.
4 Results
4.1 Analysis of coupling coordination degree of D-G system
4.1.1 Subsystem evaluation analysis
This paper employs the entropy evaluation method to calculate the development level of digital technology and the development level of MGT. It is worth mentioning that due to the differences in the development of different regions in China, it is necessary to discuss different regions. This paper divides Chinese provinces into eastern, central, and western regions according to the classification criteria of the Chinese Bureau of Statistics (Eastern provinces: Hebei, Beijing, Tianjin, Liaoning, Jiangsu, Shandong, Guangdong Shanghai, Hainan, Zhejiang, Fujian; Central provinces: Heilongjiang, Henan, Jilin, Hunan, Shanxi, Hubei, Jiangxi, Anhui: Western provinces: Chongqing, Sichuan, Inner Mongolia, Guangxi, Gansu, Yunnan, Guizhou, Shaanxi, Tibet, Qinghai, Ningxia). Figure 2 shows the average annual digital technology and MGT nationwide and in each region during the study period. As shown in Figure 2, digital technology and the MGT exhibit a continuous upward trend nationwide and regionally. The eastern region consistently maintains a higher level than the nationwide average in MGT’s digital technology development level. Moreover, the gap between the eastern and other regions has gradually widened. The central and western regions display lower development levels than the nationwide average. Initially, the level of digital technology in the central and western regions was similar before 2017. However, after 2017, the Western region surpassed the central region in terms of digital technology development, and the gap between the two regions continued to widen. This result may be closely related to the eastern region’s leading position in digital technology and MGT, its long-term accumulation of capital, its relatively advanced technology innovation system and foreign investment. Due to relatively rich capital accumulation, rapid technological innovation and industrial upgrading, the eastern region has formed a first-mover advantage in digital technology and MGT (Zhang, 2021). The central and western regions are constrained by a shortage of capital, a technical brain drain, and weak infrastructure, resulting in a slower pace of development in digital technology and MGT.
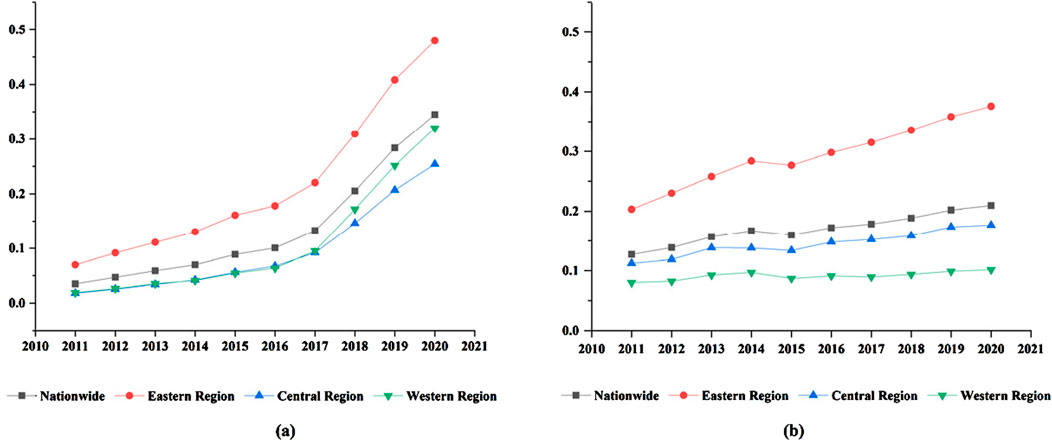
Figure 2. The level of digital technology and the level of MGT. (a) Digital economy develpment level. (b) Manufacturing greenization tranformation level.
4.1.2 Coupling coordination degree evaluation analysis
The D-G system can be computed using Formulas 1, 2. Figure 3 illustrates the 2011, 2014, 2017, and 2020 D-G system calculations. Figure 3 shows that the D-G system exhibited a consistent upward trend throughout the observation period. Moreover, many provinces (municipalities, autonomous regions) experienced an increased growth rate within the same time frame. The results show that China’s D-G system is positive and soundly developed. This trend reflects China’s remarkable achievements in implementing the strategy of “green development” and “manufacturing power”. The coordinated development of digital technology and the MGT have helped to promote industrial upgrading and the optimization of the economic structure, especially in achieving the green growth target and enhancing the competitiveness of the manufacturing industry (Ejaz, 2024). With policy support and technology expansion, the interaction between digital technology and the MGT gradually contributes to local economic transformation and growth.
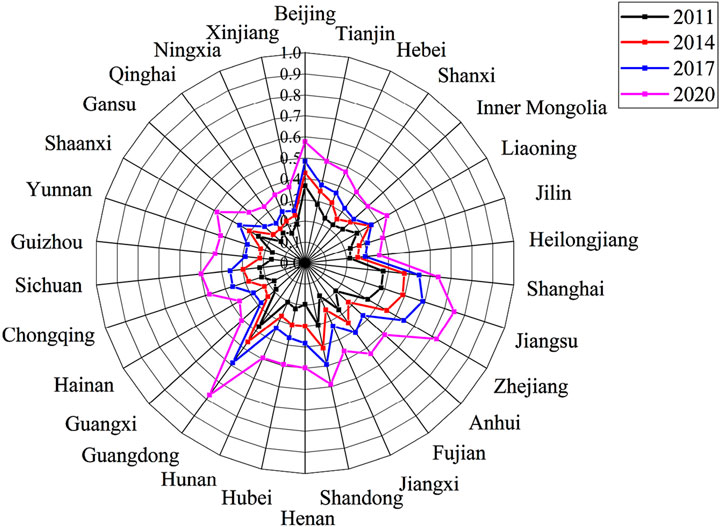
Figure 3. D-G system radar map for 2011, 2014, 2017, and 2020.
4.1.3 The visualization analysis of the D-G system
To conduct a more comprehensive analysis of the spatial distribution of the D-G system, this paper visually processes to illustrate the D-G system across 30 provinces (municipalities, autonomous regions) during the years 2011, 2016, and 2020. The results are shown in Figure 4. As can be seen from Figures 4a-c, the coordinated development level of China’s digital technology and the MGT has improved during the study period. However, the regional development imbalance is significant, showing the spatial distribution characteristics of “high in the east and low in the west.” This situation may be caused by the higher level of economic development in the eastern region, the more digital and green industrial structure, strong government policy support, rich technology and human resources, and strong market demand, so the coupling degree of digital technology and green transformation is relatively high (Li Z. et al., 2024). In the central and western regions, the economy is relatively lagging, traditional resources still dominate the industrial structure, the government support is limited, the technical foundation is weak, and the market demand for green transformation is low, resulting in a low degree of coupling and coordination.
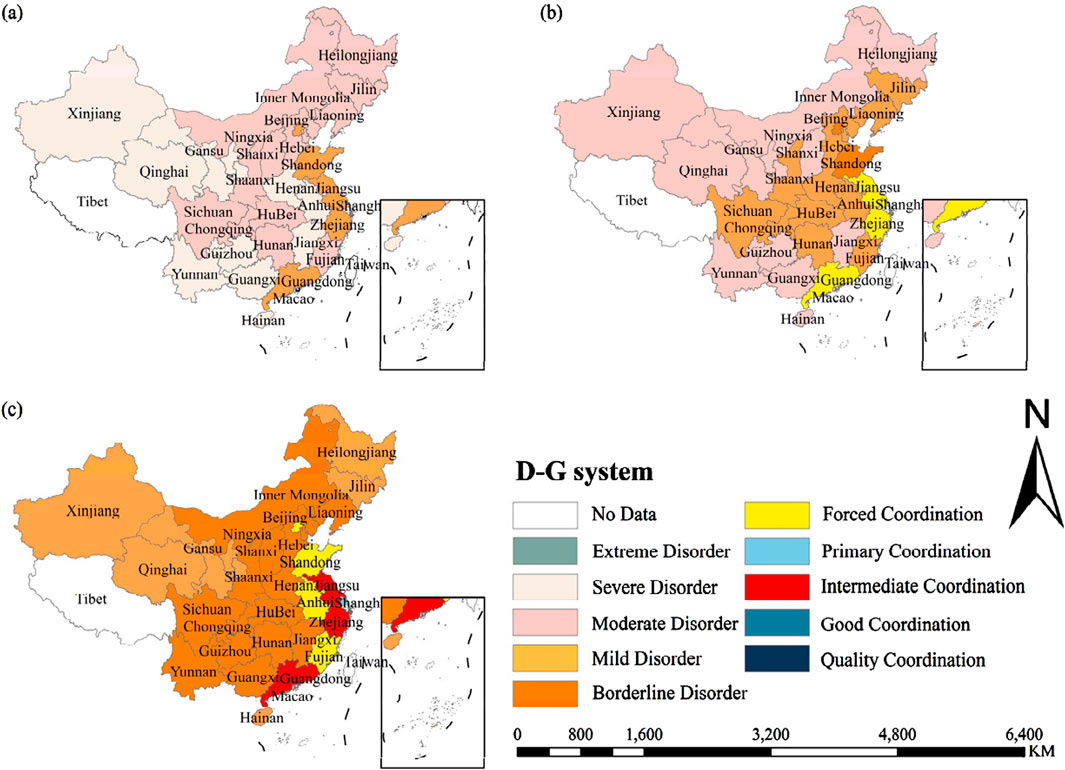
Figure 4. Visual map of D-G system in 2011, 2016, and 2020. (a) 2011. (b) 2016 (c) 2020.
4.2 Spatiotemporal evolution and trend prediction analysis of the D-G system
4.2.1 Dynamic evolution analysis of the D-G system
To investigate the evolution process of the D-G system in China, this paper utilizes the kernel density estimation method for fitting data processing. The specific results are presented in Figure 5. Figure 5a illustrates the nationwide density curve waveform, which shifts to the right over time. The peak height decreases, the horizontal width widens, and the right tail lengthens year by year. These trends indicate that the D-G system across the country is constantly improving and showing “decentralization.” As depicted in Figures 5b–d, the density curves and waveforms in each region also shift to the right, indicating an improvement in the level of the value of the D-G system across all regions. The peak height in the eastern and western regions decreased significantly, indicating that the distribution of the D-G system in the eastern and central provinces (municipalities, autonomous regions) was more dispersed. In 2020, the western region exhibited a distinctive “hump” distribution, characterized by the simultaneous presence of a “main peak” and a “right peak.” This phenomenon aligns with the theory of “regional economic differentiation and agglomeration,” indicating that the western region has gradually formed several development and growth poles after the initial technological agglomeration and industrial agglomeration, further promoting inter-regional competition and cooperation (Wang and Kang, 2024).
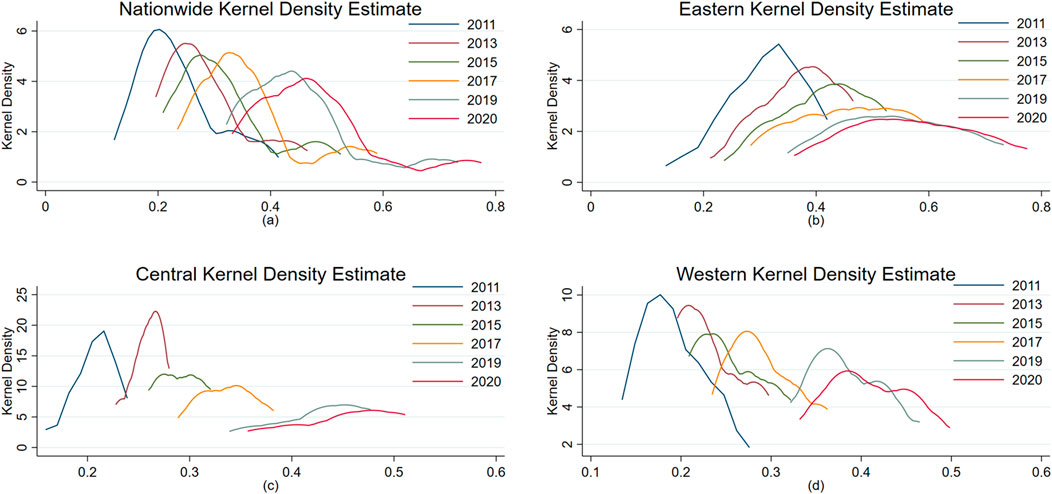
Figure 5. Nationwide, eastern, central and western kernel density estimation curves. (a) Nationwide. (b) Eastern (c) Central (d) Western.
4.2.2 Regional differences in coupling coordination
This paper employs the Dagum Gini coefficient decomposition method to investigate the D-G system’s regional differences further. Table 4 presents the overall, intra-regional, and inter-regional differences and their respective contribution rates for the D-G system in each region from 2011 to 2020. As observed in Table 4, it can be observed that the overall difference value of China’s D-G system declined from 0.160 to 0.127 between 2011 and 2020, indicating that the policies and measures implemented for the D-G system have yielded phased results in recent years, resulting in a decreasing trend in overall differences. This result may be due to the guidance of government policies to accelerate the synchronization of digital technology with management technology, green investment, and capital accumulation, thus further promoting the synergies between the two. The adjustment and upgrading of the industrial structure of the manufacturing industry, coupled with the role of economies of scale and network effects, also makes the combination of digital technology and MGT increasingly close. Regarding intra-regional differences, variations within the eastern and central regions have expanded, with the most significant differences observed within the eastern region. In contrast, the western region experienced a notable reduction in regional differences, decreasing from 0.098 to 0.074. This result may be because the eastern region is the most economically developed region, with a higher concentration of investment in digital technology and management. However, due to the uneven development of different cities and industries, there is a significant gap between the leading positions of some regions in technological innovation and green development and other places, resulting in increased internal differences. The central region faces a slower transformation process; some places rely on traditional energy and heavy industry, digital technology and MGT are less coupled, and internal differentiation is intensified. The sharp decline in differences in the western region may be related to the country’s increased policy support, green technology investment, and digital infrastructure construction in the western region in recent years, which has led to the improvement of the overall development level, making the regions with significant gaps gradually narrow the differences, and promoting the overall coordinated development of the western region (Zhuo and Deng, 2020; Liu et al., 2023).
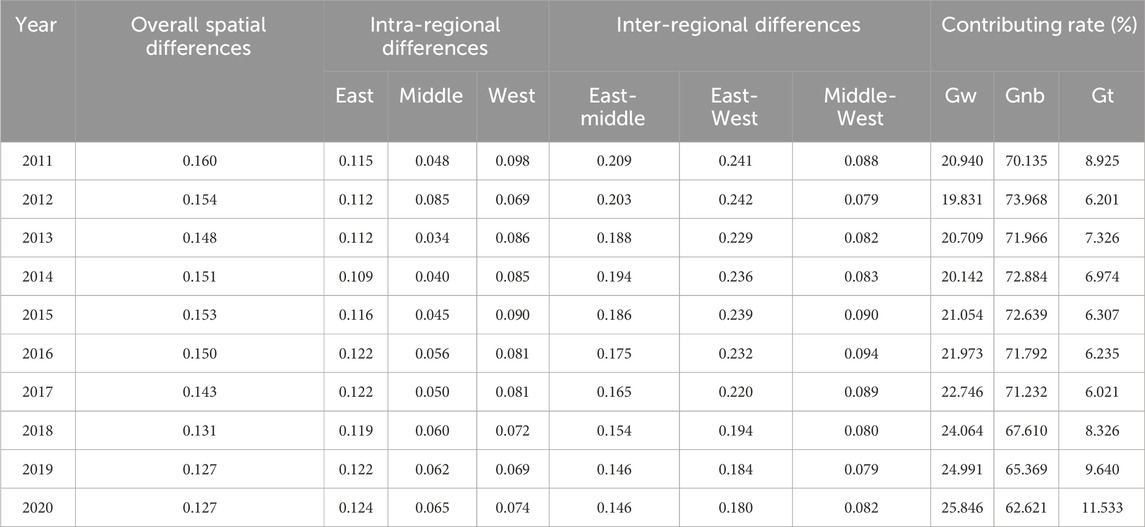
Table 4. Spatial differences and source decomposition results of the D-G system in China from 2011 to 2020.
From the perspective of inter-regional differences, the eastern region shows a high level of D-G system, which is significantly different from other regions. On the contrary, the D-G system level in the central and western regions is similar, and the difference is relatively small. However, there is a clear trend of narrowing the gap between different regions. Regarding contribution to the Gini coefficient, inter-regional differences make the most significant contribution to the overall difference, accounting for 62%–74% from 2011 to 2020. Intra-regional variation ranks second, accounting for 20 to 25 percent of the overall variation. The super variable density contributed the least, accounting for only about 10% of the total difference. This situation may be due to the popularity of digital technology, the gradual lowering of the technical application threshold, and the gradual introduction of digital technology and green technology in the central and western regions, thus improving the coupling degree of the two. The increasing market demand for green products and environmental pressure have forced various places to speed up the transformation and promote the integration of digital technology and the MGT. Investment flow, industrial transfer, and talent flow have also promoted the process of digitalization and green development in the central and western regions, narrowing the gap between the eastern regions. The inter-regional difference is the main reason for the overall difference in the D-G system. It may be related to the inconsistency between the starting point, process, and effect of digital transformation and green development in eastern, central, and western regions. However, this regional difference is gradually narrowing with the popularization of digital technology and the continuous advancement of the MGT (Li and Song, 2022).
4.2.3 Global spatial autocorrelation
In this paper, the spatial autocorrelation method is utilized to comprehensively analyze the spatial distribution characteristics of the D-G system. Table 5 presents the
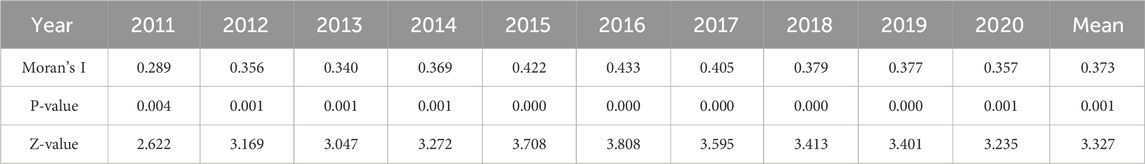
Table 5. D - G systems from 2011 to 2020
4.2.4 Local spatial autocorrelation
Considering that the global
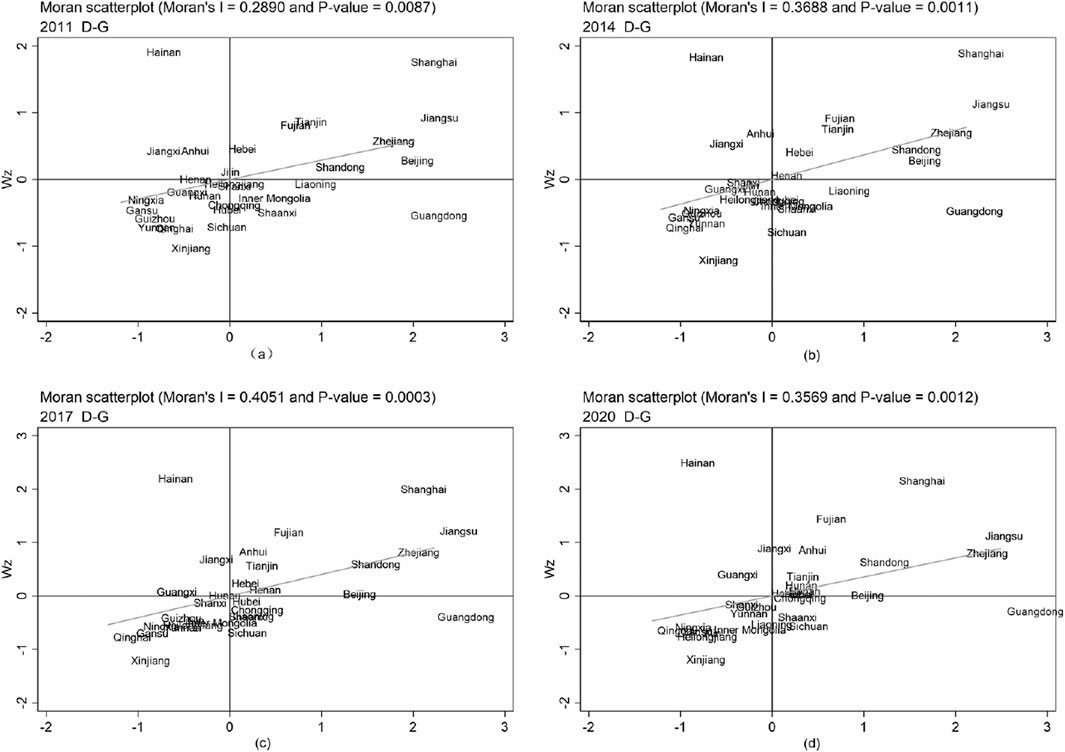
Figure 6. Moran scatter plot of the D-G system in 2011, 2014, 2017, and 2020. (a) 2011. (b) 2014 (c) 2017 (d) 2020.
4.2.5 Spatial evolution trend of the D-G system
The spatial autocorrelation analysis revealed significant spatial correlation in the evolution of the D-G system. Hence, this paper can introduce a spatial Markov chain to examine the state transition characteristics of the D-G system of the individual under the influence of spatial interactions. Based on the classification criteria of state types mentioned earlier (Table 1), this paper divides the D-G system state types into three adjacent but non-overlapping state stages: the unacceptable stage (0∼0.4), the transition stage (0.4∼0.6), and the acceptable stage (0.6∼1). Consequently, the transition probability matrix for the three state types is calculated.
Table 6 presents the probability transition matrix obtained from the traditional Markov chain analysis. The diagonal values represent the probability of each state type maintaining its original state, while the non-diagonal values represent the probability of state type shifts in different categories. The results in Table 6 indicate that the diagonal values are significantly larger than the non-diagonal values, with a minimum value of 0.8867. This result implies that the probability of the D-G system’s remaining unchanged state type is above 88.67%. Although the non-diagonal values are not all zero, with a maximum value of 0.1133, it suggests that the probability of the D-G system state-type shifting does not exceed 11.33%. These findings demonstrate the stability of the state types of the D-G system. The probability of the state type of the D-G system transferring to a higher type is higher than that of the state type transferring to a lower type. However, the highest probability does not exceed 11.33%, indicating that while the D-G system level is more likely to transition to a higher state type, achieving such a transition in the short term is challenging. In Table 6, In addition, as the value on the diagonal in Table 6 gradually increases from 88.67% of the unacceptable stage to 100% of the acceptable stage, and the probability of upward transfer is greater than that of downward transfer, it reflects some extent that the D-G system of each province (municipalities, autonomous regions) is likely to converge to the acceptable stage in the development. Therefore, “club convergence” exists in D-G system state types.
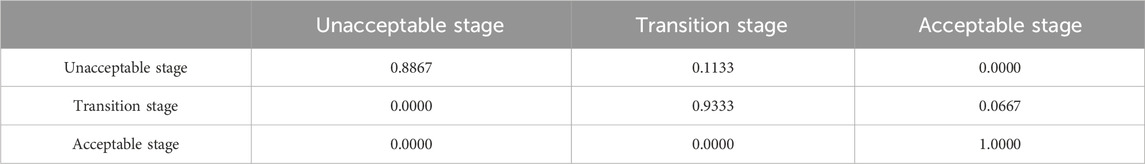
Table 6. D-G system from 2011 to 2020 traditional Markov chain transition probability matrix.
Table 7 shows the spatial Markov chain probability transfer matrix obtained based on the Queen adjacency structure. The introduction of the spatial lag concept reveals a significant correlation between the transfer of the D-G system’s state type and the neighboring regions’ state type, which shows that different neighborhood backgrounds influence the transfer probabilities of the D-G system state type. For provinces (municipalities, autonomous regions) with a neighborhood background in the transition stage, the probability of upward transitions in the D-G system is greater compared to provinces (municipalities, autonomous regions) with a neighborhood background in the unacceptable stage. For instance, P12(2) = 0.4500 > P12(1) = 0.0773, P23(2) = 0.0571 > P23(1) = 0.0435. This phenomenon underscores the crucial role played by the background conditions of neighboring provinces (municipalities, autonomous regions) in the dynamic evolution within the D-G system. Provinces (municipalities, autonomous regions) with a high coupling coordination degree will have positive spillover effects on neighboring provinces (municipalities, autonomous regions).
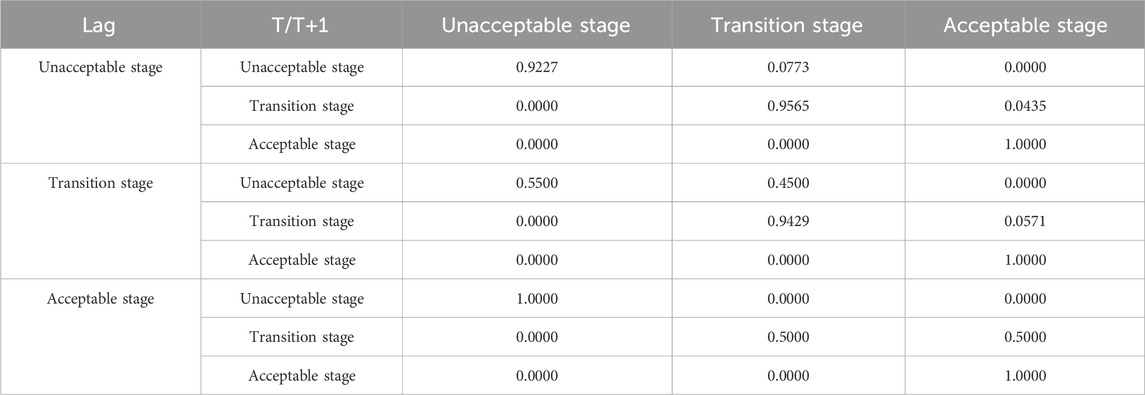
Table 7. Transition probability matrix of spatial Markov chain of the D-G system from 2011 to 2020.
From a spatial perspective, the spatial Markov chain probability transfer matrix further reveals the existence of the “club convergence” phenomenon. When the neighborhood background is in the unacceptable stage, there is still a small probability for the D-G system of provinces (municipalities, autonomous regions) to transition to a higher stage. When the neighborhood background is in the transition stage, provinces (municipalities, autonomous regions) in the unacceptable stage have a 45% probability of transitioning to the transition stage. In this background, the provinces (municipalities, autonomous regions) in the transition stage are more likely to transition to the acceptable stage. However, when the neighborhood background is in the acceptable stage, provinces (municipalities, autonomous regions) in the unacceptable stage cannot transition to a higher stage. This result could be attributed to the relatively large development gap between provinces (municipalities, autonomous regions) in the unacceptable stage and those in the acceptance stage. The siphon effect produced by the districts in the acceptable stage will attract various production factors from other provinces (municipalities, autonomous regions) and further hinder the D-G system in the districts in the unacceptable stage. Conversely, districts in the transition stage receive positive spillover effects from the neighborhood in the acceptable stage. There is a 50% probability of transitioning to the acceptable stage, ultimately leading to the formation of the “club convergence” phenomenon. This result may be due to inter-regional technology spillover, market linkage, policy diffusion, and the siphon effect. Therefore, the progress of D-G systems in a certain region will not only directly affect its digital technology application and green transformation of manufacturing but also indirectly affect the development of surrounding regions.
5 Conclusions and suggestions
5.1 Conclusions
This paper studies the D-G system in 30 provinces (municipalities, autonomous regions) of China from 2011 to 2020. The results show that the coupling coordination degree of digital technology and green transformation has continued to increase nationwide, with obvious regional differences, presenting a spatial pattern of “high in the east and low in the west.” Analysis shows that the regional gap of the D-G system is gradually narrowing, but the imbalance between regions still exists and targeted policy intervention is needed. The spatial correlation pattern shows a strong positive correlation, especially in coastal provinces where obvious “high-high” clustering has formed. The Markov chain results show that the D-G system exhibits the evolutionary characteristics of proximity dependence and has an obvious “club convergence” trend, that is, being close to advanced regions is conducive to upward development and transformation.
5.2 Suggestions
This paper puts forward the following countermeasures to enhance the D-G system and reduce regional disparities:
(1) Actively leveraging the guiding role of the government. Governments should actively implement the Overall Layout Plan for the Construction of Digital China and the 14th Five-Year Plan for the Deeply Integrated Development of Informatization and Industrialization to accelerate digital technology development. Through the establishment of special funds to support enterprises in carrying out green technology research and development and cooperation, the “trial and error tolerance” risk of enterprise transformation and upgrading is reduced. In addition, governments at all levels should also speed up the integration of cloud computing, big data, and other new-generation information technology with traditional manufacturing, formulate incentive policies for actively transforming industries, and moderately increase the pressure on the development of conventional manufacturing production, to force the transformation of manufacturing to digital, high-end, and green development.
(2) Strengthen cross-regional and cross-departmental exchanges. Local governments or associations can achieve cross-regional exchanges and cooperation between enterprises by building digital technology-sharing platforms. By establishing industrial alliances, we will promote deep cooperation in manufacturing, information technology, and environmental protection to promote society’s green transformation and development process. At the same time, governments at all levels should actively encourage cooperation between universities, scientific research institutions, and enterprises and alleviate the employment pressure that may arise in the transformation process by cultivating interdisciplinary talents and helping employees adapt to the application of digital and green technologies.
(3) Implement differentiated policies. Improve local development assessment files and organize specific institutions to observe the development of digital technology and the MGT in various regions. The performance is that the eastern region consolidates the advantages of digital technology and manufacturing development, leads the research and development of cutting-edge technologies, optimizes the restructuring of the manufacturing industry chain, and exerts the radiation effect of developed regions. The central region will strengthen investment in digital technology development, implement the strategy of sustainable development of the manufacturing industry, give full play to regional advantages, and actively carry out exchanges and strategic cooperation with the eastern region. The Western region closely follows the project of “counting in the East and counting in the West,” actively cooperates with the “Made in China 2025” strategy, and rationally undertakes the industrial transfer of developed coastal areas by the “Industrial Transfer Guidance Catalogue.”
5.3 Limitations and prospects
This paper constructs an index system to measure the coordinated development level of digital technology and the MGT. However, due to the system’s complexity and data availability, the index system may not be comprehensive enough. Secondly, due to space limitations, this paper does not study the spatial concentration index of the D-G system and the driving factors affecting the level of the D-G system. These issues will be discussed in future studies.
Data availability statement
The original contributions presented in the study are included in the article/Supplementary Material, further inquiries can be directed to the corresponding author.
Author contributions
XH: Conceptualization, Data curation, Formal Analysis, Methodology, Visualization, Writing – original draft. HD: Conceptualization, Funding acquisition, Writing – review and editing.
Funding
The author(s) declare that financial support was received for the research and/or publication of this article. This work was supported by the National Social Science Foundation’s Late 2022 Grant Project (22FJLB006).
Conflict of interest
The authors declare that the research was conducted in the absence of any commercial or financial relationships that could be construed as a potential conflict of interest.
Generative AI statement
The authors declare that no Generative AI was used in the creation of this manuscript.
Publisher’s note
All claims expressed in this article are solely those of the authors and do not necessarily represent those of their affiliated organizations, or those of the publisher, the editors and the reviewers. Any product that may be evaluated in this article, or claim that may be made by its manufacturer, is not guaranteed or endorsed by the publisher.
Supplementary material
The Supplementary Material for this article can be found online at: https://www.frontiersin.org/articles/10.3389/fenvs.2025.1516452/full#supplementary-material
References
Axenbeck, J., Berner, A., and Kneib, T. (2024). What drives the relationship between digitalization and energy demand? Exploring heterogeneity in German manufacturing firms. J. Environ. Manage. 369, 122317. doi:10.1016/j.jenvman.2024.122317
Bai, D., Hu, J., Irfan, M., and Hu, M. (2023). Unleashing the impact of ecological civilization pilot policies on green technology innovation: evidence from a novel SC-DID model. Energy Econ. 125, 106813. doi:10.1016/j.eneco.2023.106813
Barnewold, L., and Lottermoser, B. G. (2020). Identification of digital technologies and digitalisation trends in the mining industry. Int. J. Min. Sci. Technol. 30, 747–757. doi:10.1016/j.ijmst.2020.07.003
Chen, X., and Yang, N. (2024). How does business environment affect firm digital transformation: a fsQCA study based on Chinese manufacturing firms. Int. Rev. Econ. and Finance 93, 1114–1124. doi:10.1016/j.iref.2024.03.071
Chen, Y., Li, Q., and Liu, J. (2024). Innovating sustainability: VQA-based AI for carbon neutrality challenges. J. Organ. End User Comput. (JOEUC) 36, 1–22. doi:10.4018/JOEUC.337606
Dagum, C. (1997a). A new approach to the decomposition of the Gini income inequality ratio. Empir. Econ. 22, 515–531. doi:10.1007/BF01205777
Dagum, C. (1997b). Decomposition and interpretation of Gini and the generalized entropy inequality measures. Statistica 57, 295–308. doi:10.6092/issn.1973-2201/1060
Dai, X., and Yang, S. (2022). Digital empowerment, source of digital input and green manufacturing. China Ind. Econ., 83–101. doi:10.19581/j.cnki.ciejournal.2022.09.004
Ejaz, M. R. (2024). Smart manufacturing as a management strategy to achieve sustainable competitiveness. J. Knowl. Econ. 15, 682–705. doi:10.1007/s13132-023-01097-z
Fang, X., and Liu, M. (2024). How does the digital transformation drive digital technology innovation of enterprises? Evidence from enterprise’s digital patents. Technol. Forecast. Soc. Chang. 204, 123428. doi:10.1016/j.techfore.2024.123428
Fu, Y., Supriyadi, A., Wang, T., Wang, L., and Cirella, G. T. (2020). Effects of regional innovation capability on the green technology efficiency of China’s manufacturing industry: evidence from listed companies. Energies 13, 5467. doi:10.3390/en13205467
Gao, J., Shao, C., Chen, S., and Zhang, X. (2021). Spatiotemporal evolution of sustainable development of China’s provinces: a modelling approach. Ecosyst. Health Sustain 7, 1965034. doi:10.1080/20964129.2021.1965034
Ge, Y., Xia, Y., and Wang, T. (2024). Digital economy, data resources and enterprise green technology innovation: evidence from A-listed Chinese Firms. Resour. Policy 92, 105035. doi:10.1016/j.resourpol.2024.105035
Gong, Q., Wu, J., Jiang, Z., Hu, M., Chen, J., and Cao, Z. (2024). An integrated design method for remanufacturing scheme considering carbon emission and customer demands. J. Clean. Prod. 476, 143681. doi:10.1016/j.jclepro.2024.143681
Guo, Q., Yao, N., Ouyang, Z., and Wang, Y. (2024). Digital development and innovation for environmental sustainability: the role of government support and government intervention. Sustain. Dev. 32, 3389–3404. doi:10.1002/sd.2854
Han, X., Wang, Y., Yu, W., and Xia, X. (2023). Coupling and coordination between green finance and agricultural green development: evidence from China. Financ. Res. Lett. 58, 104221. doi:10.1016/j.frl.2023.104221
He, X., and Xie, Z. (2024). The impact of air pollution on green investments: green preference and investor sentiment. J. Environ. Manage. 366, 121824. doi:10.1016/j.jenvman.2024.121824
Hu, F., Qiu, L., Wei, S., Zhou, H., Bathuure, I. A., and Hu, H. (2024). The spatiotemporal evolution of global innovation networks and the changing position of China: a social network analysis based on cooperative patents. R and D Manag. 54, 574–589. doi:10.1111/radm.12662
Huang, F., and Ren, Y. (2024). Harnessing the green frontier: the impact of green finance reform and digitalization on corporate green innovation. Finance Res. Lett. 66, 105554. doi:10.1016/j.frl.2024.105554
Huang, G., Liu, S., Cai, B., and Wang, B. (2024). The coupling coordination of social and economic upgrading in China: evolution, regional disparities and influencing factors. J. Geogr. Sci. 34, 835–854. doi:10.1007/s11442-024-2229-8
Huang, J., Luan, B., He, W., Chen, X., and Li, M. (2022). Energy technology of conservation versus substitution and energy intensity in China. Energy 244, 122695. doi:10.1016/j.energy.2021.122695
Huo, H., and Wang, Y. (2023). Research on the evolutionary game of multi-agent collaborative supervision of enterprise green behavior driven by big data. Front. Environ. Sci. 11, 1326322. doi:10.3389/fenvs.2023.1326322
Huo, P., and Wang, L. (2022). Digital economy and business investment efficiency: inhibiting or facilitating? Res. Int. Bus. Financ. 63, 101797. doi:10.1016/j.ribaf.2022.101797
Li, C., and Song, L. (2022). Regional differences and spatial convergence of green development in China. Sustainability 14, 8511. doi:10.3390/su14148511
Li, M., Li, Z., Huang, X., and Qu, T. (2021). Blockchain-based digital twin sharing platform for reconfigurable socialized manufacturing resource integration. Int. J. Prod. Econ. 240, 108223. doi:10.1016/j.ijpe.2021.108223
Li, W., Cai, J., Zhu, Y., Li, J., and Li, Z. (2024a). Can digital finance development drive green transformation in manufacturing? Evidence from China. Environ. Sci. Pollut. Res. 31, 23876–23895. doi:10.1007/s11356-024-32402-1
Li, Z., Liu, C., Li, W., Chen, J., and Kang, Y. (2024b). The impact of digital economy industry development on manufacturing innovation path driven by big data. IEEE Trans. Eng. Manag. 71, 5523–5535. doi:10.1109/TEM.2024.3362065
Lin, H., Zeng, S., Wang, L., Zou, H., and Ma, H. (2016). How does environmental irresponsibility impair corporate reputation? A multi-method investigation. Corp. Soc. Responsib. Environ. Manag. 23, 413–423. doi:10.1002/csr.1387
Liu, H., and Liang, D. (2013). A review of clean energy innovation and technology transfer in China. Renew. Sustain. Energy Rev. 18, 486–498. doi:10.1016/j.rser.2012.10.041
Liu, J., Puah, C.-H., Arip, M. A., and Jong, M.-C. (2023). Impacts of digital financial inclusion on urban–rural income disparity: a comparative research of the eastern and western regions in China. Economies 11, 282. doi:10.3390/economies11110282
Liu, J., Wang, H., Ho, H., and Huang, L. (2022). Impact of heterogeneous environmental regulation on manufacturing sector green transformation and sustainability. Front. Environ. Sci. 10, 938509. doi:10.3389/fenvs.2022.938509
Liu, N., Liu, C., Xia, Y., and Da, B. (2018). Examining the coordination between urbanization and eco-environment using coupling and spatial analyses: a case study in China. Ecol. Indic. 93, 1163–1175. doi:10.1016/j.ecolind.2018.06.013
Liu, Y., and Jiang, T. (2024). Research on the coupling coordination of digital economy and urban green development in the Yangtze River Delta of China. Environ. Res. Commun. 6, 095027. doi:10.1088/2515-7620/ad7704
Ma, R., Lin, Y., and Lin, B. (2023). Does digitalization support green transition in Chinese cities? Perspective from Metcalfe’s Law. J. Clean. Prod. 425, 138769. doi:10.1016/j.jclepro.2023.138769
Ma, S., Zhang, Y., Lv, J., Ren, S., Yang, H., and Wang, C. (2022). Data-driven cleaner production strategy for energy-intensive manufacturing industries: case studies from Southern and Northern China. Adv. Eng. Inf. 53, 101684. doi:10.1016/j.aei.2022.101684
Miao, Z., and Zhao, G. (2023). Configurational paths to the green transformation of Chinese manufacturing enterprises: a TOE framework based on the fsQCA and NCA approaches. Sci. Rep. 13, 19181. doi:10.1038/s41598-023-46454-9
Ning, J., Yin, Q., and Yan, A. (2022). How does the digital economy promote green technology innovation by manufacturing enterprises? Evidence from China. Front. Environ. Sci. 10, 967588. doi:10.3389/fenvs.2022.967588
Quan, Q., and Zhang, Z. (2022). [Retracted] supply capability evaluation of intelligent manufacturing enterprises based on improved BP neural network. J. Math. 2022, 1–8. doi:10.1155/2022/8572424
Ranta, V., Aarikka-Stenroos, L., and Vaisanen, J.-M. (2021). Digital technologies catalyzing business model innovation for circular economy-Multiple case study. Resour. Conserv. Recycl. 164, 105155. doi:10.1016/j.resconrec.2020.105155
Shi, J., and Su, Y. (2023). Behavioural strategies of manufacturing firms for high-quality development from the perspective of government participation: a three-part evolutionary game analysis. Heliyon 9, e14982. doi:10.1016/j.heliyon.2023.e14982
Sun, G., Fang, J., Li, J., and Wang, X. (2024). Research on the impact of the integration of digital economy and real economy on enterprise green innovation. Technol. Forecast. Soc. Chang. 200, 123097. doi:10.1016/j.techfore.2023.123097
Sun, Y. (2024). Digital transformation and corporates’ green technology innovation performance-The mediating role of knowledge sharing. Financ. Res. Lett. 62, 105105. doi:10.1016/j.frl.2024.105105
Tan, X., Li, H., Guo, J., Gu, B., and Zeng, Y. (2019). Energy-saving and emission-reduction technology selection and CO2 emission reduction potential of China’s iron and steel industry under energy substitution policy. J. Clean. Prod. 222, 823–834. doi:10.1016/j.jclepro.2019.03.133
Wang, H., and Kang, C. (2024). Digital economy and the green transformation of manufacturing industry: evidence from Chinese cities. Front. Environ. Sci. 12, 1324117. doi:10.3389/fenvs.2024.1324117
Wang, H., Wu, L., Peng, G., and Du, H. (2023). Micro-perspective of listed companies in China: digital development promotes the green transformation of the manufacturing industry. PLoS One 18, e0293474. doi:10.1371/journal.pone.0293474
Wang, J. (2023). The impact of investor communication on enterprise green innovation. Financ. Res. Lett. 57, 104158. doi:10.1016/j.frl.2023.104158
Wang, Z., Cao, X., Ren, X., and Taghizadeh-Hesary, F. (2024a). Can digital transformation affect coal utilization efficiency in China? Evidence from spatial econometric analyses. Resour. Policy 91, 104940. doi:10.1016/j.resourpol.2024.104940
Wang, Z., Zhang, T., Ren, X., and Shi, Y. (2024b). AI adoption rate and corporate green innovation efficiency: evidence from Chinese energy companies. Energy Econ. 132, 107499. doi:10.1016/j.eneco.2024.107499
Wu, Q., Li, Y., Wu, Y., Li, F., and Zhong, S. (2022). The spatial spillover effect of environmental regulation on the total factor productivity of pharmaceutical manufacturing industry in China. Sci. Rep. 12, 11642. doi:10.1038/s41598-022-15614-8
Xu, A., Siddik, A. B., Sobhani, F. A., and Rahman, Md. M. (2024). Driving economic success: fintech, tourism, FDI, and digitalization in the top 10 tourist destinations. Humanit Soc. Sci. Commun. 11, 1549. doi:10.1057/s41599-024-03978-3
Xu, Y., Li, J., Yan, Y., Gao, P., and Xie, H. (2022). Can coordinated development of manufacturing and information communication service industries boost economic resilience? An empirical study based on China’s provinces. Sustainability 14, 10758. doi:10.3390/su141710758
Yang, L., Lin, Y., Zhu, J., and Yang, K. (2023). Dynamic coupling coordination and spatial–temporal analysis of digital economy and carbon environment governance from provinces in China. Ecol. Indic. 156, 111091. doi:10.1016/j.ecolind.2023.111091
Yuan, S., and Pan, X. (2023). Inherent mechanism of digital technology application empowered corporate green innovation: based on resource allocation perspective. J. Environ. Manag. 345, 118841. doi:10.1016/j.jenvman.2023.118841
Zhang, H., Xu, L., Zhou, P., Zhu, X., and Cudjoe, D. (2024a). Coordination between economic growth and carbon emissions: evidence from 178 cities in China. Econ. Anal. Policy 81, 164–180. doi:10.1016/j.eap.2023.11.034
Zhang, L., Sun, H., Pu, T., Sun, H., and Chen, Z. (2024b). Do green finance and hi-tech innovation facilitate sustainable development? Evidence from the Yangtze River Economic Belt. Econ. Analysis Policy 81, 1430–1442. doi:10.1016/j.eap.2024.02.005
Zhang, Y. (2021). The regional disparity of influencing factors of technological innovation in China: evidence from high-tech industry. Technol. Econ. Dev. Econ. 27, 811–832. doi:10.3846/tede.2021.14828
Zhao, S., Guan, Y., Zhou, H., and Hu, F. (2024a). Making digital technology innovation happen: the role of the CEO’s information technology backgrounds. Econ. Model. 140, 106866. doi:10.1016/j.econmod.2024.106866
Zhao, S., Zhang, L., An, H., Peng, L., Zhou, H., and Hu, F. (2023). Has China’s low-carbon strategy pushed forward the digital transformation of manufacturing enterprises? Evidence from the low-carbon city pilot policy. Environ. Impact Assess. Rev. 102, 107184. doi:10.1016/j.eiar.2023.107184
Zhao, S., Zhang, L., Peng, L., Zhou, H., and Hu, F. (2024b). Enterprise pollution reduction through digital transformation? Evidence from Chinese manufacturing enterprises. Technol. Soc. 77, 102520. doi:10.1016/j.techsoc.2024.102520
Zhao, Y., and Zhou, Y. (2021). Measurement method and application of a deep learning digital economy scale based on a big data cloud platform. J. Organ. End User Comput. 34, 1–17. doi:10.4018/JOEUC.20220501.oa1
Zhen, J., Guo, Y., Wang, Y., Li, Y., and Shen, Y. (2025). Spatial-temporal evolution and driving factors of water-energy-food-ecology coordinated development in the Tarim River Basin. J. Hydrology Regional Stud. 58, 102288. doi:10.1016/j.ejrh.2025.102288
Zhou, X., Li, G., Wang, Q., and Zhou, D. (2024). U-shaped relationship between digitalization and low-carbon economy efficiency: mediation and spillover effects. J. Clean. Prod. 458, 142535. doi:10.1016/j.jclepro.2024.142535
Zhou, Y., Yang, Q., and Lu, S. (2023). Research on the identification and formation mechanism of the main path of digital technology diffusion: empirical evidence from China. Technol. Soc. 75, 102398. doi:10.1016/j.techsoc.2023.102398
Keywords: digital technology, manufacturing green transformation (MGT), coupled coordination, Dagum Gini coefficient, spatial Markov chain
Citation: Huang X and Deng H (2025) Spatiotemporal evolution and trend prediction of coupled coordination between digital technology and manufacturing green transformation from provinces in China. Front. Environ. Sci. 13:1516452. doi: 10.3389/fenvs.2025.1516452
Received: 24 October 2024; Accepted: 08 May 2025;
Published: 29 May 2025.
Edited by:
Otilia Manta, Romanian Academy, RomaniaReviewed by:
Mohamed R. Abonazel, Cairo University, EgyptYan Zheng, Hainan University, China
Fatih Celebioglu, University of Marburg, Germany
Copyright © 2025 Huang and Deng. This is an open-access article distributed under the terms of the Creative Commons Attribution License (CC BY). The use, distribution or reproduction in other forums is permitted, provided the original author(s) and the copyright owner(s) are credited and that the original publication in this journal is cited, in accordance with accepted academic practice. No use, distribution or reproduction is permitted which does not comply with these terms.
*Correspondence: Hongbing Deng, ZGVuZzExNUBjdWcuZWR1LmNu