 Zhijie Hao
 Xiaotian Wang
- 1Business School, Jiangsu Open University, Nanjing, China
- 2College of Energy Engineering, Zhejiang University, Hangzhou, China
Considering the backdrop of indirect carbon emissions, this paper aims to examine the patterns and influencing factors of total factor carbon emission productivity (TFCEP) in China’s manufacturing sub-sectors and propose policy recommendations for improving carbon emission performance. Based on empirical data from China’s manufacturing industry from 2005 to 2020 (covering the 11th Five-Year Plan (FYP) to the 13th FYP), this paper combines direct and indirect carbon emissions to present a more comprehensive formula for calculating sectoral CO2 emissions. The global Malmquist–Luenberger (GML) productivity index is used to calculate TFCEP, followed by an analysis of the influencing factors using a mixed regression model. Despite an average annual increase of 3.4% in the TFCEP of the overall manufacturing sector, contributing 34.7% to output growth, comparative analysis indicates a decline in the sector’s overall TFCEP across the three FYPs. The TFCEP decomposition index of the manufacturing sub-sectors shows industry heterogeneity. Empirical analyses have proven that technological innovation and environmental regulatory policies are the most effective means to enhance TFCEP and may serve as the primary leverage to achieve the “dual carbon” goals. The level of electrification is innovatively introduced to characterize the energy structure, and its relationship with TFCEP exhibits an inverted U-shaped curve. This finding suggests that electrification policies should be tailored to the specific electrification stage of each industry.
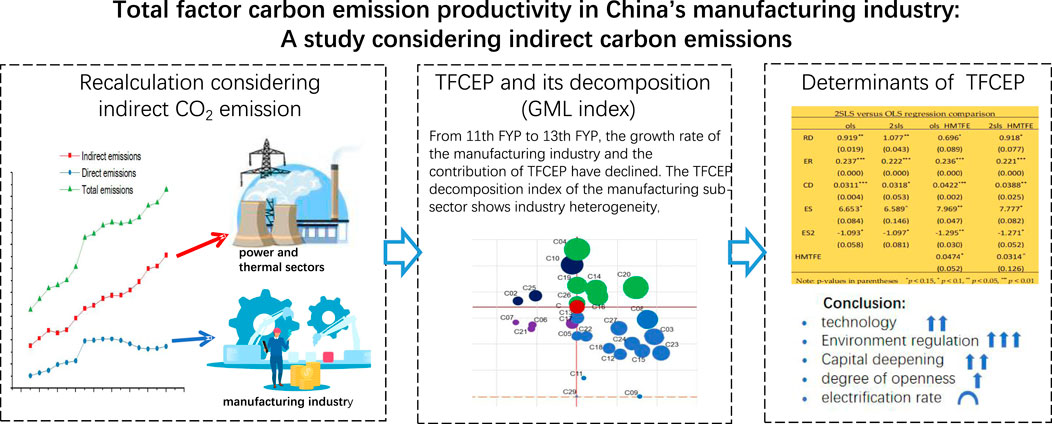
GRAPHICAL ABSTRACT |
1 Introduction
As global climate change and environmental degradation intensify, the transition to low-carbon energy systems has become a critical strategy for nations worldwide to mitigate these challenges. Among these efforts, achieving “carbon neutrality” has emerged as a central goal, particularly for countries with significant carbon footprints. China, as the world’s largest carbon emitter (IEA, 2024), plays a pivotal role in global climate governance. Its commitment to peaking carbon emissions by 2030 and achieving carbon neutrality by 2060 (People’s Daily, 2021) represents not only a strategic national policy but also a significant contribution to global climate goals. China has made significant progress in reducing its carbon emission intensity (CEI), achieving a 48.4% decrease from 2005 to 2020 (Xinhua News Agency, 2022). However, the decoupling of economic growth from carbon emissions remains incomplete, particularly in the manufacturing sector, which accounts for a substantial proportion of China’s energy consumption and carbon emissions. This underscores the need for a more nuanced understanding of the factors driving carbon emissions in this sector.
From the perspective of energy consumption and CO2 emissions (see Figure 1a), direct CO2 emissions from China’s manufacturing industry (MCE) have been decreasing year by year since 2011, but indirect emissions are still increasing along with economic progress. As a result, total MCE remain on an upward trend. As shown in Figure 1b, the intensities of energy consumption and CO2 emissions have significantly decreased. However, despite decades of rapid growth in the manufacturing industry’s GDP, carbon emissions have not been decoupled from economic expansion (Wang and Su, 2020; Wu and Wan, 2024), resulting in a continued increase in CO2 emissions. As the world’s largest carbon emitter, China’s carbon emissions primarily originate from its manufacturing sectors. The manufacturing industry plays a pivotal role in achieving the dual carbon goals. Therefore, it is crucial to analyze the factors influencing carbon emissions and emission efficiency in manufacturing and identify effective pathways for carbon emission reduction.
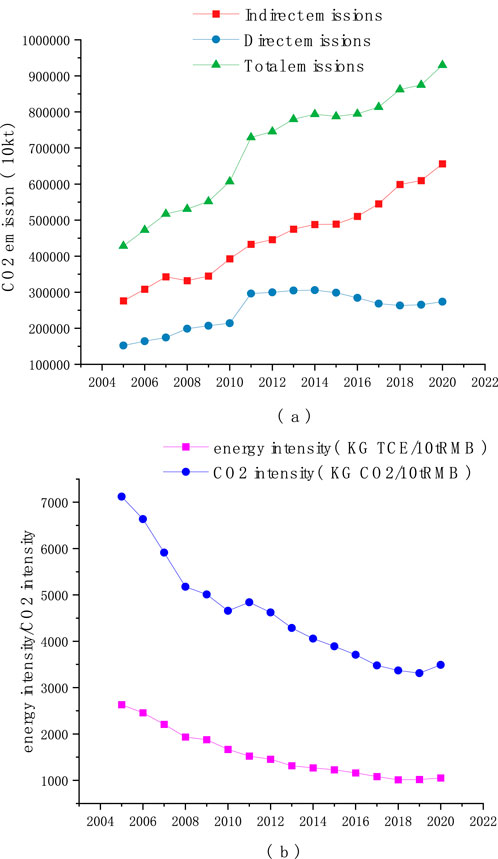
Figure 1. (a) CO2 emissions from China’s manufacturing sector; (b) intensity of China’s energy and CO2. CO2 emissions are calculated using formulas 1–3 provided in Section 3 and based on data from the China Energy Statistical Yearbook. Energy consumption data are sourced from the China Statistical Yearbook.
Although there is an abundance of research on carbon emissions and energy efficiency, existing studies often ignore the comprehensive analysis of both direct and indirect carbon emissions, particularly at the industry level. This gap results in limitations and one-sidedness in the study of carbon emissions and energy efficiency, which may impact the precision of policy formulation. This study addresses these gaps by uniquely combining direct and indirect carbon emissions to provide a comprehensive assessment of MCE at the industry level. Focusing on the period from 2005 to 2020, this study employs the global Malmquist–Luenberger (GML) index to calculate TFCEP and analyze its influencing factors using a mixed regression approach.
The contributions of this study are threefold. First, it provides a holistic framework for calculating MCE by integrating both direct and indirect emissions, thus addressing the limitation in the existing literature. Second, it introduces the electrification level as a key indicator of energy structure at the industrial level and reveals an inverted U-shaped curve relationship between the electrification level and TFCEP. This finding suggests that electrification policies should be tailored to the specific electrification stage of each industry. Third, it not only highlights the role of technological innovation and environmental regulation but also emphasizes the importance of energy supply-side measures, such as reducing fossil fuel use and developing smart energy systems, to complement demand-side strategies. These findings not only deepen the professional understanding of carbon emissions and their efficiency but also offer a scientific foundation for policymakers to design more effective carbon reduction strategies. This contributes to China’s efforts to achieve its dual carbon goals and actively participate in global climate governance. Moreover, the insights gained may serve as valuable references for other countries.
The remainder of this study is organized as follows: Section 2 provides a literature review, and Section 3 details the data calculation and analytical methods, including the calculation of sub-sectors carbon emissions, the measurement and decomposition of TFCEP, and the regression model for the influencing factors. Section 4 presents the results and discussion. Finally, Section 5 summarizes the main findings and proposes policy recommendations for improving carbon emission performance (CEP), along with their global applicability. Table 1 presents the abbreviations frequently used throughout this article.
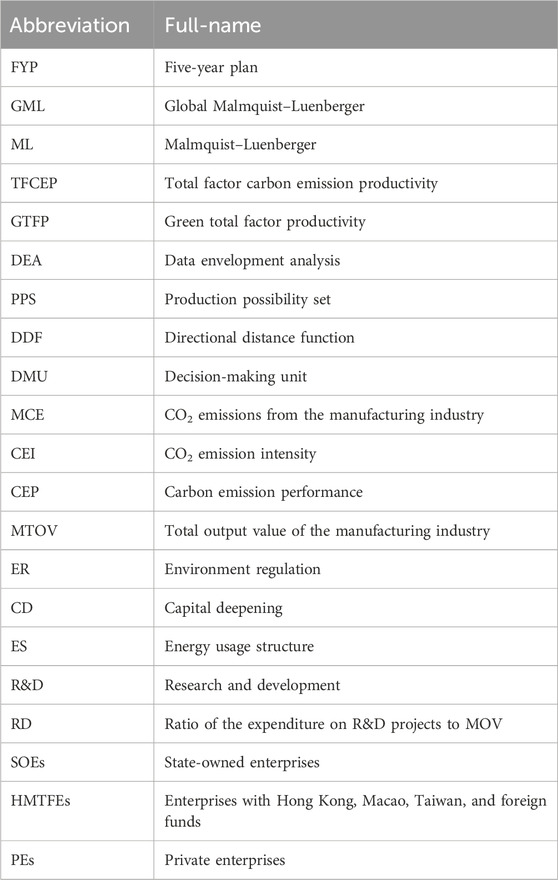
Table 1. Abbreviations frequently used in this article.
2 Literature review
2.1 Theoretical studies
Currently, researchers are highly concerned with addressing various issues in the fields of energy and environment. The theoretical research on CEP primarily focuses on the conceptual framework and measurement methods of carbon emissions and their efficiency, particularly within the context of the manufacturing industry. In performance measurement frameworks that account for both expected and unexpected outputs, the non-parametric data envelopment analysis (DEA) model demonstrates superior capability over parametric methods by effectively addressing challenges related to irregular data and inconsistent variable dimensions (Zhou et al., 2017). Different types of DEA methods have become the most common estimation methods for environmental-sensitive productivity and its growth recently (Sueyoshi et al., 2017; Zhou et al., 2008). Regarding DEA methods, Chung et al. (1997) employed the directional distance function (DDF) in the Malmquist index and created the Malmquist–Luenberger (ML) productivity method, which facilitates calculation and decomposition. Oh (2010) proposed the GML index, which employed the global production possibility set (PPS). Compared with the ML index, the GML index overcomes the disadvantages of spurious technical regression and problems without feasible solutions in cross-period DDF (Oh and Heshmati, 2010). It can estimate TFCEP more accurately and therefore has widespread applications. A multi-hierarchy meta-frontier DEA method was introduced by Feng et al. (2017), and a global multi-hierarchy meta-frontier DEA model was proposed by Yang et al. (2020), which can assess the heterogeneity in CEP measurement.
2.2 Empirical research
Given this study’s focus on carbon emission performance in China’s manufacturing sector, this paper categorizes the empirical literature on manufacturing CEP into three levels based on research scope: regional, industrial, and national. Studies at the regional level generally focus on the measurement and comparison of CEP across different provinces or regions in China. At the industrial level, studies calculate and decompose CEP across manufacturing sub-sectors, with some research extending the analysis to provincial-level sub-industries. The cross-country study encompasses both developed economies (e.g., the EU and the United States) and developing nations, thus offering diverse research perspectives. Research at the national level outside China includes studies on the factors influencing carbon emissions in different countries. A synopsis of various research studies on CEP is shown in Table 2.
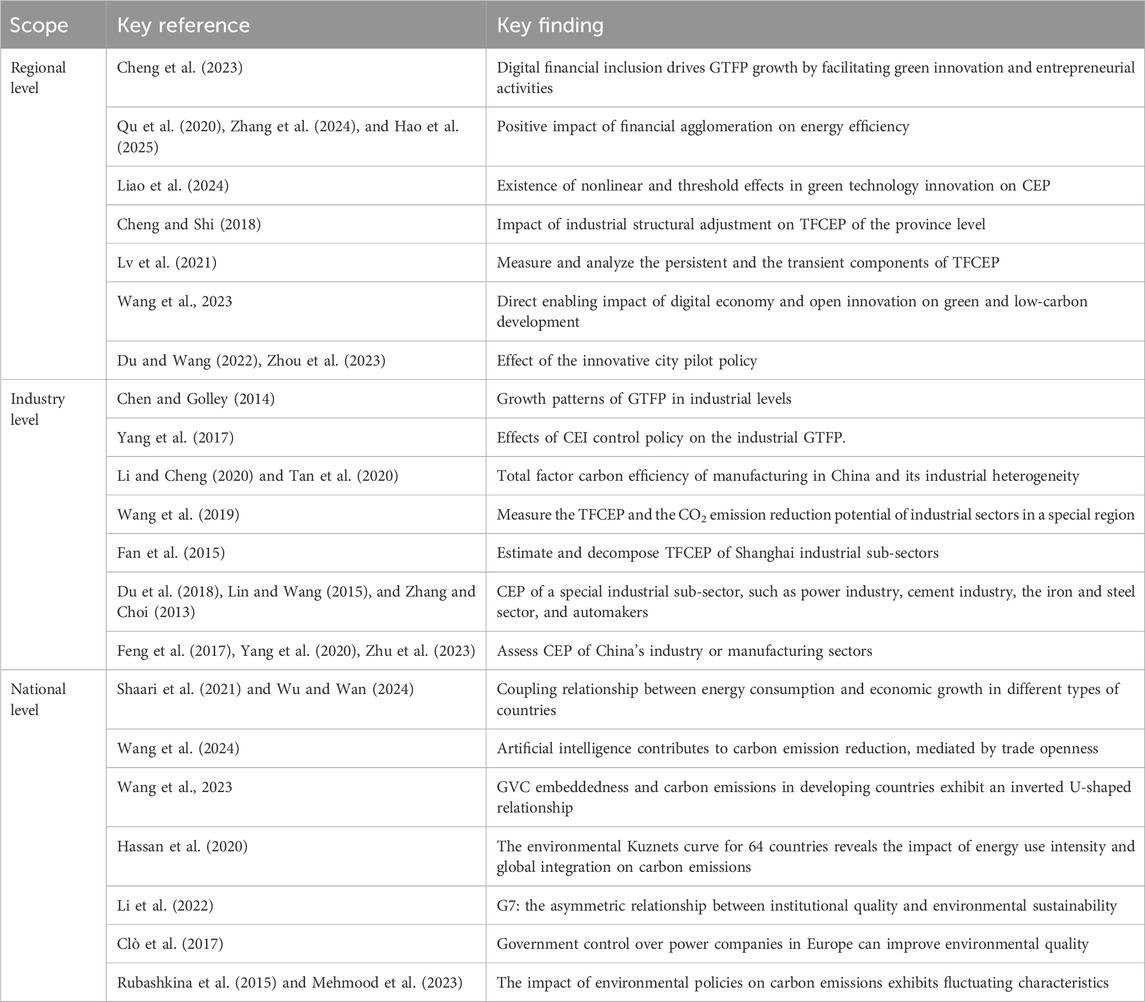
Table 2. Synopsis of various research studies on CEP.
The influencing factors of carbon emission performance in the manufacturing sector have remained a persistent research priority in environmental economics literature. Technological innovation represents the first key determinant. Fan et al. (2015) and Zhu et al. (2023) decomposed TFCEP and identified technological change and technical efficiency change as the primary drivers of TFCEP variation. Chen and Golley (2014) demonstrated that R&D intensity exerts a significant positive impact. Specifically, Liao et al. (2024) revealed the nonlinear impact of green technology innovation on carbon CEP. Furthermore, renewable energy innovation typically interacts with other factors to jointly influence regional TFCEP (Su et al., 2023).
Environmental regulation policies have demonstrated significant impacts on carbon emission performance (Afshan et al., 2023; Shao et al., 2019; Tan et al., 2020; Yang et al., 2017). Furthermore, Wang and Shen (2016) revealed an industry-specific “inverted U-shaped” relationship between environmental regulation intensity and energy productivity. Hu and Xiong (2021) empirically demonstrated threshold effects in environmental regulations, substantiating the same viewpoint. Other energy-saving policies, such as promoting energy-efficient technologies, eliminating outdated production capacity, and reducing overcapacity, are necessary measures for improving green performance (Li and Lin, 2016).
From a capital deepening perspective, empirical studies reveal that industries with higher capital–labor ratios exhibit systematically lower growth rates of GTFP (Chen and Golley, 2014; Fan et al., 2015). Subsequent research has yielded varying conclusions, suggesting that capital deepening has a facilitative effect on carbon emission performance (Shao et al., 2016; Faisal et al., 2021). Tu et al. (2024) revealed that while every 1% enhancement in industrial intelligence level boosts local CEP by 2.747%, it simultaneously creates adverse spillover effects on the neighboring regions’ emission performance.
The digital economy’s growing role in facilitating green and low-carbon development has garnered significant scholarly attention (Allal-Chérif et al., 2023; Wang et al., 2025; Zhang et al., 2024). Empirical research by Qin et al. (2023) identified a direct enabling impact of the digital economy and open innovation on green and low-carbon development. Additionally, comparative institutional analyses (Xie et al., 2017; Cheng and Kong, 2022) revealed that both command-and-control and market-based regulatory approaches offer unique context-dependent advantages for governing industrial emissions. Sun et al. (2023) empirically demonstrated that the relationship between GVC embeddedness and carbon emissions in developing countries follows an inverted U-shaped curve.
2.3 Identification of literature gaps
The evaluation and investigation of CEP, particularly in China’s manufacturing sector, have advanced significantly, yet several gaps persist in the literature. First, findings on policy effectiveness are inconsistent, with some studies showing that strict environmental regulations and government ownership improve TFCEP, while others show minimal impact, indicating a need for a deeper analysis of policy design and implementation. Second, indirect emissions are often overlooked. Many studies focus only on direct CO2 emissions from industrial activities and neglect significant indirect emissions from electricity and heat consumption, leading to incomplete assessments. Meanwhile, estimating energy structures based solely on direct fossil fuel consumption is inaccurate as it overlooks the broader context of emissions. Third, the distinction between the energy demand-side and supply-side is frequently ignored, particularly in efficiency analyses of the industrial sector, which includes energy production and supply sub-sectors. This conflation hinders a detailed understanding of emission patterns and their drivers.
To address these gaps, this article recalculates MCE based on more comprehensive data and analyzes CEP from the perspective of the main energy demand side, offering a more realistic assessment. Building on this, the analysis of factors influencing production efficiency will provide a new perspective for identifying pathways to enhance TFCEP under varying energy consumption characteristics of manufacturing industries.
3 Data and methodology
3.1 Data on CO2 emission
To accurately calculate the total carbon emissions at the sectoral level, it is essential to account for indirect carbon emissions within the sector. This section first discusses the differences between carbon emission measurements at the regional and sectoral levels.
The literature review shows that researchers frequently adopt the sectoral approach, as recommended in the IPCC 2006 Guidelines for National Greenhouse Gas Inventories, to calculate carbon emissions. The sectoral approach takes sector economic activities as the accounting objects and calculates CO2 emissions of each sector by multiplying fuel consumption by fuel type over a certain period (e.g., 1 year) with three parameters, namely, lower heating value of the fuel, carbon content per unit of heating value, and oxidation rate (the product of these three parameters can be regarded as the CO2 emission factor). Then, the total carbon emissions generated from energy utilization in economic activities are calculated by summing up the sectoral emissions. This method is accurate when conducting regional carbon emission analysis since it accounts for the total energy consumption across all industries. In addition, emissions from the usage of electricity or heat generated within region boundaries were allocated to the electricity generation sector. However, when conducting industry-level carbon emission research, the calculation using the industrial sector’s terminal energy consumption (physical) only considers the direct CO2 emissions from fossil energy use in each industry without taking into account the indirect CO2 emissions from the net purchase of electricity and heat (such as steam), which are many industries’ main energy sources. For most industries outside of high-energy manufacturing, the purchase of external electricity is one of the primary sources of greenhouse gas emissions and represents the most critical lever for reducing CO2 emissions. The CO2 emissions calculations in the literature not only greatly underestimate the CO2 emissions caused by the manufacturing-sector production activities but also fail to provide effective ideas for saving energy and reducing emissions in economic development.
In view of the abovementioned considerations, referring to the “Guidelines for Accounting and Reporting of Greenhouse Gas Emissions for Specific Industries (hereafter referred to as Guidelines for Specific Industries)” (NDRC, 2015), the paper recalculates the CO2 emissions of various manufacturing sub-sectors. Calculations are based on the industrial final energy consumption (in physical units) of each sub-sector from the annual China Energy Statistical Yearbook (China National Knowledge Infrastructure, 2006a). Direct CO2 emissions from all 181 types of fossil energy listed in the energy balance table are calculated. For the electricity and heat consumption of each sector, the annual electricity CO2 emission factor from the “Annual Development Report of China’s Power Industry” (China Electricity Council, 2021) and the default value of the CO2 emission factor for heat supply (110 tCO2/TJ) from the “Guidelines for Specific Industries” (NDRC, 2015) are used to estimate the indirect MCE of each sub-sector. Total CO2 emissions of the sector are then calculated by summing up the direct and indirect emissions in order to comprehensively and realistically consider the MCE of every sub-sector and provide corresponding suggestions and strategies for energy conservation and CO2 reduction. The calculation process is detailed in Equations 1-3 below:
where CEjt, CEjt(dir), and CEjt(ind) refer to the total CO2 emissions, direct CO2 emissions, and indirect CO2 emissions of sector j in year t, respectively; ADijt indicates the consumption of fuel type i in sector j and year t; net caloric value of fuel i (NCVi) represents the heat generated by the combustion of a physical unit of the fuel; CCi is the CO2 emissions corresponding to the unit heat value of the fossil fuel; and OEij is the oxygenation efficiency of each fuel in different sectors, which represents the oxidation ratio during combustion. The values and units of NCVi, CCi, and OEi are provided in Supplementary Table A1. ADELjt and ADHjt represent the consumption of electric power and heat in sector j and year t, respectively, and FELt is the CO2 emission factor of unit electricity in year t. The calculation results are shown in Figure 1a. The blue, red, and green curves in Figure 1a represent the direct, indirect, and total MCE, respectively.
This study employs generic electricity carbon emission factors for the calculation of indirect emissions. China has six regional power grids, each with its own distinct emission factor. Due to the inability to match manufacturing sub-sector data with specific regional power grids, the use of generic emission factors overlooks regional heterogeneity, thereby affecting the accuracy of industry-level carbon emission data. However, as shown in Figure 1a, the indirect carbon emissions of the manufacturing sector are significantly higher than its direct emissions. Therefore, the bias introduced by using generic emission factors to calculate indirect emissions does not undermine its practical significance.
3.2 Measurement and decomposition of TFCEP
3.2.1 Calculation method for TFCEP
In the literature review of Section 2.1, the paper summarizes the evolution of the DEA model, a common estimation method for addressing environmentally sensitive productivity and its growth. Given the advantages of the GML index in overcoming spurious technical regression and infeasibility issues in cross-period DDF, thereby providing more accurate estimations (Chung et al., 1997; Fare et al., 2007; Oh, 2010), this study adopts this method to calculate and decompose the TFCEP of China’s manufacturing sub-sectors. First, a PPS that includes both the expected and unexpected outputs is defined. Constructing a panel of S DMUs and T time periods, the PPS produces J inputs, K expected outputs, and L unexpected outputs.
Formally, by defining expected outputs with
To perform the calculation, a directional distance function (DDF) is constructed. The DDF aims to increase the expected outputs while reducing the unexpected outputs simultaneously. Correlatively, it is denoted in Equation 5:
where g is the output scaled direction vector. In this case, g=(y,-b). β denotes the ratio of comparison between the expected output expansion and unexpected output contraction. As shown in formula 5, this DDF can measure the efficiency level of DMUs. The more effective the DMU, the lower its DDF value.
Referring to Oh (2010), this article defines a global technology benchmark as
It has been demonstrated that the GML index avoids the infeasibility problem because the evaluated DMU is surely included in the global reference set (Oh, 2010). Meanwhile, as the reference frontier of different periods is the same global benchmark, the GML index also possesses transitivity.
According to the GML index method, considering each manufacturing sub-sector as a DMU, with gross product as the desirable output and CO2 emission as the undesirable output, a sub-sector’s TFCEP between time t and t+1 is indicated and decomposed as shown in Equation 7:
TFCEPt,t+1 > 1 indicates that a PPS can achieve more expected outputs and fewer unexpected outputs. ECt,t+1 is the technical efficiency change index, which measures how closely a sub-sector shifts to the technology benchmark for the same period. ECt,t+1 > 1 shows that the sub-sector moves toward the contemporaneous benchmark across t to t+1 periods. BPCt,t+1 is the index of technical change, which measures the degree to which a contemporaneous benchmark moves toward the global technology benchmark. BPCt,t+1 > 1 represents technological progress; otherwise, it signifies technological regression.
3.2.2 Data on TFCEP
This paper focuses on the TFCEP of China’s manufacturing sectors from 2005 to 2020, covering the period from the 11th FYP to the 13th FYP. In order to unify the statistical caliber, all manufacturing sectors in the China Statistical Yearbook (China National Knowledge Infrastructure, 2006a) have been integrated into 29 manufacturing sub-sectors (see Table 8).
In the calculation of TFCEP in this paper, input data include labor input (L), capital stock (K), and energy input (E). L is measured by the annual labor force at the end of each year in units of ten thousand people. E is converted into standard coal equivalent, which is measured in units of ten thousand tons. According to Huang et al. (2002), capital input refers to the operation of machinery and equipment and the use of factory buildings in the production process. It represents the services provided by the capital stock over a certain period rather than the capital stock itself. Considering the complexity of capital aggregation, this article uses the original value of fixed capital from the China Statistical Yearbook (China National Knowledge Infrastructure, 2006a), adjusted by the fixed investment price index, to obtain the value of K. The output data in this study include the total output value of the manufacturing industry (MTOV) and MCE. According to Chen, (2010), the expected output is measured by the MTOV of each sub-sector, adjusted by the producer price index. The MCE of each sub-sector are considered unexpected outputs, and the specific estimation method is detailed in Section 3 of this paper. All the data mentioned above are derived from the China Statistical Yearbook (China National Knowledge Infrastructure, 2006a), the China Industrial Statistical Yearbook (China National Knowledge Infrastructure, 2006c), and the China Energy Statistical Yearbook (China National Knowledge Infrastructure, 2006b). The description and units of the input–output data can be found in Supplementary Table C1.
3.2.3 TFCEP and its decomposition
In this paper, the calculation and decomposition of TFCEP are conducted using MaxDEA software.
3.2.3.1 TFCEP and its decomposition of the overall manufacturing industry
This paper calculates the TFCEP of China’s manufacturing industry and its sub-sectors from 2005 to 2020, followed by simultaneous decomposition of this index. Table 3 presents the TFCEP status of the whole manufacturing industry. (1) It can be observed that TFCEP in the manufacturing sector increased in most years, with a geometric mean of 1.034 and an average growth rate of 3.4%. However, the TFCEP for the years 2016–2017 and 2017–2018 is below 1, indicating negative growth. Corresponding to the growth rate of manufacturing output, which averaged 9.9% over the 15-year period, the output growth was also negative in the 2 years when total factor productivity decreased. This article also measures the contribution of TFCEP to manufacturing growth, which averaged 34.7% over the 15-year period and exceeded 50% in some years. (2) Decomposing the TFCEP of the overall manufacturing industry during this period shows that the technical efficiency between any 2 years is consistently equal to 1, which indicates that the DMU does not approach the contemporaneous frontier over any two periods, its technical efficiency does not change, and TFCEP = BPC. Therefore, changes in TFCEP are all driven by technological changes.
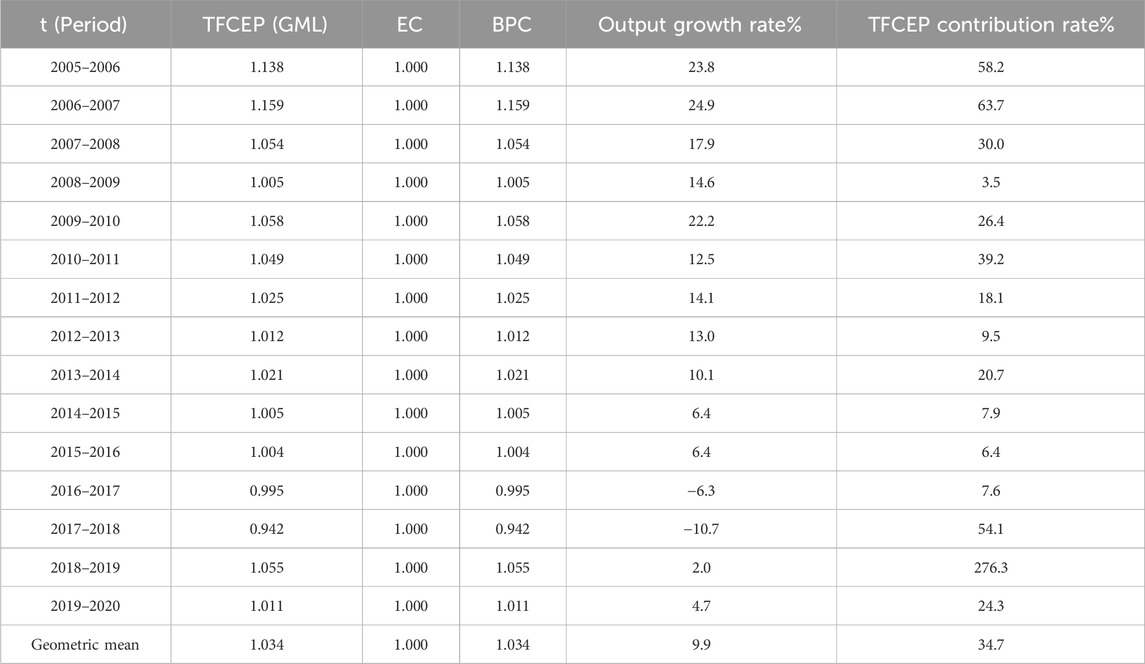
Table 3. Decomposition and contribution of TFCEP in the manufacturing industry.
3.2.3.2 Changes and contribution of TFCEP: comparison of phases at the sectoral level
The years from 2006 to 2020, which coincided with the 11th FYP to the 13th FYP, are divided into three FYPs for comparison. The results are depicted in Figure 2. During the 11th FYP, the average growth rate of the manufacturing industry was 20.6%, with an average TFCEP of 8.1% and a contribution rate to output growth of 39.5%. Sub-sectors maintained high growth rates, ranging from 8.76% to 48.93%. Except for a negative TFCEP change rate and negative contribution to growth in C01 and C11 and a zero contribution in C29, other sectors showed significant contributions ranging from 6.54% to 64.04%. During the 12th FYP, the growth rate of manufacturing output slowed down but still maintained a double-digit growth rate of 11.98%. The average TFCEP was 2.2%, and the contribution decreased to 20.06%. During this period, several sub-sectors experienced negative changes in TFCEP, including C01, C05, C06, C08, C17, C21, C28, and C29, which had a negative impact on economic growth. However, there were also some sectors with TFCEP exceeding the average level and even performing better than that of the 11th FYP, such as C11, C12, C13, C16, C23, C24, C26, and C27, which also made significant contributions to output growth. In the 13th FYP period, the Chinese economy moved into an entirely novel phase that adjusted speed and reduced gear. China implemented dual-control policies on energy consumption along with supply-side structure reforms, with a focus on the “three removals, one reduction, and one supplement” policy (removing overcapacity, inventory, and leverage; reducing costs; and compensating for deficiencies). During this period, the fixed price output growth rate of the manufacturing industry was −1.01%, with a slight positive growth of average TFCEP. Most sub-sectors had negative output growth rates, except for C04, C13, C16, C24, C25, C26, and C29, which maintained positive growth, and they accordingly had outstanding TFCEP contributions (except for C26, which had a TFCEP of 1). When there is negative output growth, despite the negative sign of the contribution share, the positive change in TFCEP still plays a beneficial role in the sector’s economy by offsetting some of the drag caused by other factors.
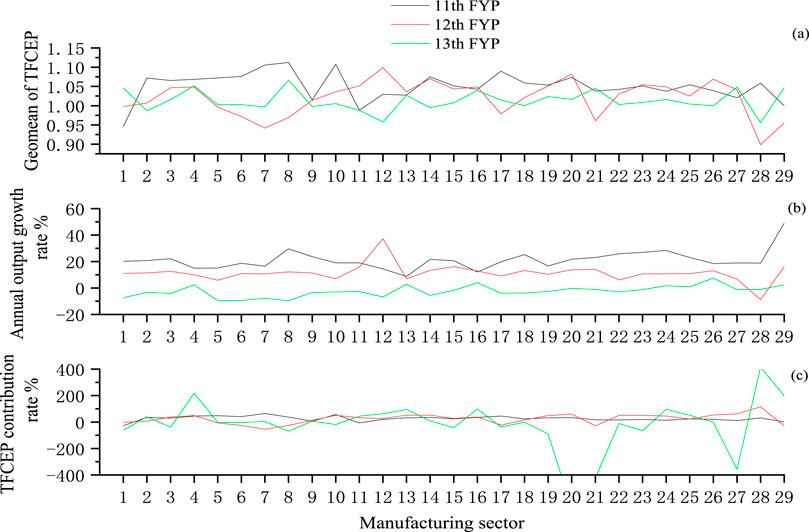
Figure 2. Sectoral comparison of TFCEP changes and contributions in three FYPs. (a) Geometric mean of manufacturing TFCEP. (b) Annual output growth rate. (c) TFCEP contribution rate.
3.2.3.3 Heterogeneity of sub-sectors
The decomposition indicators of TFCEP are depicted as a scatter plot in Figure 3, illustrating the heterogeneity of TFCEP among sub-sectors. The EC and BPC indices match the x-axis and y-axis, respectively. Sub-sectors with positive TFCEP are marked by a solid dot, while sub-sectors (C01 and C28) with negative TFCEP are distinguished by bubbles. The circle’s diameter reveals the geometric mean of the TFCEP. A larger dot implies better performance, and a larger hollow round indicates worse performance. For all 29 sub-sectors of the manufacturing industry, “BPC ≥ 1” indicates that the technological frontier of the manufacturing sector as a whole is advancing, with a number of sub-sectors performing above the average. The majority of sub-sectors have an EC ≥ 1, indicating that these sectors are in a constant state of catching up. However, there are a few sub-sectors with an EC < 1, suggesting that these sub-sectors are not effectively keeping up with their technological frontiers. Following Fan et al. (2015), this paper groups the sectors into four areas based on the combination of the EC and BPC indices. Sub-sectors with an EC ≥ 1 are regarded as catching up to the frontier, and sub-sectors with a BPC ≥ 1.034 (the average value) are regarded as possessing outstanding innovative ability. Thus, the 29 sub-sectors are divided into four groups, as displayed in Figure 3. Groups 1, 2, 3, and 4 are labeled in green, blue, dark blue, and purple, respectively.

Figure 3. Heterogeneity of manufacturing sub-sectors.
C04, C14, C16, C19, C20, and C26 are gathered into the green group (EC ≥ 1, BPC ≥ 1.034). They are in the process of catching up to their frontier, and they are more innovative than others. Thus, they are defined as catching-up and more innovative sub-sectors. More sub-sectors lying in the blue group (EC ≥ 1 and 1 ≤ BPC<1.034) are considered to be catching-up and less innovative sub-sectors, such as C03, C05, C08, C09, C11, C12, C13, C15, C18, C22, C23, and C24. Sub-sectors in the dark blue group (EC < 1 and BPC ≥ 1.034) are described as more innovative while lagging, and C02, C10, and C25 are located in this area. Finally, C01, C06, C07, C17, C21, and C28 are categorized in the purple group (EC < 1 and 1 ≤ BPC<1.034). They are considered less innovative and lagging sub-sectors. The TFCEP of sub-sectors in group 1 shows better performance, while that of sub-sectors in group 4 shows worse performance. C01 and C28 even show negative productivity growth (TFCEP<1) since they fall far behind the frontier.
3.3 Determinants of TFCEP
3.3.1 Econometric model for analyzing the influencing factors
What factors influence the change in the TFCEP of China’s manufacturing industry? To address this question, a dynamic panel data model is considered as shown in Equation 8:
where subscript i represents the manufacturing sub-sectors and subscript t represents the time in years. The dependent variable
3.3.2 Variable selection and data description
Based on the current literature and the present situation of the manufacturing industry in China, this article considers that the following factors significantly influence the TFCEP of the manufacturing industry and its sub-sectors.
(1) Technology: the contribution of technological progress to economic growth has been demonstrated by the existing literature and empirical research. Scholars measure technology with research and development (R&D) intensity. When considering carbon emissions as an unexpected output, the corresponding productive efficiency is related to technologies that save energy consumption and reduce carbon emissions. Due to the lack of specific data on investment in energy-saving and carbon-reduction technologies, this paper uses the ratio of expenditure on R&D projects to MTOV (RD) as a proxy for technological investment. A larger RD indicates stronger innovative capacity within the sub-sector, which is conducive to reconciling emission reduction with industrial development (Fan et al., 2015). Hence, we expect its effect to be positive.
(2) Environment regulation (ER): stringency of regulation has been mainly measured by emission abatement and control expenditures (Rubashkina et al., 2015; Xie et al., 2017). However, there is no separate accounting data for the governance cost in reducing carbon emissions. Shao et al. (2019) adopted a policy text quantification approach to measure environmental regulation intensity, which is suitable for provincial-level studies but difficult to attribute to specific sectors in industrial research. Energy regulatory policies are primarily command-based policies, and Wang and Qi (2016) used the percentage decrease in energy intensity as a policy indicator. This method represents a policy-effect proxy approach, which this study follows by using the decline rate of carbon emission intensity as a performance indicator. In this paper, ER is measured by the rate at which CO2 emissions in the current year decrease compared to that in the previous year. A higher ER indicates that the implementation of the energy regulation policy in that year led to better carbon emission reduction performance, which is expected to result in higher TFCEP accompanied by lower CO2 emissions, implying a positive effect.
(3) Capital deepening (CD): the ratio of K to L is a general method for determining the degree of CD. The CD value of a manufacturing sub-sector represents the technological structure of the industry. Early researchers (Chen and Golley, 2014; Fan et al., 2015) believed that sub-sectors with high CD values have a significant and negative impact on GTFP. Subsequently, scholars reached opposing conclusions (Shao et al., 2016; Faisal et al., 2021). Economic growth involves substituting capital for labor, which, on one hand, increases energy consumption and carbon emissions and, on the other hand, enhances output efficiency. When the efficiency improvement effect dominates, capital deepening exerts a positive influence on TFCEP (Tao et al., 2024). Although the existing literature is not unanimous on the direction of the influence of capital deepening on carbon emission efficiency, this paper argues that capital deepening is an inevitable trend toward industrial structural advancement, and it should have a positive impact on TFCEP.
(4) Energy usage structure (ES): many researchers describe the energy structure by the share of coal in the terminal physical energy consumption. Apart from several high-energy-consuming industries, most sub-sectors of the manufacturing industry rely primarily on purchased electricity for energy input, while fossil fuels such as coal and oil are primarily used as raw material inputs. When people say that “China’s energy structure is coal-oriented,” they are referring to the fact that coal is the primary raw material used in China’s electricity production—a result of China’s energy resource endowment. Under the mission of “carbon neutrality,” China’s renewable energy is gradually being utilized, leading to a decrease in the percentage of coal in the energy input structure of electricity production. Therefore, this article measures the ES of manufacturing sub-sectors by the proportion of electricity in the final energy usage, i.e., the level of electrification. Facing the climate goals of carbon neutrality, replacing fossil fuels with low-carbon electricity, and electrifying the energy structure are the development directions of energy systems worldwide. Based on the scatter plot of the distribution of electrification degree and the RESET test, it is determined that there exists a nonlinear relationship between ES and Y. This paper introduces the logarithm of the electrification degree indicator, lnES, and its squared term, ln2ES, into the model.
(5) Ownership structure: in China’s manufacturing sectors, there are three types of ownership: state-owned enterprises (SOEs), private enterprises (PEs), and enterprises with Hong Kong, Macao, Taiwan, and foreign funds (HMTFEs). The ownership structure is commonly measured by the proportion of SOE’s output value in the total MTOV (Chen and Golley, 2014; Shao et al., 2019). Some studies also use the ratio of non-state-owned economy’s output to represent the degree of marketization (Wang et al., 2017; Yuan et al., 2021). For the same industry, the coefficient of SOEs can also reflect, from an inverse perspective, the impact of marketization levels. The proportion of HMTFEs’ output is generally used to measure the degree of the industry’s openness (Chen and Golley, 2014; Shao et al., 2019; Yang et al., 2017). This article uses the output shares of three types of ownership enterprises (SOEs, PEs, and HMTFEs) within each manufacturing sub-sector to represent different ownership structure indicators. In the regression model, ownership structure is included as a control variable. Due to the collinearity among the three indicators, they are placed in different models during the regression process. Different ownership indicators will affect TFCEP from different perspectives, and we expect the impact coefficients of these three indicators to be negative, positive, and negative, respectively.
Through the aforementioned model construction and variable selection, this paper derived the following nonlinear regression equation, as shown in Equation 9:
In Equation 9, z represents the control variables, γ is the parameter vector of the control variables, and the other variables and parameters are the same as those in Equation 8. The data used for the calculation of each variable in the model include electricity consumption in sub-sectors, R&D investment, capital stock, and proportion of different ownership forms. These data are sourced from the China Statistical Yearbook (China National Knowledge Infrastructure, 2006a), the China Energy Statistical Yearbook (China National Knowledge Infrastructure, 2006b), and the China Science and Technology Statistical Yearbook (China National Knowledge Infrastructure, 2006d). The regression analysis in this paper was conducted using STATA software. Table 4 provides the units and statistical characteristics of each variable.
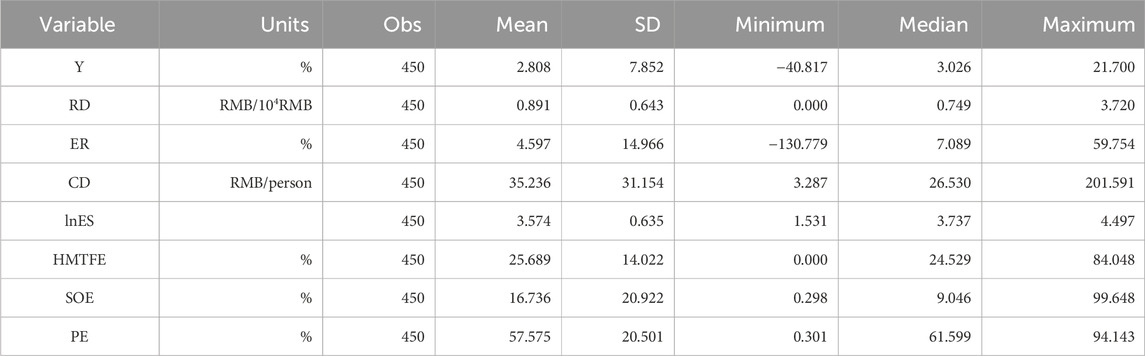
Table 4. Summary of statistics.
4 Empirical results and discussion
4.1 Empirical process and results
This section conducts a comprehensive and rigorous empirical analysis of the influencing factors of the TFCEP in China’s manufacturing industry to explore the characteristics of its development and change. Through these research efforts, the study aims to identify key factors for improving China’s manufacturing TFCEP so that policy reference can be provided for coordinating carbon reduction and industrial growth.
In this paper, endogeneity concerns are tested via Durbin–Wu–Hausman procedures: RD and CD are tested individually, while energy structure variables (lnES and ln2ES) are tested jointly (see Table 5). ER is treated as exogenous because of its policy nature.
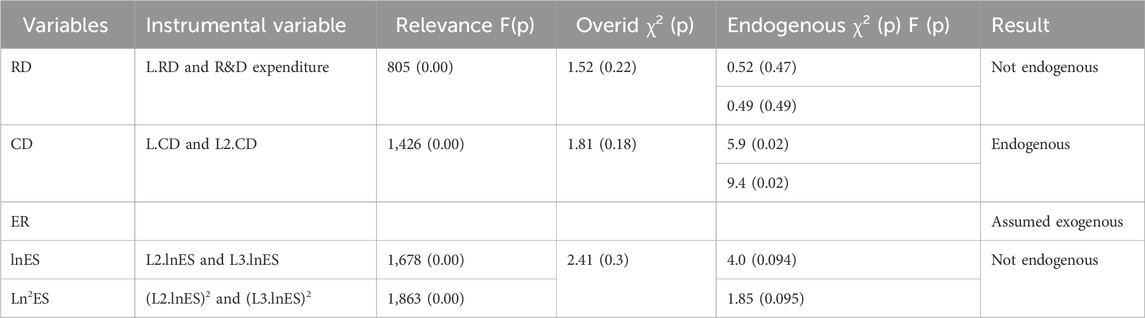
Table 5. Endogeneity test of explanatory variables.
After identifying the endogenous variables, this study addresses endogeneity in the variables CD, lnES, and ln2ES using the instrumental variables from Table 5. The analysis first employs two-stage least squares (2SLS) regression with robust standard errors, and then it verifies robustness through limited information maximum likelihood (LIML) estimation, which is less sensitive to weak instruments. Given the potential heteroscedasticity, more efficient two-step generalized method of moments (GMM) estimation is also conducted. For comparison, pooled ordinary least squares (OLS) regression with industry-clustered standard errors is included as a benchmark. Results in Table 6 show that 2SLS, LIML, and GMM produce similar coefficients with comparable significance levels, confirming model robustness. However, when compared to the endogeneity-ignoring OLS estimates, the statistical significance of CD, lnES, and ln2ES decreases noticeably despite stable coefficient magnitudes.
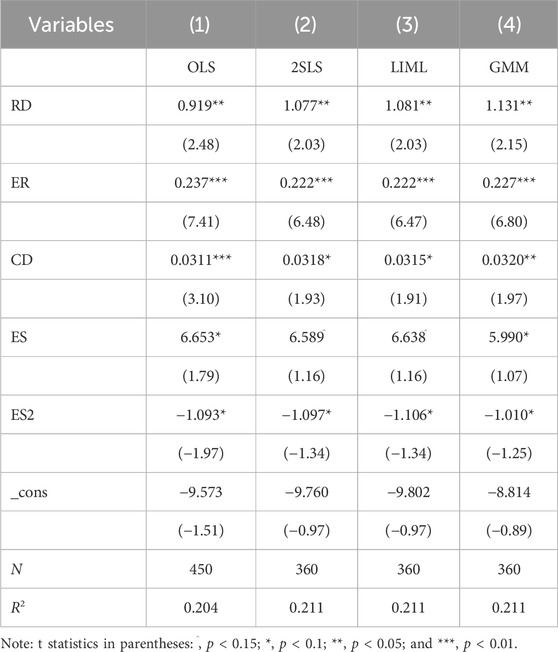
Table 6. Instrumental variable method comparison.
Since the variables representing the three ownership types exhibit multicollinearity when included in a single model, separate linear regression and instrumental variable regression models were estimated for each ownership indicator. These were then compared with the baseline model that excludes ownership variables, resulting in a total of eight models presented in Table 7. As a previous analysis showed, the significance levels of endogenous variables’ coefficients decrease when endogeneity is accounted for. To facilitate the comparison of this significance reduction, probability values are reported in parentheses below the coefficients in Table 7. Across all 2SLS specifications, the significance levels of endogenous variables’ coefficients are consistently lower, demonstrating that ignoring endogeneity creates a false impression of higher significance and reduces model reliability. Given the robustness of 2SLS models established earlier, their results are used for analyzing TFCEP determinants.
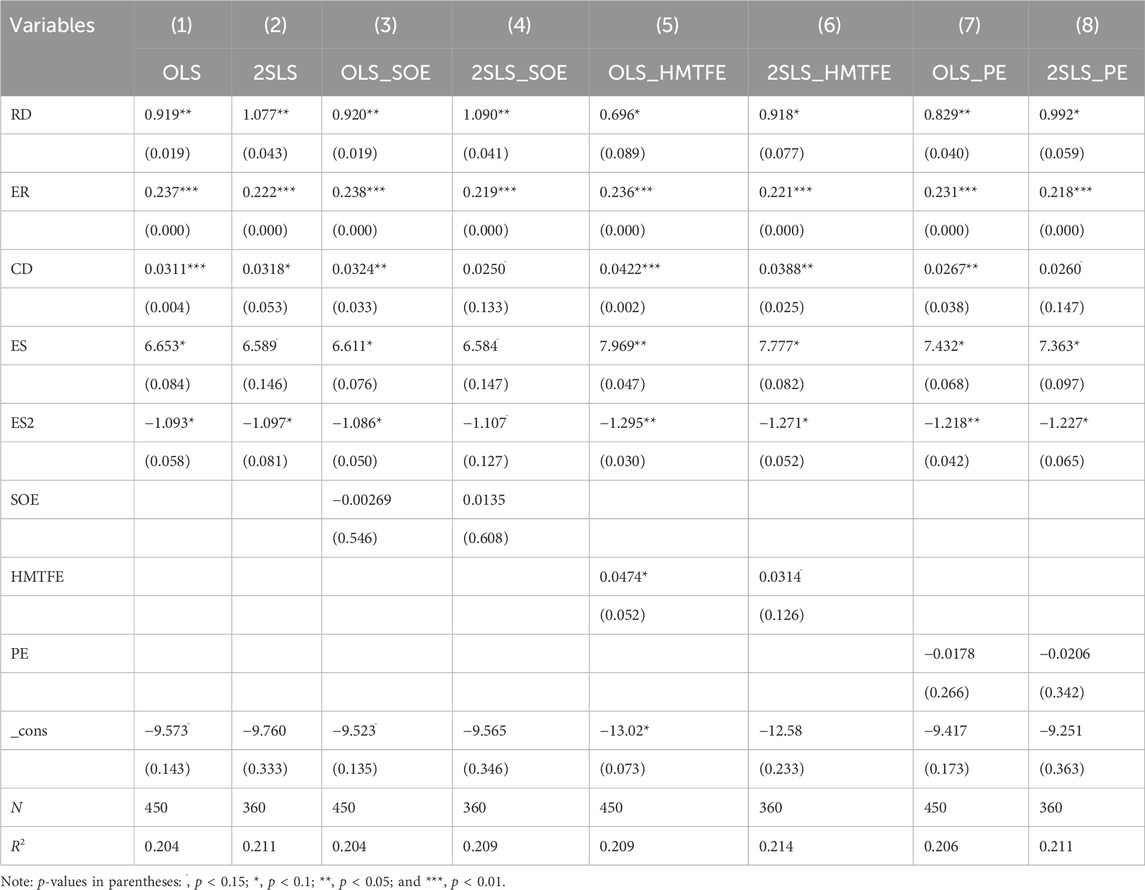
Table 7. 2SLS versus OLS regression comparison.

Table 8. Codes of manufacturing sectors.
4.2 Key findings and discussion
The consistent positive relationship between RD and TFCEP (β1: 0.918–1.09, significant at 5%–10%) aligns with China’s national strategy of innovation-driven green development. Although RD data represent the R&D density of sub-sectors rather than innovation inputs specifically aimed at carbon reduction, it is highly correlated with the innovation funds allocated to energy conservation and carbon reduction. The elasticity between R&D intensity and the TFCEP gain of approximately 1:1 corroborates the innovative mechanism by which China’s manufacturing sector achieves a “dual dividend” of productivity growth and emissions reduction through improvements in energy efficiency and the substitution of clean energy.
ER is used to measure the intensity of carbon reduction policies by indicating the extent of CO2 emission reduction. In all models, its coefficient β2 is relatively stable and significant at the 1% level. The stable and highly significant impact of environmental policy stringency reflects the evolving effectiveness of China’s regulatory system. The command-and-control measures have created a unique policy environment where even a 1% marginal reduction in carbon intensity yields a 0.23% observable improvement in TFCEP. For instance, the dual-control system for energy consumption during the 13th Five-Year Plan period significantly enhanced energy efficiency and slowed energy consumption growth. This demonstrates the distinctive “compulsory + incentive” mechanism and policy advantages inherent in China’s economic system.
CD has a relatively stable positive effect on TFCEP, with a coefficient β3 ranging from 0.027 to 0.039 and significance levels between 5% and 10%. The positive effect of capital deepening on TFCEP challenges conventional academic perceptions (Chen and Golley, 2014; Fan et al., 2015) of capital-intensive growth models. In the Chinese context, this finding aligns with recent observations in advanced manufacturing clusters such as the Yangtze River Delta, where automation upgrades are systematically coupled with energy-efficient equipment retrofits, forming a novel pathway distinct from traditional “pollution-intensive substitution” patterns. Meanwhile, optimization of industrial technological structure leads to higher efficiency, and although output growth is accompanied by increasing CO2 emissions, TFCEP increases due to the improvement in energy utilization efficiency.
The impact of ES is composed of two parts: the coefficient of the linear term (β4) is positive, while the coefficient of the quadratic term (β5) is negative. Both coefficients are significant at the 10%–15% level across different models, supporting the validity of the nonlinear impact hypothesis. The values and signs of β4 and β5 indicate that the effect of ES on Y follows an inverted U-shaped curve, which reveals significant sectoral divergence. Further calculations reveal that the critical point of this inverted U-shaped curve corresponds to an lnES of approximately 3.1, which translates to an ES of approximately 24%. As of 2020, sectors C2, C3, C13, C14, C18, C19, and C29 are located on the ascending segment of the inverted U-shaped curve, while the majority of other sub-sectors of China’s manufacturing industry are positioned on the descending segment. Sub-sectors on the ascending segment are classified as low electrification sectors, where an increase in electrification levels can enhance TFCEP. Conversely, sub-sectors on the descending segment are categorized as high electrification sectors, where further electrification leads to an increase in indirect carbon emissions that surpasses the reduction in direct carbon emissions from decreased fossil fuel consumption, thereby exerting a counterproductive effect on TFCEP. Low electrification sectors are well-suited to enhance TFCEP by increasing their electrification levels. This approach has precedents. For example, Lechtenböhmer et al. (2016) explored the feasibility of achieving deep decarbonization in Europe’s basic materials industry through electrification and the mutual impacts between these industries and the power system. In contrast, for high electrification sectors, the focus on improving carbon emission efficiency should be placed on energy conservation. Simultaneously, this necessitates the electricity supply sector to further reduce carbon emissions and generate electricity with a lower carbon footprint. Europe also provides relevant case studies in this regard. Improvements in energy efficiency, increased penetration of renewable energy, and technological advancements related to emission reduction are all key components of the European Union’s energy strategy (Fragkos et al., 2017).
When accounting for ownership structure in the instrumental variable model, the coefficient for SOEs is positive (unlike in OLS) but statistically insignificant, failing to provide robust support for the positive influence of public ownership on environmental efficiency, as mentioned in the previous literature (Clò et al., 2017). The coefficient of HMTFEs is 0.0314 with a 15% significance level, indicating a certain degree of significance. A 1% increase in foreign investment share leads to a 0.0314% improvement in TFCEP. As the indicator, HMTFEs represent the degree of industry openness, and it suggests that the increase in openness during this period has brought about more significant technology spillover effects (Shao et al., 2019). The coefficient for PE remains negative but with a smaller magnitude and no statistical significance, which also does not support the argument that “privatization is a more effective option for pollution abatement” (Wang and Jin, 2007; World Bank, 1995).
Based on the comprehensive analysis above, this paper argues that within the context of considering indirect carbon emissions, the primary determinants influencing TFCEP are technology, environmental regulation, capital deepening, and openness, all of which positively contribute to the enhancement of TFCEP. Among these factors, technological innovation and environmental regulatory policies stand out as the most effective means of enhancing TFCEP. The relationship between electrification levels and TFCEP follows an inverted U-shaped curve, while the impact of energy structure varies across manufacturing sectors with different electrification characteristics. Consequently, it is essential to adopt differentiated strategies when selecting pathways to enhance TFCEP.
5 Conclusion and policy recommendations
5.1 Conclusion
This paper considers the indirect carbon emissions from purchased electricity and heat in manufacturing and its sub-sectors and calculates the total carbon emissions on this basis. The results indicate that the MCE are still on the rise. Considering CO2 emissions as an unexpected by-product, this paper adopts the GML index method to calculate TFCEP of China’s 29 manufacturing sub-sectors over 2006–2020.
It was found that the annual TFCEP growth rate of the overall manufacturing sector reached 3.4% during this period, contributing 34.7% to output growth, and the changes in TFCEP were driven by the movement of the technological frontier. In the three FYPs, the growth rate of the manufacturing output and the contribution of TFCEP decreased. During the 11th FYP, most sub-sectors performed well, but the number of better performers gradually decreased in the 12th and 13th FYPs, with only sectors C13, C14, C24, and C26 being consistently included. Furthermore, the results of TFCEP decomposition indicate that there is significant heterogeneity among sub-sectors. According to different combinations of EC and BPC indices, 29 sub-sectors are divided into four groups with different characteristics. Only a few sub-sectors that possess both innovative and catch-up capabilities act as innovators, driving the entire industry’s frontier to extend outward. These sectors include C04, C14, C16, C19, C20, and C26.
We also conducted an empirical analysis of the factors influencing TFCEP in China’s manufacturing industry. As a proxy variable for energy-saving and carbon-reduction R&D investment, RD has the highest and statistically significant coefficient in the regression equation, indicating that technological innovation is the most effective path to improve TFCEP. As a proxy variable for CO2 emission reduction policies, ER exhibits a coefficient that is both significant and positive. This suggests that environmental regulatory policies targeting the reduction of carbon emission intensity are effective mechanisms for enhancing TFCEP. Capital deepening is an inevitable requirement for the advanced industrial structure. The positive correlation coefficient of the capital/labor ratio indicates that during the process of industrial advancement, the TFCEP of industry is improved. To reduce carbon emissions and enhance productivity, it is necessary to align with the trend of industrial structure advancement. The electrification rate serves as a more scientifically grounded metric for evaluating energy structure as it aligns closely with energy demand patterns and acts as a critical linkage between energy supply and demand. The impact of the electrification rate on TFCEP exhibits an inverted U-shaped curve, indicating that the influence of energy structure varies across manufacturing sectors with different electrification characteristics. Therefore, when selecting pathways to enhance TFCEP, differentiated strategies should be adopted. For sectors with low electrification levels, it is advisable to continue increasing electrification rates; meanwhile, for highly electrified sectors, the focus should shift to the research and application of energy-saving technologies. Simultaneously, the power sector must achieve deep decarbonization to support these efforts. The coefficient of the HMTFEs’ output share in a sub-sector is significantly positive, indicating that the level of openness plays a positive role in enhancing TFCEP. Therefore, it is necessary to further expand the degree of openness.
5.2 Policy recommendations
In light of the abovementioned conclusions, some policy recommendations are proposed to obtain a proper level of TFCEP.
First, the effect of technological innovation in enhancing TFCEP should be given more attention, as indicated by the analysis of the GML index. On one hand, manufacturing enterprises should be encouraged to engage in frontier technological innovation through R&D subsidies, tax incentives, and accelerated patent approval for cutting-edge low-carbon technologies (Kuhn and Teodorescu, 2021). On the other hand, industry-wide technology diffusion should be promoted by establishing sector-level technology sharing platforms in key industries such as steel and chemicals while incentivizing leading firms to partially open their patents, thereby enhancing overall technological advancement across industries. Meanwhile, carbon footprint metrics should be incorporated into technology evaluation systems, with sector-specific technology roadmaps implemented to replace conventional production methods with low-emission technological alternatives.
Second, the government needs to refine and improve its environmental regulatory policies. The policies should include (1) establishing sector-specific emission reduction targets with binding timelines to clarify decarbonization pathways for each industry; (2) developing cross-regional carbon budget allocation mechanisms that specifically link production capacity quotas in energy-intensive industries such as electrolytic aluminum to regional renewable energy installation capacity, thereby achieving synergistic optimization between industrial layout and clean energy supply (Bai, et al., 2024); and (3) designing compliance implementation pathways to ensure deep integration of industrial planning with energy transition roadmaps, which will form systemic emission reduction synergies and facilitate the achievement of carbon neutrality goals.
Third, on the energy demand side, promoting the green and low-carbon transformation of manufacturing sectors is essential. From the perspective of the overall structure of the manufacturing industry, industrial upgrading requires the reduction, intensification, and high-end development of energy-intensive industries. The economy should shift from traditional sectors such as steel, cement, and chemicals to strategic emerging industries with lower energy consumption per unit of added value, such as new materials, new energy vehicles, and high-end equipment. Within sub-sectors, continuous upgrading and iterative renewal of industrial technological structures are imperative. Manufacturing enterprises should be encouraged to adopt more intelligent equipment, implement AI-powered energy consumption management systems, and undergo digital transformation to optimize operational processes. During the process of industrial structure upgrading, it is crucial to continuously improve energy efficiency, further promote electrification of energy use in low-electrification sectors, and encourage the development and application of energy-saving technologies in highly electrified sectors, thereby enhancing the overall energy efficiency of society.
Fourth, on the energy supply side, it is essential to continue optimizing the energy supply structure and consistently improve energy production efficiency. To achieve this, China should adopt a dual approach. On one hand, it is crucial to reduce the consumption of fossil fuels, particularly coal and oil, and replace them with low-carbon and clean energy sources to mitigate emissions. This can be accomplished by actively developing renewable energy; promoting the integrated development of wind, solar, hydro, and energy storage systems; and ensuring the safe and regulated development of hydrogen energy. On the other hand, China should continue to advance smart energy technologies by constructing smart grids and supporting distributed power generation combined with energy storage systems. These measures will facilitate the integration and management of clean energy, thereby enhancing the overall efficiency of the energy system. Europe is at the forefront of renewable energy and smart grid development, and China can learn from its advanced experiences.
The aforementioned policy recommendations exhibit a certain degree of universality in the global context, and China’s experience can serve as a valuable reference for other countries. Whether in developed or developing nations, promoting the research, development, and application of cutting-edge technologies remains central to achieving low-carbon transitions. Environmental regulatory policies are a critical tool for achieving carbon emission reduction targets. Countries should formulate differentiated emission reduction goals and implementation pathways based on their respective economic development levels, resource endowments, and carbon emission profiles. For instance, measures to enhance carbon emission efficiency should vary across industries at different stages of electrification. For developing countries, striking a balance between economic growth and low-carbon transformation is particularly crucial. For developing countries, it is particularly important to strike a balance between economic growth and low-carbon transformation.
Data availability statement
The original contributions presented in the study are included in the article/Supplementary Material; further inquiries can be directed to the corresponding author.
Author contributions
ZH: conceptualization, data curation, formal analysis, methodology, project administration, resources, writing – original draft, and writing – review and editing. XW: conceptualization, data curation, methodology, software, writing – original draft, and writing – review and editing.
Funding
The author(s) declare that financial support was received for the research and/or publication of this article. This research did not receive any specific grant from funding agencies in the public, commercial, or not-for-profit sectors.
Conflict of interest
The authors declare that the research was conducted in the absence of any commercial or financial relationships that could be construed as a potential conflict of interest.
Generative AI statement
The author(s) declare that no Generative AI was used in the creation of this manuscript.
Publisher’s note
All claims expressed in this article are solely those of the authors and do not necessarily represent those of their affiliated organizations, or those of the publisher, the editors and the reviewers. Any product that may be evaluated in this article, or claim that may be made by its manufacturer, is not guaranteed or endorsed by the publisher.
Supplementary material
The Supplementary Material for this article can be found online at: https://www.frontiersin.org/articles/10.3389/fenvs.2025.1517645/full#supplementary-material
Footnotes
1There are 29 fossil fuels listed in the energy balance table in Energy Statistical Yearbook from 2006 to 2021. We combined 29 fuels into 18 types due to the similar combustion characteristic and small consumption of some fuels to that of others, as listed in Appendix A.
References
Afshan, S., Yaqoob, T., Meo, M. S., and Hamid, B. (2023). Can green finance, green technologies, and environmental policy stringency leverage sustainability in China: evidence from quantile-ARDL estimation. Environ. Sci. Pollut. Res. 30, 61726–61740. doi:10.1007/s11356-023-26346-1
Allal-Chérif, O., Climent, J. C., and Berenguer, K. J. U. (2023). Born to be sustainable: how to combine strategic disruption, open innovation, and process digitization to create a sustainable business. J. Bus. Res. 154, 113379. doi:10.1016/j.jbusres.2022.113379
Bai, J., Chang, I.-S., Zhang, C., and Wu, J. (2024). Allocation of CO2 emission target in China under the “1+N” policy: considering natural carbon sinks and wind-solar-hydropower endowments. Environ. Impact Assess. Rev. 106, 107472. doi:10.1016/j.eiar.2024.107472
Chen, H., Shi, Y., Xu, M., Xu, Z. H., and Zou, W. J. (2023). China’s industrial green development and its influencing factors under the background of carbon neutrality. Environ. Sci. Pollut. Res. 30, 81929–81949. doi:10.1007/s11356-022-23636-y
Chen, S. Y. (2010). China’s green industrial revolution: an explanation based on the perspective of environmental total factor productivity (1980–2008). Econ. Res. 11, 11–34.
Chen, S. Y., and Golley, J. (2014). ‘green’ productivity growth in China’s industrial economy. Energy Econ. 44, 89–98. doi:10.1016/j.eneco.2014.04.002
Cheng, Y., Lv, K., and Zhu, S. (2023). How does digital financial inclusion promote green total factor productivity in China? An empirical analysis from the perspectives of innovation and entrepreneurship. Process Saf. Environ. Prot. 174, 403–413. doi:10.1016/j.psep.2023.04.002
Cheng, Z., and Shi, X. (2018). Can industrial structural adjustment improve the total-factor carbon emission performance in China? Int. J. Environ. Res. Public Health. 15, 2291. doi:10.3390/ijerph15102291
Cheng, Z. H., and Kong, S. Y. (2022). The effect of environmental regulation on green total-factor productivity in China’s industry. Environ. Impact Assess. Rev. 94, 106757. doi:10.1016/j.eiar.2022.106757
China Electricity Council (CEC) (2021). Annual development report of China’s power industry. Beijing, China: China Electricity Council. Available online at: https://fw.cec.org.cn/mall/#/description?goodsId=5&breadcrumb=%5B%7B%22name%22%3A%22%E5%85%A8%E9%83%A8%E7%BB%93%E6%9E%9C%22,%22path%22%3A%22%2FproductList%3Fkws%3D%25E4%25B8%25AD%25E5%259B%25BD%25E7%2594%25B5%25E5%258A%259B%25E8%25A1%258C%25E4%25B8%259A%25E5%25B9%25B4%25E5%25BA%25A6%25E5%258F%2591%25E5%25B1%2595%25E6%258A%25A5%25E5%2591%258A2021%26catid%3D%26merchandiseType%3D%26brand%3D%26type%3D%26ints%3D1%22%7D%5D.
China National Knowledge Infrastructure (CNKI) (2006a). China statistical yearbook. Beijing, China: National Bureau of Statistics of China. Available online at: http://data-cnki-net-s.webvpn.zju.edu.cn:8001/yearBook/single?nav=%E7%BB%9F%E8%AE%A1%E5%B9%B4%E9%89%B4&id=N2024110295&pinyinCode=YINFN.
China National Knowledge Infrastructure (CNKI) (2006b). China energy statistical yearbook. Beijing, China: National Bureau of Statistics of China. Available online at: http://data-cnki-net-s.webvpn.zju.edu.cn:8001/yearBook/single?nav=%E7%BB%9F%E8%AE%A1%E5%B9%B4%E9%89%B4&id=N2024050932&pinyinCode=YCXME.
China National Knowledge Infrastructure (CNKI) (2006c). China industrial statistical yearbook. Beijing, China: National Bureau of Statistics of China. Available online at: http://data-cnki-net-s.webvpn.zju.edu.cn:8001/yearBook/single?nav=%E7%BB%9F%E8%AE%A1%E5%B9%B4%E9%89%B4&id=N2024050101&pinyinCode=YZGJN.
China National Knowledge Infrastructure (CNKI) (2006d). China science and technology statistical yearbook. Beijing, China: National Bureau of Statistics of China. Available online at: http://data-cnki-net-s.webvpn.zju.edu.cn:8001/yearBook/single?nav=%E7%BB%9F%E8%AE%A1%E5%B9%B4%E9%89%B4&id=N2024010042&pinyinCode=YBVCX.
Chung, Y. H., Fare, R., and Grosskopf, S. (1997). Productivity and undesirable outputs: a directional distance function approach. J. Environ. Manag. 51 (3), 229–240. doi:10.1006/jema.1997.0146
Clò, S., Ferraris, M., and Florio, M. (2017). Ownership and environmental regulation:evidence from the European electricity industry. Energy Econ. 61, 298–312. doi:10.1016/j.eneco.2016.12.001
Du, J., Chen, Y., and Huang, Y. (2018). A modified malmquist-luenberger productivity index:assessing environmental productivity performance in China. Eur. J. Oper. Res. 269, 171–187. doi:10.1016/j.ejor.2017.01.006
Du, Z. L., and Wang, Y. (2022). Does energy-saving and emission reduction policy affects carbon reduction performance? A quasi-experimental evidence in China. Appl. Energy. 324, 119758. doi:10.1016/j.apenergy.2022.119758
Faisal, F., Pervaiz, R., Ozatac, N., and Tursoy, T. (2021). Exploring the relationship between carbon dioxide emissions, urbanisation and financial deepening for Turkey using the symmetric and asymmetric causality approaches. Environ. Dev. Sustain 23, 17374–17402. doi:10.1007/s10668-021-01385-1
Fan, M. T., Shao, S., and Yang, L. L. (2015). Combining global malmquist-luenberger index and generalized method of moments to investigate industrial total factor CO2 emission performance: a case of shanghai (China). Energy Policy 79, 189–201. doi:10.1016/j.enpol.2014.12.027
Fare, R., Grosskopf, S., and Pasurka, C. A. (2007). Environmental production functions and environmental directional distance functions. Energy 32, 1055–1066. doi:10.1016/j.energy.2006.09.005
Feng, C., Zhang, H., and Huang, J.-B. (2017). The approach to realizing the potential of emissions reduction in China: an implication from data envelopment analysis. Renew. Sustain. Energy Rev. 71, 859–872. doi:10.1016/j.rser.2016.12.114
Fragkos, P., Tasios, N., Paroussos, L., Capros, P., and Tsani, S. (2017). Energy system impacts and policy implications of the european intended nationally determined contribution and low-carbon pathway to 2050. Energy Policy 100, 216–226. doi:10.1016/j.enpol.2016.10.023
Hao, Z., Zhao, Z., Pan, Z., Tang, D., Zhao, M., and Zhang, H. (2025). Spatial effects of financial agglomeration and green technological innovation on carbon emissions. Sustainability 17, 2746. doi:10.3390/su17062746
Hassan, M. S., Meo, M. S., Zaini, M., and Karim, M. Z. A. (2020). Prospects of environmental kuznets curve and green growth: the role of globalization in developed and developing economies. Stud. Appl. Econ. 38-3, 1133–3197. doi:10.25115/eea.v38i3.3367
Hu, W., and Xiong, Z. (2021). Do stringent environmental regulations help improve the total factor carbon productivity? Empirical evidence from China’s industrial sectors. Appl. Econ. 53, 6398–6411. doi:10.1080/00036846.2021.1940083
Huang, Y. F., Ren, R. S., and Liu, X. S. (2002). Capital stock estimates in Chinese manufacturing by perpetual inventory approach. China Econ. Quarterly. 2002 (2), 377–396.
International Energy Agency (IEA) (2024). CO2 emissions in 2023. New York, NY: International Energy Agency. Available online at: https://www.iea.org/reports/co2-emissions-in-2023.
Kuhn, J. M., and Teodorescu, M. H. M. (2021). The track one pilot program: who benefits from prioritized patent examination? Strateg. Entrep. J. 15, 185–208. doi:10.1002/sej.1387
Lechtenböhmer, S., Nilsson, L. J., Åhman, M., and Schneider, C. (2016). Decarbonising the energy intensive basic materials industry through electrification – implications for future EU electricity demand. Energy 115 (3), 1623–1631. doi:10.1016/j.energy.2016.07.110
Li, D. Z., Bai, Y. T., Yu, P. P., Meo, M. S., Anees, A., and Rahman, S. U. (2022). Does institutional quality matter for environmental sustainability? Front. Environ. Sci. 10. doi:10.3389/fenvs.2022.966762
Li, J. X., and Cheng, Z. H. (2020). Study on total-factor carbon emission efficiency of China’s manufacturing industry when considering technology heterogeneity. J. Clean. Prod. 260, 121021. doi:10.1016/j.jclepro.2020.121021
Li, K., and Lin, B. Q. (2016). Impact of energy conservation policies on the green productivity in China’s manufacturing sector: evidence from a three-stage DEA model. Appl. Energy. 168, 351–363. doi:10.1016/j.apenergy.2016.01.104
Liao, T., Yan, J., and Zhang, Q. (2024). The impact of green technology innovation on carbon emission efficiency: the intermediary role of intellectual capital. Int. Rev. Econ. Finance 92, 520–532. doi:10.1016/j.iref.2024.02.016
Lin, B. Q., and Wang, X. L. (2015). Carbon emissions from energy intensive industry in China: evidence from the iron and steel industry. Renew. Sust. Energ. Rev. 47, 746–754. doi:10.1016/j.rser.2015.03.056
Lv, Y. L., Liu, J. N., Cheng, J. Q., and Andreoni, V. (2021). The persistent and transient total factor carbon emission performance and its economic determinants: evidence from China’s province-level panel data. J. Clean. Prod. 316, 128198. doi:10.1016/j.jclepro.2021.128198
Mehmood, S., Zaman, K., Khan, S., Ali, Z., and Khan, H. U. R. (2023). The role of green industrial transformation in mitigating carbon emissions: exploring the channels of technological innovation and environmental regulation. Energy Built Environ. 5, 464–479. doi:10.1016/j.enbenv.2023.03.001
National Development and Reform Commission (NDRC) (2015). Notice on issuing the third batch of greenhouse gas accounting methods and reporting guidelines for 10 industry enterprises (for trial implementation) (NDRC office climate [2015] No.1722). Beijing, China: National Development and Reform Commission. Available online at: https://www.ndrc.gov.cn/xxgk/zcfb/tz/201511/t20151111_963496.html.
Oh, D. (2010). A global malmquist–luenberger productivity index. J. Prod. Anal. 34, 183–197. doi:10.1007/s11123-010-0178-y
Oh, D., and Heshmati, A. (2010). A sequential malmquist–luenberger productivity index: environmentally sensitive productivity growth considering the progressive nature of technology. Energy Econ. 32 (6), 1345–1355. doi:10.1016/j.eneco.2010.09.003
People’s Daily (2021). Strive to achieve carbon peaking by 2030 and carbon neutrality by 2060: win the tough battle of low-carbon transition. Beijing, China: People’s Daily. Available online at: https://www.gov.cn/xinwen/2021-04/02/content_5597403.htm.
Qu, C., Shao, J., and Shi, Z. (2020). Does financial agglomeration promote the increase of energy efficiency in China? Energy Policy 146, 111810. doi:10.1016/j.enpol.2020.111810
Rubashkina, Y., Galeotti, M., and Verdolini, E. (2015). Environmental regulation and competitiveness: empirical evidence on the porter hypothesis from European manufacturing sectors. Energy Policy 83, 288–300. doi:10.1016/j.enpol.2015.02.014
Shaari, M. S., Abidin, N. Z., Ridzuan, A. R., and Meo, M. S. (2021). The impacts of rural population growth, energy use and economic growth on CO2 emissions. Int. J. Energy Econ. Policy 11 (5), 553–561. doi:10.32479/ijeep.11566
Shao, S., Luan, R., Yang, Z., and Li, C. (2016). Does directed technological change get greener: empirical evidence from Shanghai’s industrial green development transformation. Ecol. Indic. 69, 758–770. doi:10.1016/j.ecolind.2016.04.050
Shao, S., Yang, Z., Yang, L., and Ma, S. (2019). Can China’s energy intensity constraint policy promote total factor energy efficiency? Evidence from the industrial sector. Energy J. 40 (4), 101–128. doi:10.5547/01956574.40.4.ssha
Su, T., Chen, Y. F., and Lin, B. Q. (2023). Uncovering the role of renewable energy innovation in China’s low carbon transition: evidence from total-factor carbon productivity. Environ. Impact Assess. Rev. 101, 107128. doi:10.1016/j.eiar.2023.107128
Sueyoshi, T., Yuan, Y., and Goto, M. (2017). A literature study for DEA applied to energy and environment. Energy Econ. 62, 104–124. doi:10.1016/j.eneco.2016.11.006
Tan, X. J., Choi, Y., Wang, B. B., and Huang, X. Q. (2020). Does China’s carbon regulatory policy improve total factor carbon efficiency? A fixed-effect panel stochastic frontier analysis. Technol. Forecast. Soc. Chang. 160, 120222. doi:10.1016/j.techfore.2020.120222
Tao, M., Wen, L., Sheng, M. S., Yan, Z. J., and Poletti, S. (2024). Dynamics between energy intensity and carbon emissions: what does the clustering effect of labor and capital play? J. Clean. Prod. 452, 142223. doi:10.1016/j.jclepro.2024.142223
Tu, C., Zang, C., Wu, A., Long, H., Yu, C., and Liu, Y. (2024). Assessing the impact of industrial intelligence on urban carbon emission performance: evidence from China. Heliyon 10, e30144. doi:10.1016/j.heliyon.2024.e30144
Wang, B. B., and Qi, S. Z. (2016). The effect of market-based and command-based policy tools on emissions reduction innovation: an empirical analysis based on China’s industrial patents data. China’s Ind. Econ. 2016 (6), 91–108.
Wang, C., Zhan, J. Y., Bai, Y. P., Chu, X., and Zhang, F. (2019). Measuring carbon emission performance of industrial sectors in the beijing–tianjin–hebei region, China: a stochastic frontier approach. Sci. Total Environ. 685, 786–794. doi:10.1016/j.scitotenv.2019.06.064
Wang, H., and Jin, Y. (2007). Industrial ownership and environmental performance: evidence from China. Environ. Resour. Econ. 36 (3), 255–273. doi:10.1007/s10640-006-9027-x
Wang, Q., and Su, M. (2020). Drivers of decoupling economic growth from carbon emission – an empirical analysis of 192 countries using decoupling model and decomposition method. Environ. Impact Assess. Rev. 81, 106356. doi:10.1016/j.eiar.2019.106356
Wang, Q., Zhang, F., Li, R., and Sun, J. (2024). Does artificial intelligence promote energy transition and curb carbon emissions? The role of trade openness. J. Clean. Prod. 447, 141298. doi:10.1016/j.jclepro.2024.141298
Wang, X., Fan, G., and Yu, J. (2017). Marketization index of China’s provinces. Beijing, China: Social Sciences Academic Press.
Wang, X., Qin, C., Liu, Y., Tanasescu, C., and Bao, J. (2023). Emerging enablers of green low-carbon development: do digital economy and open innovation matter? Energy Econ. 127, 107065. doi:10.1016/j.eneco.2023.107065
Wang, X., Sun, X., Oprean-Stan, C., and Chang, T. (2023). What role does global value chain participation play in emissions embodied in trade? New evidence from value-added trade. Econ. Anal. Policy 80, 1205–1223. doi:10.1016/j.eap.2023.10.018
Wang, X., Wang, K., Xu, B., and Jin, W. (2025). Digitalisation and technological innovation: panaceas for sustainability? Int. J. Prod. Res., 1–18. doi:10.1080/00207543.2025.2468883
Wang, Y., and Shen, N. (2016). Environmental regulation and environmental productivity: the case of China. Renew. Sust. Energ. Rev. 62, 758–766. doi:10.1016/j.rser.2016.05.048
World Bank (1995). Bureaucrats in business: the economics and politics of government ownership. Oxford, England: Oxford University Press.
Wu, Y., and Wan, J. (2024). The race between global economic growth and carbon emissions: based on a comparative study of developed and developing countries. Environ. Sci. Pollu. Res. 31, 19226–19243. doi:10.1007/s11356-024-32275-4
Xie, R. H., Yuan, Y. J., and Huang, J. J. (2017). Different types of environmental regulations and heterogeneous influence on ‘green’ productivity: evidence from China. Ecol. Econ. 132, 104–112. doi:10.1016/j.ecolecon.2016.10.019
Xinhua News Agency (2022). National bureau of statistics: energy consumption per unit of GDP in China has decreased by 3.3% annually over the past 10 years. Beijing, China: Xinhua News Agency. Available online at: https://www.gov.cn/xinwen/2022-10/08/content_5716737.htm.
Yang, J., Cheng, J. X., and Huang, S. J. (2020). CO2 emissions performance and reduction potential in China’s manufacturing industry: a multi-hierarchy meta-frontier approach. J. Clean. Prod. 55, 120226. doi:10.1016/j.jclepro.2020.120226
Yang, Z. B., Fan, M. T., Shao, S., and Yang, L. L. (2017). Does carbon intensity constraint policy improve industrial green production performance in china?A Quasi-DID analysis. Energy Econ. 68, 271–282. doi:10.1016/j.eneco.2017.10.009
Yuan, B., Li, C., and Xiong, X. (2021). Innovation and environmental total factor productivity in China: the moderating roles of economic policy uncertainty and marketization process. Environ. Sci. Pollut. Res. 28, 9558–9581. doi:10.1007/s11356-020-11426-3
Zhang, C., Fang, J., Ge, S., and Sun, G. (2024). Research on the impact of enterprise digital transformation on carbon emissions in the manufacturing industry. Int. Rev. Econ. Finance 92, 211–227. doi:10.1016/j.iref.2024.02.009
Zhang, N., and Choi, Y. (2013). Total-factor carbon emission performance of fossil fuel power plants in china:a metafrontier non-radial malmquist index analysis. Energy Econ. 40, 549–559. doi:10.1016/j.eneco.2013.08.012
Zhang, W., Liu, X., Zhao, S., and Tang, T. (2024). Does green finance agglomeration improve carbon emission performance in China? A perspective of spatial spillover. Appl. Energy 358, 122561. doi:10.1016/j.apenergy.2023.122561
Zhou, P., Ang, B. W., and Poh, K. L. (2008). ‚A survey of data envelopment analysis in energy and environmental studies. Eur. J. Oper. Res. 189 (1), 1–18. doi:10.1016/j.ejor.2007.04.042
Zhou, P., Delmas, M. A., and Kohli, A. (2017). Constructing meaningful environmental indices:a nonparametric frontier approach. J. Environ. Econ. Manag. 85, 21–34. doi:10.1016/j.jeem.2017.04.003
Zhou, T., Huang, X. H., and Zhang, N. (2023). The effect of innovation pilot on carbon total factor productivity: quasi-Experimental evidence from China. Energy Econ. 125, 106895. doi:10.1016/j.eneco.2023.106895
Keywords: manufacturing, indirect CO2 emissions, total factor carbon emission productivity, global Malmquist–Luenberger index, instrumental variable method, inverted U-shaped curve
Citation: Hao Z and Wang X (2025) Total factor carbon emission productivity in China’s manufacturing industry: a study considering indirect carbon emissions. Front. Environ. Sci. 13:1517645. doi: 10.3389/fenvs.2025.1517645
Received: 26 October 2024; Accepted: 19 June 2025;
Published: 28 July 2025.
Edited by:
Jinyu Chen, Central South University, ChinaReviewed by:
Zhibo Zhao, Qilu University of Technology, ChinaXiaoqing Wang, Ocean University of China, China
Dimitrios Pappas, Queen’s University Belfast, United Kingdom
Hua Fu, Peking University, China
Copyright © 2025 Hao and Wang. This is an open-access article distributed under the terms of the Creative Commons Attribution License (CC BY). The use, distribution or reproduction in other forums is permitted, provided the original author(s) and the copyright owner(s) are credited and that the original publication in this journal is cited, in accordance with accepted academic practice. No use, distribution or reproduction is permitted which does not comply with these terms.
*Correspondence: Zhijie Hao, MTM5NTE3ODcxMTJAMTYzLmNvbQ==