 Xi Zhu1,2
 Qingqing Gui
 Guangming Yang
- 1Chongqing Machinery & Electronics Holding (Group) CO., Chongqing, China
- 2School of Public Administration, Chongqing University, Chongqing, China
- 3School of Geography and Tourism, Chongqing Normal University, China
- 4School of Economics and Management, Nanchang University, Nanchang, China
- 5School of Management, Chongqing University of Technology, Chongqing, China
Promoting the coupling and coordinated development of green economic efficiency (GEE) and new-type urbanization (NTU) is of great significance for high-quality regional development. Based on the data of 30 provinces (autonomous regions and municipalities directly under the Central Government) in China from 2006 to 2021, the coupling coordination model is used to measure the coupling coordination level between GEE and NTU, and the Dagum Gini coefficient is used to analyze the difference between the two coupling coordination degrees (CCD). Fuzzy set qualitative comparison analysis (fsQCA) was used to explore the influencing factors of the two from the perspective of configuration, so as to clarify the conditional configuration and multiple paths that drive the improvement of the coupling coordination degree of the two. The results show that: (1) GEE and NTU in China are on the rise in most areas of the country. (2) The CCD between GEE and NTU in China is generally on the rise; The spatial distribution showed a decreasing trend in East China, Central China, Northeast China and West China. (3) The Gini coefficient of CCD between the two shows an overall upward trend, and the overall gap of the coupling relationship is gradually increasing. (4) Openness to the outside world is the core condition of high coupling coordination degree, and the industrial structure-opening to the outside world cooperative and opening to the outside world leading path can produce high coupling coordination degree. According to the provinces and regions of different coordination levels, different policy suggestions are put forward to promote the continuous collaborative development of GEE and NTU.
1 Introduction
The escalating challenges of global climate change and environmental degradation necessitate a paradigm shift in development models to achieve the dual objectives of climate stability and economic growth. The United Nations Sustainable Development Goals (SDGs) emphasize the critical importance of synergistic alignment between “inclusive economic growth” and “environmental sustainability” in global development visions. Within this context, green economy efficiency (GEE) has emerged as a pivotal metric for assessing both economic growth quality and environmental protection. By integrating traditional inputs with environmental pollution factors, GEE establishes a comprehensive “total-factor” evaluation framework that overcomes the limitations of conventional efficiency indicators (Zhao et al., 2020). Particularly in developing countries, GEE provides a quantifiable decision-making benchmark to resolve the “growth-pollution” paradox, enabling the measurement of economic gains per unit of environmental cost and revealing the true costs and benefits of green transitions. Concurrently, new-type urbanization (NTU) transcends traditional urban expansion logic by prioritizing human-centered development under ecological constraints, embodying the “strong sustainability” paradigm that recognizes natural capital as irreplaceable and requires systemic integration of economic restructuring and spatial reorganization (Daly, 1997). The coupling mechanism between GEE and NTU operates through multidimensional interactions involving resource allocation, industrial upgrading, technological innovation, and institutional coordination, forming a virtuous cycle of urbanization quality enhancement–green technology diffusion–environmental pressure mitigation–economic efficiency improvement. This multidimensional coupling positions NTU as a spatial carrier for GEE enhancement, with their synergy constituting a “dual-engine” system for high-quality development. However, existing studies predominantly examine their unilateral impacts, leaving significant gaps in understanding their interactive mechanisms and dynamic evolution patterns, which demand interdisciplinary integration and multidimensional analysis for breakthroughs.
As the world’s largest developing country, China plays a pivotal role in demonstrating the coordinated advancement of the green economy and NTU. Since the 18th National Congress of the Communist Party of China (CPC), the central government has advocated “a new urbanization path with Chinese characteristics,” prioritizing ecological conservation while elevating urbanization quality (Wang et al., 2023). The 14th Five-Year Plan explicitly outlines strategies for synergistic development of green initiatives and NTU, emphasizing ecological civilization construction and urban sustainability during urbanization. The Chinese government has recognized that NTU is not only the transfer of population from the countryside to the city, but also a process of comprehensively improving the comprehensive carrying capacity of the city and realizing the coordinated development of the economy, society, resources and environment. Therefore, in the development of NTU road, it is necessary to make it and the green economy coordinated development of the same concept, in order to ensure the quality and speed of common development, to avoid the first cause of pollution, and then spend efforts to deal with the detour (Zhong and Chen, 2022).
Since Pearce et al. introduced the green economy concept by critiquing the environmental costs of traditional growth models (Pearce et al., 1989), academic discourse has evolved beyond the economy-environment dichotomy. Jacobs and Postel expanded the theoretical framework by incorporating social and organizational capital, establishing a “four-dimensional capital” (human, natural, social, organizational) paradigm that underpins GEE’s total-factor assessment (Jacobs, 1997; Postel and Carpenter, 1997). With the advancement of the global sustainable development agenda, GEE research has formed two major branches at the methodological level: parametric approaches (e.g., stochastic Frontier analysis SFA) capture the dynamic impact of external shocks on the efficiency Frontier by introducing stochastic error terms (Khoshbakht et al., 2018; Fall et al., 2018), while non-parametric approaches (centered on data envelopment analysis DEA) have become mainstream by virtue of the advantages of not requiring a predefined production function and circumventing subjective empowerment (Liu and Dong, 2021). Among them, the non-radial, non-angle SBM model has been widely used in provincial-scale GEE measurement because it can effectively solve the input-output relaxation problem, pushing the research from static efficiency assessment to dynamic measurement that includes non-expected outputs (Tone, 2001; Zhu et al., 2024). In recent years, the research focus has been extended to the heterogeneity analysis of GEE driving mechanisms: on the one hand, the role paths of emerging elements such as environmental information disclosure and digital financial inclusion have been gradually revealed (Zhu et al., 2024; Zheng et al., 2022; Wang et al., 2022); on the other hand, the inhibitory effect of macro-disturbances such as economic policy uncertainty has triggered reflections on institutional resilience (Ma et al., 2022).
China’s systemic urbanization challenges were first identified in 2003, rooted in imbalances between socialist economic institutions and urbanization demands (Zhang and Zhao, 2003). The CPC’s 16th National Congress introduced the “Chinese-style Urbanization” strategy, laying NTU’s foundation. Early studies focused on conceptualizing NTU and constructing evaluation systems. Shao and Wang built a comprehensive evaluation system of NTU construction from four dimensions of population, environment, economy and society (Shao and Wang, 2023). Z Zhao and Wang constructed the NTU comprehensive evaluation index system from five dimensions: population, economy, space, society and green (Zhao and Wang, 2022). Subsequent research highlighted regional disparities: Zhang et al. identified geographic marginality and human capital deficits as barriers to NTU in underdeveloped regions (Zhang et al., 2022), while Qian et al. attributed 32% efficiency loss in central-western cities to technological stagnation and pollution control failures (Qian et al., 2021). Spatial econometric analyses revealed NTU’s spillover effects, with Xu and Jiao demonstrating urban industrial chain radiation diminishing beyond 150 km (Xu and Jiao, 2021). Studies also uncovered bidirectional NTU-environment relationships: Cai et al. proposed that in the early stage of NTU, the inhibitory effect of NTU on the ecological environment was dominant (Cai et al., 2021), while Liu et al. emphasized public service optimization and green infrastructure investments (Liu et al., 2018).
Recent studies have increasingly examined the interaction mechanisms between NTU and green economic development. Scholars have demonstrated measurable synergistic effects through empirical analyses. Zhou et al. found green finance-NTU coordination boosted GEE by 18.7% with 800 km spillover range (Zhou et al., 2025). Hu et al. revealed that the integration of digital economy with industrial ecologization in the Yangtze River Delta strengthens NTU effects, generating a 0.311-unit marginal improvement in GEE (Hu et al., 2025). Nonlinear dynamics are evident: Xiang et al. identified a U-shaped evolution pattern between urbanization and carbon efficiency, with the critical transition occurring at 65% urbanization rate (Xiang et al., 2024). Simultaneously, Xia et al. identified an inverted U-shaped correlation in water-energy-food system pressures, demonstrating the necessity of circular economy strategies when decoupling indices surpass 0.58 (Xia et al., 2024). Empirical assessments of carbon emission trading systems confirmed a 31.56% GEE enhancement in pilot cities, accompanied by measurable pollution transfer effects quantified at 0.17 intensity units (Yan and He, 2024). Despite progress, fragmented understanding of economy-space interactions, static spatiotemporal analyses, and policy coordination gaps persist, necessitating systematic investigation of GEE-NTU coupling dynamics.
Therefore, the marginal contribution of this paper is divided into the following three points: (1) Most of the existing researches focus on the relationship between economic development or green and NTU, and few scholars put GEE and NTU into a research framework. This study aims to enrich the research on GEE and NTU and propose a new research framework. (2) Study the dynamic change of Gini coefficient of the coupling coordination relationship between GEE and NTU at different time scales and spatial scales, so as to further analyze its spatio-temporal pattern and dynamic evolution law. (3) By using the fsQCA method, the configuration analysis of factors affecting CCD between GEE and NTU was carried out to explore the factors affecting the coupling and coordinated development of GEE and NTU, and the key to the coupling and coordinated development of GEE and NTU was found. Based on the coupling coordination model, this paper will explore the coupling coordination development mechanism of GEE and NTU, analyze the key factors affecting their coordinated development, and put forward corresponding policy suggestions, in order to provide theoretical support and practical guidance for realizing the coordinated development of economy, society, resources and environment.
2 Data description and model construction
2.1 Index system construction
2.1.1 GEE evaluation index system
Based on the rationality and scientificity of the index system, on the basis of existing research results (Zhao et al., 2020; Zhao and Wang, 2022; Yang and Ni, 2022), combined with the input-output theory, The GEE measurement index system, which includes three input indicators (Capital stock, Energy Consumption, Year-end employees), one expected output (GDP) and three unexpected outputs (CO2 emissions, Industrial wastewater emissions, Industrial waste gas emissions, and Industrial solid waste production), is constructed. The undesirable output is modeled as a “Reverse productivity” factor, and the efficiency value will be deducted proportionally if the pollution emission exceeds the minimum feasible level of the same type of efficient provinces. This design allows high-polluting provinces to earn lower Gee scores for excessive environmental costs even when their economic output is high, thus promoting quantitative comparisons of “Green Growth.” The specific measurement indicators are shown in Table 1.
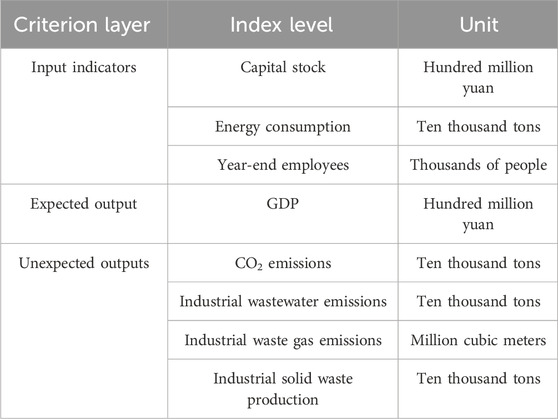
Table 1. GEE evaluation index system.
2.1.2 NTU evaluation index system
According to the National New Urbanization Plan (2014–2020), based on the scientificity and rationality of indicators and the availability of data, From population urbanization (Zhang et al., 2022; Qian et al., 2021; Cai et al., 2021) (Proportion of employment in tertiary industry, Registered urban unemployment rate, Proportion of urban population in total resident population), economic urbanization (Chen et al., 2018) (Per capita GDP, Proportion of secondary and tertiary industries in GDP, Per capita local fiscal revenue, Per capita living consumption expenditure of urban residents), and spatial urbanization (Chen et al., 2018; Chen et al., 2016) (Urban population density, Urban built-up area, Per capita road area), social urbanization (Zhao and Wang, 2022; Zhang et al., 2023; Wang et al., 2019) (Water penetration rate, Gas penetration rate, number of beds in medical institutions, Number of Internet access ports, Proportion of education expenditure in fiscal expenditure), ecological urbanization (Feng Y. et al., 2023) (Green coverage rate of built-up areas, Per capita green area of parks, Harmless treatment rate of household waste, and Comprehensive utilization rate of industrial solid waste), NTU level measurement with 19 indicators was constructed Indicator system, specific indicators are shown in Table 2.
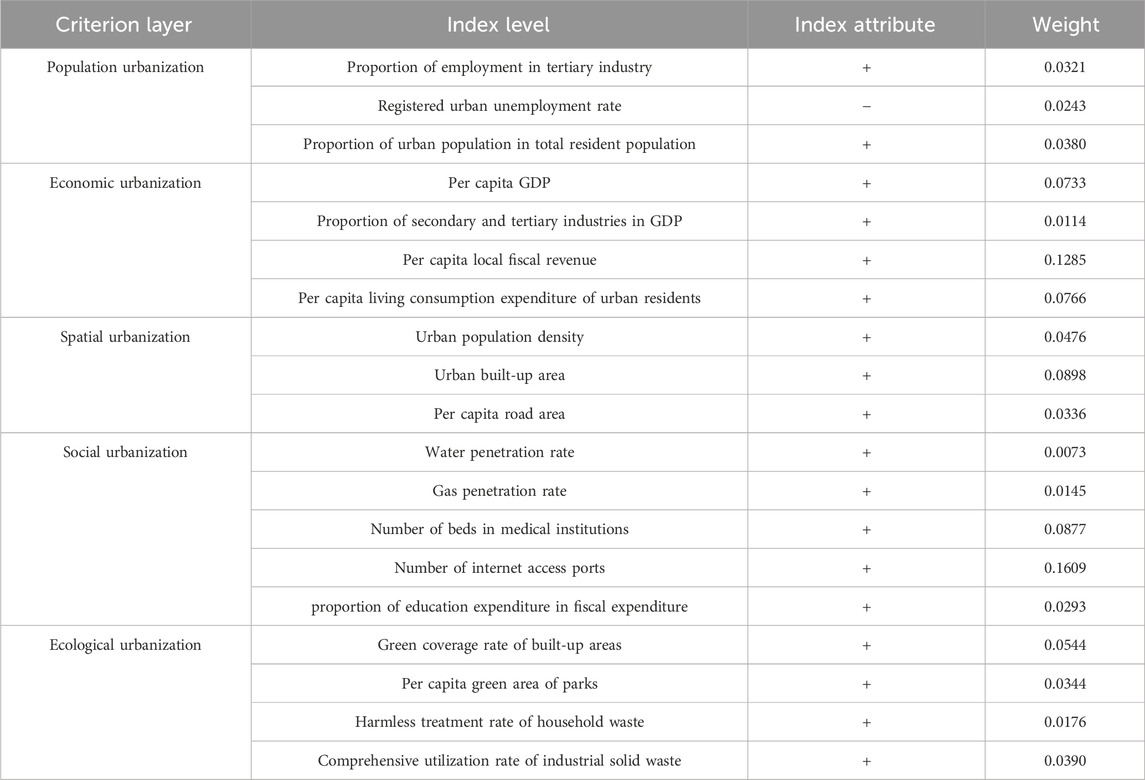
Table 2. NTU evaluation index system.
2.1.3 The coupling coordination between GEE and NTU
NTU development promotes GEE. NTU provides employment opportunities and increases residents’ incomes, which in turn increases spending power and expands demand for green products and services, which in turn boosts GEE. By improving infrastructure and enhancing public services, NTU can improve residents’ quality of life, increase environmental awareness and promote green consumption.
GEE affects the development of NTU. The improvement of GEE contributes to the reduction of environmental pollution, which in turn promotes the sustainable development of NTU. The promotion of GEE can promote the development of green industries, technological advances, and improvements in energy efficiency, which are important components of NTU.
2.2 Model method
2.2.1 Determination of index weights
To overcome the subjectivity of indicator weights, the weights are calculated using the maximum entropy value approach (Feng C. et al., 2023), and for the m (m = 30) provinces being analyzed in this study, there exist n (n = 19) urbanization evaluation indicators, thus forming the original talent environment indicator data matrix X =
Standardization of the raw data. The higher value of the positive indicator indicates higher urbanization, then the calculation formula is:
where the unemployment rate is the inverse indicator, calculated by the formula
Calculate the entropy value of each individual index with the formula
Determine the coefficient of variation of the jth indicator
Calculate the weight of the jth indicator.
Calculate the overall urbanization score of each city.
2.2.2 Super-efficiency SBM model
Data Envelopment analysis (DEA), originally proposed by operations research scientists, is a nonparametric technical efficiency analysis method that can be used to evaluate the relative efficiency of decision-making units (DMUs) that include multiple input and output indicators. To address the problem that traditional DEA models disregard variables when measuring economic efficiency and fail to distinguish and rank multiple equally efficient decision units, Tone proposed the Super-efficiency SBM model based on the conventional DEA model (Tone, 2002). This model can provide better consideration of non-desired outputs and reduce the effect of inaccuracies on the outcomes of measuring GEE. Hence, this paper opts for the Super-efficiency SBM model to assess the GEE of each province to capture more significantly the inter-provincial differences in GEE. Every province serves as a decision-making unit, while the indicator data from 2006–2021 are utilized. The specific model is as follows Equations 9, 10:
where: n is the number of decision units, there are m inputs to each decision unit, r expected outputs and p unexpected outputs, x,
2.2.3 Coupling coordination degree model
The CCD pattern originates from physics and is mainly used in analysis to describe the phenomenon of interactions among two or more systems. The coupling degree is used to characterize the degree of closeness (strength) at which multiple systems interact with one another, and the coordination degree is employed to measure the level of shared balance and coordination between systems or elements (Sun et al., 2024; Yang et al., 2023). With the following Equations 11, 12:
The coupling degree, denoted by C in this case, has a value range
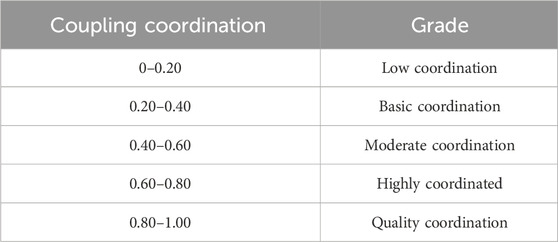
Table 3. Coupling coordination degree level.
2.2.4 Dagum Gini coefficient analysis
In this essay, refer to the investigation of Zhang et al. (2024), which utilized the Dagum Gini coefficient to analyze regional deviations in the CCD of GEE and NTU level and conducted a difference decomposition analysis, divided its research subjects into z groups containing n research subjects, a, b, … represent the subgroups, na, nb , … denote the number of research subjects in each group, yai, ybj , … denote the variable information of any group of research subjects, and in this paper, it denotes the CCD of GEE and NTU degree. In general, the level of linkage and coordination is tighter and the synergy is stronger when the Gini coefficient has a lesser value. The calculation process is described in Equations 13-20.
where pa = na/n,sa = na
2.2.5 Qualitative comparative analysis of fuzzy sets
Qualitative Comparative Analysis (QCA) is a kind of method study oriented research method suggested in 1987 by American sociologist Ragin, based on technical tools such as Boolean algebra and aggregation, which is dedicated to exploring and uncovering causal complexity with both qualitative and quantitative attribute (Handrich and Ragin, 2000). Holistic perspective to conduct comparative case analysis and examine the impact of multiple factors constituting a grouping rather than a single factor on the outcome (Huang et al., 2023). In this paper, we choose the fsQCA approach to investigate the complex causal relationships and influencing factors of the CCD development of GEE and NTU in 30 provinces in Chinese mainland for the following three reasons. Firstly, the interaction between GEE and NTU is complex, and the CCD are influenced by the synergy of several factors. fsQCA can examine the conditional combination of multiple factors from a group perspective rather than focusing solely on the impact of one single factor on the outcome variable (González-Cruz et al., 2018), which is more helpful to explore the differentiated paths of many factors acting on the CCD between GEE and NTU. Secondly, due to quantity limitations, 30 provincial areas in China are chosen as sample cases in this paper, and the sample size does not reach the case sample demand of traditional quantitative analysis. In contrast, fsQCA is unique in that it can be applied not only to small and medium sample cases but also to large cases involving over 100 cases. The 30 sample cases in this paper are of a medium size, which meet the basic requirements of fsQCA. Thirdly, compared to clear set qualitative comparative analysis (csQCA) and multi-value set qualitative comparative analysis (mvQCA) (Roig-Tierno et al., 2017), fsQCA is more suitable for dealing with continuous variables and avoiding information loss during the data transformation procedure. Therefore, this paper chooses fsQCA to analyze in depth the antecedent conditions and the differences between the group effects that can achieve high CCD between green economy effects and NTU in each province, and to clarify the specific paths that affect the CCD in different provinces.
2.3 Data source
Due to the availability and completeness of data, this paper selects 30 provinces (autonomous regions and municipalities directly under the Central Government) in China from 2006 to 2021 as research objects, excluding Tibet Autonomous Region, Taiwan Region, Hong Kong and Macao Special Administrative Region for the time being. The statistical data are derived from China Statistical Yearbook, China Energy Statistical Yearbook, China Environmental Statistical Yearbook, China Tertiary Industry Statistical Yearbook and China Urban Construction Statistical Yearbook from 2007 to 2022. Some of the missing data were estimated using the average growth rate of the next 3 years. Regarding statistical outliers, an adjusted imputation methodology was implemented to ensure data robustness.
3 Result analysis
3.1 Spatio-temporal characteristics of GEE and NTU
3.1.1 GEE spatial and temporal characteristics
In terms of GEE, the average value of GEE in China’s provinces from 2006 to 2021 is 0.61, which has a large room for improvement, indicating that China’s green economy development mode is irrational, and it is an extensive development mode that should take the road of intensive and concursive development of “low consumption, low pollution and high efficiency” in the future. From the perspective of time (Figure 1), GEE in China’s provinces showed a fluctuating upward trend, and the average GEE in China’s provinces rose from 0.61 in 2006 to 0.69 in 2021, an increase of 12.64%.
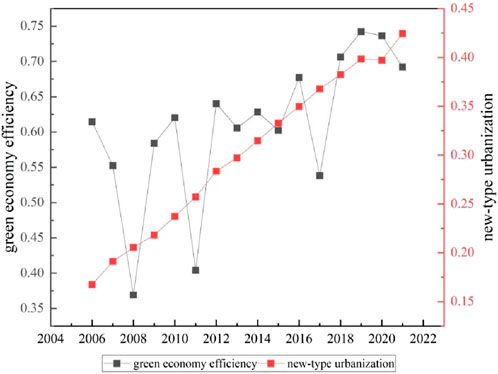
Figure 1. GEE and NTU trends in China from 2006 to 2021.
From a spatial perspective (Figure 2), GEE in East China generally presents an upward trend year by year, while GEE in West China presents a fluctuating downward trend, and GEE in the coastal areas of East China continues to rise in a more stable trend. This phenomenon is mainly related to the stage of national economic development. In 2006, GEE in West China was significantly higher than that in the east, because in the early period, the eastern region developed rapidly, with the help of the opening up policy, strong economic growth, leading the process of industrialization and urbanization, attaching importance to economic benefits, relying more on manufacturing and industrial production, with low GEE; At the end of 2006, the country passed the “Eleventh Five-Year Plan” for the development of the West, before the western economic development has been lagging behind, industrialization, urbanization to be developed, less high pollution and high energy consumption industries, GEE is relatively high. In 2011, the GEE in West China decreased significantly, because after 5 years of western development project, the economic development of the western provinces grew faster, industrialization accelerated, energy consumption increased significantly, resulting in an increase in carbon dioxide and waste emissions and a decrease in GEE. In 2016, the overall GEE increase, East China is higher than West China, this is because the structural reform of the supply side, promote East China, West China industrial structure adjustment, while East China is economically developed, economic growth promotes technology spillover, technological innovation improves the utilization rate of production factors, so GEE is higher than the west. In 2021, the gap in GEE level between East China and West China will widen, East China’s level will continue to improve, and West China’s level will decrease, because East China’s economy is more developed, technological innovation and rational allocation of resources will be continuously realized, and new energy will be developed, thereby improving GEE. So GEE goes down.
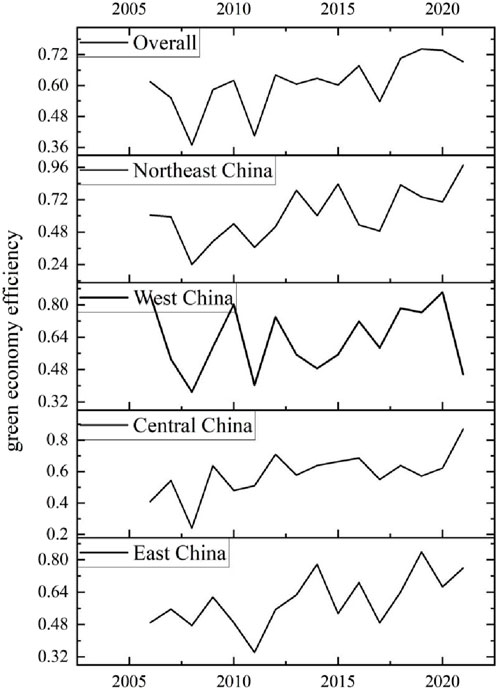
Figure 2. GEE change trend in China from 2006 to 2021.
3.1.2 Spatial and temporal characteristics of NTU
In terms of NTU, the average NTU in China’s provinces from 2006 to 2021 is 0.30, which has great room for improvement, indicating that there are still many loopholes in NTU at this stage. From the perspective of time (Figure 1), the NTU index of China’s provinces increased during 2006–2021, and showed an increasing trend, from 0.17 in 2006 to 0.42 in 2021, indicating that NTU showed a continuous increasing trend.
From the perspective of space (Figure 3), the overall distribution of NTU in East China is higher than that in West China, which indicates that NTU in East China is relatively high, while Central China, West China and Northeast China need to be strengthened and improved, and the regional development level is unbalanced. Although NTU in the central and western regions is improving as a whole, there is still a certain gap with the eastern coast. This is because in 2014, the State put forward the National NTU Plan (2014–2020), attaching importance to promoting the construction of NTU, and various provinces actively carried out NTU construction pilots to explore the development model of NTU. At the same time, the eastern coastal areas have a high degree of openness to the outside world, active economy, large capital stock, obvious technology spillover effect, high population concentration, and NTU effect is more significant.
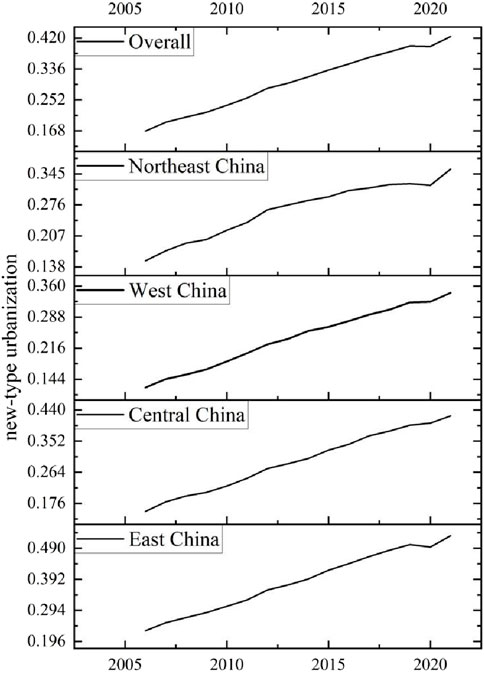
Figure 3. Variation trend of NTU level in China from 2006 to 2021.
3.1.3 CCD spatiotemporal characteristics of GEE and NTU
The average CCD of GEE and NTU from 2006 to 2021 is 0.63, but it still needs to be gradually improved, and the formation system also needs to be gradually improved. It is urgent to explore the influencing factors of the coupling and coordination of the two. From the perspective of time (Figure 4), CCD of GEE and NTU showed a trend of increasing year by year from 2006 to 2021, which indicates that the interaction between GEE and NTU is close and improved, and it is predicted that the relationship between the two will develop better in the future.
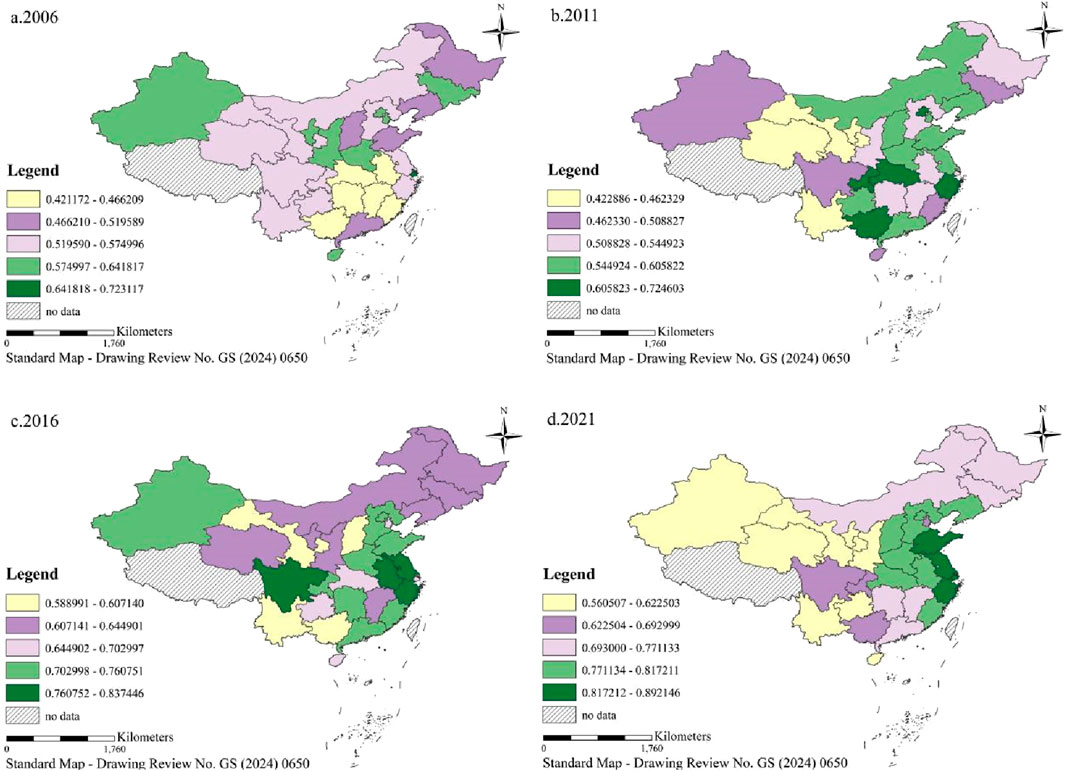
Figure 4. CCD trends of GEE and NTU in China from 2006 to 2021 (a). Distribution of CCD in 2006; (b). Distribution of CCD in 2011; (c). Distribution of CCD in 2016; (d). Distribution of CCD in 2021.
From the perspective of space (Figure 4), similar to the spatial distribution pattern of NTU, the spatial distribution characteristics of East China, Central China, North East China and West China decrease, and the coupling coordination level between regions is unbalanced. The development of NTU and the improvement of GEE promote and achieve each other. In the development of NTU, more attention should be paid to the equal symbiosis between urban and rural systems in the unity of nature, to achieve the sustainability of the ecological foundation, to continuously improve the living environment, to improve the efficiency of resource use, and to significantly increase the carrying capacity of urban development. Strengthen the development of green economy, improve the level of healthy and green living, and realize the trinity goal strategy of “efficiency, harmony and sustainability,” so as to promote the green and healthy development of cities and towns, and promote the advancement of NTU. At the same time, the development of NTU is bound to be accompanied by the development and promotion of green energy conservation in various industries, thus improving GEE.
Further, the mean CCD levels of each province and city are classified as shown in Table 4. As can be seen from Table 4, there are some differences in CCD among provinces and cities, but most of them gather in the highly coordinated stage, without high-quality coordination; There are 25 provinces and cities in the highly coordinated stage, which have huge room for improvement in the future. There are five provinces and cities in the moderate coordination stage, and these provinces and cities have greater potential to develop into highly coordinated; The provinces and cities in the stage of low degree coordination and basic coordination are 0. It can be seen that the current CCD of GEE and NTU still has a large room for improvement, especially the moderate coordination should be paid attention to.
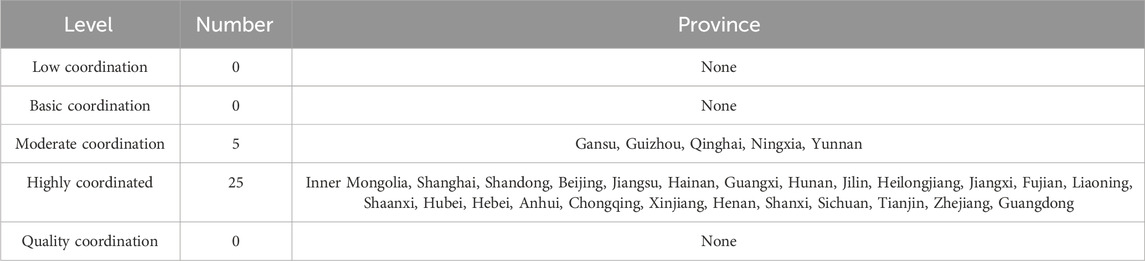
Table 4. Average CCD levels of each province from 2006 to 2021.
3.2 Regional difference analysis
Based on the calculation method of Gini coefficient, Matlab2016 was applied to calculate the Gini coefficient of GEE and NTU horizontal CCD in China’s provinces, and the results are shown in Table 5. From 2006 to 2021, the Gini coefficients of GEE and NTU CCD in China’s provinces generally show an upward trend, from 0.069 in 2006 to 0.075 in 2021, an increase of 0.006, with a decrease of 9%, which indicates that the overall gap between GEE and NTU coupling relations in China’s provinces has an increasing trend. And the coupling difference between provinces is also gradually increasing.
(1) Differences within four regional groups
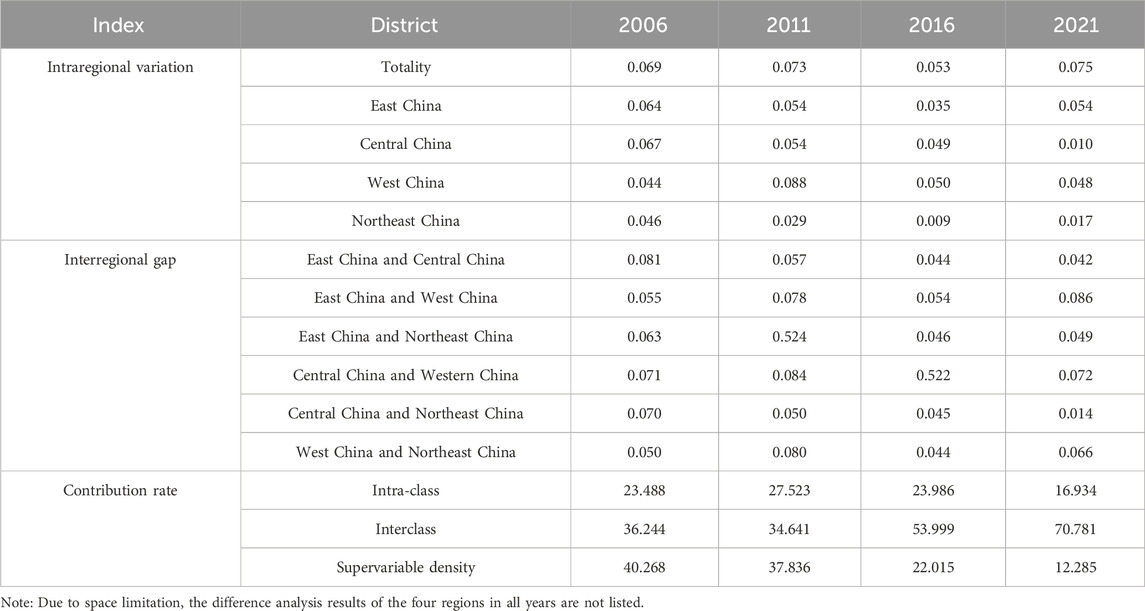
Table 5. Difference analysis of the four regions.
During the observation period, the upward trend of the horizontal coupling relationship between GEE and NTU in West China is the closest to the overall upward trend. The intra-regional differences in East China, Central China and North East China show a downward trend, among which Central China has the largest decline, from 0.067 in 2006 to 0.01 in 2021, with a decrease rate of 85%. The northeast China region is the second, decreasing from 0.046 in 2006 to 0.017 in 2021, with a decrease rate of 63%. The smallest decline was in eastern China, where the decline was only 16%. On the whole, there was a large difference in the overall trend between the differences within each group, which also indicated that the unbalanced development of CCD between GEE and NTU in the region was significant. Therefore, on this basis, the paper further explores the differences among the four regional groups.
(2) Differences among the four regional groups
From the perspective of time trend, the inter-group gap of the coupling relationship between GEE and NTU in various provinces in China has decreased in general, and the Gini coefficient of inter-group difference has the largest change amplitude in central China and Northeast China. The Gini coefficient decreased by 0.056 (80%) during 2006–2021. The regional gap between East and Central China was the second largest, with a decrease of 48%, followed by East and Northeast China, with a decrease of 22%. However, the regional gap between East China and West China, Northeast China and West China, and Central China and West China has increased, with the largest increase in East China and West China, up to 56%.
(3) Decomposition of regional differences
In order to further study the root causes of regional differences of coupling coordination, Gini coefficients were divided into intra-group, inter-group and super-variable density, and their contribution rates were calculated. During the observation period, the difference between groups has been an important source of regional differences in CCD, and the average contribution rate is 48.916%, which increases by 34.537% points compared with 2006 in 2021. The average contribution rate of intra-group difference was 22.98%, and the contribution rate showed a continuous decline from 2016 to 2021, with a year-on-year decrease of 6.554% points. The average contribution rate of super-variable density was 28.101%, showing a linear decline as a whole, which decreased by 27.983% points in 2021 compared with 2006.
4 Analysis of influencing factors
4.1 Variable selection and calibration
4.1.1 Selection of influencing factors
Drawing on an examination of the CCD between GEE and NTU, and drawing on the existing research outcomes in the academic field, economic development, industrial structure, openness to the outside world, technological innovation, government expenditure and environmental regulation are used as the antecedent condition variables to explore their multiple causal relationships with the CCD of GEE and NTU. The descriptions of the variables are specified in Table 6.
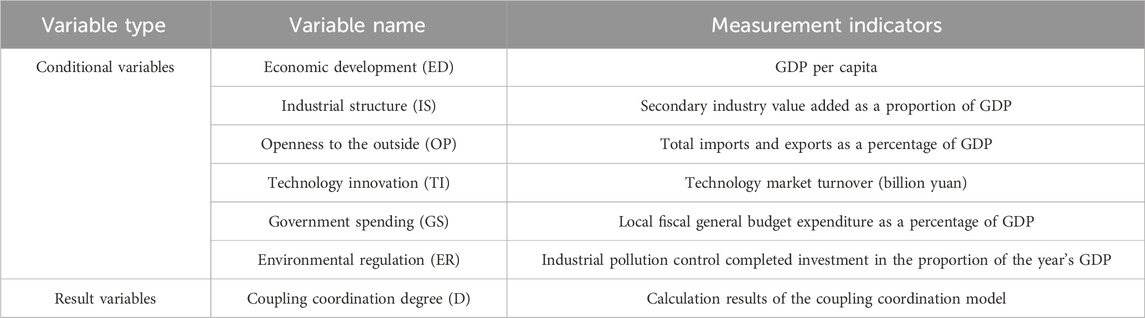
Table 6. Variable descriptions.
4.1.2 Data calibration
Calibration of data is essential for fsQCA analysis., and in this study, we combined the actual distribution of each variable and realistic situations, and borrowed from Garcia-Castro and Francoeur’s treatment (Garcia-Castro and Francoeur, 2016) to define the 25%, 50%, and 75% quantile values of each dependent variable as fully unaffiliated, cross and full affiliation, subsequently the method of direct calibration was employed to convert the dependent variable measures into fuzzy scores of 0–1, and the calibration results are presented in Table 7.
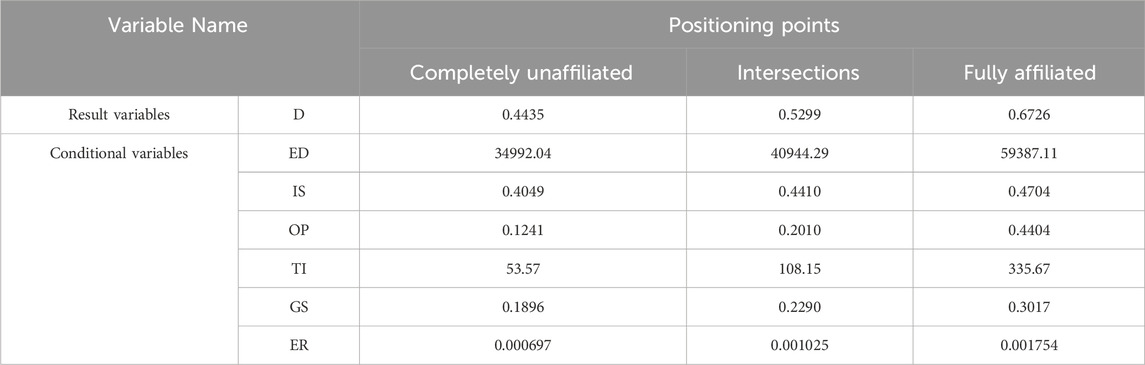
Table 7. Calibration positioning points for each variable.
4.2 Necessity analysis
Consistency is a critical sign of a required condition; if the consistency value is greater than 0.9, the condition is deemed essential for the result. The necessary condition to produce high CCD was tested using fsQCA3.1 software, and the results (Table 8) indicate that the consistency level of each single antecedent variable did not exceed the critical value of 0.9, suggesting that the production of high CCD does not require any particular condition, i.e., it is difficult to achieve high CCD between GEE and NTU through individual factors. Consequently, to find the multiple condition grouping that produces high CCD, a conformational study of the six antecedent condition variables is required.
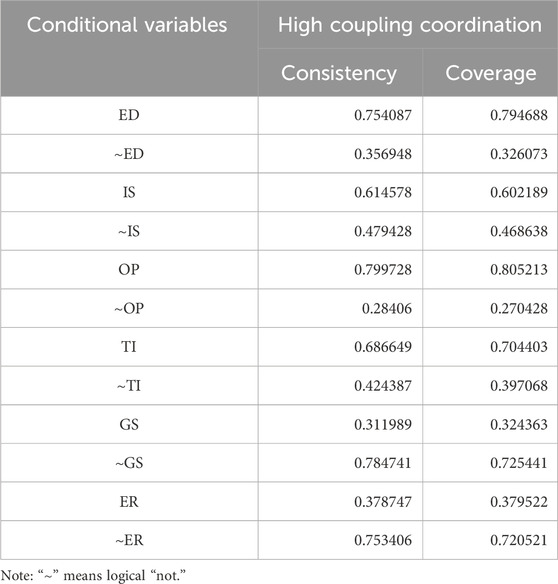
Table 8. Results of the one-way necessity test.
4.3 Adequacy analysis
Considering the case-specific nature of this research and building upon established methodological frameworks (Fiss, 2011; Schneider and Wagemann, 2012), we calibrated analytical thresholds to balance methodological rigor with theoretical sensitivity. The probability edge index (PRI) consistency threshold was set at 0.7, adhering to Greckhamer’s stringent criteria to eliminate asymmetric relationships between conditions and outcomes, thereby preventing empirical paradoxes and maintaining directional consistency in explanatory logic. The sample consistency threshold of 0.8 follows Ragin’s best practices, enhancing causal sufficiency of conditional configurations while avoiding misidentification of spurious sufficient conditions caused by low consistency (<0.75) (Ragin, 2008; Frambach et al., 2016) and controlling model overcomplexity. The case frequency threshold of one preserves all observed configurations to mitigate limited diversity challenges, with subsequent coverage screening implemented to simplify model complexity without excluding theoretically critical cases (Douglas et al., 2020). Table 9 presents the five histogram paths that yielded high CCD. Each column represents one possible conditional grouping. The separate conditional categories’ consistency is more than the 0.8 criterion value, indicating that this configuration is credible as a sufficient condition for high CCD between GEE and NTU. And the overall consistency of the five conditional groupings is 0.9201, which means that 92.01% of all the provinces that satisfy these five conditional groupings show high CCD. The overall solution coverage was 0.7059, indicating that about 70.59% of the cases with high CCD could be explained in all condition groupings. From the individual condition (cross-sectional) analysis, it is found that the degree of external openness is the core condition of high CCD, which occurs in all five condition groupings that produce high CCD, demonstrating the critical role that high external openness plays in the coordinated and paired development of modern urbanization and regional GEE. This phenomenon demonstrates strong alignment with China’s regional development paradigm. Coastal provinces have likely accelerated structural upgrading through export-oriented industrialization and technology spillover effects, while foreign direct investment (FDI) and global value chain integration have driven clean technology adoption and green infrastructure development. These synergistic mechanisms collectively enhance the coordinated advancement of GEE and NTU.
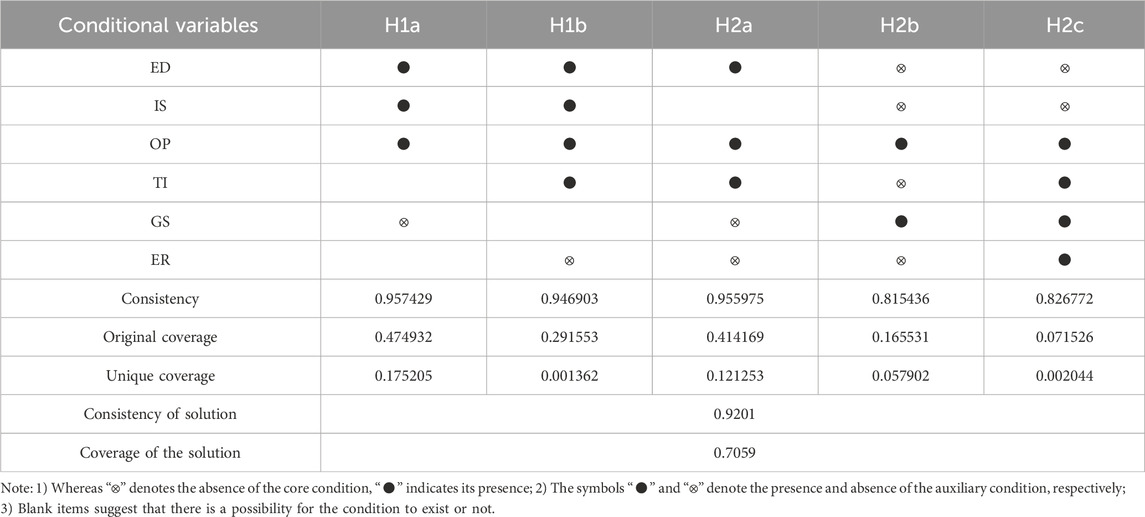
Table 9. Results of the conditional grouping analysis for generating high CCD.
These five grouping paths are analyzed vertically to further identify the differentiated adaptation relationships of each element during the course of driving the CCD development of GEE and NTU. According to the core conditions contained in each condition grouping, they can be categorized into two types of driving paths, i.e., IS-OP dual-drive type and openness to the outside world-led type.
The industrial structure-openness to the outside world dual-drive type. This path contains the grouping H1a and H1b, both of which share the core conditions of high industrial structure and high degree of external openness, covering the provinces of Jiangsu, Zhejiang, Fujian, Guangdong and Shandong. The grouping H1a (ED*IS*OP*∼GS), the core conditions are high industrial structure and high degree of external openness., and the auxiliary conditions are good economic development. This histogram shows that, without considering technological innovation and environmental regulation, a healthy industrial structure and a high degree of external openness., complemented by good economic development, can lead to a high CCD between GEE and NTU, even if government spending is less intensive. The grouping H1b (ED*IS*OP*TI*∼ER), with high industrial structure and high external openness as core conditions, is complemented by beneficial economic development and high degree of technological innovation. This histogram shows that even though the degree of environmental regulation is not strong enough, a high level of economic development, a healthy industrial structure, a high level of openness to the outside world, and active technological innovation can lead to a high CCD between GEE and NTU, with government subsidies as an irrelevant condition.
External openness dominant type. This path comprises the groupings H2a, H2b, and H2c, all three of which have high external openness as their core condition. Grouping H2a (ED*OP*TI*∼GS*∼ER), the core conditions are high external openness, low government spending and weak environmental regulation, and the supporting conditions are high economic development and high technological innovation, covering the provinces of Jiangsu, Guangdong, Beijing, Zhejiang, Shanghai, Hainan and Heilongjiang. The histogram shows that in regions with low levels of government spending and weak environmental regulation, regardless of whether the industrial structure is healthy or not, the coupled and coordinated development of GEE and NTU can be promoted as long as the high level of external openness is complemented by high levels of economic development and technological innovation. The histogram H2b(∼ED*IS*OP*∼TI*GS*∼ER), with the core conditions of high external openness, low economic development and weak environmental regulation, and the supporting conditions of low industrial structure, low technological innovation and high government spending. This histogram shows that even in cases when the regional economic development degree is low, the industrial structure is not healthy enough, the technological innovation degree is low, the environmental regulation intensity is weak, the high level of external openness and government expenditure can still make the CCD of GEE and NTU reach a high level. The grouping H2c(∼ED*∼IS*OP*TI*GS*ER), with the core conditions of low economic development and high openness to the outside world, and the supporting conditions of low industrial structure, low technological innovation, low government spending, and weak environmental regulation. This grouping shows that provinces with high levels of technological innovation, high levels of government spending, and high levels of environmental regulation can achieve breakthroughs with high levels of openness and high levels of GEE and NTU coupled with coordinated development, even in the presence of low economic development and unhealthy industrial structures.
5 Discussion
This study investigates the coupling coordination mechanisms between GEE and NTU, along with their spatial heterogeneity patterns, aiming to unveil the intrinsic dynamics of economy-environment system coevolution during China’s urban transition. Utilizing panel data from 30 provincial administrative regions from 2006 to 2021, we developed an integrated methodological framework incorporating CCD modeling, Dagum Gini coefficient decomposition, and fsQCA. This approach systematically examines the spatiotemporal differentiation characteristics, regional disparity sources, and multifactorial configuration pathways of GEE-NTU synergy, comprehensively revealing coupling mechanisms under diverse resource endowments, policy contexts, and developmental stages to inform differentiated policy design.
Key findings indicate fluctuating growth in national GEE averages from 2006 to 2021, with persistent regional disparities showing eastern regions consistently outperforming central-western areas. This aligns with Zhu et al.’s identification of industrial restructuring and technological innovation as core drivers of eastern GEE enhancement (Zhu et al., 2024). The observed east-west NTU gradient corroborates infrastructure completeness and economic vitality’s role in urbanization quality (Ma et al., 2024; Sun et al., 2023). While 83.3% of provinces achieved high coordination (CCD ≥ 0.6), none reached premium coordination (CCD ≥ 0.9), confirming optimization potential - consistent with He et al.‘s findings on China’s urbanization-low-carbon development coupling stages (He et al., 2024). Xiang et al.‘s U-shaped NTU-carbon efficiency relationship explains central-western CCD fluctuations (Xiang et al., 2024), reinforcing our spatial heterogeneity conclusions. Zhou et al.‘s green finance-NTU synergy (Zhou et al., 2025) and Hu et al.‘s digital economy-mediated industrial ecologization effects (0.311 GEE marginal gain) (Hu et al., 2025) mutually validate our configuration analysis on institutional innovation and technology spillover mechanisms.
This research advances beyond conventional isolated analyses through three innovations: (1) Pioneering a GEE-NTU coupling framework elucidating dynamic interactions; (2) Quantifying regional disparity dominance via Dagum decomposition, informing spatial governance strategies; (3) Integrating disparity quantification and pathway identification through combined Dagum-fsQCA methodology. Compared with Yan et al.‘s single-policy CETS evaluation (Yan and He, 2024), our fsQCA identifies two optimal pathways (“dual industrial-openness drivers” and “openness-dominant”) addressing regional heterogeneity, overcoming conventional policy assessment limitations. Crucially, we establish openness as the universal core condition driving high CCD through dual technology-institutional channels, while revealing expanding east-west CCD Gini coefficients that necessitate differentiated decarbonization policies.
Despite this innovative breakthrough, this study has three limitations: (1) Data currency constraints precluding post-2021 policy impacts; (2) Potential variable selection bias; (3) Underexplored heterogeneity in openness transmission pathways. Future directions include developing multiscale (city cluster-province-county) analytical frameworks to map CCD spatial spillover boundaries, and creating policy-machine learning hybrid models for carbon neutrality scenario simulations.
6 Conclusion and policy recommendations
On the basis of analyzing the interaction between GEE and NTU in China, this paper uses entropy method, super-efficiency SBM model, coupling coordination model and other methods to study the coordination development degree, spatial characteristics and influencing factors of GEE and NTU in 30 provinces (autonomous regions and municipalities) in China. The following conclusions are drawn:
(1) The temporal evolution analysis reveals sustained upward trajectories in GEE, new-type urbanization NTU, and their CCD across most Chinese provinces. 25 out of 30 provinces attained high coordination status though none achieved premium coordination. These findings collectively demonstrate the dynamic synergy formation between China’s NTU and GEE, reflecting significant optimization in their coordinated development patterns, while simultaneously underscoring the long-term nature of the nation’s green transition process.
(2) From 2006 to 2021, the Gini coefficients of CCD of GEE and NTU in China’s provinces generally show an upward trend, which indicates that the overall gap of the coupling relationship between GEE and NTU in China’s provinces has an increasing trend, and the coupling difference among provinces is also gradually increasing.
(3) The conformation analysis of the factors affecting the CCD of GEE and NTU in China shows that the coupling and coordinated development of GEE and NTU are the result of the comprehensive action of many factors, rather than a single factor. There are two main paths, that is, the industrial structure-opening to the outside world dual drive type and opening to the outside world leading type are the main factors of the coupled and coordinated development of the two, and the key to the opening to the outside world. The differential roles of government spenditure and environmental regulation as conditional factors across developmental pathways highlight the complexity of local governance contexts and underscore the diversity in regional development paradigms.
Based on the above research conclusions, the following suggestions are put forward on how to promote the coordinated evolution of GEE and NTU:
(1) China’s green transition requires constructing a gradient-based open innovation system to strengthen regional synergy. In eastern coastal areas, the Yangtze River Delta and Guangdong-Hong Kong-Macao Greater Bay Area will spearhead zero-carbon pilot free trade zones, focusing on cross-border green standard mutual recognition, progressive tariff reductions for internationally certified products, and full-chain carbon tracking in maritime logistics via digital twin port systems. Inland hub cities, leveraging logistics corridors in Chengdu-Chongqing and Xi’an, will establish subsidy mechanisms for new energy transportation on China-Europe Railway Express routes, accompanied by international green technology transfer centers to accelerate renewable energy commercialization and benefit-sharing mechanisms.
(2) To address transformation constraints in central-western regions, a dual “technology-institution” compensation strategy is proposed: Technologically, an “Eastern Data-Western Computing + Eastern Technology-Western Transfer” framework will develop green computing pilot bases in Guizhou and Gansu, integrating liquid cooling with wind-PV-storage-flexible systems, while establishing open-access green patent repositories with technology conversion revenue feedback. Institutionally, a three-dimensional ecological trading market piloting “water rights-carbon sinks-ecological vouchers” in the Yellow River Basin. Incorporate quantitative indicators, such as the coefficient of improvement of water quality in watershed cross sections and incremental forest stock, into the framework for assessing the green debt of local governments.
(3) Policy instruments should align with regional gradients: Eastern regions will adopt market-driven “negative list + digital supervision” models, trialing cross-sector energy quota trading and digital carbon ledgers, while central-western areas enhance government-guided incentives through green technology upgrade loans and ecological performance-linked financing mechanisms for resource-dependent provinces.
Data availability statement
The raw data supporting the conclusion of this article will be made available by the authors, without undue reservation.
Author contributions
XZ: Writing – original draft. YW: Data curation, Investigation, Writing – review and editing. QG: Conceptualization, Investigation, Writing – review and editing. GY: Conceptualization, Funding acquisition, Writing – review and editing. YQ: Formal Analysis, Project administration, Writing – review and editing. SC: Supervision, Validation, Writing – review and editing.
Funding
The author(s) declare that financial support was received for the research and/or publication of this article. This research was funded by the Late Subsidized Project of National Social Science Foundation (24FGLB092); Humanities and Social Science Research Project of Chongqing Municipal Education Commission (23SKJD111); Scientific and Technological Research Program Project of Chongqing Municipal Education Commission (KJZD-K202401109); Research Project of Teaching Reform of Higher Education in Chongqing Municipality (233337); Planning Project of Chongqing Municipal Academy of Education and Science (K23YG2110387); Chongqing University of Technology Higher Education Research Program (2022ZD01).
Conflict of interest
Author XZ was employed by Chongqing Machinery & Electronics Holding (Group) CO.
The remaining authors declare that the research was conducted in the absence of any commercial or financial relationships that could be construed as a potential conflict of interest.
Generative AI statement
The author(s) declare that no Generative AI was used in the creation of this manuscript.
Publisher’s note
All claims expressed in this article are solely those of the authors and do not necessarily represent those of their affiliated organizations, or those of the publisher, the editors and the reviewers. Any product that may be evaluated in this article, or claim that may be made by its manufacturer, is not guaranteed or endorsed by the publisher.
References
Cai, J., Li, X., Liu, L., Chen, Y., Wang, X., and Lu, S. (2021). Coupling and coordinated development of new urbanization and agro-ecological environment in China. Sci. Total Environ. 776, 145837. doi:10.1016/j.scitotenv.2021.145837
Chen, M., Liu, W., Lu, D., Chen, H., and Ye, C. (2018). Progress of China’s new-type urbanization construction since 2014: a preliminary assessment. Cities 78, 180–193. doi:10.1016/j.cities.2018.02.012
Chen, M., Liu, W., and Lu, D. (2016). Challenges and the way forward in China’s new-type urbanization. Land Use Policy 55, 334–339. doi:10.1016/j.landusepol.2015.07.025
Daly, H. E. (1997). Beyond growth: the economics of sustainable development[M]. Boston, MA, United States: Beacon Press.
Dong, G., Ge, Y., Liu, J., Kong, X., and Zhai, R. (2023). Evaluation of coupling relationship between urbanization and air quality based on improved coupling coordination degree model in Shandong Province, China. Ecol. Indic. 154, 110578. doi:10.1016/j.ecolind.2023.110578
Douglas, E. J., Shepherd, D. A., and Prentice, C. (2020). Using fuzzy-set qualitative comparative analysis for a finer-grained understanding of entrepreneurship. J. Bus. Ventur. 35 (1), 105970. doi:10.1016/j.jbusvent.2019.105970
Fall, F., Akim, A.-m., and Wassongma, H. (2018). DEA and SFA research on the efficiency of microfinance institutions: a meta-analysis. A meta-analysis World Dev. 107, 176–188. doi:10.1016/j.worlddev.2018.02.032
Feng, C., Valdebenito, M. A., Chwała, M., Liao, K., Broggi, M., and Beer, M. (2023). Efficient slope reliability analysis under soil spatial variability using maximum entropy distribution with fractional moments. J. Rock Mech. Geotechnical Eng. 16, 1140–1152. doi:10.1016/j.jrmge.2023.09.006
Feng, Y., Yuan, H., Liu, Y., and Zhang, S. (2023). Does new-type urbanization policy promote green energy efficiency? Evidence from a quasi-natural experiment in China. Energ. Econ. 124, 106752. doi:10.1016/j.eneco.2023.106752
Fiss, P. C. (2011). Building better causal Theories: a fuzzy set approach to Typologies in organization research. Acad. Manag. J. 54, 393–420. doi:10.5465/amj.2011.60263120
Frambach, R. T., Fiss, P. C., and Ingenbleek, P. T. (2016). How important is customer orientation for firm performance? A fuzzy set analysis of orientations, strategies, and environments. J. Bus. Res. 69 (4), 1428–1436. doi:10.1016/j.jbusres.2015.10.120
Garcia-Castro, R., and Francoeur, C. (2016). When more is not better: Complementarities, costs and contingencies in stakeholder management. Strategic Manag. J. 37 (2), 406–424. doi:10.1002/smj.2341
González-Cruz, T. F., Roig-Tierno, N., and Botella-Carrubí, D. (2018). Quality management as a driver of innovation in the service industry. Serv. Bus. 12 (3), 505–524. doi:10.1007/s11628-017-0360-7
Gupta, P., Pranav Kolhe, N., and Vyas, S. (2024). Coupling and coordination association between night light intensity and women safety-A comparative assessment of Indian metropolitan cities. J. Clean. Prod. 481, 144135–146526. doi:10.1016/j.jclepro.2024.144135
Handrich, L., and Ragin, C. C. (2000). Fuzzy-set social science. Polit. Vierteljahresschr. 41 (4), 788–789. doi:10.1007/s11615-000-0128-9
He, B., Du, X., Lu, Y., Chen, Q., and Lan, R. (2024). An improved approach for measuring the coupling relationship between new type urbanization and low carbon development in China. Ecol. Indic. 158, 111383. doi:10.1016/j.ecolind.2023.111383
Hu, M., Chen, P., Chen, G., and Li, Z. (2025). Spatio-temporal influencing effects and mechanisms of the digital economy on eco-urbanization in the Yangtze River Delta region. Environ. Technol. and Innovation 37, 103979. doi:10.1016/j.eti.2024.103979
Huang, Y., Li, P., Bu, Y., and Zhao, G. (2023). What entrepreneurial ecosystem elements promote sustainable entrepreneurship? J. Clean. Prod. 422, 138459. doi:10.1016/j.jclepro.2023.138459
Jacobs, M. (1997). Environmental valuation, deliberative democracy and public decision-making institutions[M]//Valuing nature? London, United Kingdom Routledge, 223–243.
Khoshbakht, M., Gou, Z., and Dupre, K. (2018). Energy use characteristics and benchmarking for higher education buildings. Energy Build. 164, 61–76. doi:10.1016/j.enbuild.2018.01.001
Liu, N., Liu, C., Xia, Y., and Da, B. (2018). Examining the coordination between urbanization and eco-environment using coupling and spatial analyses: a case study in China. Ecol. Indic. 93, 1163–1175. doi:10.1016/j.ecolind.2018.06.013
Liu, X., Vu, D., Perera, S. C., Wang, G., and Xiong, R. (2023). Nexus between water-energy-carbon footprint network: Multiregional input-output and coupling coordination degree analysis. J. Clean. Prod. 430, 139639. doi:10.1016/j.jclepro.2023.139639
Liu, Y., and Dong, F. (2021). How technological innovation impacts urban green economy efficiency in emerging economies: a case study of 278 Chinese cities. Resour. Conservation Recycl. 169, 105534. doi:10.1016/j.resconrec.2021.105534
Ma, H., Wang, K., and Fang, C. (2024). How does new-type urbanization promote green development efficiency in China? The mediating role of governments, enterprises, and residents. Geogr. Sustain. 6, 100241–106839. doi:10.1016/j.geosus.2024.10.001
Ma, J., Wang, J., and Shen, X. (2022). Economic policy uncertainty and green economy efficiency: power or resistance?—Empirical evidence from Chinese major urban agglomerations. Econ. research-Ekonomska istraživanja 35 (1), 657–675. doi:10.1080/1331677X.2021.1931911
Pearce, D., Markandya, A., and Barbier, E. (1989). Blueprint for a green economy. London, UK: Earthscan Publications Limited.
Postel, S., and Carpenter, S. (1997). “Freshwater ecosystem services,” in Nature’s services: Societal dependence on natural ecosystems, 195.
Qian, X., Wang, D., and Nie, R. (2021). Assessing urbanization efficiency and its influencing factors in China based on Super-SBM and geographical detector models. Environ. Sci. Pollut. Res. 28 (24), 31312–31326. doi:10.1007/s11356-021-12763-7
Ragin, C. C. (2008). Redesigning social Inquiry: fuzzy sets and beyond. Chicago: Chicago University Press.
Roig-Tierno, N., Gonzalez-Cruz, T. F., and Llopis-Martinez, J. (2017). An overview of qualitative comparative analysis: a bibliometric analysis. J. Innovation and Knowl. 2 (1), 15–23. doi:10.1016/j.jik.2016.12.002
Schneider, C. Q., and Wagemann, C. (2012). Set-theoretic methods for the social sciences: a guide to qualitative comparative analysis[M]. Cambridge University Press.
Shao, J., and Wang, L. (2023). Can new-type urbanization improve the green total factor energy efficiency? Evidence from China. Energy 262, 125499. doi:10.1016/j.energy.2022.125499
Sun, B., Fang, C., Liao, X., Liu, M., Liu, Z., and Guo, X. (2023). Revealing the heterogeneous effects of new urbanization on urban-rural inequality using geographically weighted quantile regression. Appl. Geogr. 159, 103082. doi:10.1016/j.apgeog.2023.103082
Sun, K., Han, J., Wu, Q., Xie, W., He, W., Yang, Z., et al. (2024). The coupling coordination and spatiotemporal evolution of industrial water-energy-CO2 in the Yellow River Basin. Sci. Total Environ. 912, 169012. doi:10.1016/j.scitotenv.2023.169012
Tone, K. (2001). A slacks-based measure of efficiency in data envelopment analysis. Eur. J. Operational Res. 130 (3), 498–509. doi:10.1016/S0377-2217(99)00407-5
Tone, K. (2002). A slacks-based measure of super-efficiency in data envelopment analysis. Eur. J. Operational Res. 143 (1), 32–41. doi:10.1016/S0377-2217(01)00324-1
Wang, J., Han, S., Lin, H., Wu, P., and Yuan, J. (2023). New-type urbanization ecologically reshaping China. Heliyon 9 (2), e12925. doi:10.1016/j.heliyon.2023.e12925
Wang, L., Wang, Y., Sun, Y., Han, K., and Chen, Y. (2022). Financial inclusion and green economic efficiency: evidence from China. J. Environ. Plan. Manag. 65 (2), 240–271. doi:10.1080/09640568.2021.1881459
Wang, Z., Sun, Y., and Wang, B. (2019). How does the new-type urbanisation affect CO2 emissions in China? An empirical analysis from the perspective of technological progress. Energ. Econ. 80, 917–927. doi:10.1016/j.eneco.2019.02.017
Xia, Q., Tian, G., Zhao, D., Zhao, Q., and Varis, O. (2024). Effects of new-type urbanization on resource pressure: evidence from a water-energy-food system perspective in China. Sustain. Cities Soc. 107, 105411. doi:10.1016/j.scs.2024.105411
Xiang, W., Lan, Y., Gan, L., and Jiao, Li (2024). How does new urbanization affect urban carbon emissions? Evidence based on spatial spillover effects and mechanism tests. Urban Clim. 56, 102060. doi:10.1016/j.uclim.2024.102060
Xu, H., and Jiao, M. (2021). City size, industrial structure and urbanization quality—a case study of the Yangtze River Delta urban agglomeration in China. Land Use Policy 111, 105735. doi:10.1016/j.landusepol.2021.105735
Yan, X., and He, T. (2024). Wish fulfilment or wishful thinking? – Assessing the outcomes of China’s pilot carbon emissions trading scheme on green economy efficiency in China’s cities. Energy Policy 192 (2024), 114261. doi:10.1016/j.enpol.2024.114261
Yang, G., Gui, Q., Supanyo, P., Zhang, F., Yang, X., and Gong, G. (2023). Temporal and spatial changes and influencing factors of low-carbon economy efficiency in China. Environ. Monit. Assess. 195 (1), 55. doi:10.1007/s10661-022-10599-3
Yang, L., and Ni, M. (2022). Is financial development beneficial to improve the efficiency of green development? Evidence from the ‘Belt and Road’ countries. Energ. Econ. 105, 105734. doi:10.1016/j.eneco.2021.105734
Zhang, H., Chen, M., and Liang, C. (2022). Urbanization of county in China: spatial patterns and influencing factors. J. Geogr. Sci. 32 (7), 1241–1260. doi:10.1007/s11442-022-1995-4
Zhang, H., Xu, L., Zhou, P., Zhu, X., and Cudjoe, D. (2024). Coordination between economic growth and carbon emissions: evidence from 178 cities in China. Econ. Anal. Policy 81, 164–180. doi:10.1016/j.eap.2023.11.034
Zhang, L., and Zhao, S. X. (2003). Reinterpretation of China’s under-urbanization: a systemic perspective. Habitat Int. 27 (3), 459–483. doi:10.1016/S0197-3975(02)00071-1
Zhang, W., Xu, Y., Jiang, L., Streets, D. G., and Wang, C. (2023). Direct and spillover effects of new-type urbanization on CO2 emissions from central heating sector and EKC analyses: evidence from 144 cities in China. Resour. Conserv. Recycl. 192, 106913. doi:10.1016/j.resconrec.2023.106913
Zhao, C., and Wang, B. (2022). How does new-type urbanization affect air pollution? Empirical evidence based on spatial spillover effect and spatial Durbin model. Environ. Int. 165, 107304. doi:10.1016/j.envint.2022.107304
Zhao, P., Zeng, L., Lu, H., Zhou, Y., Hu, H., and Wei, X.-Y. (2020). Green economic efficiency and its influencing factors in China from 2008 to 2017: based on the super-SBM model with undesirable outputs and spatial Dubin model. Sci. Total Environ. 741, 140026. doi:10.1016/j.scitotenv.2020.140026
Zheng, H., Zhang, L., and Zhao, X. (2022). How does environmental regulation moderate the relationship between foreign direct investment and marine green economy efficiency: an empirical evidence from China’s coastal areas. Ocean Coast. Manag. 219, 106077. doi:10.1016/j.ocecoaman.2022.106077
Zhong, Z., and Chen, Z. (2022). Urbanization, green development and residents’ happiness: the moderating role of environmental regulation. Environ. Impact Assess. Rev. 97, 106900. doi:10.1016/j.eiar.2022.106900
Zhou, W., Li, X., Dai, Bo, Zhang, Y., and Liu, Y. (2025). Temporal and spatial evolution of the combined and coordinated growth of green finance, new urbanization, and rural industry revitalization and the driving mechanisms. J. Environ. Manag. 375, 124063. doi:10.1016/j.jenvman.2025.124063
Keywords: green economic efficiency, new-type urbanization, coupling coordination, dual-carbon goal, fsQCA, regional difference decomposition
Citation: Zhu X, Wei Y, Gui Q, Yang G, Qin Y and Cheng S (2025) Coupled and coordinated development of China’s green economy efficiency and new-type urbanization under the dual-carbon goal. Front. Environ. Sci. 13:1518952. doi: 10.3389/fenvs.2025.1518952
Received: 29 October 2024; Accepted: 01 April 2025;
Published: 16 April 2025.
Edited by:
Florian Nuță, Danubius International University, RomaniaReviewed by:
Ziheng Shangguan, The University of Melbourne, AustraliaAndri Dayarana K. Silalahi, Chaoyang University of Technology, Taiwan
Copyright © 2025 Zhu, Wei, Gui, Yang, Qin and Cheng. This is an open-access article distributed under the terms of the Creative Commons Attribution License (CC BY). The use, distribution or reproduction in other forums is permitted, provided the original author(s) and the copyright owner(s) are credited and that the original publication in this journal is cited, in accordance with accepted academic practice. No use, distribution or reproduction is permitted which does not comply with these terms.
*Correspondence: Qingqing Gui, MTczNTU5MzcwODdAMTYzY29t