 Xu Qianli1*
 Sun Hongyao2
- 1School of Resources and Environmental Engineering, East China University of Science and Technology, Shanghai, China
- 2Materials and Structural Engineering Department, Nanjing Hydraulic Research Institute, Nanjing, Jiangsu, China
The study constructs a decoupling evaluation model, taking Nanjing City as an example. It contributes to a deeper understanding of the sustainable utilization of water resources and the coordination between regional economic development and ecological preservation. In addition, Nanjing’s water resource endowment, social background, economic foundation, and ecological environment have unique characteristics and significance. The results show that (1) the water resource ecological footprint tended to gradually decrease and level off. Water consumption in industry and agriculture was relatively high, and there were imbalances in the consumption and distribution of water resources across different social and economic sectors. (2) The carrying capacity of per capita water resources in Nanjing presented a gradual upward and downward trend, roughly resembling an “M” shape. (3) The average ecological deficit of per capita water resources over the recent 10 years was −0.53 hm2/person. The average ecological pressure index was 4.54. Therefore, this suggests significant pressure on water resource utilization and ecological environment protection. (4) The decoupling rate between water resource utilization and economic development has reached approximately 100%, indicating that economic development can help a city reduce its dependence on water resources. However, the relationship between the development of industry and agriculture and water resource utilization was not well coordinated.
1 Introduction
Water is regarded as the foundation of life and the basis of civilization (Kummu et al., 2016; Su et al., 2024; Vorosmarty et al., 2000). With the acceleration of global urbanization, water scarcity has become a critical bottleneck constraining sustainable urban development. According to the United Nations World Water Development Report, approximately 40% of the global population faces water scarcity (UNESCO, 2021), with urban areas being particularly affected. Currently, global water resource utilization exhibits two key characteristics: on one hand, continued growth in water consumption demonstrates a strong coupling relationship with economic development resources (Antonelli and Sartori, 2015; Peng et al., 2024); on the other hand, significant disparities in water-use efficiency exist across cities, with some developed cities having preliminarily achieved “decoupling” between economic growth and water consumption (Ansorge and Stejskalová, 2022). Compared to rural areas, cities rely more on water resources. It is crucial for a city to realize sustainable economic development with accurate calculation of the current status of water resources and achievement of the decoupling between scientific utilization of water resources and economic development (Liu et al., 2019; Wang et al., 2019). Current prominent issues in urban water resource utilization include the following: first, the excessive coupling between water use and economic development persists: most cities remain locked in the conventional paradigm where economic growth inevitably drives increased water consumption. Second, significant regional disparities exist: cities across different climatic zones and developmental stages face distinct decoupling challenges, yet tailored solutions remain inadequate. This study aims to systematically analyze the decoupling relationship between urban water resource utilization and economic development, elucidate its underlying mechanisms and spatiotemporal patterns, and provide scientific evidence for formulating differentiated water management strategies to promote urban green and low-carbon development.
Recently, scholars all over the world have studied the relationship between water resources and socio-economic development (Gao et al., 2024; Omer et al., 2020; Stoeglehner et al., 2011; Wang et al., 2019), mainly focusing on water footprint theory and decoupling elasticity theory. The water footprint theory was first proposed by Canadian ecological economist William (1992) and enriched by his student Wackenagel and William (1996) (William, 1996). It aimed to quantify the utilization of natural resources and the environmental pressure by calculating the dry land and water area of a region.
It is efficient for us to calculate and analyze the utilization of urban water resources and the current situation of water management using the Ecological Footprint Theory of Water Resources, which is one of the important indicators used to evaluate the sustainable development level of a city. Using this theory,Linnan et al. (2008) identified three key parameters for the calculation model of water resource ecological carrying capacity and water resource ecological footprint, namely, global average water resource yield, global equilibrium factor, and regional yield factor, which expanded the depth and breadth of water footprint theory in practical application.
The decoupling theory is proposed by OECD (2015), aiming to reveal the asynchronous process of economic growth and the decrease in resource consumption (Chen et al., 2022; Gong and Guo, 2024; Gong et al., 2021). When economic development comes at the cost of resource depletion and environmental pollution, certain measures should be taken to gradually reduce resource consumption and environmental pressure in order to achieve sustainable development. This process is defined as decoupling.
According to the decoupling theory, Tapio (2005) constructed the elasticity analysis coefficient of the decoupling theory, which was highly effective in the indication of economic development and the elastic process influencing the environment. This theory further discussed the degree of influence between different factors accurately. There are many studies that use decoupling theory. For example, Dai et al. (2019) constructed a three-dimensional footprint model and measured the use of land natural capital in Shanxi Province over two decades from the product–land class–region triple scale using the national hectare method in order to analyze its decoupling effect with economic development. Xiong et al. (2020) investigated the influence of socioeconomic factors on the transformation of water footprint. In addition, the results found that changes in demand structure and water intensity can save water. Zhang et al. (2024) studied the water trend of footprint historical evolution in the Yangtze River Delta and provided policy recommendations for optimizing water use.
Most of the studies on the relationship between the current utilization of water resources and economic development mainly involve evaluating the relationship between the utilization of water resources and economic development, recording the current status of water resources in specific regions, and balancing economic development and ecological environment protection. The current literature has the following limitations: first, it lacks sufficient dynamic analyses that capture the evolutionary trajectory of decoupling processes. Second, it predominantly focuses on macro-scale assessments, with inadequate attention to city-level dynamics. Finally, the majority of studies are unable to identify the state of economic development in different cities and the diversity in the endowment of water resources, which inevitably results in the inaccuracy of the obtained results of the relationship between the economic development of a single city and the ecological footprint of water resources. Through designating the particular city as the research object, it is convenient to eliminate the heterogeneity between different cities, which means that it can get access to the relationship between water resource utilization and economic growth in a specific region (city). Based on the existing literature, this study constructs a dynamic decoupling analytical framework at the urban scale. By integrating econometric modeling approaches, the article systematically investigate the driving mechanisms of water resource decoupling, thereby providing scientific evidence for sustainable urban development.
Unlike the “engineering water shortage” in canyon areas and the “resource-based water shortage” in the most northern part of China, Nanjing, located in the lower reaches of the Yangtze River, faces serious pressure on per capita water resources due to rapid economic development and population growth. Although it has abundant water resources from the Yangtze River and Qinhuai River, Nanjing is one of the “quality-based water shortage” cities. Thus, based on the historical water resource data in Nanjing, this article calculates the average water consumption and ecological footprint to describe the trend of the ecological footprint of water resources. Furthermore, it is meant to provide the local government with the support of data to solve the problem of coordination between urban water resource utilization and economic development.
2 Data and methods
2.1 Data sources and definitions
This article tracks and statistically studies the use of water resources and the economic growth in the recent 10 years in Nanjing. The data used include the total water resources of Nanjing from 2013 to 2022, water consumption of different types of water, and economic indicators (a total of three first-level indicators and 11 second-level indicators, which are derived from the Nanjing Statistical Yearbook1 and Nanjing Water Resources Bulletin2 from 2013 to 2022). In the calculation of the water resource footprint, water used in agriculture, forestry, animal husbandry, and fishery (primary industry) refers to the water resources used for various needs, such as farmland irrigation, forestry irrigation, livestock breeding, and sanitation. It is represented by agricultural water consumption as reported in the Water Resources Bulletin. In the Nanjing Water Resources Bulletin from 2013 to 2016, the water used in agriculture and the water used in the forestry and fishery industries are listed separately. The former is almost six times greater than the latter. However, in this article, both are collectively defined as agricultural water. Water used in the industry refers to various types of water consumed in industrial production processes. This article directly quotes the total amount of industrial water consumption from the Nanjing Water Resources Bulletin. Ecological water consumption is represented by the water consumption of the ecological environment in the Water Resources Bulletin. Domestic water consumption includes water for living in both urban and rural areas. This article summarizes the data on the consumption of urban public domestic water and residential domestic water in the Water Resources Bulletin. Population and socio-economic development are defined as relevant data such as the gross domestic product of Nanjing, agricultural (primary industry) output value, industrial output value, and the population of year-end residents in Nanjing. According to WWF2002 (World Wide Fund for Nature Earth Report 2002),
2.2 Ecological footprint of water resources
The ecological footprint of water resources refers to the metabolic intensity of water resources in an area. It includes not only the consumption of water resources by human beings in daily life and production but also the maintenance of the natural environment. The calculation formula is provided in Equation 1:
Here,
2.3 Calculation and evaluation model for the sustainable development of water resources
2.3.1 Per capita ecological carrying capacity model
The ecological footprint theory suggests that the ecological carrying capacity of water resources reflects the ability of these resources to support the healthy development of the regional ecosystem and economic system in the region under current management and technological conditions. It has natural, spatial, and social attributes. It is necessary to comprehensively consider the current situation of the ecological environment and the water resources needed for social production, ecological production, and life (Gao et al., 2024). The formula is provided in Equation 2:
Here,
2.3.2 Index of water resource ecological stress and the per capita ecological surplus/deficit of water resources
The water resource ecological stress index refers to the relative pressure intensity of the socio-economic system on regional water resources, reflecting the scarcity of water resources. Moreover, it quantifies the dependence of human production on water resources. The larger it is, the more safety issues in water resource utilization there will be. The per capita ecological surplus/deficit of water resources is an indicator that quantitatively reflects the natural capital relationship between human and water systems. It is also the result of comparing the human load and ecological capacity of the region, explaining the sustainability level laterally. The formulas are provided in Equations 3, 4:
When
2.4 Decoupling evaluation model of water resource ecological footprint and economic development
The Tapio decoupling index (Fu et al., 2024; Wu et al., 2019) is a ratio that compares the rate of change between water environmental pressure and economic drivers. It is used to analyze the relationship between the ecological footprint of water resources and economic development, ultimately determining their decoupling status. Based on previous research, the formula is provided in Equation 5:
Here, T is the decoupling index between the ecological footprint of regional water resources and economic development.
Based on Tapio’s explanation of index determination and standard definitions (Fang Kai, 2015), this article illustrates the decoupling state and its representational connotation, as shown in Table 1.
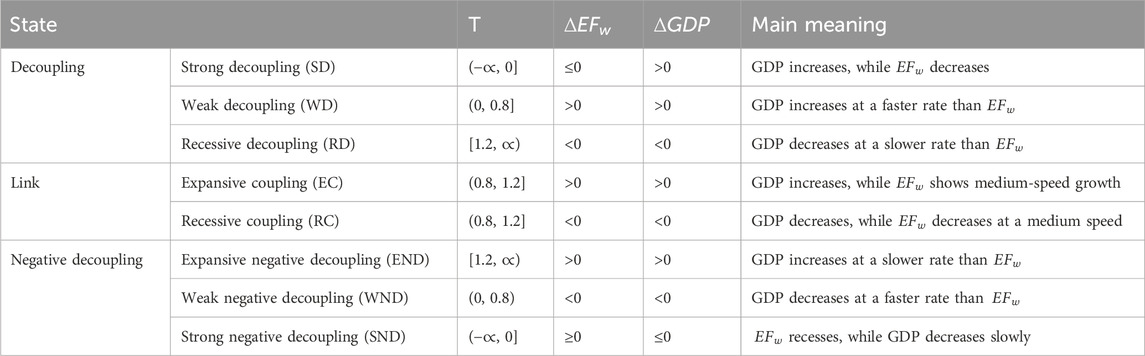
Table 1. Decoupling index, decoupling state, and evaluation criteria.
Tapio divides the decoupling elastic index into eight categories, with 1.2, 0.8, and 0 as critical values:
(1) When T < 0,
(2) When 0 < T ≤ 0.8,
(3) When T > 1.2,
(4) When 0.8 < T ≤ 1.2,
(5) When 0.8 < T ≤ 1.2,
(6) When T > 1.2,
(7) When 0 < T < 0.8,
(8) When T ≤ 0,
3 Results
3.1 Results and analysis of water footprint composition in Nanjing
Based on the data of Nanjing Water Resources Bulletin from 2013 to 2022, we calculate the ecological footprint of water resources, as shown in Figure 1. According to the type of industry, the agricultural water consumption of the primary industry is the highest, accounting for an average of 40%. The industrial water consumption of the secondary industry consists of 30%, which is the second-highest water usage, followed by residents’ daily life at 25%. Moreover, ecological environment water consumption ranks last, accounting for an average of 5%.
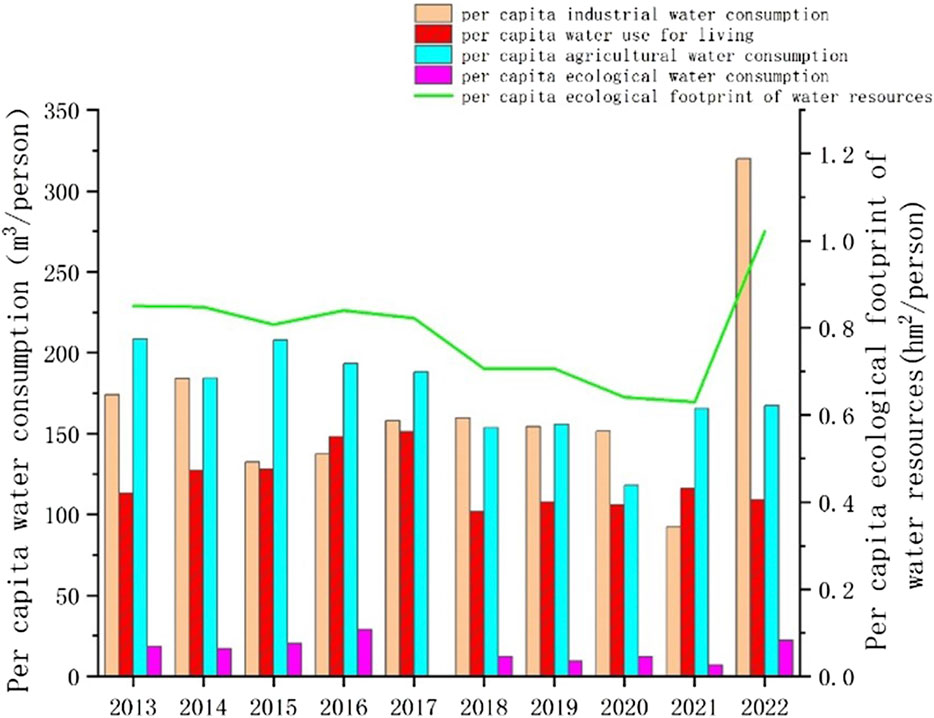
Figure 1. Per capita water consumption and per capita ecological footprint of water resources in Nanjing, 2013–2022.
During the allocation of water resources, less attention is often paid to water used for public welfare, such as the ecological environment. As a result, most cities suffer from a shortage of water resources due to accelerating urbanization and population growth, which restricts water available for the ecological environment.
The per capita domestic water consumption in Nanjing has remained relatively stable at approximately 100 m3/person for 10 years, suggesting the reasonable development and management of water resources in Nanjing. This is conducive to ensuring the normal life of residents and the long-term development of urban public industries, which further promotes the stable development of the industrial economy and drives the optimization and upgrading of the industrial structure.
We analyzed the ecological footprint of per capita water resources in Nanjing from 2013 to 2022 and found that it remained stable overall, decreasing from a high point of 0.85 hm2/person in 2013 to a low point of 0.63 hm2/person in 2021. Although it increased to 1.02 hm2/person in 2022, social and economic developments, as well as people’s quality of life, have continued to improve, which is essential for the sustainable development of a city.
3.2 Sustainable development status of water resources
3.2.1 Change trend of per capita water resource ecological carrying capacity
According to Figure 2, the per capita ecological carrying capacity of water resources in Nanjing showed a gradual increase and then a decrease in an M-shaped pattern from 2013 to 2022. It came to the lowest point of 0.07 hm2/person and 0.08 hm2/person in 2019 and 2022, respectively. The value was at its peak in 2016 and 2020, with 0.38 hm2/person and 0.35 hm2/person, respectively. The peak value is more than five times the valley value. In 2022, the industrial water consumption in Nanjing increased sharply, reaching 30.36 billion m3. It results in the abnormal data on per capita industrial water consumption and per capita water resource ecological footprint shown in Figure 1. The possible reasons are as follows: first, the total industrial output value of the city’s above-scale industries exceeded 1.5 trillion yuan, which showed an increase of 5.9% over the previous year. The expansion of industrial production will inevitably lead to an increase in industrial water consumption. Second, the climate in Nanjing was seriously abnormal in 2022. The average temperature reached the highest record in the same period since 1961. The number of high-temperature days broke the record for high-temperature days in summer. The reservoir water storage capacity set the lowest record in the same period, and the water level of the Yangtze River, Shuiyang River, and Shijiu Lake set the lowest record at the same time. High-temperature weather and drought lead to a significant increase in the consumption of cooling water by industrial enterprises, such as thermal power, steel, chemical, and other industries, needing more water to cool equipment. Finally, some enterprises have made slow progress in the implementation of water-saving measures and the construction of repeated water-use systems and have not made full use of unconventional water sources, such as reclaimed water and rainwater, which may also lead to an increase in industrial water consumption.
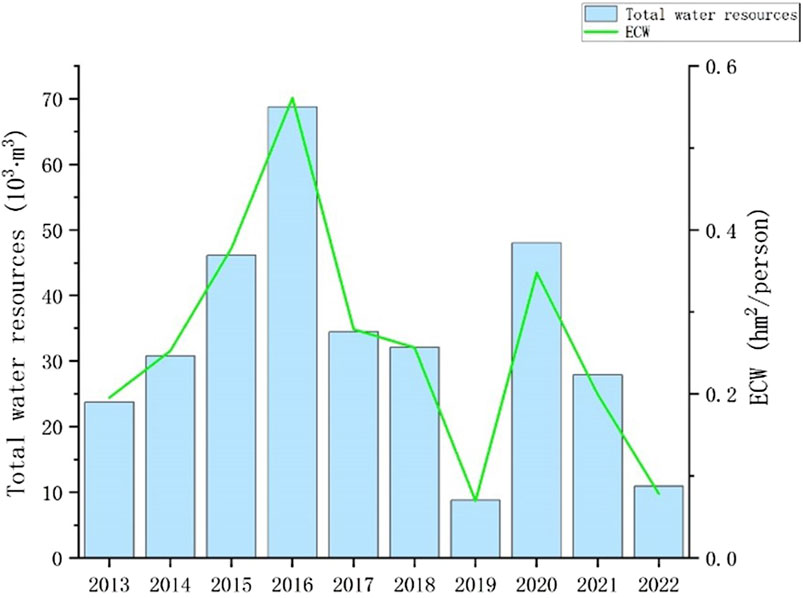
Figure 2. Changes in per capita ecological carrying capacity and total water resources in Nanjing, 2013–2022.
The trend of change has shifted from a slow decrease to a sharp decrease, and the ecological carrying capacity of water resources in Nanjing has shown a fluctuating trend. In April 2015, the State Council issued the Action Plan for Water Pollution Prevention and Control (Ten Measures for Water), which marked the important planning and determination of the Chinese government toward water environment governance. After the policy was promulgated, Nanjing has achieved some progress in the utilization of water resources and the protection of the ecological environment. However, water resource treatment still needs to be given great importance to ensure that the ecological carrying capacity of water resources can be continuously improved to meet the needs of urban sustainable development. There is a close relationship between the ecological carrying capacity of water resources and the total amount of water resources, but it is not a linear relationship. The total amount of water resources is one of the important factors affecting the ecological carrying capacity of water resources, but it is not the only factor. Further analysis is needed on relevant conditions, such as forest cover, water bodies, population size, and geological landforms in the region.
3.2.2 Change trend of ecological surplus and deficit in water resources
As shown in Figure 3, the per capita water resources in Nanjing have been in a state of ecological deficit for 10 years, with an M-shaped trend of change. Decreasing from −0.67 hm2/person in 2013 to −0.28 hm2/person in 2016, the ecological deficit then increased from −0.64 hm2/person in 2019 to the peak of −0.94 hm2/person in 2022. The average per capita ecological deficit over the past 10 years is −0.53 hm2/person, which indicates that the ecological deficit is still relatively large and places significant pressure on the environment.
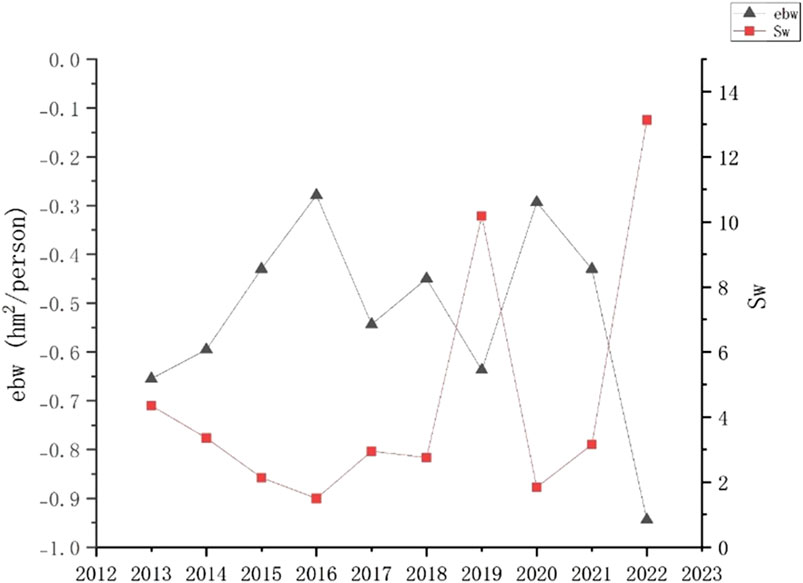
Figure 3. Trends in ecological pressure, ecological surplus, and ecological deficit of per capita water resources in Nanjing, 2013–2022.
Nanjing, a rapidly developing city in the Yangtze River Delta Economic Belt, is an important economic center and a densely populated area in China. The high demand from primary and secondary industries, as well as for domestic water, has led to a prominent contradiction between water supply and demand. The significant ecological deficit of water resources proves that Nanjing is facing challenges in water resource development, management, and utilization. The protection of water resources must be accelerated to realize sustainable utilization and ecological balance of water resources. Based on Figures 2, 3, it can be concluded that the per capita ecological carrying capacity and per capita ecological deficit have shown a roughly M-shaped trend over the past 10 years, and they were similar.
3.2.3 Trends in the ecological pressure index of water resources
During the research period, the overall ecological pressure on water resources in Nanjing presented a W-shaped pattern, as shown in Table 2 and Figure 3. The ecological pressure index of water resources was approximately 4.54, which is much higher than 1, indicating the exploitation and utilization of water resources were in a difficult situation. The change in per capita water resources’ ecological carrying capacity in Nanjing was opposite to that of the water resource ecological pressure value. The change in the per capita ecological deficit of water resources was opposite to that of the ecological pressure value of water resources. The total amount of water resources in Nanjing was opposite to the ecological pressure index of water resources. These asynchronous changes had a certain impact on the ecological pressure of water resources.

Table 2. Ecological stress of water resources in Nanjing from 2013 to 2022.
Although the total amount of water resources is high, the water resources are relatively abundant, and the demand for water resources from human production activities can be met, which leads to a relatively small ecological pressure on water resources. Under the circumstances, both the water environment and ecosystem can be well protected and maintained. The ecological balance is also maintained. In contrast, water resources in short supply certainly result in a significant growth in ecological pressure on water resources. Accordingly, through effective management and protection of ecological resources, the per capita ecological carrying capacity of a region will be enhanced. Nevertheless, due to population growth or unreasonable use of resources, the per capita ecological deficit may still increase uncontrollably.
3.3 Evaluation of decoupling between the utilization of water resources and the economic growth
3.3.1 Overall analysis of the decoupling between the water resource ecological footprint and economic growth
The results of the calculation and analysis of water resource consumption and economic development in Nanjing from 2013 to 2022 are shown in Figure 4. From this, we can conclude the following: (1) over the past 10 years, the ecological footprint of water resources in Nanjing generally showed a consistent trend with economic growth. (2) There were six instances of strong decoupling, three of weak decoupling, and one recession of decoupling between GDP growth and the water resource ecological footprint in Nanjing. It cannot be ignored that every year decoupling occurred, with strong decoupling accounting for 60%. Except for the highly discrete data in 2022, the decoupling index was mostly stable. This indicates that the economic growth and water resource consumption in Nanjing were generally decoupled. Although the economic growth was at a high level, the use of water resources decreased, and the economic growth did not exert excessive pressure on water resources. The high proportion of strong decoupling suggests that Nanjing has achieved great achievements in water resource management, environmental protection, and sustainable development, which is conducive to healthy development. However, there have been three instances of weak decoupling, reminding us that the ecological footprint of water resources and economic development are still in a state of incongruity. Economic growth still comes at the cost of consuming water resources, and benign development is not stable enough. The problems of economic increase at the cost of consuming water resources and the lack of stable development still exist. It may be a result of various factors, such as economic restructuring, changes in water-saving policies, and urbanization in Nanjing. Regarding these problems, further measures are needed to promote the sustainable utilization of water resources and the sustainable development of the economy.
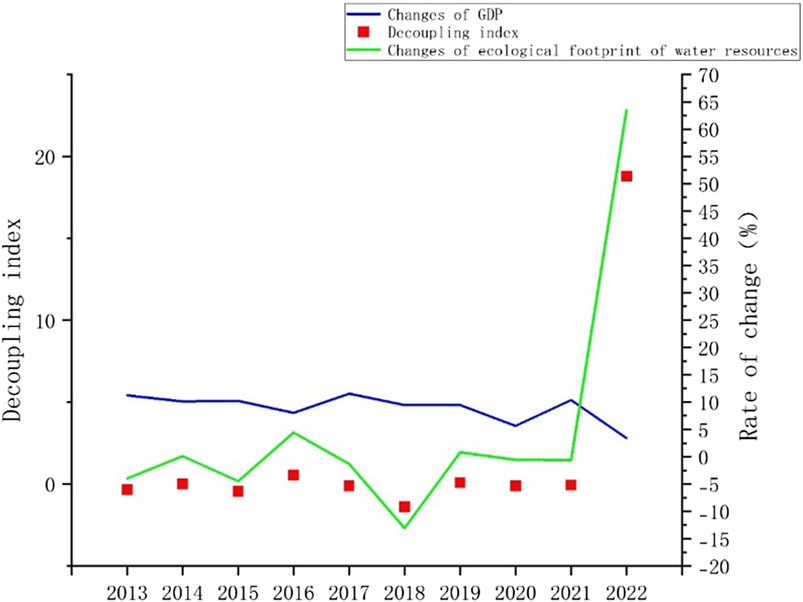
Figure 4. Dynamic decoupling index of water use and economic development in Nanjing from 2013 to 2022.
3.3.2 Analysis of the decoupling relationship between the water resource ecological footprint and economic growth in the industrial and agricultural parts
The sections with the highest water consumption in Nanjing are industry and agriculture, as shown in Figures 5, 6, from which we can learn the following: (1) the coordination between the ecological footprint of water resources and economic growth in agriculture was superior to that in the industry. (2) The evaluation of the industrial decoupling index shows that there were three instances of strong decoupling, four of weak decoupling, and three of growth connectivity. For the industry sector specifically, there were seven instances of strong decoupling, one of weak decoupling, and two of growth connectivity. The differences showed that the development of industrial sectors in Nanjing relied more on water resources than agriculture but demonstrated more sustainability in protecting the environment. For the utilization of agricultural water resources, there were 7 years of negative decoupling, with strong decoupling accounting for 50%, and weak decoupling and growth decoupling accounting for 10% each. In 2020, there was even a decrease in decoupling. Overall, although the economic development of agriculture decreases, it is also accompanied by an increase in environmental pressure and an excessive dependence on water resource utilization.
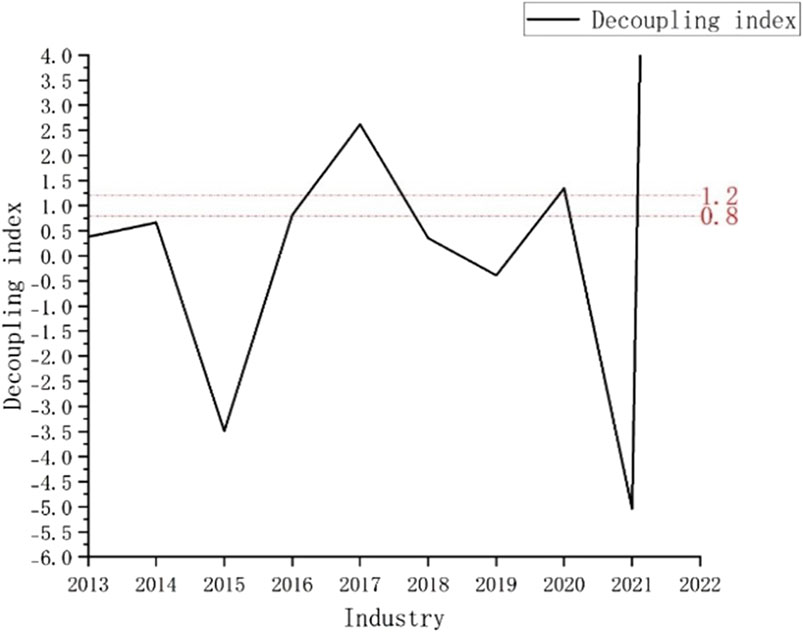
Figure 5. Changes in the decoupling relationship between the ecological footprint of water resources and economic development in industrial sectors, 2013–2022.
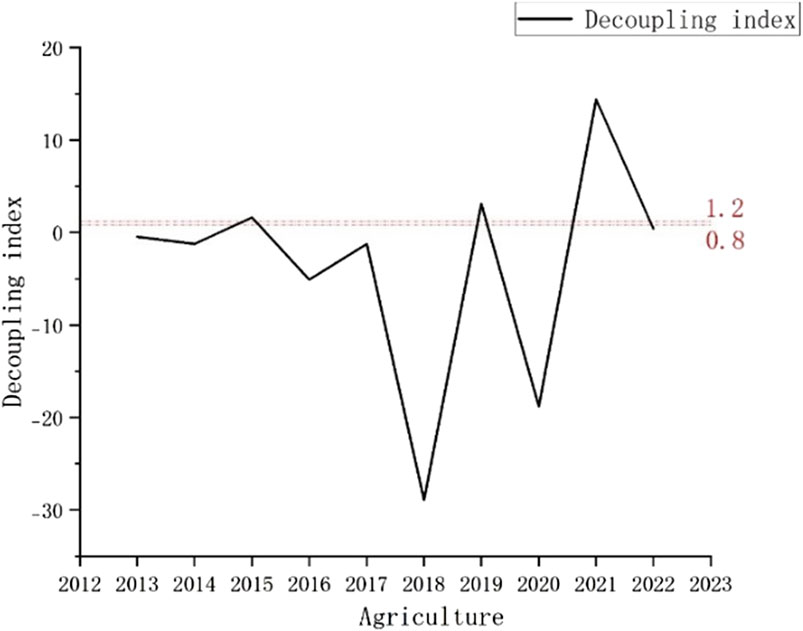
Figure 6. Changes in the decoupling relationship between the ecological footprint of water resources and economic development in agricultural sectors, 2013–2022.
The higher dependence of industry on water resources than that of agriculture may be attributed to the following four reasons: (1) industrial structure differences: as a key industrial city in the Yangtze River Delta, Nanjing hosts water-intensive industries, such as petrochemicals, steel, and electronics (e.g., Yangzi Petrochemical and Nanjing Iron & Steel Group). Production processes require substantial cooling and washing water, making water consumption relatively inflexible. Nanjing’s agriculture primarily focuses on rice and vegetable cultivation. Although irrigation is necessary, water usage can be reduced through water-saving technologies (e.g., drip irrigation and mulching) and crop structure adjustments (e.g., drought-resistant crops). Additionally, some areas rely on natural rainfall. (2) Technical and management levels: some traditional enterprises still rely on outdated equipment, resulting in low water recycling rates (e.g., direct discharge of cooling water). The high cost of water-saving technological upgrades has weakened corporate motivation for improvement. The government promotes efficient water-saving irrigation (e.g., water-saving demonstration zones in the Gaochun District) and precision fertilization technologies. Policy subsidies have reduced the cost of water conservation for farmers. (3) Policy regulatory intensity: despite the implementation of water resource taxes and pollutant discharge permit systems, enforcement challenges persist, including incidents of unauthorized emissions and data manipulation by enterprises, resulting in significant regulatory difficulties. Ecological compensation mechanisms (e.g., rewards for water-saving farmers) and environmental awareness campaigns have proven highly effective, with farmers demonstrating strong environmental consciousness. (4) Characteristics of water resource utilization: industrial parts (e.g., electronics manufacturing) require high-quality water (e.g., ultrapure water), leading to elevated treatment costs. Agriculture’s flexible water quality needs enable large-scale reclaimed water applications.
Given the distinct water resource demands of industry and agriculture, the following strategies can be implemented: (1) spatial optimization of industrial distribution: traditional heavy industries should be phased out (e.g., relocating some production capacity of Nanjing Iron & Steel), and emerging water-efficient industries (e.g., software & IT services and biopharmaceuticals) should be developed. Integrated rice–fish farming should be promoted in Luhe District to reduce water consumption associated with monoculture rice cultivation. (2) Deep water conservation in the industrial sector: technological upgrades should be mandated, and water-use quotas per unit output value should be enforced in water-intensive industries (petrochemicals and steel), while obsolete production capacities are phased out. Closed-loop water recycling systems should be promoted (e.g., a 30% reduction in cooling water was achieved through circulation systems at an electronics manufacturer in the Nanjing Economic Development Zone). Economic incentive mechanisms should be, implemented, including tiered water pricing with punitive tariffs and elevated water resource taxes imposed on enterprises that exceed quotas. Industrial park should be optimized through the development of park-wide reclaimed water systems (e.g., Jiangbei New Area Project), enabling cascading water reuse among enterprises through intensive resource management. (4) Innovative policy and regulatory mechanisms: precision industrial supervision should be ensured by requiring the installation of real-time online monitoring devices, with data directly linked to environmental protection agencies. Stringent penalties should be applied for data fraud (e.g., automatic fines triggered by abnormal discharge data patterns); inter-departmental coordination mechanisms should be established (e.g., joint Water Affairs Bureau/Agriculture Bureau initiatives) to develop spatially differentiated management protocols like Nanjing’s “Three-Zone Water Resource Management System” (red/yellow/blue zoning), under which strict location restrictions are imposed on water-intensive projects.
4 Conclusion
This article pays attention to the pressure caused by water resource consumption on human social production and life. Based on the water resource bulletin and socio-economic statistical data, the water resource ecological footprint and water carrying capacity of Nanjing from 2013 to 2022 are calculated using the theory and method of the water footprint. The relationship between the water resource ecological footprint and economic development is analyzed using the Tapio decoupling model to reveal the balance between water resource utilization and economic development. The following conclusions are drawn: (1) the water footprint of Nanjing shows a downward trend, continuously tending toward a positive development, which is essential for the sustainable utilization of water resources. However, the water consumption was mainly for industrial and agricultural uses, indicating that the allocation of water resources was not sufficiently reasonable. This must be closely related to the structure of industry in Nanjing. The next step should be industries’ cooperation to improve the efficiency of the water use. (2) The per capita ecological carrying capacity of water resources and the per capita ecological deficit in Nanjing have shown a continuous trend of improvement. Nevertheless, the average per capita ecological deficit in Nanjing for many years was −0.53 hm2/person, and the average ecological pressure index of water resources was 4.54, far more than 1, suggesting an imbalance between water supply and demand. As a large city, Nanjing has experienced rapid economic development, a large population, and large water resource consumption. Government should strengthen water resource management, advocate for water conservation, increase investment in science and technology, and gradually promote ecological restoration. (3) According to the analysis of the decoupling between the ecological footprint of water resources and economic development, the decoupling rate is 100%, and strong decoupling is 60%. All in all, it developed coordinately, providing a relatively environmentally friendly and stable support for future economic development. (4) Compared to the water consumption of the industrial and agricultural sectors, the dependence of industrial development on water resources is still evident. The Nanjing government should actively adjust and improve its industrial structure, enhance the efficiency of water resource utilization and the development of a green economy, address excessive consumption of water resources in industrial production, gradually achieve a strong decoupling between water resource utilization and economic growth, and contribute to sustainable socio-economic development. As a result, we still need to accelerate the environmentally friendly upgrading of industrial structures and the improvement of the water environment.
Data availability statement
The original contributions presented in the study are included in the article/supplementary material; further inquiries can be directed to the corresponding author.
Author contributions
XQ: Writing – original draft, Writing – review and editing, Data curation, Formal analysis, Investigation. SH: Formal analysis, Methodology, Project administration, Resources, Writing – review and editing.
Funding
The author(s) declare that no financial support was received for the research and/or publication of this article.
Conflict of interest
The authors declare that the research was conducted in the absence of any commercial or financial relationships that could be construed as a potential conflict of interest.
Generative AI statement
The author(s) declare that no Generative AI was used in the creation of this manuscript.
Publisher’s note
All claims expressed in this article are solely those of the authors and do not necessarily represent those of their affiliated organizations, or those of the publisher, the editors and the reviewers. Any product that may be evaluated in this article, or claim that may be made by its manufacturer, is not guaranteed or endorsed by the publisher.
Footnotes
1See http://tjj.nanjing.gov.cn/for further details.
2See http://shuiwu.nanjing.gov.cn/for further details.
References
Ansorge, L., and Stejskalová, L. (2022). Water footprint as a tool for selection of alternatives (comments on “food recommendations for reducing water footprint”). Sustainability 14, 8. doi:10.3390/su14106317
Antonelli, M., and Sartori, M. (2015). Unfolding the potential of the virtual water concept. What is still under debate? Environ. Sci. and Policy 50, 240–251. doi:10.1016/j.envsci.2015.02.011
Chen, C., Cao, X. T., Zhang, S. B., Lei, Z. D., and Zhao, K. X. (2022). Dynamic characteristic and decoupling relationship of energy consumption on China’s construction industry. Buildings-Basel 12, 1745. doi:10.3390/buildings12101745
Dai, D., Sun, M., Xu, X., and Lei, K. (2019). Assessment of the water resource carrying capacity based on the ecological footprint: a case study in Zhangjiakou City, North China. Environ. Sci. Pollut. Res. Int. 26, 11000–11011. doi:10.1007/s11356-019-04414-9
Fang Kai, 方 (2015). Assessing the natural capital use of major nations: an application of a revised three-dimensional model of ecological footprint. Acta Ecol. Sin. 35. doi:10.5846/stxb201308022011
Fu, S., Xu, B. X., Peng, Y. X., Yu, J., Feng, Y. X., Li, X. X., et al. (2024). Effect of water Resource utilization in Poyang lake area on carbon emissions based on decoupling theory. Heliyon 10, e36292. doi:10.1016/j.heliyon.2024.e36292
Gao, S., Li, Z., Graves, G., Mattes, H. A., Fathollahifard, S., Vogel, J., et al. (2024). Hydro-modeling the ecosystem impact of wastewater reuse under climate change: a case study in upper Red River basin, Oklahoma. J. Am. Water Resour. Assoc. 60, 865–878. doi:10.1111/1752-1688.13208
Gong, Q. X., and Guo, G. X. (2024). Decoupling relationship between logistics growth and carbon emissions and driving factors in Chongqing: a novel decomposition framework. J. Environ. Manage. 370, 122931. doi:10.1016/j.jenvman.2024.122931
Gong, Q. X., Guo, G. X., Li, S. P., and Liang, X. D. (2021). Decoupling of urban economic growth and water consumption in Chongqing and Chengdu from the “production-living-ecological” perspective. Sust. Cities Soc. 75, 103395. doi:10.1016/j.scs.2021.103395
Kummu, M., Guillaume, J. H. A., de Moel, H., Eisner, S., Flörke, M., Porkka, M., et al. (2016). The world’s road to water scarcity: shortage and stress in the 20th century and pathways towards sustainability. Sci. Rep. 6, 38495. doi:10.1038/srep38495
Li, H., Zhao, F., Li, C., Yi, Y., Bu, J., Wang, X., et al. (2020). An improved ecological footprint method for water resources utilization assessment in the cities. Water 12, 503. doi:10.3390/w12020503
Linnan, H., Weixin, Z., Cuiling, J., and Xiaoqiu, F. A. N. (2008). Ecological footprint method in water resources assessment. Acta Ecologica. Sinica 28, 1279–1286.
Liu, S. Y., Zhang, J. J., Han, M. Y., Yao, Y. X., and Chen, G. Q. (2019). Multi-scale water use balance for a typical coastal city in China. J. Clean. Prod. 236, 117505. doi:10.1016/j.jclepro.2019.06.336
OECD (2015). Principles on water governance. Organization for Economic Cooperation and Development. Paris: OECD Publishing. doi:10.4324/9780429448058
Omer, A., Elagib, N. A., Ma, Z. G., Saleem, F., and Mohammed, A. (2020). Water scarcity in the Yellow River Basin under future climate change and human activities. Sci. Total Environ. 749, 13. doi:10.1016/j.scitotenv.2020.141446
Peng, Q. L., He, W. J., Kong, Y., Shen, J. Q., Yuan, L., and Ramsey, T. S. (2024). Spatio-temporal analysis of water sustainability of cities in the Yangtze River Economic Belt based on the perspectives of quantity-quality-benefit. Ecol. Indic. 160, 111909. doi:10.1016/j.ecolind.2024.111909
Stoeglehner, G., Edwards, P., Daniels, P., and Narodoslawsky, M. (2011). The water supply footprint (WSF): a strategic planning tool for sustainable regional and local water supplies. J. Clean. Prod. 19, 1677–1686. doi:10.1016/j.jclepro.2011.05.020
Su, Y., Liao, S. H., Ren, J. T., and Zhao, Z. L. (2024). Research on the decoupling relationship between water resources utilization and economic development at the county scale in Qian'nan Prefecture, Guizhou Province. Front. Environ. Sci. 12, 15. doi:10.3389/fenvs.2024.1347652
Sun, C., and Zhang, Z. (2017). Assessment of water ecological footprint size, depth, and spatial pattern in China. Acta Ecol. Sin. 37. doi:10.5846/stxb201608101640
Tapio, P. (2005). Towards a theory of decoupling: degrees of decoupling in the EU and the case of road traffic in Finland between 1970 and 2001. Transp. Policy 12, 137–151. doi:10.1016/j.tranpol.2005.01.001
UNESCO. (2021). The united nations world water development Report 2021: valuing water. doi:10.18356/9789210054157
Vorosmarty, C. J., Green, P., Salisbury, J., and Lammers, R. B. (2000). Global water resources: vulnerability from climate change and population growth. Sci. (New York, N.Y.) 289, 284–288. doi:10.1126/science.289.5477.284
Wackenagel, M., and William, E. R. (1996). Our ecological footprint: reducing human impact on the earth. Gabriola Isoland, BC: New Society Publishers. 2–17.
Wackernagel, M., White, S., and Moran, D. (2004). Using Ecological Footprint accounts: from analysis to applications. Int. J. Environ. Sustain. Dev. 3, 293–315. doi:10.1504/ijesd.2004.005077
Wang, J., Liu, X., Geng, X., Bentley, Y., Zhang, C., and Yang, Y. (2019). Water footprint assessment for coal-to-gas in China. Nat. Resour. Res. 28, 1447–1459. doi:10.1007/s11053-018-9446-8
William, E. R. (1992). Ecological footprints and appropriated carrying capacity: what urban economics leaves out. Environ. Urbanization 4 (2), 121–130. doi:10.1177/095624789200400212
William, E. R. (1996). Revisiting carrying capacity: area-based indicators of sustainability. Popul. Environ. 17, 195–215. doi:10.1007/bf02208489
Wu, Y., Tam, V. W. Y., Shuai, C., Shen, L., Zhang, Y., and Liao, S. (2019). Decoupling China's economic growth from carbon emissions: empirical studies from 30 Chinese provinces (2001-2015). Sci. Total Environ. 656, 576–588. doi:10.1016/j.scitotenv.2018.11.384
Xiong, Y., Tian, X., Liu, S., and Tang, Z. (2020). New patterns in China's water footprint: analysis of spatial and structural transitions from a regional perspective. J. Clean. Prod. 245, 118942. doi:10.1016/j.jclepro.2019.118942
Keywords: water resources, water ecological footprint, economy, decoupling, sustainable water resources utilization
Citation: Qianli X and Hongyao S (2025) Decoupling analysis of urban water resource utilization and economic development. Front. Environ. Sci. 13:1521769. doi: 10.3389/fenvs.2025.1521769
Received: 04 November 2024; Accepted: 09 June 2025;
Published: 01 October 2025.
Edited by:
Weijun He, China Three Gorges University, ChinaReviewed by:
Faisal Mueen Qamer, International Centre for Integrated Mountain Development, NepalXiaomeng Wang, The University of Texas Health Science Center at San Antonio, United States
Copyright © 2025 Qianli and Hongyao. This is an open-access article distributed under the terms of the Creative Commons Attribution License (CC BY). The use, distribution or reproduction in other forums is permitted, provided the original author(s) and the copyright owner(s) are credited and that the original publication in this journal is cited, in accordance with accepted academic practice. No use, distribution or reproduction is permitted which does not comply with these terms.
*Correspondence: Xu Qianli, cXh1YXpAY29ubmVjdC51c3QuaGs=