 Jianwen Zhang1
 Li Wang
 Meichen Fu
- 1School of Land Science and Technology, China University of Geosciences (Beijing), Beijing, China
- 2State Key Laboratory of Remote Sensing Science, Aerospace Information Research Institute, Chinese Academy of Sciences, Beijing, China
- 3Wu’an Natural Resources and Planning Bureau, Shijiazhuang, China
Urban shrinkage, characterized by population loss and economic decline, poses unique challenges to carbon neutrality goals. While existing studies focus on energy-related emissions in shrinking cities, the role of land use dynamics remains underexplored. This study systematically investigates land use carbon emissions (LUCE) in shrinking counties to address this gap. Focusing on the Beijing-Tianjin-Hebei (BTH) region (2000–2020), we integrated population indices, land use data, energy statistics, and nightlight imagery to classify counties into non-shrinking, continuous, temporary, and potential shrinkage types. Direct and indirect carbon emissions were estimated using emission coefficients and energy consumption models. Key findings include: (1) Non-shrinking counties, concentrated in urban cores, exhibit higher LUCE but slower growth rates, whereas shrinking peripheral counties show lower emissions but faster LUCE growth. (2) Continuous shrinkage counties experience the highest LUCE growth due to inefficient built-up area expansion, despite having significant carbon sinks. (3) Severe shrinkage counties demonstrate the fastest total carbon emissions (TCE) growth, with per capita emissions (PCE) positively correlated to shrinkage intensity. These findings highlight the need for differentiated policies: prioritizing land-use efficiency in shrinking counties, integrating regional equity into emission governance, and leveraging carbon sinks in ecologically rich areas.
1 Introduction
The carbon emission pressure has become increasingly severe, constituting a serious menace to both the regional ecological environment and sustainable human development. According to the International Energy Agency (IEA, 2023), China accounted for around 28% of global CO2 emissions in 2022, totaling 12.1 billion tonnes. The industrial and energy sectors dominate national emissions, accounting for 65% of the total, while rapid urbanization has driven a 40% increase in carbon emissions from urban construction and transportation since 2010. For instance, built-up areas expanded by 25% in the Beijing-Tianjin-Hebei (BTH) region from 2000 to 2020, directly correlating with a 38% rise in regional carbon emissions (National Bureau of Statistics of China, 2023). These trends underscore the urgency of reconciling urban development with emission reduction goals, particularly in regions experiencing population shrinkage (Zhang et al., 2022a). To address the carbon emissions challenge, the Chinese government has put forward a plan to reach the peak of carbon emissions by 2030 and attain carbon neutrality by 2060 (Zhang et al., 2022). As China’s economy enters the transition stage, the constraints on the available resources and the environment continue to increase, as well as the Matthew effect of the factor agglomeration (Zhang et al., 2022). This effect further enlarges the dominant position of the economically developed regions in various fields, aggravates the imbalance of regional development, intensifies the spatial concentration and dispersion of the population, and some cities show a shrinking trend. The predominant manifestations of this effect encompass population depletion, economic recession, escalating unemployment, deserted land, unoccupied houses, and environmental deterioration, among other aspects (Guo et al., 2021). Conversely, a decline in population can to a certain degree ease the pressure on the environment and resources, and consequently lead to a reduction in carbon emissions (Herrmann et al., 2016). In the face of the new trend of urban shrinkage, clarifying the differences in carbon emissions among different regional cities with various development types is of significant importance for formulating regional carbon reduction plans and promoting urban sustainable development.
The concept of urban shrinkage originated in Europe in the 1980s, particularly in post-industrial regions such as Germany’s Ruhr Valley and Eastern Europe, where deindustrialization and population aging triggered sustained population decline (Häußermann and Siebel, 1988). Recent research has highlighted that it is prevalent in both developed and developing countries and is a global phenomenon. In Europe, cities such as Leipzig and Dresden have implemented “smart shrinkage” policies that focus on urban greening and compact development to address population decline and economic stagnation (Artmann et al., 2019; Kim et al., 2020). In the United States, rust belt cities such as Detroit and Cleveland experienced significant shrinkage due to deindustrialization, leading to widespread urban decay and population loss (Sutradhar et al., 2024). Similarly, Japan is facing shrinking cities due to an aging population and declining birth rate, with cities such as Kitakyushu adopting compact urban forms and renewable energy integration to mitigate this impact (Onodera et al., 2024).
The urban shrinkage in China has some unique factors such as population aging and the decline of resource-based cities. For example, cities in Northeast China, which once relied on heavy industry and natural resources, are facing significant economic decline and population loss due to resource depletion and industrial restructuring (Chen, 2024; Xie et al., 2022). In addition, China’s aging population exacerbates urban shrinkage as younger generations migrate to economically active areas, leaving behind an older, less economically active population (Kang et al., 2024). These factors set China’s urban shrinkage apart from other countries and require a targeted policy response.
Compared with non-shrinking cities, shrinking cities exhibit distinct transformation dynamics in population, economy, society, and land use patterns, which may catalyze novel pathways for carbon emission evolution. Scholars globally have initiated systematic investigations into the interplay between urban shrinkage and carbon emissions, yielding preliminary insights into their complex relationship. For instance, Maerz et al. (2013) conducted a seminal analysis of low-carbon transition barriers and enablers in German shrinking cities, emphasizing structural economic constraints. Schwartz et al. (2020) demonstrated that strategic optimization of urban green spaces in shrinking contexts could reduce emissions by up to 15%, highlighting the role of ecological planning. In the Chinese context, Yang et al. (2022) revealed divergent carbon emission trajectories between growing and shrinking cities, with the latter showing accelerated per capita emissions despite population decline. A notable contribution by Xiao et al. (2019) quantified emission disparities, identifying a persistent upward trend in rapidly shrinking cities, whereas Tong X. et al. (2022) reported an inverted U-shaped emission curve in such contexts. Complementing these findings, Liu X. et al. (2020) and Zeng et al. (2022a) established scale-dependent correlations, showing that shrinkage-induced emission increases were disproportionately pronounced in smaller urban units. Further granularity was added by Zeng et al. (2022b), who delineated shrinkage-driven reductions in both energy consumption efficiency and carbon emission performance.
Despite these advancements, three critical limitations persist in the current scholarship. First, extant literature predominantly focuses on energy-related emissions, overlooking the mediating role of land use dynamics in shaping emission pathways. While land cover alterations (e.g., deforestation, urbanization) directly release sequestered carbon (Zhang et al., 2022b), indirect emissions from land use-associated activities—such as transportation networks and construction sprawl (Yang et al., 2022)—remain underexplored in shrinkage contexts. Second, the prevailing reliance on prefecture-level city analyses in Chinese studies inadequately captures localized shrinkage mechanisms. Given their administrative granularity and economic vulnerability, counties serve as more sensitive indicators of shrinkage impacts (Guan et al., 2021; Tong et al., 2022b). Third, although population size and shrinkage intensity have been incorporated into emission models, the temporal trajectories of shrinkage (e.g., continuous vs. episodic) and their emission implications remain virtually unaddressed in empirical research.
This study advances shrinkage research by addressing three critical gaps in prior work: First, while existing literature predominantly focuses on energy-related emissions, we establish land use dynamics as a key mediator between shrinkage and carbon outcomes. Second, our county-level analysis reveals spatial heterogeneities obscured in prefecture-level studies. Third, we pioneer the classification of shrinkage trajectories (continuous, temporary, potential), demonstrating their distinct emission pathways. By elucidating the relationship between urban shrinkage and accelerated LUCE, our findings provide critical insights for tailoring carbon reduction strategies to different shrinkage trajectories. For policymakers, the results underscore the need to prioritize land-use efficiency in shrinking counties and integrate regional equity into emission governance. Ultimately, this work contributes to bridging the gap between urban shrinkage studies and low-carbon transition policies, offering actionable pathways for achieving China’s 2030/2060 carbon goals.
2 Materials and methods
2.1 Study area
The Beijing-Tianjin-Hebei region is located in the heart of China’s Bohai Sea region, between 113°27′-119°50′E and 36°05′-42°40′N (Figure 1). It has a land area of 216,000 km2 and is considered the most densely populated and economically active urban area in northern China. Moreover, it has two municipalities directly under the central government of Beijing and Tianjin and Hebei province, with a total of 199 county-level administrative districts and a resident population of 107 million by the end of 2020. From 2000 to 2010, 34 districts and counties lost their resident population, while during the decade 2010-2020, 114 districts and counties lost their resident population, accounting for more than half of the number of counties and districts in the Beijing-Tianjin-Hebei region, which corresponds to an increase of nearly three times, with the regional population loss intensifying and the trend of shrinkage coming into the fore. Additionally, the region faces severe economic disparities, with GDP per capita in shrinking counties being significantly lower than in non-shrinking counties (Wang et al., 2020). In 2020, the carbon emissions of the Beijing-Tianjin-Hebei city cluster will be 601 million tons, which is equivalent to an increase of 335 million tons compared with 2009 (266 million tons). The BTH region exhibits a prominent trend of population shrinkage and severe pressure for carbon emission reduction. It is an important experimental field for exploring urban carbon emission reduction in the context of shrinkage.
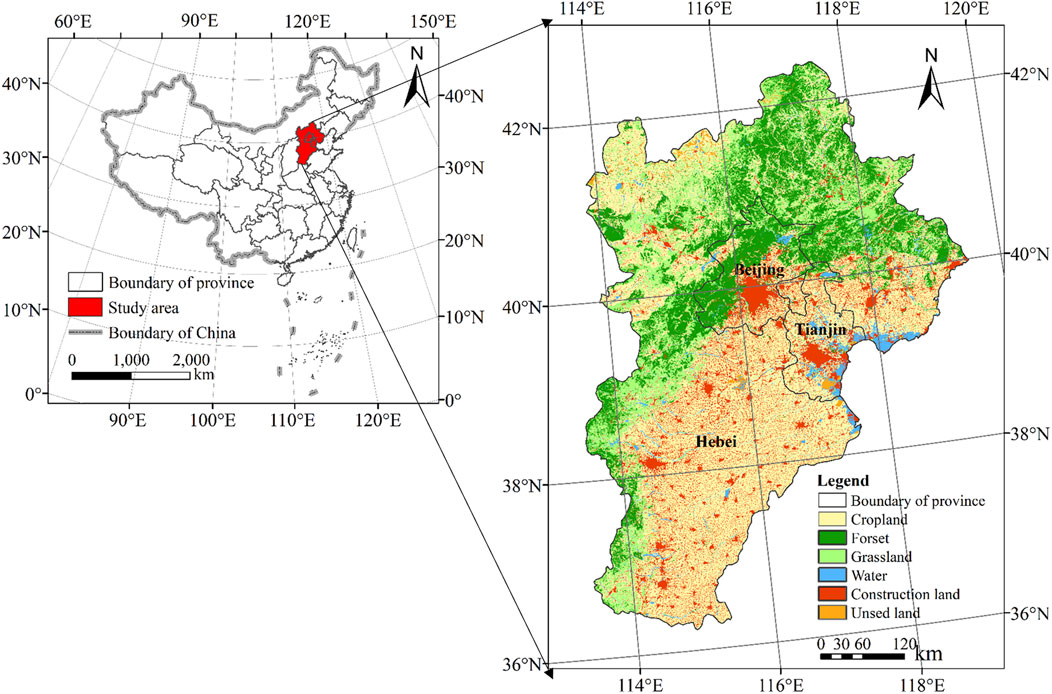
Figure 1. Geographical location of the studied area.
2.2 Data sources
The demographic information was sourced from the fifth (2000), sixth (2010), and seventh (2020) national censuses of China, publicly available through the National Bureau of Statistics (http://www.stats.gov.cn). The land use data for the years 2000, 2010, and 2020 were obtained from the esteemed Data Center for Resources and Environmental Sciences, affiliated with the Chinese Academy of Sciences, accessible via their official website (http://www. resdc.cn). These land use datasets were classified into six fundamental categories: cropland, forestland, grassland, water, construction land, and unused land. Each category has a spatial granularity of 30 m. The regional energy consumption data in the BTH region were derived from China Energy Statistical Yearbook. The data of the administrative territory originated from the 1:100,000 Chinese Geographical Information Resources Directory Service System (http://www.webmap.cn). The nightlight dataset (Version 2.0, 1000 m resolution) was obtained from the Global Change Scientific Research Data Publishing System (https://www.geodoi.ac.cn). Specifically, we utilized the comprehensive Chinese Long Time Series Night Light Dataset spanning from 2000 to 2020. To address administrative boundary changes (e.g., mergers or splits of counties), we standardized all data to the 2020 county boundaries using spatial overlay and area-weighted interpolation in ArcGIS 10.8. Historical census data were adjusted to match the 2020 administrative divisions.
2.3 Research methods
2.3.1 Methodological framework
This study adopts a systematic approach to analyze LUCE in shrinking cities within the Beijing-Tianjin-Hebei (BTH) region. The methodological framework comprises four key steps: (1) Data Preparation: Integration of multi-source datasets, including population census, land use maps, energy statistics, and nighttime light imagery, standardized to 2020 administrative boundaries. (2) Shrinkage Identification: Classification of counties into non-shrinking and shrinking types (continuous, temporary, potential) based on population dynamics (2000–2020). (3) Land Use Dynamics Analysis: Quantification of land use changes using dynamic degree indices and correlation with LUCE trends. (4) Carbon Emission Estimation: Calculation of direct emissions (via land use coefficients) and indirect emissions (via energy consumption models).
2.3.2 Identification of shrinking counties
Based on the relevant works in the literature (Hu et al., 2021; Yang et al., 2022; Zhou et al., 2021), the characteristics of shrinking cities are usually manifested in three aspects: population loss, economic decline, and spatial decay. However, in the specific identification of shrinking cities, the scientific community has not yet established a uniform standard. Nevertheless, population loss is generally regarded as the main characteristic of shrinking cities. Moreover, the shrinkage of cities in China is manifested primarily by population outflow from those cities facing vulnerable competition, whereas economic recession and spatial decay are not as pronounced (Chen et al., 2022).
Therefore, county-level administrative areas were used here as the research unit, and population loss was taken as the identification sign of the county shrinkage. The census data of permanent residents were used in this work, which were divided into T1 and T2 phases with a 10-year interval between censuses. T1 was 2000–2010 and T2 was 2010–2020. The years 2000, 2010, and 2020 were selected as temporal nodes for three key reasons: 1. Data Consistency: China conducts its national population census every decade (2000, 2010, 2020), providing authoritative and standardized demographic data essential for longitudinal analysis. 2. Shrinkage Trajectory: Before 2000, county shrinkage in the BTH region was negligible (Liu et al., 2020b). From 2000 to 2010, shrinkage intensified (34 counties), and by 2010–2020, over half of counties experienced population loss, marking a critical transition from localized to widespread shrinkage. 3. Policy Relevance: The 20-year span captures China’s urbanization and carbon policy shifts, enabling analysis of LUCE trends under varying shrinkage intensities and governance phases. Meanwhile, PI (population index) was used to define population shrinkage rate of each county and district in each period.
In Formula (1), PI stands for the population index. Meanwhile, POPi1 and POPi2 represent the populations as cited in the national censuses conducted in i1 and i2, respectively. The factor of 0.1 is used to convert the population change over a 10-year period into an annualized rate.
2.3.3 Types of shrinking counties
To comprehensively analyze the unique characteristics and variations observed in county shrinkage, a review of the relevant works in the literature was conducted (Gao et al., 2022; Guan et al., 2021; Wolff and Wiechmann, 2018). This research categorized counties into eight distinct types, based on their respective shrinkage trajectories and degrees (Table 1).

Table 1. Types of shrinking counties.
2.3.4 Land use dynamic degree
The land use dynamic degree serves as an indicator, offering insights into the tempo and magnitude of alterations occurring within various land use categories within the designated study area, spanning across a specified time frame (Du et al., 2022; Huang et al., 2018). The computation of the dynamic degree pertaining to a specific land use type can be performed using the following Formula (2):
where Si is the single dynamic degree of land use type i, Uit2 is the area of land use type i in the study area at time t2, Uit1 is the area of land use type i at time t1, and t2∼t1 is the study period.
2.3.5 Estimation of LUCE
LUCE encompass two distinct categories: direct and indirect emissions (Hong et al., 2023; Yang and Liu, 2023). Direct carbon emissions are the emissions that directly originate from different land use types during their utilization. Specifically, they comprise emissions from cropland, forest, grassland, water, and unused land. Conversely, indirect carbon emissions are related to the energy consumption linked with socioeconomic activities, production procedures, and the inhabitation of land allocated for construction (Rong et al., 2023; Song et al., 2023).
(1) The estimation of direct carbon emissions emanating from diverse land-use categories was conducted employing the carbon emission coefficient methodology. Specifically, the coefficients assigned to cropland, forest, grassland, water, and unused land were quantified as 0.422, −0.623, −0.021, −0.253, and −0.007 tons per hectare per annum (t/hm2 a), respectively (Wang et al., 2021; Yan et al., 2022; Zhang et al., 2024; Zhu et al., 2019). The Formula (3) utilized for calculating direct carbon emissions is presented as follows:
where
(2) Indirect carbon emissions: The construction land also account for a significant portion of the energy expenditure generated by human activities. Carbon emissions can be estimated indirectly by considering the energy consumed during the utilization of the construction land. The Equation (4) for this estimation is as follows:
where
To this end, the conversion coefficient of the energy standard coal issued by the (IPCC, 2006) was used in combined with the carbon emission coefficient studied by the scientific community in the BTH region (Cui et al., 2019; Zhou Ying et al., 2021), and the relevant parameters are presented in Table 2. Due to the lack of county-level energy consumption statistics, the night light data is combined with energy consumption statistics to estimate carbon emissions. According to (Wang et al., 2021; Yang et al., 2022; Zhou Yuan et al., 2021) uses a regression model in which nightlight data is used as a proxy for energy consumption. The model was validated against available energy consumption statistics at the regional level, ensuring the reliability of the estimates.
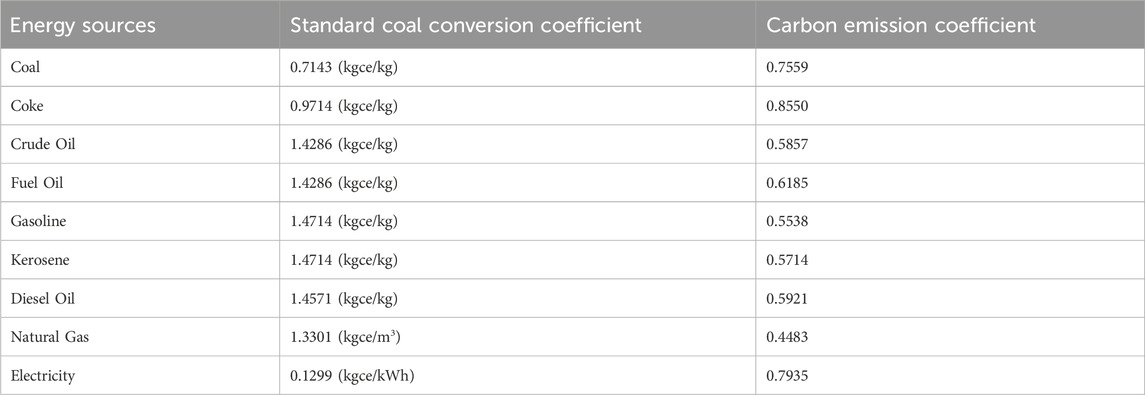
Table 2. Standard coal conversion coefficients and carbon emission coefficients.
3 Results and analysis
3.1 LUCE in shrinking and non-shrinking counties
To gain a deeper comprehension of the LUCE peculiarities within shrinking counties, we compared and analyzed the LUCE in shrinking counties with those in non-shrinking counties. In general, non-shrinking counties are predominantly clustered in the environs of Beijing, Tianjin, and Hebei, and the shrinking counties are distributed in the periphery. Non-shrinking counties have obvious regional advantages and strong capacity for the agglomeration of regional development factors. The outflow of development factors in shrinking counties, primarily characterized by population outflow, is the result of the interplay between the development capabilities of these counties and their associated counties. The corresponding areas with high LUCE values are mainly distributed in non-shrinking counties, and the LUCE in shrinking counties is generally relatively low (Figure 2). At the same time, the adaptability of the non-shrinking counties to low-carbon development is stronger, while that of shrinking counties is weaker. It is predominantly manifested in the facilitation of green and low-carbon development in the region at T2 stage. Moreover, the counties where TCE and PCE are reduced are mainly non-shrinking counties (Figure 3).
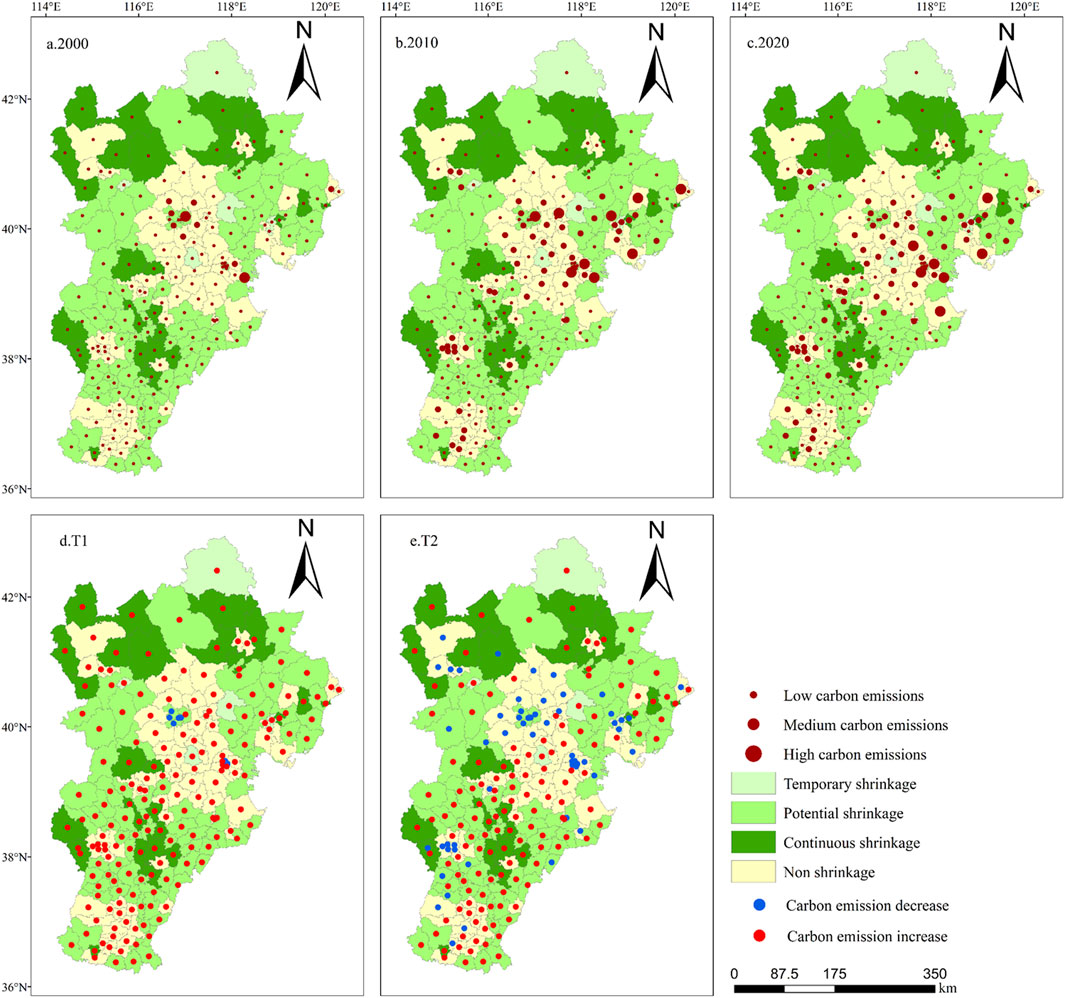
Figure 2. Spatial distribution and changes in TCE. (a) 2000 (b) 2010 (c) 2020 (d) T1:2000-2010 (e) T2:2010-2020.
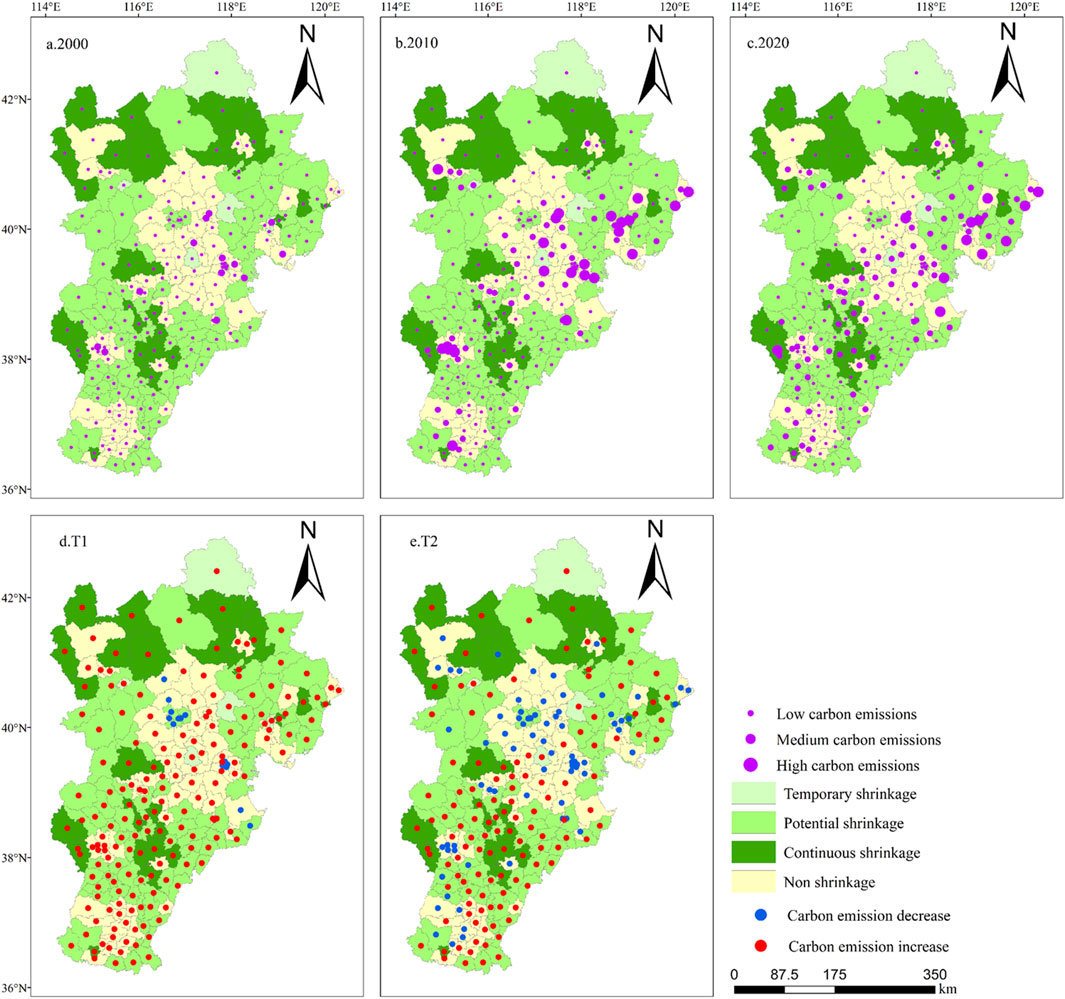
Figure 3. Spatial distribution and changes in PCE. (a) 2000 (b) 2010 (c) 2020 (d) T1:2000-2010 (e) T2:2010-2020.
Under the influence of the overall regional trend, the land use change of both shrinking and non-shrinking types exhibited continuous expansion of the built-up areas and continuous reduction of the cropland. Compared with the T1 stage, the growth rate of the construction land expansion and reduction rate of the cropland in the T2 stage slowed down (Table 3). The areas of the forest and grassland remained largely stable, while the water and unused land with low carbon sequestration potential, although experiencing significant fluctuations, were less distributed in the BTH region, accounting for only 4% of the total area, resulting in weak carbon uptake (Figure 4). A strong consistency between the continuous expansion of the construction land and the continuous increase in the LUCE can also be observed. During T1 stage, non-shrinking counties experienced a TCE growth rate of 17.6% annually (vs. 12.6% in shrinking counties), driven by construction land expansion at 4.29% per year (Table 3). In the T2 stage, the expansion of the construction land in non-shrinking counties slowed down sharply, and the TCE grew at a low speed, with a growth rate of only 0.4% annually, lower than 1.4% in shrinking areas. Furthermore, the growth rate of PCE was significantly lower than that in shrinking counties (Figure 5B). Thereby, it can be inferred that shrinking counties have weak adaptability to low-carbon development of land use, which may stem from their relatively low development stage and economic level, lower land use efficiency and energy use efficiency, or they are located in low-carbon emission areas with less pressure on carbon emission reduction (Ge and Liu, 2021; Zhou et al., 2021).
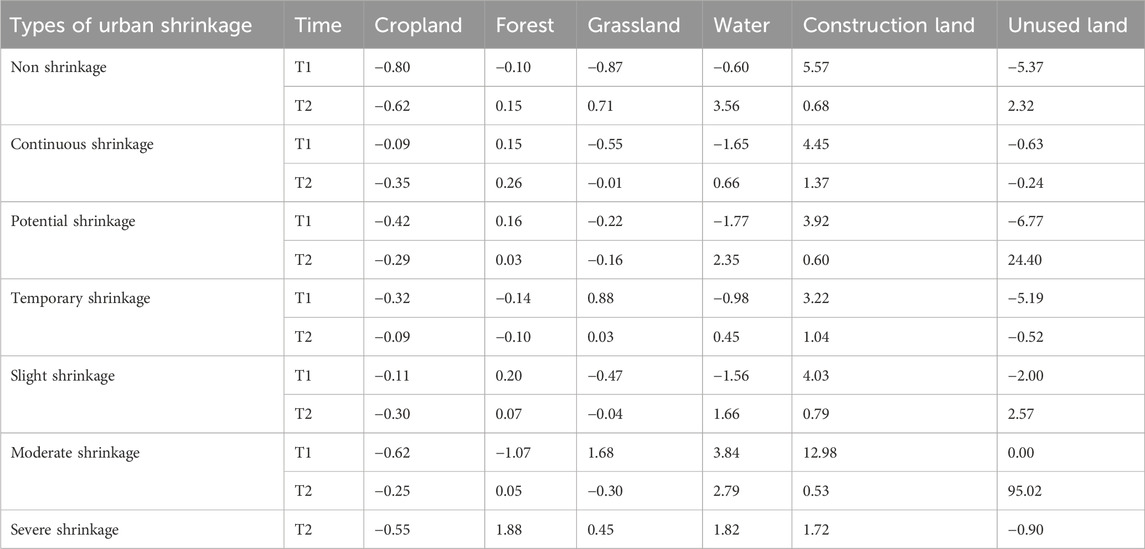
Table 3. Single land use dynamic degree corresponding to different shrinkage types.
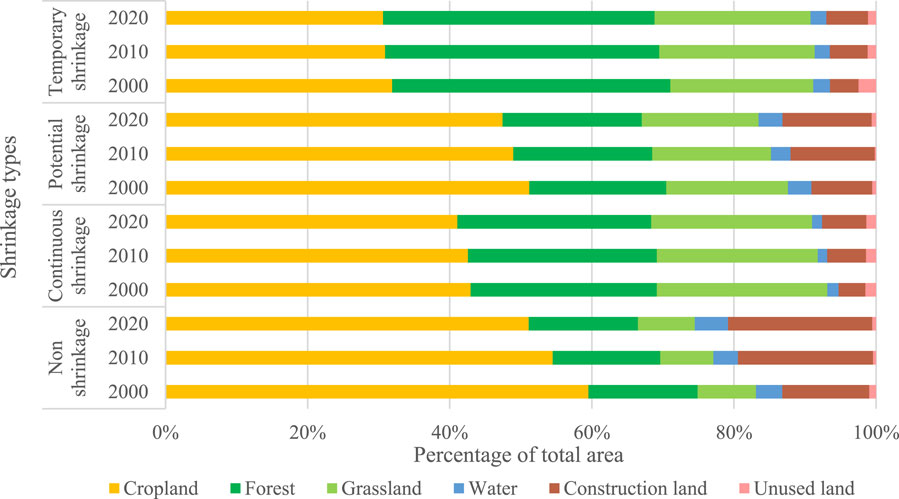
Figure 4. The proportion of land use area in different shrinkage types (2000–2020).
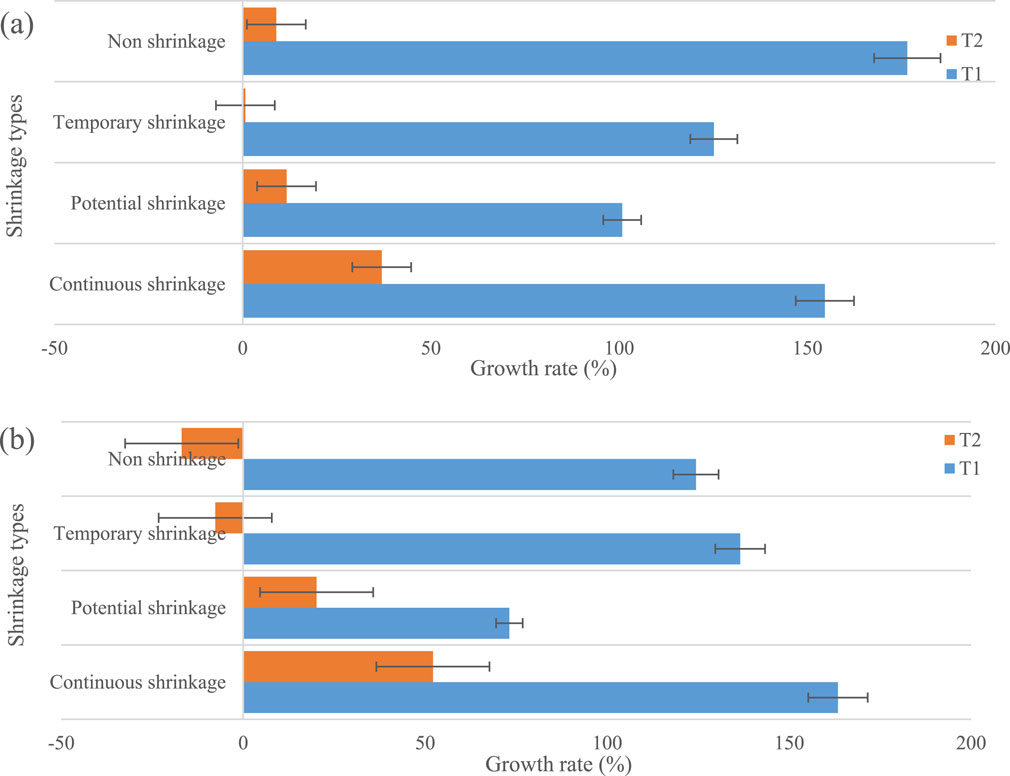
Figure 5. Change rate in LUCE: (a) Total carbon emissions (TCE); (b) Per capita emissions (PCE). Time periods (T1: 2000–2010, T2: 2010–2020).
3.2 LUCE with different shrinkage trajectories
To further analyze the LUCE of the shrinking types, the LUCE of the different shrinking types were systematically explored by identifying the population index. A total of 27 counties and districts continued to shrink, mainly distributed in the northern plateau and central plain. The economic development level was relatively backward, and the continuous population decline indicated that the region was less attractive and lacked the driving force for economic development. Ecological lands (forest and grassland) were widely distributed, and the carbon sink was about one-third of that in the BTH region, and remained basically stable. Besides, both the TCE and PCE were relatively low (Figure 4). However, Continuous shrinkage counties showed the highest annual TCE growth rate (3.7% in T2), followed by potential shrinkage (1.2%) and temporary shrinkage (0.07%) (Figure 5A). This disparity correlates with construction land expansion rates: 1.37% in continuous shrinkage vs. 0.60% in potential shrinkage (Table 3). In the cases of insufficient economic power, the government mostly transfers land use rights to increase fiscal revenue (land finance), so as to maintain Gross Domestic Product (GDP) growth. However, due to the lack of economic development power, the land use efficiency is low, resulting in the waste of land resources and the increase of LUCE. This outcome is consistent with the research of Wang et al. (2020), suggesting that land finance accelerates the further shrinkage of the urban population. Therefore, shrinking counties need to achieve regional green and low-carbon quality development through intensive land use.
In addition to continuous shrinkage, shrinkage at different stages can be classified into two categories. The first category is marked by shrinkage at T1 and growth at T2. In this work, it is referred to as temporary shrinkage. There are only seven counties of this type, and their distribution is relatively scattered (Figure 2). The growth rate of LUCE in the T2 stage is the lowest among all shrinkage types. Counties and districts are transition from shrinkage to growth, indicating the success of the development transformation, energy structure adjustment, and energy efficiency improvement, to achieve “smart shrinkage”. Besides, 3 counties and regions with reduced LUCE were detected (Figure 4), accounting for 42.86%, which is the highest proportion among the different types of shrinkage trajectories. These regions were distributed in Tianjin and Tangshan, Hebei Province, where the economic development level was relatively good. The development of the construction land has shown saturation, and the land use change has basically remained stable. Due to the small sample size and the large differences in TCE among the samples, the overall trend is more influenced by counties with high LUCE.
The second category is marked by population growth during the T1 stage and population shrinkage in the T2 stage, which we term the potential shrinkage type in this work. Counties of this type are primarily distributed in the surrounding areas of Beijing and Tianjin, as well as around cities in Hebei Province, and exhibit a contiguous distribution. The proportion of carbon sink lands, such as forest and grassland, is relatively low, whereas the proportion of carbon source land, such as construction land is relatively high. Counties that have high levels of LUCE are predominantly located in this category. Both TCE and PCE continue to grow, with the growth rate of the TCE and PCE in the T1 stage is the lowest among all shrinkage types. In contrast, the growth rate of TCE and PCE in the T2 stage is only higher than that of the potential shrinkage type (Figure 5). Thus, it can be argued that the urban shrinkage is negatively correlated with the growth rate of the LUCE. Despite the overall growth trend of LUCE, some counties and districts exhibited a downward trend, primarily located in the main urban areas of Beijing and Tianjin, which possess the highest regional economic level (Figure 2). The primary reason for this phenomenon may be that urban development has reached a stage of high-quality development. To enhance urban functions, improve urban quality, and optimize the energy consumption structure, cities have taken proactive measures to reduce their populations, leading to a continuous decrease in both TCE and PCE. Additionally, the development of construction land has shifted towards reducing volume and increasing efficiency. It is evident that urban shrinkage is influenced by complex driving mechanisms, and the LUCE in shrinking counties vary significantly under different mechanisms. Currently, the spatial distribution of counties experiencing active shrinkage is concentrated, with a relatively small proportion of regions affected. However, this may become a trend in the development of megacities in the future.
3.3 LUCE under different shrinkage degrees
In the T1 stage, the BTH region exhibited local shrinkage of less developed areas, with 34 shrinking counties, accounting for 17%. Only two counties experienced moderate shrinkage, and the trend in LUCE was reversed. However, due to the small sample size, it lacks regularity. There were 32 counties with slight shrinkage, and both TCE and PCE displayed an upward trend. Compared to the entire BTH region, the TCE grew at a lower rate, while the PCE grew at a higher rate, and the expansion rate of construction land was lower in the T1 stage. It is evident that the expansion of the built-up area is highly correlated with the growth of TCE, and population loss leads to rapid growth in PCE. In the T2 stage, the number of shrinking counties increased rapidly, transitioning from local to global shrinkage, with severe shrinkage counties emerging. Nonetheless, the region was still predominantly characterized by mild shrinkage. LUCE for each shrinkage degree and type also exhibited an upward trend. The percentages of counties with decreased LUCE were 17%, 23%, and 18% for severe, moderate, and mild shrinkage, respectively, with the moderate shrinkage type having the highest proportion. Among shrinking counties, the growth rate of TCE was highest in severe shrinkage, followed by mild shrinkage, and lowest in moderate shrinkage. Similarly, the growth rate of PCE was highest in severe shrinkage, followed by moderate shrinkage, and lowest in mild shrinkage (Figure 6). The expansion of the construction land is relatively consistent with the growth rate of TCE, confirming a positive correlation between the two. In general, during the stage of urban expansion, a stronger degree of shrinkage leads to more drastic expansion of the construction land and a faster growth rate of TCE. Due to differences in the extent of population loss, the growth rate of PCE was lowest in moderately contracted counties.
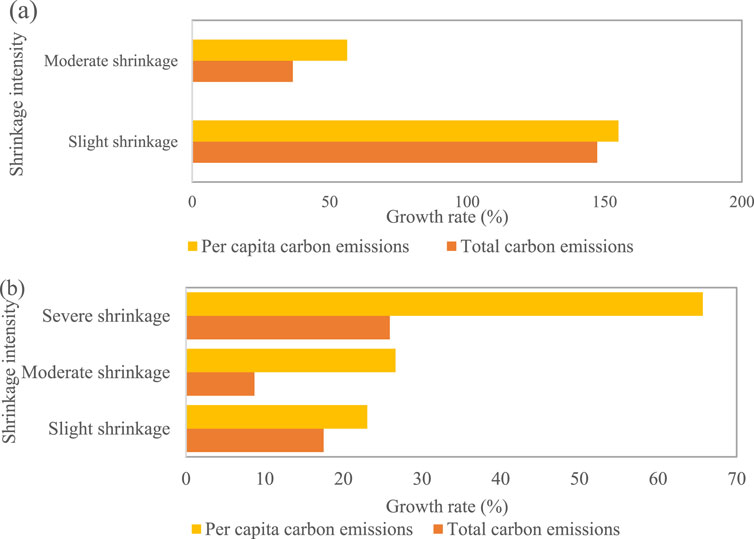
Figure 6. Change rate of LUCE under different shrinkage degrees: (a) T1 (2000–2010); (b) T2 (2010–2020).
Since counties with the same degree of shrinkage are at different stages of development and exhibit significant differences in LUCE trends, it was found that the regularity is more obvious by eliminating counties with large differences in overall trends within the same shrinkage degree. Generally speaking, severe population loss in counties and districts indicates low economic development vitality and limited avenues for driving economic growth and attracting the population. Consequently, further urban development is often driven by increasing the land quota for construction, which simultaneously promotes urban expansion and construction (Hu et al., 2021; Wu and Yao, 2021). Due to the extensive development model, low land use efficiency, and persistent severe population loss, multiple factors could contribute to a relatively high growth rate of PCE.
4 Discussion
4.1 LUCE in shrinking counties
Our findings reveal that non-shrinking counties exhibit a lower growth rate in LUCE compared to shrinking counties, which aligns with previous studies highlighting the challenges of carbon reduction in shrinking cities (Xiao et al., 2019; Yang et al., 2022). However, our study provides a more nuanced understanding by emphasizing the stage differences in LUCE trends. During the early stages of urban expansion, non-shrinking counties experience rapid growth in LUCE due to intense built-up area expansion. In contrast, during the later stages of urban transformation, the growth rate of LUCE in non-shrinking counties slows significantly, reflecting successful efforts in industrial upgrading and energy efficiency improvements. Severely shrinking counties, despite having the lowest initial LUCE, exhibit the fastest growth rate in total carbon emissions (TCE). This anomaly can be attributed to the extensive development model prevalent in these regions, where low land use efficiency and persistent population loss exacerbate carbon emissions. This finding challenges the conventional assumption that population decline inherently reduces carbon emissions and underscores the need for targeted interventions in severely shrinking regions.
4.2 LUCE in shrinking counties under different driving mechanisms
Urban shrinkage is driven by a combination of factors, and our study identifies two distinct mechanisms: passive shrinkage and proactive shrinkage.
Passive Shrinkage: In the T1 stage (2000–2010), shrinkage in the BTH region was primarily driven by the depletion of resources in industrial and mining counties, leading to population loss and economic decline. These counties, located on the periphery of urban agglomerations, experienced spatial deprivation of development factors, resulting in low LUCE but rapid growth rates due to inefficient land use.
Proactive Shrinkage: In the T2 stage (2010–2020), a new form of shrinkage emerged, characterized by policy-driven suburbanization in Beijing. This proactive shrinkage aimed to optimize urban spatial distribution, alleviate congestion, and control population size. Counties experiencing proactive shrinkage exhibited stable or decreasing LUCE, reflecting successful efforts in land use optimization and energy efficiency improvements. The Dongcheng District of Beijing, a severely shrinking county dominated by tertiary industries, demonstrated a continuous decrease in LUCE. This finding highlights the potential for high-quality urban development in shrinking cities, where proactive policies can lead to significant carbon emission reductions. This contrasts with the typical narrative of shrinkage as a negative phenomenon and offers a new perspective on the potential benefits of managed urban decline.
Unique to the BTH region, the coexistence of these pathways highlights the critical role of regional equity policies. For example, Tangshan’s waterfront industrial zone absorbed Beijing’s relocated steel plants, exacerbating emissions in a shrinking county. This anomaly, absent in Western cases (Miljanović et al., 2023), underscores the need for trans-regional carbon accounting in China’s coordinated development plans.
4.3 Limitations and directions for improvement
Although some research results were achieved in this work, it still has the following limitations:
(1) Census data have inherent limitations, including a 10-year temporal resolution and delayed publication (e.g., 2020 census results were released in 2021). This may introduce gaps in capturing rapid population shifts. Additionally, nightlight data at 1000 m resolution may overlook fine-scale land use changes, particularly in peri-urban or rural counties.
With the advancements in the Internet and remote sensing geographic information technology, it is now possible to obtain spatio-temporal big data that can accurately represent human activities over a wide range and with high precision. In the future, big data can be utilized to better identify shrinking cities at different scales.
(2) LUCE exert a certain impact on urban shrinkage. However, whether the interaction between shrinking cities will amplify this impact remains unknown. In the future, the impact of interactions between shrinking cities on LUCE can be further explored.
(3) This study qualitatively analyzed the differences in LUCE patterns between actively shrinking counties and passively shrinking counties. The LUCE in shrinking cities with different driving mechanisms are significantly different, and the underlying processes of urban shrinkage in different development periods are obviously heterogeneous. Therefore, in future studies on the LUCE effects of shrinking cities, it is necessary to further analyze LUCE under different development stages and driving mechanisms from a quantitative perspective.
4.4 Policy recommendations for mitigating shrinkage and LUCE
4.4.1 Policy recommendations
Based on the findings, the following policy recommendations are proposed to address urban shrinkage and its impact on LUCE at the county level:
First, strict control of built-up area expansion in shrinking counties should be prioritized. For example, zoning policies could enforce “infill development” by reusing vacant industrial lands and abandoned residential areas, rather than permitting urban sprawl. This aligns with the observed correlation between built-up area expansion and LUCE growth (Figure 5). Second, establishing cross-county cooperation platforms is critical to mitigate the “center-periphery” imbalance. For instance, fiscal transfer mechanisms could incentivize core cities (e.g., Beijing) to share industrial and technological resources with shrinking peripheral counties. This would reduce reliance on land finance-driven GDP growth. Third, subsidies for renewable energy adoption and circular economy practices should target shrinking counties with high LUCE growth rates. Heavy industrial bases like Tangshan could integrate carbon capture technologies, while agricultural counties might transition to agroforestry systems to enhance carbon sinks. Tax breaks for green enterprises and stricter emission standards for coal-dependent industries would accelerate this transition.
4.4.2 Feasibility and challenges
While these policies are theoretically viable, their implementation faces three key challenges: First, hrinking counties often lack fiscal autonomy. Central government grants or public-private partnerships (PPPs) may be necessary to fund green infrastructure projects. Second, many counties lack granular energy consumption data. Integrating nighttime light data and IoT sensors could improve LUCE monitoring (Zheng et al., 2023). Third, existing administrative barriers hinder resource sharing. Legally binding regional agreements, as seen in the BTH Coordinated Development Plan, could serve as a model.
These recommendations align with China’s “dual carbon” goals and emphasize adaptive governance tailored to shrinkage trajectories. Future policies should balance equity and efficiency, ensuring shrinking counties are not marginalized in national decarbonization efforts.
4.4.3 International comparisons and Lessons
Globally, municipalities experiencing urban contraction confront shared systemic challenges while employing divergent adaptive approaches. Illustrated by the German model, proactive smart shrinkage strategies in metropolitan centers like Leipzig and Dresden prioritize structural demolition of underutilized properties and their ecological conversion, effectively mitigating urban sprawl and carbon footprints (Ali et al., 2020).
This contrasts fundamentally with China’s land-finance-driven development model, highlighting divergent policy orientations between immediate fiscal optimization and long-term ecological planning. Regarding demographic contraction driven by aging populations, Japanese cities like Kitakyushu demonstrate an integrated sustainability framework through compact city design and systematic renewable energy integration, simultaneously achieving emission reduction targets and enhancing economic adaptability (Peng et al., 2022). The American experience, particularly post-industrial urban centers in the Rust Belt such as Detroit, exemplifies innovative public-private partnership (PPP) mechanisms in financing green infrastructure - an empirical validation of fiscal decentralization theories (LaFrombois et al., 2023). Conversely, China’s state-led suburbanization paradigm, manifested in Beijing’s strategic relocation of non-core urban functions, reveals unique institutional mechanisms for coordinating contraction management with regional development synergies. This distinctive approach provides valuable insights into spatial governance.
5 Conclusion
This study systematically investigates the spatio-temporal disparities of land use carbon LUCE in shrinking counties within the Beijing-Tianjin-Hebei (BTH) region from 2000 to 2020. By integrating population dynamics, land use transitions, and carbon accounting methodologies at the county level, two key contributions emerge:
(1) Contrary to the assumption that population decline inherently reduces environmental pressure, this study reveals that urban shrinkage paradoxically accelerates LUCE growth in peripheral counties. Continuous shrinkage counties exhibited the highest LUCE growth rates (14% in T2), driven by inefficient built-up area expansion and low land use efficiency. This challenges conventional wisdom and underscores the need for context-specific carbon governance frameworks.
(2) Distinct LUCE patterns were observed across shrinkage trajectories. Temporary shrinkage counties achieved the lowest per capita emission growth (3.2% in T2) through smart land use transitions, while potential shrinkage counties faced escalating emissions due to industrial relocation. These findings enrich the theoretical understanding of how shrinkage mechanisms interact with land use systems.
This research bridges critical gaps between urban shrinkage studies and low-carbon transition policies. By quantifying the LUCE effects of shrinkage trajectories, it provides a decision-making toolkit for policymakers to balance equity and efficiency in regional decarbonization. The methodological framework also advances the integration of demographic dynamics into land use carbon accounting, offering replicable insights for megacity regions globally facing similar shrinkage challenges.
Data availability statement
The datasets presented in this study can be found in online repositories. The names of the repository/repositories and accession number(s) can be found in the article/Supplementary Material.
Author contributions
JZ: Conceptualization, Methodology, Software, Visualization, Writing–original draft. LW: Supervision, Writing–review and editing, Validation. MF: Conceptualization, Funding acquisition, Supervision, Writing–review and editing. HW: Project administration, Writing–review and editing. SL: Investigation, Writing–review and editing.
Funding
The author(s) declare that financial support was received for the research, authorship, and/or publication of this article. This research was funded by the National Natural Science Foundation of China (Grant No. 41771204).
Acknowledgments
We are deeply indebted to the reviewers and the editor for their helpful comments and suggestions.
Conflict of interest
The authors declare that the research was conducted in the absence of any commercial or financial relationships that could be construed as a potential conflict of interest.
Generative AI statement
The author(s) declare that no Generative AI was used in the creation of this manuscript.
Publisher’s note
All claims expressed in this article are solely those of the authors and do not necessarily represent those of their affiliated organizations, or those of the publisher, the editors and the reviewers. Any product that may be evaluated in this article, or claim that may be made by its manufacturer, is not guaranteed or endorsed by the publisher.
References
Ali, L., Haase, A., and Heiland, S. (2020). Gentrification through green regeneration? Analyzing the interaction between inner-city green space development and neighborhood change in the context of regrowth: the case of lene-voigt-park in Leipzig, eastern Germany. Land 9, 24. doi:10.3390/land9010024
Artmann, M., Inostroza, L., and Fan, P. (2019). Urban sprawl, compact urban development and green cities. How much do we know, how much do we agree? Ecol. Indic. urban sprawl compact green cities – Indic. multi-scale multi-dimensional analysis 96, 3–9. doi:10.1016/j.ecolind.2018.10.059
Chen, D., Wu, Y., Lin, Z., and Xu, Z. (2022). County-level city shrinkage in China: representation, cause, and response. Land 11, 1845. doi:10.3390/land11101845
Chen, Y. (2024). Regional decline and structural changes in Northeast China: an exploratory space–time approach. Asia-Pac J. Reg. Sci. 8, 397–427. doi:10.1007/s41685-023-00328-0
Cui, X., Wei, X., Liu, W., Zhang, F., and Li, Z. (2019). Spatial and temporal analysis of carbon sources and sinks through land use/cover changes in the Beijing-Tianjin-Hebei urban agglomeration region. Phys. Chem. Earth, Parts A/B/C 110, 61–70. doi:10.1016/j.pce.2018.10.001
Du, W., Zhao, X., Zhao, Z., Chen, C., and Qian, D. (2022). Assessment and dynamic mechanisms of the land-use dominant morphology transition: a case study of Hainan Province, China. Environ. Monit. Assess. 194, 419. doi:10.1007/s10661-022-09988-5
Gao, W., Zhao, X., Li, J., Zhang, D., Rui, Y., Li, T., et al. (2022). Spatiotemporal pattern identification and driving mechanism of urban shrinkage in the yellow river basin from 2000 to 2020. Land 11, 1325. doi:10.3390/land11081325
Ge, X. J., and Liu, X. (2021). Urban land use efficiency under resource-based economic transformation-A case study of shanxi province. Land 10, 850. doi:10.3390/land10080850
Guan, D., He, X., and Hu, X. (2021). Quantitative identification and evolution trend simulation of shrinking cities at the county scale, China. Sustain. Cities Soc. 65, 102611. doi:10.1016/j.scs.2020.102611
Guo, F., Qu, X., Ma, Y., and Tong, L. (2021). Spatiotemporal pattern evolution and influencing factors of shrinking cities: evidence from China. Cities 119, 103391. doi:10.1016/j.cities.2021.103391
Häußermann, H., and Siebel, W. (1988). “Die Schrumpfende Stadt und die Stadtsoziologie,” in Soziologische stadtforschung. Editor J. Friedrichs (Wiesbaden: VS Verlag für Sozialwissenschaften), 78–94. doi:10.1007/978-3-322-83617-5_5
Herrmann, D. L., Schwarz, K., Shuster, W. D., Berland, A., Chaffin, B. C., Garmestani, A. S., et al. (2016). Ecology for the shrinking city. BioScience 66, 965–973. doi:10.1093/biosci/biw062
Hong, T., Huang, X., Zhang, X., and Deng, X. (2023). Correlation modelling between land surface temperatures and urban carbon emissions using multi-source remote sensing data: a case study. Phys. Chem. Earth, Parts A/B/C 132, 103489. doi:10.1016/j.pce.2023.103489
Hu, Y., Wang, Z., and Deng, T. (2021). Expansion in the shrinking cities: does place-based policy help to curb urban shrinkage in China? Cities 113, 103188. doi:10.1016/j.cities.2021.103188
Huang, B., Huang, J., Pontius, R. G., and Tu, Z. (2018). Comparison of Intensity Analysis and the land use dynamic degrees to measure land changes outside versus inside the coastal zone of Longhai, China. Ecol. Indic. 89, 336–347. doi:10.1016/j.ecolind.2017.12.057
IEA (2023). International Energy Agency. Available online at: https://www.iea.org/reports/world-energy-outlook-2023.
IPCC (2006). 2006 IPCC guidelines for national greenhouse Gas inventories — IPCC. Available online at: https://www.ipcc-nggip.iges.or.jp/public/2006gl/(Accessed April 3, 25).
Kang, H., Fu, M., Kang, H., Li, L., Dong, X., and Li, S. (2024). The impacts of urban population growth and shrinkage on the urban land use efficiency: a case study of the northeastern region of China. Land 13, 1532. doi:10.3390/land13091532
Kim, G., Newman, G., and Jiang, B. (2020). Urban regeneration: community engagement process for vacant land in declining cities. Cities 102, 102730. doi:10.1016/j.cities.2020.102730
LaFrombois, M. E. H. E., Park, Y., and Yurcaba, D. (2023). How US shrinking cities plan for change: comparing population projections and planning strategies in depopulating US cities. J. Plan. Educ. Res. 43, 81–93. doi:10.1177/0739456X19854121
Liu, X., Wang, M., Qiang, W., Wu, K., and Wang, X. (2020a). Urban form, shrinking cities, and residential carbon emissions: evidence from Chinese city-regions. Appl. Energy 261, 114409. doi:10.1016/j.apenergy.2019.114409
Liu, Z., Qi, W., Qi, H., and Liu, S. (2020b). The evolution of regional population decline and its driving factors at the county level in China from 1990 to 2015. Geogr. Res. 39, 1565–1579. doi:10.11821/dlyj020190599
Miljanović, D., Vuksanović-Macura, Z., and Doljak, D. (2023). Rethinking the spatial transformation of postsocialist cities: shrinking, sprawling or densifying. Cities 140, 104443. doi:10.1016/j.cities.2023.104443
National Bureau of Statistics of China (2023). China Statistical Yearbook. Availbale online at: https://www.stats.gov.cn/english/ (April 26, 2025).
Onodera, H., Delage, R., and Nakata, T. (2024). The role of regional renewable energy integration in electricity decarbonization—a case study of Japan. Appl. Energy 363, 123118. doi:10.1016/j.apenergy.2024.123118
Peng, W., Fan, Z., Duan, J., Gao, W., Wang, R., Liu, N., et al. (2022). Assessment of interactions between influencing factors on city shrinkage based on geographical detector: a case study in Kitakyushu, Japan. Cities 131, 103958. doi:10.1016/j.cities.2022.103958
Rong, T., Zhang, P., Li, G., Wang, Q., Zheng, H., Chang, Y., et al. (2023). Spatial correlation evolution and prediction scenario of land use carbon emissions in the Yellow River Basin. Ecol. Indic. 154, 110701. doi:10.1016/j.ecolind.2023.110701
Schwartz, E., Papuga, S. A., and Hwang, K. (2020). CO2 in the shrinking city: the role of vegetation phenology in carbon dynamics of post-industrial urban Detroit 2020, GC102–0007.
Song, H., Zhang, X., Zou, J., Gu, L., Li, Y., and Tang, J. (2023). A study on the value of carbon compensation in the Huai River basin based on land use from 2000 to 2020. Phys. Chem. Earth 132, 103490. doi:10.1016/j.pce.2023.103490
Sutradhar, U., Spearing, L., and Derrible, S. (2024). Depopulation and associated challenges for US cities by 2100. Nat. Cities 1, 51–61. doi:10.1038/s44284-023-00011-7
Tong, X., Guo, S., Duan, H., Duan, Z., Gao, C., and Chen, W. (2022a). Carbon-emission characteristics and influencing factors in growing and shrinking cities: evidence from 280 Chinese cities. Int. J. Environ. Res. Public Health 19, 2120. doi:10.3390/ijerph19042120
Tong, Y., Liu, W., Li, C., Rong, Y., Zhang, J., Yang, Y., et al. (2022b). County town shrinkage in China: identification, spatiotemporal variations and the heterogeneity of influencing factors. J. Rural Stud. 95, 350–361. doi:10.1016/j.jrurstud.2022.09.029
Wang, C., Zhan, J., Zhang, F., Liu, W., and Twumasi-Ankrah, M. J. (2021). Analysis of urban carbon balance based on land use dynamics in the Beijing-Tianjin-Hebei region, China. J. Clean. Prod. 281, 125138. doi:10.1016/j.jclepro.2020.125138
Wang, Z., Cao, C., Chen, J., and Wang, H. (2020). Does land finance contraction accelerate urban shrinkage? A study based on 84 key cities in China. J. Urban plann. Dev 146, 04020038. doi:10.1061/(ASCE)UP.1943-5444.0000613
Wolff, M., and Wiechmann, T. (2018). Urban growth and decline: Europe’s shrinking cities in a comparative perspective 1990–2010. Eur. Urban Regional Stud. 25, 122–139. doi:10.1177/0969776417694680
Wu, K., and Yao, C. (2021). Exploring the association between shrinking cities and the loss of external investment: an intercity network analysis. Cities 119, 103351. doi:10.1016/j.cities.2021.103351
Xiao, H., Duan, Z., Zhou, Y., Zhang, N., Shan, Y., Lin, X., et al. (2019). CO2 emission patterns in shrinking and growing cities: a case study of Northeast China and the Yangtze River Delta. Appl. Energy 251, 113384. doi:10.1016/j.apenergy.2019.113384
Xie, M., Feng, Z., and Li, C. (2022). How does population shrinkage affect economic resilience? A case study of resource-based cities in Northeast China. Sustainability 14, 3650. doi:10.3390/su14063650
Yan, H., Guo, X., Zhao, S., and Yang, H. (2022). Variation of net carbon emissions from land use change in the beijing-tianjin-hebei region during 1990–2020. Land 11, 997. doi:10.3390/land11070997
Yang, S., Yang, X., Gao, X., and Zhang, J. (2022). Spatial and temporal distribution characteristics of carbon emissions and their drivers in shrinking cities in China: empirical evidence based on the NPP/VIIRS nighttime lighting index. J. Environ. Manag. 322, 116082. doi:10.1016/j.jenvman.2022.116082
Yang, X., and Liu, X. (2023). Path analysis and mediating effects of influencing factors of land use carbon emissions in Chang-Zhu-Tan urban agglomeration. Technol. Forecast. Soc. Change 188, 122268. doi:10.1016/j.techfore.2022.122268
Zeng, T., Jin, H., Gang, X., Kang, Z., and Luan, J. (2022a). County economy, population, construction land, and carbon intensity in a shrinkage scenario. Sustainability 14, 10523. doi:10.3390/su141710523
Zeng, T., Jin, H., Geng, Z., Kang, Z., and Zhang, Z. (2022b). The effect of urban shrinkage on carbon dioxide emissions efficiency in Northeast China. IJERPH 19, 5772. doi:10.3390/ijerph19095772
Zhang, R., Tai, H., Cheng, K., Zhu, Y., and Hou, J. (2022). Carbon emission efficiency network formation mechanism and spatial correlation complexity analysis: taking the Yangtze River Economic Belt as an example. Sci. Total Environ. 841, 156719. doi:10.1016/j.scitotenv.2022.156719
Zhang, X., Brandt, M., Tong, X., Ciais, P., Yue, Y., Xiao, X., et al. (2022a). A large but transient carbon sink from urbanization and rural depopulation in China. Nat. Sustain 5, 321–328. doi:10.1038/s41893-021-00843-y
Zhang, X., Fan, H., Hou, H., Xu, C., Sun, L., Li, Q., et al. (2024). Spatiotemporal evolution and multi-scale coupling effects of land use carbon emissions and ecological environmental quality. Sci. Total Environ. 922, 171149. doi:10.1016/j.scitotenv.2024.171149
Zhang, Z., Hu, G., Mu, X., and Kong, L. (2022). From low carbon to carbon neutrality: a bibliometric analysis of the status, evolution and development trend. J. Environ. Manage. 322, 116087. doi:10.1016/j.jenvman.2022.116087
Zheng, Q., Seto, K. C., Zhou, Y., You, S., and Weng, Q. (2023). Nighttime light remote sensing for urban applications: progress, challenges, and prospects. ISPRS J. Photogrammetry Remote Sens. 202, 125–141. doi:10.1016/j.isprsjprs.2023.05.028
Zhou, Y., Chen, M., Tang, Z., and Mei, Z. (2021a). Urbanization, land use change, and carbon emissions: quantitative assessments for city-level carbon emissions in Beijing-Tianjin-Hebei region. Sustain. Cities Soc. 66, 102701. doi:10.1016/j.scs.2020.102701
Zhou, Y., Li, C., Zheng, W., Rong, Y., and Liu, W. (2021b). Identification of urban shrinkage using NPP-VIIRS nighttime light data at the county level in China. Cities 118, 103373. doi:10.1016/j.cities.2021.103373
Keywords: shrinking cities, carbon emissions, land use dynamics, counties, Beijing-Tianjin-Hebei
Citation: Zhang J, Wang L, Fu M, Wen H and Li S (2025) Accelerating land use carbon emissions in shrinking counties: a systematic analysis of land use dynamics in the Beijing-Tianjin-Hebei region, 2000–2020. Front. Environ. Sci. 13:1529622. doi: 10.3389/fenvs.2025.1529622
Received: 18 November 2024; Accepted: 06 March 2025;
Published: 09 May 2025.
Edited by:
Mariarosaria Lombardi, University of Foggia, ItalyCopyright © 2025 Zhang, Wang, Fu, Wen and Li. This is an open-access article distributed under the terms of the Creative Commons Attribution License (CC BY). The use, distribution or reproduction in other forums is permitted, provided the original author(s) and the copyright owner(s) are credited and that the original publication in this journal is cited, in accordance with accepted academic practice. No use, distribution or reproduction is permitted which does not comply with these terms.
*Correspondence: Meichen Fu, ZnVtZWljaGVuQGN1Z2IuZWR1LmNu