 Greyford Tembo
 Kawawa Banda
 Misheck Lesa Chundu
 Chisanga Lyoba
- Department of Geology, Integrated Water Resource Management Centre, School of Mines University of Zambia, Lusaka, Zambia
Wetlands are known to be one of the most productive and valuable ecosystems that provide important and diverse benefits to people around the world, contributing to provisioning, regulating, cultural and supporting services. However, very few studies have focused on the monetary value of provisioning ecosystem services and their contribution to household income. This paper aims to investigate the monetary value of provisioning services and their contribution to household income in the Bangweulu Wetland and surrounding areas, Zambia. A direct market valuation method was employed to quantify the products collected from the Bangweulu Wetland and surrounding areas and to assess their contribution to household income. Primary data, including household survey questionnaires, field observations, field measurements and key informant interviews, were employed. The research employed statistical techniques, including the estimation of mean frequencies, averages and the Pearson Chi-square test. Stratified random sampling was employed to sample 340 households in six districts. Also, purposive sampling was employed to sample seventeen key informants from government departments and traditional leaders. Major products collected include freshwater, crops, fish, woodfuel, grass, livestock rearing, reeds, papyrus, wild products and clay soil. However, freshwater had no significant monetary value and contributed minimally to household income. The Pearson Chi-square test showed that social factors such as gender, residential status, and house type significantly influenced the utilisation of various wetland resources, including crops, fish, woodfuel, reeds, papyrus and freshwater. In contrast, factors such as age, family size and employment level had no significant impact on resource utilisation. The gross monetary value of these services was estimated at US$ 11.7 million annually, the total cash income estimated at US$ 9.94 million and the total net monetary value estimated at US$ 10.5 million. Fishing and agriculture accounted for the largest contribution to household incomes (66.9% and 25.3%, respectively). These statistics underscore the critical role played by the Bangweulu Wetland in sustaining local livelihoods. Consequently, policymakers should carefully consider the economic value of the Bangweulu Wetland’s ecosystem services in their planning and as an integral part of potential poverty reduction strategies.
1 Introduction
Wetlands provide a wide of ecosystem services that include provisioning (fresh water, fish, forest products, folder, raw materials), regulating (flood protection, climate regulation, soil erosion control), cultural services (tourism, recreation, aesthetic appreciation, art) and supporting services (Soil formation and primary production) (Zhang et al., 2007; Damm et al., 2013; Ayeni et al., 2019). They are an important ecosystem that supports the interaction of humans, animals and plants through the provision of ecosystem services (Marambanyika, 2021). Despite covering only 1.5% of the earth’s surface, wetlands provide 40% of global ecosystem services that play a significant role in the local and global water cycle and are at the heart of the connection between water, food and energy (Zedler and Kercher, 2005; Damm et al., 2013). Despite the wide range of services to society and the economic value associated with wetlands, they are damaged and degraded and about 50% of the wetlands have disappeared globally in the last century (Das et al., 2015; Ajwang et al., 2016). According to the Ramsar Convention, wetlands are defined as “areas of marsh, fen, peatland or water, whether natural or artificial, permanent or temporary, with water that is static or flowing, fresh, brackish or salt, including areas of marine water the depth of which at low tide does not exceed 6 m (Ramsar, 2007).
The Convention on Wetlands also commonly known as the Ramsar Convention is a crucial intergovernmental treaty, with the mission of “Conservation and wise use of all wetlands through local, regional and national actions and international cooperation, as a contribution towards achieving sustainable development throughout the world (Ramsar, 2007). According to the above definition, wetlands are defined as the ecological transition zone between the terrestrial environment and the submerged environment where the tropical flora and fauna can develop (Dang et al., 2022). The concept of ecosystem services refers to the economic, social and ecological contribution that supports human wellbeing (De Groot et al., 2002). Thus, the identification of various ecosystem services and their utilizations is significant for sustainable management.
Provisioning ecosystem services provide a specific range of consumable products that include: building materials; raw materials; medicines; fish; and other materials for household utilisation (Millennium Ecosystem Assessment, 2005). However, they are the major driving force to livelihood sustenance especially in developing countries (Boafo et al., 2014). Furthermore, Provisioning services are prominent in terms of their utilisation especially in developing countries due to high poverty levels (Fagerholm et al., 2012). Despite the lack of proper policy guidance on wetland management, these provisioning ecosystem services hold high monetary value. According to Barbier et al. (1991) the goods and services provided by wetlands lack market value, leading to their degradation and negatively impacting the communities that rely on them for sustenance.
In Africa, wetlands are a vital source of water and nutrients essential for biological productivity and, in many cases, for the survival of local communities. They provide numerous goods and services that possess economic value not only for the local population but also for people residing beyond the wetland regions (Schuyt, 2005; Collings, 2009). However, there has been a loss or degradation of Southern African wetlands due to an increase in demand for land and water (Lannas and Turpie, 2009).
Few studies have been carried out to assess the contribution of provisioning ecosystem services to the household’s income (Adekola et al., 2007; Lannas and Turpie, 2009; Akwetaireho and Getzner, 2010; Zuze, 2013; Mahlatini et al., 2020) and the results indicate that these provisioning ecosystem services are crucial for sustaining household income. However, these studies did not highlight how socio-economic determinants influencing the utilization of provisioning ecosystem services. Thus, the current study in the Bangweulu Wetland and surrounding areas addresses the socio-economic determinants of provisioning ecosystem services. Adekola et al. (2007) observed that the provisioning ecosystem services generated from the Ga-Mampa wetland in South Africa were crucial for household subsistence and providing resources for gift-giving to neighbours and relatives. However, this study did not explore an intensive sampling strategy as it as a key factor in methodology. Thus, this paper aims to fill this gap by utilizing a more robust and generalizable methodology.
In the natural wetlands, both provisioning ecosystem and cultural services have generally declined over 20 years (Akwetaireho and Getzner, 2010), due to agricultural expansion and over-harvesting of papyrus biomass (Owino and Ryan, 2007). On the other hand, Banda et al. (2022) assessed the ecosystem services in the Zambezi Barotse Flood Plain in Zambia and found that socio-ecological factors leads to a general decline in ecosystem services. However, this study did not consider the actual number of products collected and their annual monetary contribution to households. Thus, the current study explored the monetary value of provisioning ecosystem services and household contribution in the Bangweulu Wetland and surrounding areas.
The economic value of provisioning ecosystem services has significant contribution to household income in rural communities. Zambia is a party of the Ramsar Convention. The Government of the Republic of Zambia ratified the convention on 28 December 1991 and designated Lochinvar, Blue Lagoon National Park and the Bangweulu Swamp at Chikuni as Ramsar sites (ECZ, 1998). Zambia’s wetlands cover about 14%–19% of the total land area of the country and contribute to economic development by supporting various economic sectors such as tourism, agriculture, fisheries, forestry and supporting livelihood communities (Ministry of Lands and Natural Resources, 2018). However, the monetary value of provisioning services and their contribution to household income remains unknown in most of Zambia’s wetlands. Furthermore, a direct market valuation method has not been thoroughly applied at wetland sub catchment level. Using this direct market valuation method, the economic value of the Bangweulu Wetland and surrounding areas was assessed to understand the economic value of the collected products and their contribution to household income. Consequently, the monetary value of provisioning services in the Bangweulu Wetland and surrounding areas is significant, as it aligns with Zambia’s Eighth National Development Plan (8NDP) and serves as a potential strategy for poverty reduction through community-based natural resources management and government engagements. Therefore, this study aimed at assessing the monetary value and contribution of provisioning ecosystem services on household income in Zambia’s Bangweulu Wetland using a direct market valuation method with the following specific objectives: to assess the key provisioning ecosystem services utilised; socio-economic determinants; and to estimate the economic value and its household contributions of key provisioning ecosystem services utilised from the Bangweulu Wetland. Furthermore, the study hypothesised that there was no statistically significant association between socio-economic factors and the types of products collected from the Bangweulu Wetland and surrounding areas.
2 Materials and methods
2.1 Description of the study area
The Bangweulu Wetland is located in the Luapula and Northern provinces of Zambia, with a small portion of the Central Province also covered as shown in Figure 1 (Chundu et al., 2024). It is a unique example of a complex of wetland types found in Central Southern Africa between 08° and 18° S and 22°–34° East longitudes. The area is significant for wildlife conservation, tourism and fishing for the local inhabitants (Huchzermeyer, 2012). The conservation area is situated in the transition zone between woodland, floodplain and swamp covering over 11,900 square Kilometres. The Bangweulu Wetland is fed primarily by the Chambeshi River, with several smaller rivers emptying into the swamps on the northern, eastern and southern margins (Chundu et al., 2024).
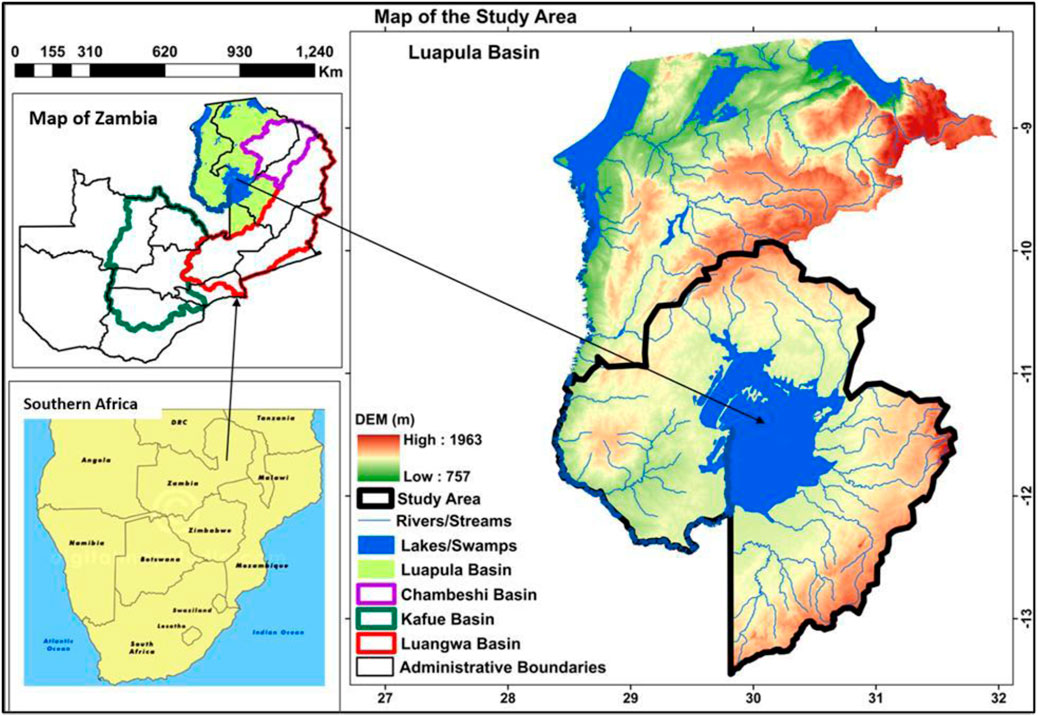
Figure 1. Map of Zambia showing the study area of Bangweulu Wetland and surrounding areas, Luapula River Basin, Zambia (Source: Chundu et al., 2024).
It is situated in a high rainfall belt in the Northern part of Zambia with three rainfall seasons: a cool dry season from May to August; a hot season from August to October; and a warm rain season from November to April (Kamweneshe, 2000). Mean annual rainfall varies between 1000 mm and 1500mm, with a gradient of increasing rainfall toward Lake Bangweulu and the climate over the entire system is homogenous. The entire Bangweulu Wetland is seasonally flooded especially during the rainy seasons. In January, the plains are inundated and the highest water level reached in March as a result of inflow from the catchment exceeding the capacity of the river channel. After the rains, the water gradually recedes, reaching the lowest level in October and November (Kamweneshe, 2000).
The Wetland is also located in a shallow depression, which is called the basin, in the centre of the ancient cratonic platform on the general plateau. The cratonic unit is mainly composed of quartzite, mudstone and acid meta-volcanic. Additionally, the geology of the area consists of alluvial sands and clays of the river valleys with a combination of Savannah and Swampy vegetation types. The soil in the organic topsoil is moderately acidic and becomes increasingly acidic with depth. The soil covering Bangweulu is mostly fine-textured, ranging from sandy clay, loam, and alluvium clay around the lakeshores, and has sandy and loamy soil on the highlands (Kamweneshe, 2000; Kunda, 2022).
The vegetation types in the Bangweulu Wetland are dominated by Julbernardia paniculata (Benth.) Troupin (Mutondo), Isoberlinia angolensis (Benth.) Hoyle and A.P.D. Jones (Mutobo), Brachystegia boehmii Taub. (Miombo) and Brachystegia bussei Harms (Mukongolo) (Kunda, 2022; Fanshawe, 1971; Storrs, 1995). However, the vegetation of the study area is a mosaic of different vegetation types. The vegetation in this area falls clearly into well-defined zones with the depth and duration of the flooding (Kamweneshe, 2000; Fanshawe, 1971; Storrs, 1995; Zambia Wildlife Authority, 2006). The Bangweulu Wetland consists of five distinct vegetation zones: the upper mainland woodlands; fringing open woodlands; termitaria and fringing grasslands; seasonal floodplain; and permanent swamps (Kamweneshe et al., 2003; Chundu et al., 2024).
Fisheries and wildlife sustain the economy of the area of the Bangweulu swamps. Fish mainly account for both substance and commercial types for livelihood income and rural economy. Little is known about the status of fish stock but it is reasonable that the fishery of Bangweulu has declined over time due to overfishing and the use of unsustainable fishing methods. In addition, fringing woodland is used for wood fuel, fibre and other domestic use (Kamweneshe, 2000; Storrs, 1995). The Bangweulu region is of considerable historical interest and has the potential to attract historians and scholars as well as vacationers. The Bemba-speaking ethnic groups include the Unga, Twa, Kabende, Ngambo, Ushi and Bisa (Gawler, 1998).
2.2 Research design
This study employed a mixed-methods approach by combining both qualitative and quantitative data to gain a comprehensive understanding of the research problem.
2.2.1 Sampling procedure
The sampling strategy was designed to target the population living around the Bangweulu Wetland and surrounding areas, including Chifunabuli (Chishi and Mbabala islands), Samfya, Serenje, Mansa, Chitambo and Chilubi districts, across fifteen villages, with a total of 16,328 households (Table 1). These districts were selected due to their proximity to the wetland, which is central to the study’s interest.
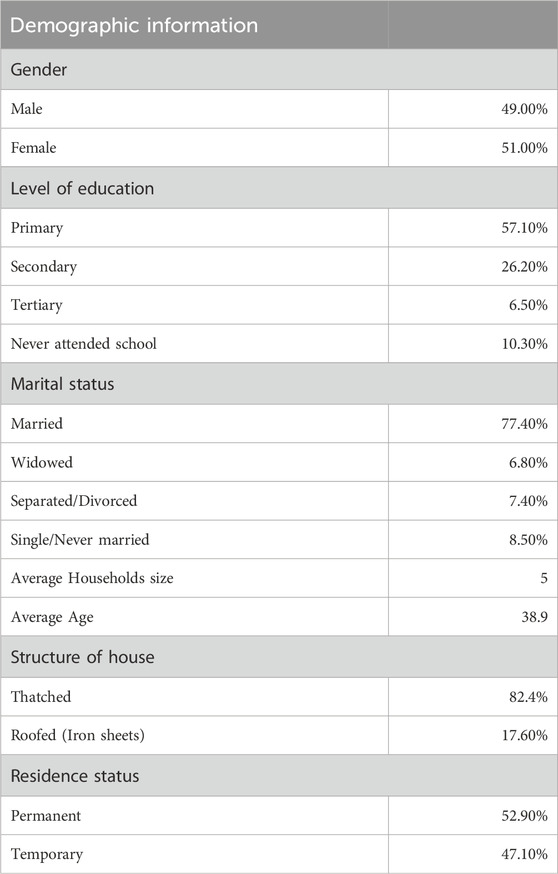
Table 1. Showing socio-economic characteristics of sampled households in the Bangweulu Wetland and the surrounding areas, Zambia.
2.2.2 Sample size calculation
The sample size was calculated as shown in Equation 1 (Islam, 2018).
Where:
N = Sample size.
P = Population proportion (0.5 was chosen to represent the maximum variability, ensuring that the sample size is large enough to be reliable within the given confidence interval (Cameron, 2011).
Z = Z-value from the standard normal distribution (1.96 for a 95% confidence level).
e = Margin of error (set at 10%).
Substituting the values into the formula:
Thus, the calculated sample size is 96. However, the final sample size was 340 households, which was larger than the calculated sample size. This was done to account for potential non-responses and ensure a more robust dataset.
2.3 Data collection
Primary data collection involved a mixed-method approach. The instruments used included household survey questionnaires, key informant interview guides, field observation and field measurement tools.
2.3.1 Households survey questionnaires
In the survey, a semi-structured questionnaire was administered through face-to-face interviews to collect information on demographic characteristics, the use and status of ecosystem services and the economic value of these services. This included data on the quantities of products harvested, associated costs, time spent collecting materials or products from the wetland and the market prices of various products.
To obtain the sample households for the study, stratified random sampling technique was employed. Using this strategy, it increased accuracy and provide realistic results. However, yet, it can be time-consuming and difficult when the population is heterogeneous and far spread (Lemeshow and Ferketich, 2020).
Using this method, the sample was proportionally divided among the six sampled districts to obtain the sample size for each village. Despite the differences in the number of households sampled per village, the selected sample size was considered representative and sufficient to capture the variability between the villages concerning values of provisioning ecosystem services. In total, 340 questionnaires were administered to heads of households using a lottery method (Singh and Masuku, 2014).
The questionnaire was originally prepared in English and individual questions were orally translated into the local language (Bemba) while being administered to respondents. The survey questionnaires were administered to the heads of households. In instances where the head of household was not present or refused to participate, another randomly selected household was used to replace that household (Bong et al., 2016).
2.3.2 Key informant interviews
Key informant interviews were conducted with government personnel in Ministry of Agriculture, Forestry departments, Fisheries and Livestock departments in all the districts. The main purpose of conducting key informant interviews was to complement the data collected from the household survey questionnaires. The key informants from the government departments also provided secondary data, whereas from traditional leaders provided the researcher with key resources utilised from the wetland, markets where harvested resources were sold, the status of the resources harvested and the total number of households in the villages.
A purposive sampling method was employed to select key informants from government institutions. In total seventeen key informant interviews were conducted through face-to-face interviews with participants in six districts. Purposive sampling is a non-probability strategy that has both advantages and disadvantages. The advantages include the following: Key informants may be chosen for convenience or based on recommendations from competent persons; they can also give accurate and robust data.
However, the disadvantages are as follows: the researcher exercises judgment on the informant’s reliability and competency; and informants may provide unreliable data voluntarily or involuntarily because they are eager to please, may have hidden purposes and intentions and have their own emotional issues, principles and viewpoints (Bernard, 2002; Dolores and Tongco, 2007).
2.3.3 Field observations
Field observations were conducted through transect walks to observe market prices of goods and services generated from Bangweulu Wetland and the surrounding areas. Additionally, field visits to forests, temporal and permanent fishing camps and agricultural lands accompanied by at least one local person, were undertaken to gain adequate knowledge of the source where the products were collected, land use and the status of ecosystem services.
2.3.4 Field measurements
Field measurement was conducted to collect coordinates from households and determine the weight of products gathered from the wetland, such as fish, using a 50-kg measuring scale. Furthermore, 20-m measuring tapes were employed to measure the average length and diameter of wood products in a bundle sold in the market.
2.3.5 Valuation of wetland provisioning ecosystem services
The prevailing local market price of wetland provisioning ecosystem services was used to estimate the economic value of the products collected from the Bangweulu Wetland and surrounding areas. Three indicators have been used to estimate the monetary value of each provisioning service identified, utilised and sold at the market. These include Gross Monetary Value (GMV), Net Monetary Value (NMV) and Cash Income (CI). Values were expressed in Zambian Kwacha (ZMW) and then converted to United States American Dollars (USD). The average exchange rate from September 2022 to April 2023 was computed, US$1 = ZMW 17.02 from the free currency rate (FCR).
where TQH is the total annual product harvested and P is the average price per unit of product at which a commodity was sold at the market of a particular year.
TQH is computed from the average annual quantity collected per household multiplied by the Percentage of Participating Households (PPH) and the total number of households residing in the buffer zone (villages where research was conducted) is indicated by N.
where
N = total number of households in the buffer zones (Villages where research was conducted).
The expected total number of households participating in the activities was calculated as shown in Equation 3.
where IC = Input Cost. Costs are estimated based on all monetary inputs going into the harvesting and use of each good/service of the products collected and sold as shown in Equation 4.
where QSD is the total quantity of products sold and it is calculated as shown by Equation 5.
The total economic value of the direct benefits of provisioning ecosystem services was calculated by summing up the individual goods and services from gross monetary value estimation as shown in Equation 2 (adapted from Adekola et al., 2008).
3 Results
3.1 Socio-economic characteristics of the households
The distribution of household gender in the Bangweulu Wetland and surrounding areas shows that 51.0% (n = 173) were females and 49.0% (n = 167) were males who utilised products obtained from the Bangweulu Wetland and the surrounding areas. The average household size was 5.0 members, with an average age of 38.9 years. The level of education attended by the respondents was as follows: 57.1% attended primary school; 26.2% attended secondary school; 6.5% attended tertiary education; and 10.3% had never attended any school. Furthermore, 77.4% of the respondents indicated that they were married, 6.8% were widowed, 7.4% were separated, and 8.5% were single. The results further revealed that most respondents lived in thatched house structures (82.4%), while only 17.6% of respondents lived in roofed structure houses. Finally, 52.9% of the respondents indicated that they resided in the community permanently, while 47.1% indicated that they resided in the community temporarily (Table 2).
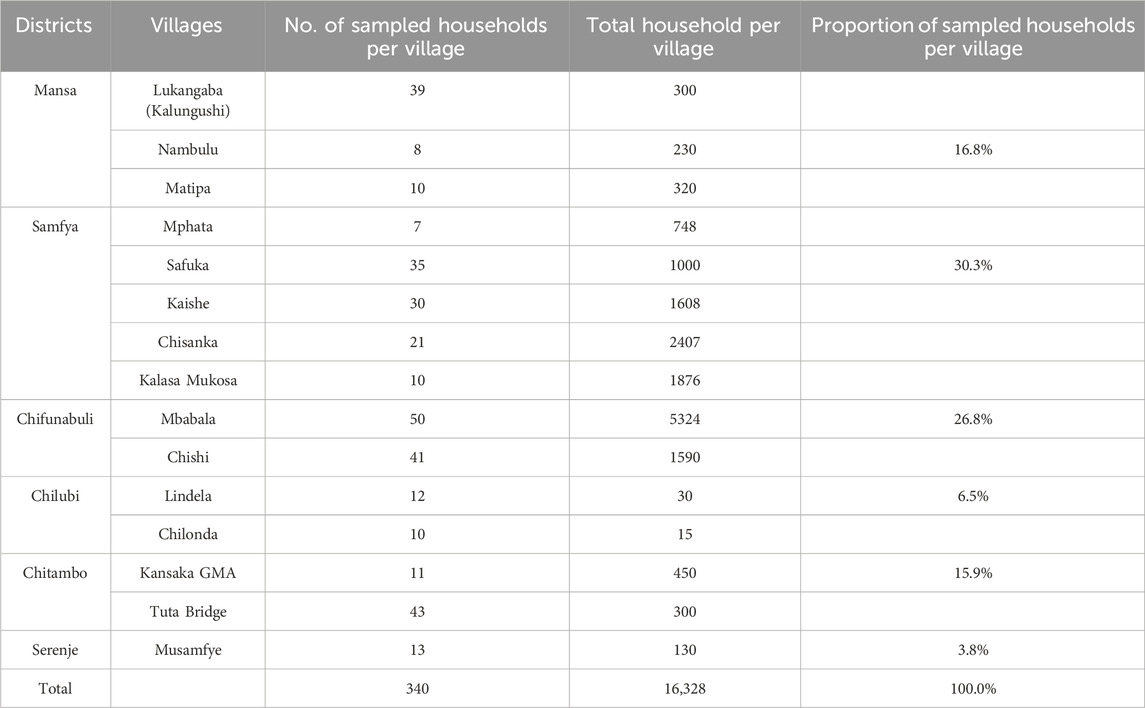
Table 2. Showing the names of the districts and their sampled villages, total households per village and proportion per district in the Bangweulu Wetland and surrounding areas from Key informants.
3.2 The use of provisioning ecosystem services in the bangweulu wetland and the surrounding areas
The major products collected from the Bangweulu Wetland and surrounding areas include fresh water (21.3%), crops (19.1%), fish (15.4%), woodfuel (11.6%), grass (10.6%), livestock (9.0%), wild resources (4.0%), reeds (3.5%), papyrus (3.3%) and clay (2.2%) (Figure 2).
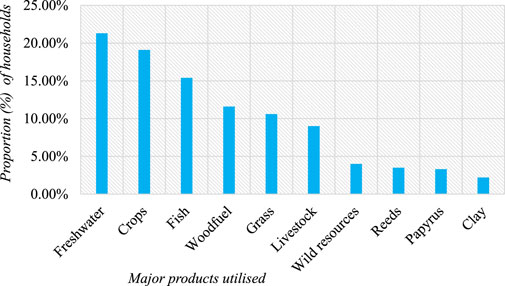
Figure 2. Showing major provisioning ecosystem services utilised in Bangweulu Wetland and surrounding areas.
Thus, these products collected from the Bangweulu Wetland and surrounding areas were utilised for household consumption and also sold in markets for cash income, which holds substantial monetary value. Conversely, fresh water, being public goods, do not possess significant market value and cannot be sold in markets. Wild resources such as clay, reeds and papyrus exert minimal monetary value (Figure 3).
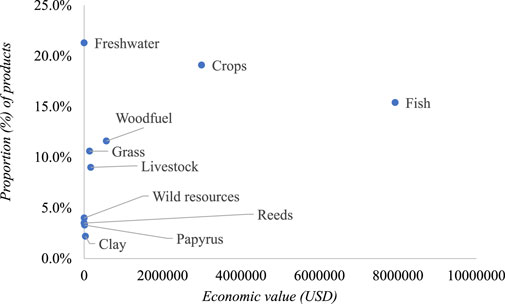
Figure 3. Economic Value of provisioning ecosystem services and percentage of respondents in the Bangweulu Wetland and surrounding areas, Zambia.
The association between socio-economic factors, such as age, marital status, education, gender, residential status, house type, employment status, family size and the products collected from the Bangweulu Wetland and surrounding areas was performed in a crosstab using Pearson’s Chi-square test (Table 3). The results showed that there was statistical evidence of the association between crops utilised and residential status and house type
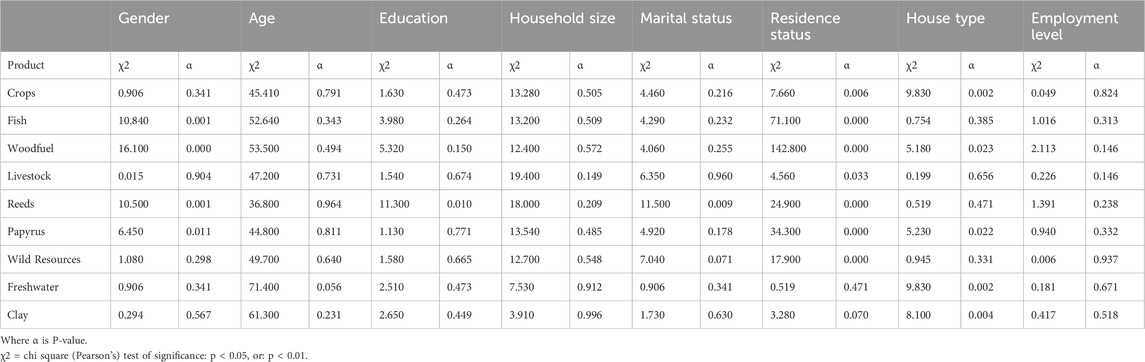
Table 3. Relationships between socio-economic factors and the products collected from the Bangweulu Wetland and surrounding areas, Zambia.
3.3 Economic value of different provisioning ecosystem services in bangweulu wetland and surrounding areas
3.3.1 Economic value of crops production
The major crops grown in the terrestrial environment surrounding the Bangweulu Wetland that have significant value to rural households through income generation were maize, cassava, sweet potatoes, groundnuts, soya beans and mixed beans. The estimated annual quantities of harvested crops were 15,570,983.5 kg, of which 12,092,652.8 kg of crops were sold, representing 77.7% of the total quantity sold. The average unit price for crops was estimated to be ZMW 3.3 per kg (US$ 0.19 per kg). The annual gross monetary value of crops was estimated to be US$3.0 million; cash income was estimated to be US$ 2.3 million and net monetary value was US$ 1.7 million (Table 4). Twenty-five-point three percent of the total proportion indicates the total value of provisioning ecosystem services generated from crop production in the Bangweulu Wetland and surrounding areas, Luapula River Basin, Zambia. Thus, 23.4% represents the cash income generated from crop production, highlighting its contribution to household income in the Bangweulu Wetland and surrounding areas, Zambia (Figure 4).
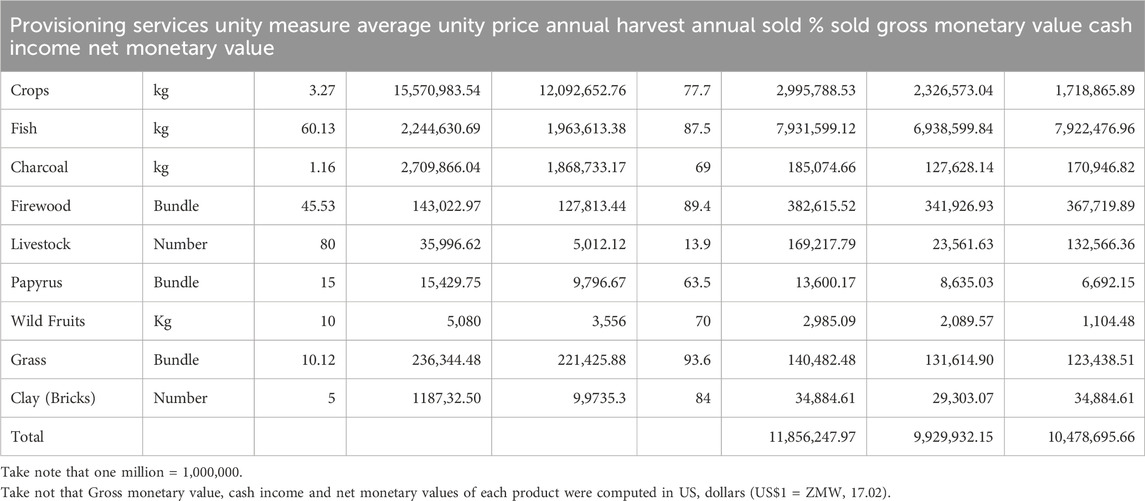
Table 4. Showing the average unity price, total annual harvest, total annual quantity sold, percentage sold from each product and total gross monetary value, cash income and net monetary value from each product collected from Bangweulu Wetland and surrounding areas.
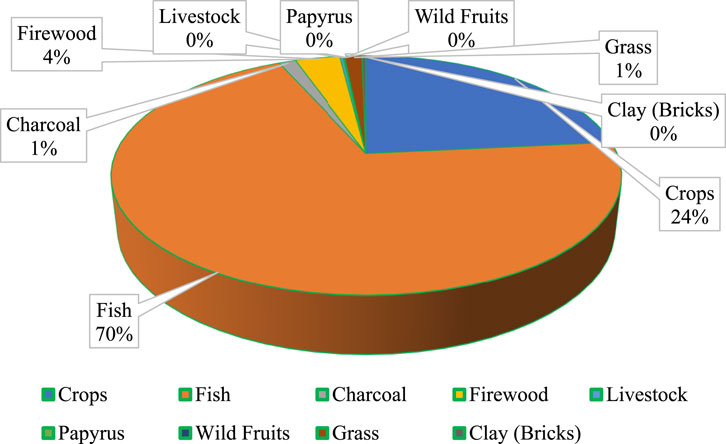
Figure 4. Showing the contribution of provisioning ecosystem services to household income.
3.3.2 Economic value of fishing
Small-scale fishing is an important source of income derived from the Bangweulu Wetland and surrounding areas. The estimated total quantity of fish harvested was 2,244,630.7 kg and the annual quantity sold was 1,963,613.4 kg, representing 87.5% of the total quantity of fish sold. The average price per kilogram was estimated to be ZMW 60.1 (equivalent to US$3.5 per kilogram). The gross monetary value generated from small-scale fishing was US$7.93 million, whereas the cash income generated from small-scale fishing amounted to US$6.9 million. Additionally, the net monetary value generated from small-scale fishing was US$7.92 million (Table 4). Sixty-six-point nine percent of the total proportion indicated the total value of the provisioning ecosystem services generated from fishing activities in the Bangweulu Wetland and surrounding areas. Thus, 69.9% represents the cash income calculated from fishing activities, highlighting its major contribution to household income in the Bangweulu Wetland and surrounding areas (Figure 4). Therefore, the results indicate that fish have significant value to the people living in the Bangweulu Wetland and surrounding areas.
3.3.3 Economic value of woodfuel (charcoal and firewood)
Charcoal production and firewood collection from the forests play a significant role in contributing to household income and serve as a source of energy. The total quantity harvested in bags was estimated to be 2,709,866.0 kg and the total quantity sold was estimated to be 1,868,733.2 kg, representing 69% of the quantity of charcoal sold, whereas, the estimated total number of bundles harvested for firewood was 143,023.0 and the annual quantity sold was 127,813.4 bundles, representing 89.4%. The average unit price per bundle was estimated to be K45.5 (equivalent to US$2.7 per bundle). The average unit price for charcoal was K1.2 per kg (equivalent to US$0.07 per kg). The gross monetary value generated from charcoal production was US$ 0.19 million whereas firewood collection yielded a gross monetary value of US$ 0.38 million. The cash income generate from charcoal production was US$ 0.13 million whereas firewood collection generated a cash income of US$ 0.34 million. Thus, the net monetary value derived from charcoal production was US$ 0.17 million whereas firewood collection generated a net monetary value of US$ 0.37 million (Table 4). One point six percent of the total proportion indicated that the total value of the total provisioning ecosystem services was generated from the collection of charcoal whereas firewood generated a total gross value of 3.2% in the Bangweulu Wetland and surrounding areas. The results further revealed that 1.3% of cash income contribute to household income from charcoal products whereas the 3.4% of cash income contribute to the collection of firewood in the Bangweulu Wetland and the surrounding areas for household income (Figure 4).
3.3.4 Economic value of livestock rearing
Households mostly own livestock such as chickens, ducks, goats, pigs, birds and a small portion of cattle for consumption and partly for sale. The livestock had an estimated annual quantity owned of 35,996.6, whereas the quantity sold was 5,012.1, representing 13.9% of the total number of livestock sold. The average unit price for livestock was K80 per livestock (equivalent to US$4.7 per livestock). The total gross monetary value generated from the livestock was US$ 0.17 million and the cash income generated from selling the livestock was US$ 0.02 million and net monetary value was estimated to be US$ 0.13 million (Table 4). One point four percent represent value of the total provisioning ecosystem services generated from livestock in the Bangweulu Wetland and surrounding areas. Finally, the total proportion of cash income generated from livestock was 0.24%, indicating that their monetary contribution to household income was very minimal in Bangweulu Wetland and surrounding areas (Figure 4). Therefore, these results showed that livestock adds value to the people living in the Bangweulu Wetland and surrounding areas through the income generated from livestock.
3.3.5 Economic value of papyrus
Papyrus plays a significant role in thatching, basket weaving and roofing temporary houses in swampy environments. The annual quantities collected for papyrus were estimated to be 15,429.8 bundles and the quantity sold was estimated to be 9,796.7 bundles, representing 63.5% of the total quantity sold. The average unit price per bundle was estimated to be K15 (equivalent to US$0.88 per bundle). The gross monetary value generated from papyrus mats was US$ 0.01 million, whereas the cash income collected from selling papyrus mats amounted to US$ 0.009 million. The net monetary value generated was US$ 0.007 million (Table 4). Zero-point one percent of the total proportion indicates the total value of the provisioning ecosystem services generated from papyrus collections in the Bangweulu Wetland and surrounding areas. Thus, the total proportion of cash income generated from papyrus was 0.09%, highlighting its minimal contribution to household income in the Bangweulu Wetland and surrounding areas (Figure 4). Therefore, these results demonstrate that the collection of papyrus adds value to the people living in the Bangweulu Wetland and surrounding areas through the income generated from selling papyrus mats.
3.3.6 Economic value of wild fruits
Wild fruits serve as a source of food and contribute to household income in the Bangweulu Wetland and surrounding areas. The annual quantity harvested was 5,080 kg, whereas the quantity sold was 3,556 kg, representing 70% of the total quantities sold. The average unit price estimated was K10 (equivalent to US$0.59). The gross monetary value generated from wild fruits was US$ 0.003 million and the cash income collected from selling wild fruits amounted to US$ 0.002 million. The estimated net monetary value was US$ 0.001 million (Table 4). The total proportion of provisioning ecosystem services generated for wild fruits was 0.03% and the cash income generated from wild fruits was 0.02%, indicating that their monetary contribution to household income was very minimal (Figure 4).
3.3.7 The economic value of thatched grass
Thatched grass collection is significant not only for thatching but also contributes to household income in the Bangweulu Wetland and surrounding areas. The estimated annual quantity harvested was 236,344.5 bundles and the annual quantity sold was 221,425.9 bundles, representing 93.6% of the quantity sold. The average unit price for grass per bundle was estimated as K10.1 (equivalent to US$0.59 per bundle). The gross monetary value generated from the collection of thatched grass was estimated to be US$ 0.14 million, the cash income received after selling thatched grass was estimated to be US$ 0.13 million and the net monetary value was estimated to be US$ 0.12 million (Table 4). One point two percent from the total proportion indicated the total value of the total provisioning ecosystem services generated from grass collections in the Bangweulu Wetland and surrounding areas. Thus, the total proportion of cash income generated from thatched grass was 1.3%, indicating that their monetary contribution to household income was very minimal (Figure 4).
3.3.8 The economic value of clay soil (bricks)
Pounded bricks made from clay soil contribute to household income in the terrestrial environment of Bangweulu Wetland. The annual quantity of bricks made from clay soil was estimated to be 118,732.5 and the annual quantity sold was 99,735.3, representing 84% of the total number of bricks sold. The average unit price per brick was estimated to be K5 (equivalent to US$0.29 per brick). The gross monetary value generated from clay bricks was US$ 0.03 million, the cash income generated was US$ 0.035 million and the net monetary value was estimated to be US$ 0.0350 million (Table 4). Zero-point three percent from the total proportion indicated the total value of the total provisioning ecosystem services generated from clay soil (brick production) in the Bangweulu Wetland and surrounding areas. Thus, the total proportion of cash income generated from clay soil (brick production) was 0.3%, indicating monetary contribution to household income. Therefore, the contribution of clay soil is small to the household income of people living around the Bangweulu Wetland and surrounding areas, Zambia (Figure 4).
4 Discussions
4.1 The major provisioning ecosystem services and their socio-economic influence
The current study indicates that freshwater is the major product collected from the Bangweulu Wetland and surrounding areas. Similar results were found in the Barotse Floodplain in Zambia, a case study on the status of ecosystem services in the Zambezi Floodplain. In Uganda, a case study from Mabamba Bay Wetland, Lake Victoria, also identified freshwater as the major provisioning ecosystem service utilised by households. (Banda et al., 2022; Akwetaireho and Getzner, 2010). These results were inconsistent with the findings of Mahlatini et al. (2020), of the Songore Wetland, Zimbabwe, crop productions were identified as the major provisioning ecosystem services. Thus, this could be attributed that freshwater is easily acquired by most households due to proximity to Bangweulu Wetland for various uses.
In the current study, the socio-economic factors such as gender, residential status and house type showed significant relationships on the utilisation of products corrected from the Bangweulu Wetland. The current study did not agree of what Boafo et al. (2014) found in rural communities in Ghana that marital status has a greater significance on the correction of provisioning ecosystem services products. Thus, the differences could be attributed to the facts that the products collected are influenced by a specific socio-economic factor.
4.2 The monetary value of the major provisioning ecosystem services in bangweulu wetland and surrounding areas
This study reaffirmed the economic significance of the major provisioning ecosystem services in the Bangweulu Wetland and the surrounding areas by employing market price valuation techniques. The major contribution to the household income and the rural economy was fishing in the wetlands. However, the findings from the current study were inconsistence with what previous studies observed by Adekola et al. (2012), Mahlatini et al. (2020) and (Chowdhury and Behera, 2021) in the Ga-Mampa Wetland in South Africa, the Songore Wetland in Zimbabwe and West Bengal in India, who noted that the growing of crops yielded a high monetary value generated from crop cultivation annually. This attributed to the fact that most households in Bangweulu Wetland entirely depend on fishing activities as a source of income. The present study also confirmed the findings of Zuze (2013), Ayeni et al. (2019) who noted that fish had the highest contribution of cash income and gross monetary value of the Lake Chiuta Wetland in Malawi and the Nguru Wetland in Nigeria, respectively. The findings of Ajwang et al. (2016) in the Kano Floodplain in Kenya, revealed that the major provisioning ecosystem service with the highest cash income generated was Papyrus (Cyperus papyrus), unlike the findings from the current study which noted that this resource had little contribution to household income in the Bangweulu Wetland and surrounding areas. The possible explanation could be that the low demand for papyrus products contributed to the low household income. The gross monetary value of provisioning ecosystem services in the Bangweulu Wetland and surrounding areas, Luapula River Basin, Zambia estimated were considerably higher than the value estimated by Mahlatini et al. (2020) in Songore Wetland in Zimbabwe and Adekola et al. (2007) in Ga-Mampa Wetland in South Africa but smaller than Zuze (2013) in Lake Chihuta Malawi annually. The variations in monetary values could be attributed to the extent of the wetlands, as well as socio-economic characteristics of beneficiaries of ecosystem services. This is reaffirmed by what Collings (2009) found in Mfolozi Floodplain, Lake St Lucia, South Africa that there was variation in the economic values generated from one wetland to another. Therefore, the value of provisioning of ecosystem services should be seen as an integral part of any poverty reduction strategies in the Bangweulu Wetland and surrounding areas, Zambia.
4.3 Limitations
1. The market valuation methods applied in this study are limited to products consumed directly from the wetlands. Thus, this method is only applicable to products that can be consumed directly and traded at the market. Therefore, other ecosystem services were not evaluated using this method.
2. Since this study relied on a socio-economic survey, the products collected and sold at the market were extrapolated to estimate the economic value of those collected from the Bangweulu Wetland and its surrounding areas. However, the time available was insufficient to capture a full annual period and calculate the actual economic value of the products collected from the Bangweulu Wetland and surrounding areas.
3. The valuation relies heavily on current market prices, which are subject to fluctuations due to economic or environmental changes. This may limit the long-term accuracy of the monetary estimates.
4. The market valuation method is vulnerable to errors, as it relied on self-reporting by respondents who could either overestimate or underestimate the amount of products harvested and sold at the market to estimate the economic value of ecosystem goods and services. However, the market prices of the products vary seasonally and depending on where they are sold. This study, however, did not take into account factors such as consumer suppliers, taxation and the broader market structure, as many of these products are public goods.
5. The results of this study are context-specific to the Bangweulu Wetland. However, factors such as hydrology, ecological zones, and the condition of the wetlands should be taken into account when extending these findings to other regions. Ideally, benefit transfer approaches are suitable for comparative studies, as they can be adjusted to reflect local conditions.
4.4 Strengths of the study
1. The study addresses a clear and significant research gap: quantifying the monetary value of provisioning ecosystem services and evaluating their contribution to household income, an aspect often underrepresented in ecological economics.
2. The direct market valuation is appropriate for estimating provisioning services that have identifiable market prices (e.g., fish, crops, wood fuel), making the valuation more concrete and policy-relevant.
3. The use of Pearson Chi-square tests to analyses how social factors influence resource utilization adds rigor and reveals socio-demographic patterns of wetland resource use.
4. By quantifying values and linking them to poverty reduction strategies, the study makes a strong case for integrating ecosystem services into development planning.
5 Conclusion and recommendation
This paper aimed to investigate the monetary value of provisioning services and their contribution to household income in the Bangweulu Wetland and the surrounding areas, Zambia. The major products collected included freshwater, crops, fish, woodfuel, grass, livestock, reeds, papyrus, wild products and clay soil. It was found that freshwater had no significant monetary value and contributed to household income in the Bangweulu Wetland and surrounding areas. The Pearson Chi-square test revealed that social factors such as gender, residential status and house type significantly influenced the utilisation of various wetland resources, including crops, fish, woodfuel, reeds, papyrus and freshwater. In contrast, factors such as age, family size and employment level showed no significant impact on resource utilisation. The total economic value of these services was estimated at US$ 11.7 million annually, with total cash income estimated at US$ 9.94 million and total net monetary value estimated at US$ 10.5 million. Fishing and agriculture accounted for the largest shares (66.9% and 25.3%, respectively). These figures underscore the critical role that the Bangweulu Wetland plays in supporting local livelihoods. Thus, the value of provisioning ecosystem services should be considered an integral part of any poverty reduction strategies for the Bangweulu Wetland and surrounding areas. Therefore, Government institutions, civil society and academia should incorporate natural resource economics plans to facilitate training to the communities so that they are aware of the value of natural resources from the economic perspective. Apart from that, the government, through the Ministry of Tourism and Arts, should encourage private investment and community participation in tourism in the Bangweulu Wetland and surrounding areas.
Data availability statement
The raw data supporting the conclusions of this article will be made available by the authors, without undue reservation.
Ethics statement
The studies involving humans were approved by The University of Zambia Natural and Applied Sciences Research Ethics Committee approved this study. The studies were conducted in accordance with the local legislation and institutional requirements. The participants provided their written informed consent to participate in this study.
Author contributions
GT: Conceptualization, Data curation, Formal Analysis, Methodology, Software, Writing – original draft, Writing – review and editing. KB: Conceptualization, Funding acquisition, Project administration, Resources, Software, Supervision, Writing – review and editing. MC: Conceptualization, Data curation, Writing – review and editing. CL: Data curation, Writing – review and editing. HS: Conceptualization, Funding acquisition, Project administration, Resources, Supervision, Writing – review and editing. IN: Conceptualization, Funding acquisition, Project administration, Resources, Supervision, Writing – review and editing.
Funding
The author(s) declare that financial support was received for the research and/or publication of this article. This study was made possible by funding from the Oliver Tambo Africa Research Chair Initiative (ORTARCHi) Fellowship implemented at the University of Zambia.
Conflict of interest
The authors declare that the research was conducted in the absence of any commercial or financial relationships that could be construed as a potential conflict of interest.
Generative AI statement
The author(s) declare that no Generative AI was used in the creation of this manuscript.
Any alternative text (alt text) provided alongside figures in this article has been generated by Frontiers with the support of artificial intelligence and reasonable efforts have been made to ensure accuracy, including review by the authors wherever possible. If you identify any issues, please contact us.
Publisher’s note
All claims expressed in this article are solely those of the authors and do not necessarily represent those of their affiliated organizations, or those of the publisher, the editors and the reviewers. Any product that may be evaluated in this article, or claim that may be made by its manufacturer, is not guaranteed or endorsed by the publisher.
References
Adekola, O., Morardet, S., Grelot, F., and de Groot, R. (2007). Economic value of provisioning services and livelihood dependence on the Ga-Mampe wetland, South Africa. 13th IWRA World Water Congr. January, 1–32.
Adekola, O., Morardet, S., de Groot, R., and Grelot, F. (2008). “The economic and livelihood value of provisioning services of the Ga-Mampa wetland, South Africa,” in Presented at the 13th IWRA world water congress, September, montpellier, France, 24p. HAL archive ID: ffhal-00468552f.
Adekola, O., Morardet, S., de Groot, R., and Grelot, F. (2012). Contribution of provisioning services of the Ga-Mampa wetland, South Africa, to local livelihoods. Int. J. Biodivers. Sci. Ecosyst. Serv. Manag. 8 (3), 248–264. doi:10.1080/21513732.2012.671191
Ajwang, R., Kitaka, N., and Oduor, S. O. (2016). Assessment of provisioning and cultural ecosystem services in natural wetlands and rice fields in Kano Floodplain, Kenya. Ecosyst. Serv. 21, 166–173. doi:10.1016/j.ecoser.2016.08.008
Akwetaireho, S., and Getzner, M. (2010). Livelihood dependence on ecosystem services of local residents: a case study from mabamba Bay wetlands (Lake Victoria, Uganda). Int. J. Biodivers. Sci. Ecosyst. Serv. and Manag. 6 (1–2), 75–87. doi:10.1080/21513732.2010.521139
Ayeni, A. O., Ogunsesan, A. A., and Adekola, O. A. (2019). Provisioning ecosystem services provided by the Hadejia Nguru Wetlands, Nigeria – current status and future priorities. Sci. Afr. 5, e00124. doi:10.1016/j.sciaf.2019.e00124
Banda, M. A., Banda, K., Sakala, E. M. C., and Nyambe, A. I. (2022). Assessment of the wetland ecosystem services status and their uses in the barotse flood Plain of Zambezi Sub Basin, Zambia. J. Food Technol. and Nutr. Sci. 4 (1), 1–11. doi:10.47363/jftns/2022(3)137
Barbier, E., Adams, W., and Kimmage, K. (1991). Economic valuation of wetland benefits: the Hadejia-Jama'are Floodplain, Nigeria. Lond. Environ. Econ. Cent. 45p.
Bernard, H. R. (2002). Research Methods in Anthropology: Qualitative and quantitative methods. 3rd Edn. Walnut Creek, California: AltaMira Press.
Boafo, Y. A., Saito, O., Jasaw, G. S., Otsuki, K., and Takeuchi, K. (2014). Provisioning ecosystem services-sharing as a coping and adaptation strategy among rural communities in Ghana’s semi-arid ecosystem. Ecosyst. Serv. 19, 92–102. doi:10.1016/j.ecoser.2016.05.002
Bong, I. W., Felker, M. E., and Maryudi, A. (2016). How are local people driving and affected by forest cover change? Opportunities for local participation in REDD+ measurement, reporting and verification. PLoS ONE 11 (11), e0145330. doi:10.1371/journal.pone.0145330
Cameron, E. (2011). On the estimation of confidence intervals for binomial population proportions in astronomy: the simplicity and superiority of the Bayesian approach. Publ. Astron. Soc. Aust. 28 (2), 128–139.
Chowdhury, K., and Behera, B. (2021). Economic significance of provisioning ecosystem services of traditional water bodies: empirical evidences from West Bengal, India. Econ. significance provisioning Ecosyst. Serv. traditional water bodies Empir. evidences West Bengal, India. Resour. Environ. Sustain. 5, 100033. doi:10.1016/j.resenv.2021.100033
Chundu, M. L., Banda, K., Lyoba, C., Tembo, G., Sichingabula, H. M., and Nyambe, I. A. (2024). Modeling land use/land cover changes using quad hybrid machine learning model in bangweulu wetland and surrounding areas, Zambia. Environ. Challenges 14 (October 2023), 100866. doi:10.1016/j.envc.2024.100866
Collings, S. L. (2009). “Economic consequences of ecological change: restoration options for the mfolozi floodplain and implications for Lake St lucia, South Africa,” in A thesis submitted in fulfilment of the requirements for the degree of master of science of. Grahamstown, South Africa: Rhodes University, 98. doi:10.22004/ag.econ.31729
Damm, C., Zedler, J. B., and Kercher, S. (2013). Wetland ecosystem services. Reference Module Earth Syst. Environ. Sci. 30, 39–74. doi:10.1016/b978-0-12-819166-8.00154-7
Dang, K. B., Phan, T. T. H., Nguyen, T. T., Pham, T. P. N., Nguyen, M. H., Dang, V. B., et al. (2022). Economic valuation of wetland ecosystem services in the northeastern part of Vietnam. Les Ulis, France: EDP Sciences. Knowl. Manag. Aquat. Ecosyst. (423), 114. doi:10.1051/kmae/2022010
Das, S., Behera, B., and Mishra, A. (2015). Determinants of household use of wetland resources in West Bengal, India. Wetl. Ecol. Manag. 23 (5), 803–816. doi:10.1007/s11273-0159420-8
De Groot, R. S., Wilson, M. A., and Boumans, R. M. J. (2002). A typology for the classification, description and valuation of ecosystem functions, goods and services. Ecol. Econ. 41 (3), 393–408. doi:10.1016/S0921-8009(02)00089-7
Dolores, M., and Tongco, C. (2007). Definition of purposive sampling. J. Plants Peop. Appl. Res. 5, 12.
Environmental Council of Zambia (ECZ) (1998). National Report by Environmental Council of Zambia and Environmental Protection Agency. Lusaka, 40p.
Fagerholm, N., Käyhkö, N., Ndumbaro, F., and Khamis, M. (2012). Community stakeholders’ knowledge in landscape assessments – mapping indicators for landscape services. Ecol. Indic. 18, 421–433. doi:10.1016/j.ecolind.2011.12.004
Fanshawe, D. (1971). The vegetation of Zambia. Lusaka, Zambia: Government Printer. Available online at: https://www.worldcat.org/title/vegetation-of-zambia/oclc/1323510.
Gawler, M. (1998). Best practices in participatory strategies for wise use of wetlands. Gland, Switzerland: The World Conservation Union. doi:10.2139/ssrn.2589447
Huchzermeyer, C. F. (2012). Fish and fisheries of bangweulu wetland, Zambia. Priv. Bag. 1015 Grahamst. 6140, 181.
Islam, M. R. (2018). Sample size and its role in Central Limit Theorem (CLT). Int. J. Phys. Math. doi:10.31295/pm.v1n1.42
Kamweneshe, B. M. (2000). Ecological, Conservation and Management of the Bangweulu Basin, Zambia. Pretoria South Africa: Master’s thesis, University of Pretoria, 169p.
Kamweneshe, B., Beilfuss, R., and Morrison, K. (2003). Population and distribution of wattled cranes and other large waterbirds and large mammals on the liuwa plains national park, Zambia. doi:10.13140/RG.2.2.26628.32647
Kunda, T. (2022). Impact of climate change on small scale farmers in samfya district of Luapula province, Zambia. Int. J. Humanit. Soc. Sci. Educ. (IJHSSE) 9 (3), 215–219. doi:10.20431/2349-0381.0903021
Lannas, K. S. M., and Turpie, J. K. (2009). Valuing the provisioning services of wetlands: contrasting a rural wetland in Lesotho with a peri-urban wetland in South Africa. Ecol. Soc. 14 (2), art18. doi:10.5751/ES-02919-140218
Lemeshow, S., and Ferketich, A. (2020). Polling America: an encyclopedia of public opinion. Simple Random Sampling 1-2, 661664. doi:10.4324/9780203128640-6
Mahlatini, P., Hove, A., Lioli, F., Maguma, B., and Chemura, A. (2020). Using direct use values for economic valuation of wetland ecosystem services: a case of Songore wetland, Zimbabwe. GeoJournal 85 (1), 41–51. doi:10.1007/s10708-018-9947-3
Marambanyika, T. (2021). Trends in the use of remotely sensed data in wetlands assessment and monitoring in Zimbabwe, 11. Gweru, Zimbabwe: Department of Geography and Environmental Studies, Midlands State University, 676–686.
Millennium Ecosystem Assessment (2005). Ecosystems and human well-being: synthesis. Washington, DC: Island Press, 155p.
Ministry of Lands and Natural Resources National Policy on Wetlands (2018). Republic of Zambia, 22p.
Owino, A., and Ryan, P. (2007). Recent papyrus swamp habitat loss and conservation implications in western Kenya. Wetl. Ecol. Manag. 15, 1–12. doi:10.1007/s11273-006-9001-y
Ramsar, C. S. (2007). Wise use of wetlands: a Conceptual Framework for the wise use of wetlands. 3rd Edition, vol. 1. Gland, Switzerland: Ramsar Convention Secretariat, 30.
Schuyt, K. D. (2005). Economic consequences of wetland degradation for local populations in Africa. Ecological Economics 53 (2), 177190. doi:10.1016/j.ecolecon.2004.08.003
Singh, A., and Masuku, M. (2014). Sampling techniques and determination of sample size in applied statistics research: an overview. Int. J. Commer. Manag. 2, 1–22.
Storrs, J. (1995). Know your trees: some of the common trees found in Zambia. Regional Soil Conservation Unit, (RSCU). Nairobi, Kenya: Regional Soil Conservation Unit. Available online at: https://www.worldcat.org/title/know-your-trees-some-of-the-common-trees-found-in-zambia/oclc/7979762/editions?referer=di&editionsView=true.
Zambia Wildlife Authority (2006). Information Sheet on Ramsar Wetlands (RIS)–2006-2008 version. Available online at: https://rsis.ramsar.org/RISapp/files/RISrep/ZM531RIS.pdf.
Zedler, J. B., and Kercher, S. (2005). Wetland resources: status, trends, ecosystem services, and restorability. Annu. Rev. Environ. Resour. 30, 39–74. doi:10.1146/annurev.energy.30.050504.144248
Zhang, W., Ricketts, H. T., Kremen, C., Carney, K., and Swinton, M. S. (2007). Ecosystem services and disservices to agriculture. Ecol. Econ. 64 (2), 253–260. doi:10.1016/j.ecolecon.2007.02.024
Keywords: Bangweulu Wetland, poverty reduction, policymakers, ecosystem services, livelihoods, resource utilisation
Citation: Tembo G, Banda K, Chundu ML, Lyoba C, Sichingabula H and Nyambe I (2025) Direct market valuation method to evaluate economic value of provisioning ecosystem services on household income in Zambia’s Bangweulu Wetland. Front. Environ. Sci. 13:1538921. doi: 10.3389/fenvs.2025.1538921
Received: 03 December 2024; Accepted: 28 August 2025;
Published: 23 September 2025.
Edited by:
Manoj Kumar Jhariya, Sant Gahira Guru Vishwavidyalaya, IndiaReviewed by:
Maria Tsvere, Chinhoyi University of Technology, ZimbabweFriday Njaya, Lilongwe University of Agriculture and Natural Resources, Malawi
Ayushi Trivedi, Rajmata Vijayaraje Scindia Krishi University, India
Copyright © 2025 Tembo, Banda, Chundu, Lyoba, Sichingabula and Nyambe. This is an open-access article distributed under the terms of the Creative Commons Attribution License (CC BY). The use, distribution or reproduction in other forums is permitted, provided the original author(s) and the copyright owner(s) are credited and that the original publication in this journal is cited, in accordance with accepted academic practice. No use, distribution or reproduction is permitted which does not comply with these terms.
*Correspondence: Greyford Tembo, dGVtYm9ncmV5Zm9yZEBnbWFpbC5jb20=