 Zhang Dong1,2
 Meng Jun
- 1Research Institute of Highway, Ministry of Transport, Beijing, China
- 2Key Laboratory of Environmental Protection Technology on Road Traffic, Ministry of Transport, Beijing, China
- 3School of Soil and Water Conservation, Beijing Forestry University, Beijing, China
Vegetation cover serves as a crucial indicator of surface vegetation health and ecosystem stability. Using the GEE (Google Earth Engine) platform, kNDVI series data were generated from Landsat-5/8 remote sensing images for the western Yili-Tianshan mountainous region spanning 2000 to 2022. The research utilized Theil-Sen trend analysis, the Mann-Kendall significance test, the Hurst index, and a geographic detector to investigate spatial and temporal variations in vegetation cover and their driving factors over the last 2 decades. Results indicated that between 2000 and 2022, the kNDVI in the western Yili-Tianshan region initially declined before rising, with a multi-year average of 0.1452, reaching 0.1841 in 2022. The lower cover class consistently exceeded 36%, while the higher and high cover areas grew by 5.03% and 12.76%, respectively. Vegetation cover was sparse in the northern region, particularly along the southwest edge of the northern Junggar Basin, while it was dense in the southern region, especially on the north slope of the Tianshan Mountains. (2) The vegetation cover in the western part of the Yili-Tianshan mountainous region has been significantly improved, with the Yili Autonomous Prefecture in the northern part of the country being the region of greater improvement, and the trend of future changes in vegetation cover will continue to be dominated by improvement. Elevation, vegetation type, and slope are primary factors influencing kNDVI changes, each with q values exceeding 0.0944. Two-factor interactions amplify the impact of individual factors, with the interaction between elevation and mean annual temperature being the predominant interactive factor affecting vegetation cover changes in the study area.
1 Introduction
Vegetation is a natural link between biosphere, hydrosphere, atmosphere and soil sphere, and an important material basis for maintaining the stability of biodiversity (Forzieri et al., 2020; Miguez-Macho and Fan, 2021; Wang et al., 2020). It is crucial for sustaining the global material cycle and surface energy equilibrium (Duveiller et al., 2017). Changes in vegetation cover directly influence regional climate regulation (Sha et al., 2022), soil and water conservation (Zhao et al., 2020; Li et al., 2018), thereby impacting the overall stability of ecosystems. Vegetation coverage serves as a fundamental metric for assessing ecosystems (Gitelson et al., 2002), playing a crucial role in examining interactions within the Earth’s system layers and ecological changes across various scales (Cosh and Brutsaert, 2003; Li et al., 2022). Therefore, long-term and large-scale vegetation dynamic change monitoring and its driving mechanism analysis have become a hot and difficult topic in current research.
Satellite remote sensing is a crucial tool for acquiring surface information due to its extensive temporal and spatial coverage (Xu et al., 2020), rapid data collection, and repeatable observations. Recent advancements in remote sensing sensors and earth observation systems have enabled large-scale monitoring of vegetation dynamics. This progress has facilitated the development of various vegetation indices, notably the Normalized Difference Vegetation Index (NDVI), which is derived from the infrared and near-infrared spectral bands of remote sensing images. NDVI is a sensitive and effective measure for assessing vegetation growth and changes, widely used in vegetation trend studies. For instance, Jin et al. (2020) employed trend analysis and multiple regression residual analysis to examine the characteristics and driving factors of vegetation NDVI changes in China from 1982 to 2015, using surface air temperature and precipitation data from 603 meteorological stations and GIMS-NDVI3G data. Similarly, Gao et al. (2019) explored the complex relationship between climate change and vegetation activities using GIMMS-NDVI and meteorological data on temperature and moisture from 1982 to 2013. The study utilized a pixel-based geographical weighted regression approach to examine the spatial patterns and dynamic characteristics of vegetation NDVI responses to climate change in China. Peng et al. (2019) applied the geographical detector model to explore the interactive effects of natural factor changes on vegetation and change in Sichuan, identifying key natural factors that promote vegetation growth. Ma et al. (2023) integrated GIMMS-NDVI and SPOT-NDVI to obtain 1 km NDVI data from 1982 to 2019. Using multi-temporal land use and meteorological data, the study conducted trend analysis, partial correlation analysis, and residual trend analysis to assess the impacts of human activities and climate change on vegetation dynamics in Southwest China.
Despite its widespread use, NDVI has notable limitations: a non-linear, saturated correlation with green biomass and a focus solely on green leaf presence rather than photosynthesis. Although indices like the Enhanced Vegetation Index (EVI) have attempted to address the saturation issue by incorporating additional spectral data, the problem persists. To improve NDVI’s effectiveness, researchers have applied kernel density estimation within machine learning’s kernel method framework to enhance smoothing, reduce noise, and improve spatial continuity and accuracy in remote sensing data. The Kernel Normalized Difference Vegetation Index (kNDVI) has been developed to assess vegetation coverage and growth, leveraging spectral information more effectively and offering greater stability and robustness than traditional NDVI across various environments, such as dense forests, grasslands, and mixed forests.
This study utilizes the GEE platform to analyze the western Yili-Tianshan Mountains using Landsat-5/8 remote sensing images from 2000 to 2022. By constructing kNDVI sequence data, the research investigates the spatio-temporal characteristics and driving mechanisms of vegetation cover changes over the past 2 decades. The analysis employs Theil-Sen trend analysis, the Mann-Kendall significance test, the Hurst index, and geographical detectors to address the question: What are the characteristics of vegetation coverage change in the western Yili-Tianshan Mountains from 2000 to 2022? (2) What are the temporal and spatial trends of vegetation coverage in the western section of the Yili and Tianshan Mountains from 2000 to 2022? What factors drive the spatio-temporal variations in vegetation cover in the western Yili and Tianshan Mountains? The study seeks to provide a scientific foundation for the monitoring, management, and conservation of vegetation cover changes in the Tianshan Mountains.
2 Material and methods
2.1 Study area
The western section of the Yili Tianshan mountain is situated in the Xinjiang Uyghur Autonomous Region of northwest China (42°15'∼45°28′N, 80°18'∼88°40′E), covering approximately 110,000 km2. Elevations range from 182 to 6,161 m (Figure 1). The area includes 11 county-level administrative divisions: 3 county-level cities, 7 counties, and 1 autonomous county. In 2022, the region had a population of 2.84 million and a GDP of 280.14 billion yuan. It features a temperate continental arid climate with varied topography, lower in the north and higher in the south. The central and southern areas are dominated by the Tianshan Mountain range, stretching from northwest to southeast. The region receives an average annual precipitation of 48.2 mm and an evaporation rate of 2,821.7 mm. The average annual temperature is 9°C, with January averaging −17°C and July 29°C (Figure 2). The area enjoys an average annual sunshine duration of 2,866.8 h.
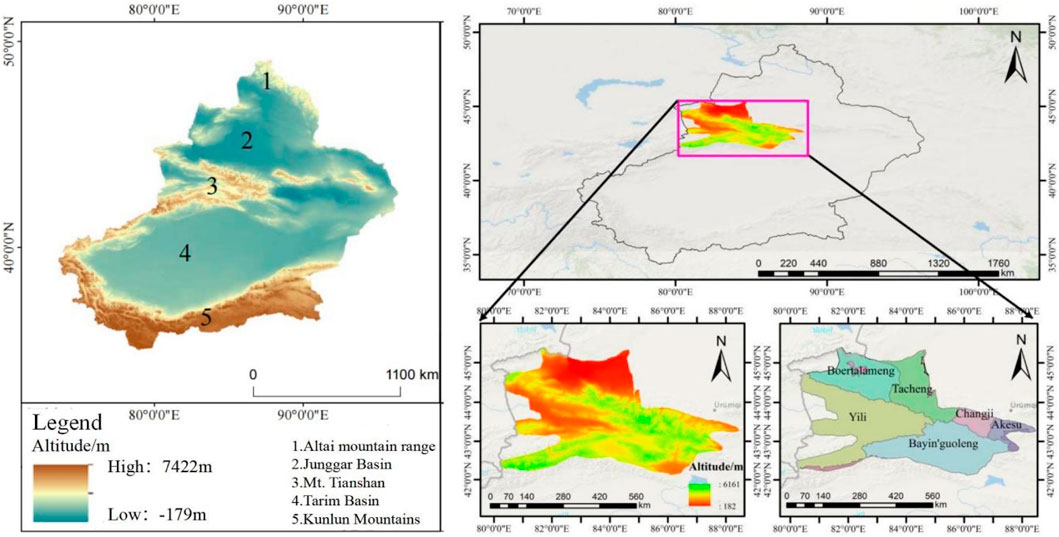
Figure 1. Schematic location of the study area.

Figure 2. The multi-year average precipitation and temperature map for the study area.
2.2 Data sources and processing
Table 1 outlines the data used in this study, including Landsat 5/8 remote sensing images, elevation, slope, average annual precipitation and temperature, soil type, erosion intensity, organic matter content, pH value, vegetation type, and land use mode. The image data is sourced from the T1 level surface reflectance dataset provided by the GEE platform. To avoid the banding effect of Landsat-7, Landsat-5 TM data was used from 2000 to 2012, and Landsat-8 OLI data from 2013 to 2020. After geometric, radiometric, and atmospheric corrections, the spatial resolution is 30 m with a temporal resolution of 16 days. Remote sensing images with less than 60% cloud cover during the vegetation growing season (June to October) of the target year were selected. The CFMASK algorithm was applied to remove cloud pixels (An Algorithm Used to De-Cloud on GEE Platforms), and the kNDVI maximum sequence for each year was derived using the maximum synthesis method. To quantitatively assess kNDVI variations in the study area, kNDVI is categorized into five grades based on established standards and literature. very low coverage (kNDVI ≤0.1), low coverage (0.1 < kNDVI ≤0.3), medium coverage (0.3 < kNDVI ≤0.5), high coverage (0.5 < kNDVI ≤0.7), and very high coverage (kNDVI >0.7) (Camps-Valls et al., 2021; Wang et al., 2023; Wang et al., 2022; Ministry of Water Resources of the People’s Republic of China, 2007; Jiang et al., 2021). The study utilized the target year kNDVI as the dependent variable and established a 5000 m × 5000 m grid across the study area using ArcGIS10.3. All control factor data were extracted to the corresponding kNDVI and outliers were removed, totaling 4,125 sample points. Finally, the data was imported into the geographic detector based on RStudio for single-factor and double-factor interactive detection, and the driving force interpretation strength of each factor on kNDVI changes was explored.
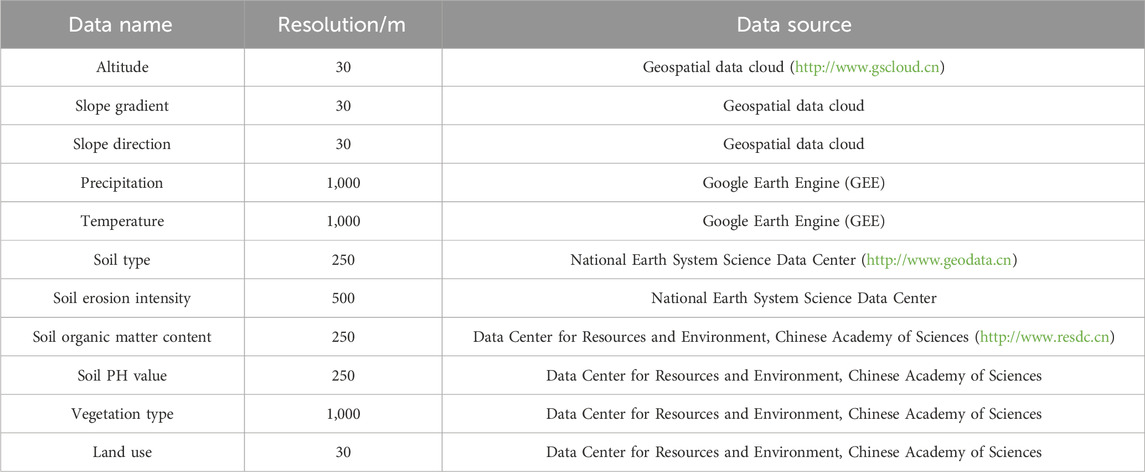
Table 1. Ecological factors main information and sources.
2.3 Methodology
2.3.1 Theil-Sen trend analysis and Mann-Kendal significance test
The Theil-Sen method (He et al., 2024) is a non-parametric approach for estimating slopes, offering robustness against outliers and noise in time series analysis without assuming a specific data distribution, thus effectively capturing trends. In recent years, it has gained extensive application in meteorology, hydrology, and ecological research (Gu et al., 2023; Thakur et al., 2021). A positive change slope (θ > 0) signifies an upward trend in the time series data over the study period, whereas a negative slope indicates a downward trend. Mann-Kendal significance test is based on statistical theory, and the results are scientific and credible. Theil-Sen’s calculation formula is:
where, θkNDVI is the kNDVI change slope of vegetation. The median function calculates the median value, where i and j represent time series years ranging from 2000 to 2022. kNDVIi and kNDVIj denote the annual maximum vegetation kNDVI values for years i and j, respectively. By combining the results of θkNDVI and Mann-Kendall significance tests, four kinds of kNDVI changes of vegetation can be obtained (Table 2).
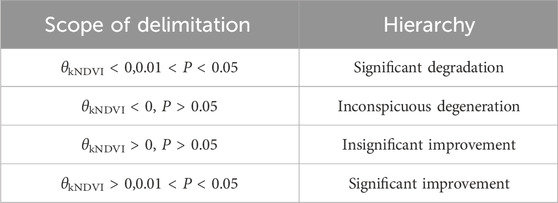
Table 2. Classification of kNDVI change trends.
2.3.2 Hurst
The Hurst index from R/S analysis is a predictive tool for kNDVI trends, widely used in hydrology, economics, climatology, and related fields. The Hurst exponent (H) ranges from 0 to 1. An H value between 0.5 and 1 indicates continuity in the time series, suggesting future trends will follow past patterns, with values closer to 1 showing stronger persistence. An H value of 0.5 denotes a random sequence, while 0 < H < 0.5 indicates anti-persistence, where future trends are likely to oppose past trends.
2.3.3 Geodetector
Utilizing factor and interactive detection within the geographical detector framework, a higher q value from the factor detector indicates a stronger impact of the control factor on the ecological environment (Shi et al., 2018). Factor detector calculation formula and multi-factor interaction types are:
In this context, q signifies the effect of an influencing factor on kNDVI, with h varying from one to L, where L represents the number of classifications for kNDVI and its independent variables. Nh and N refer to the sample sizes in various graded regions and the entire region, respectively. δh2 and δ2 are the variances of kNDVI in different regions and whole regions, respectively.
The detector evaluates the interaction between factors X1 and X2 by assessing q (X1 ∩ X2) to determine if their combined effect amplifies or diminishes their impact on the dependent variable Y (Shi et al., 2018). This value is compared with q (X1) and q (X2), with Table 3 providing the basis for establishing the effect relationship on Y.
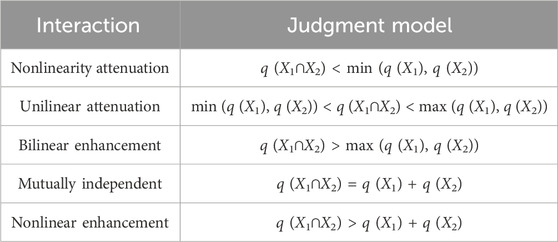
Table 3. Factor interaction detection results.
3 Results and analysis
3.1 Characteristics of spatial and temporal changes in vegetation cover in the study area
Figure 3 illustrates the temporal changes in kNDVI in the western Yili-Tianshan Mountains from 2000 to 2022. Overall, the vegetation cover in the region was inadequate, with kNDVI exhibiting a “fluctuating upward” trend. Notably, between 2000 and 2007, the annual average kNDVI declined from 0.1636 to 0.1088, marking a 33.49% decrease. kNDVI increased rapidly from 0.1131 in 2008 to 0.1811 in 2015 due to a number of forestry projects being put into use in Tianshan Mountains from 2008 to 2015. kNDVI decreased slightly in 2016, which may be related to local extreme climate change and the restoration of some forest and grass land. Since 2017, kNDVI has steadily increased with the age of plantations in related forestry ecological projects. From the perspective of vegetation cover grade, the proportion of lower cover grade has been dominant in all study years (no less than 36%). In recent years, the proportion of higher coverage and high coverage classes has increased, rising to 20.09% and 19.13% respectively in 2022.
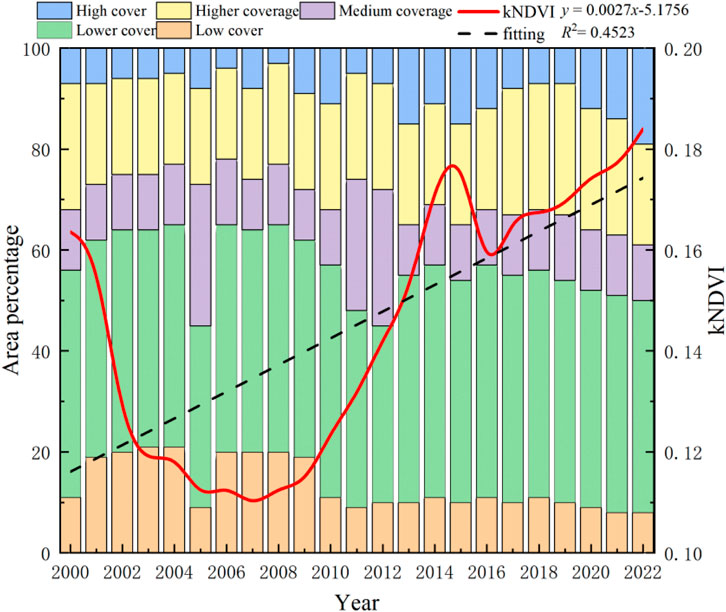
Figure 3. Changes in kNDVI in the study area from 2000 to 2022 with linear fitting results.
On the spatial scale (Figure 4). The kNDVI in the western Yili Tianshan Mountains shows distinct geographical variation, decreasing from south to north. The northern area, at the southwest edge of the Junggar Basin, has limited precipitation and poor soil, resulting in sparse vegetation and lower kNDVI. In contrast, the southern region, near the north slope of Tianshan Mountain, benefits from blocked westerly and Arctic airflows, leading to abundant precipitation, a mild climate, and diverse vegetation, contributing to higher kNDVI.
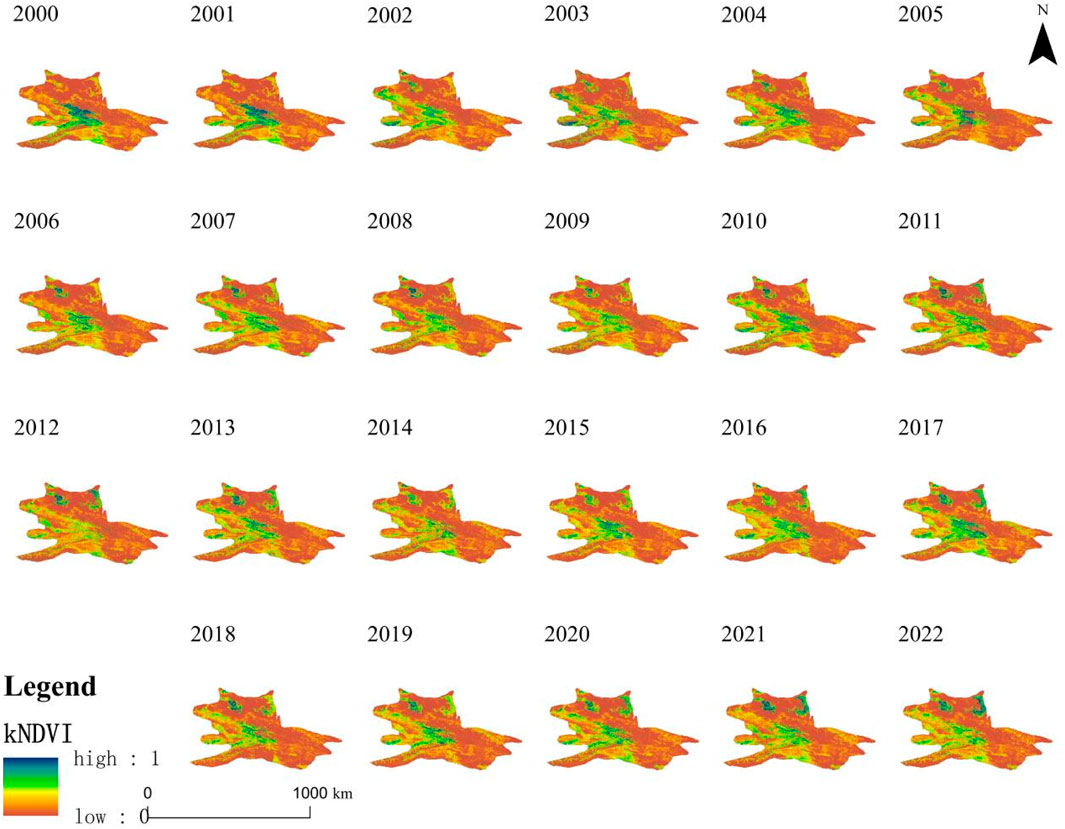
Figure 4. Spatial distribution pattern of kNDVI from 2000 to 2022.
3.2 Trends in spatial and temporal evolution of vegetation cover in the study area
Figure 5 illustrates that from 2000 to 2022, the western Yili and Tianshan Mountains exhibited a kNDVI trend where areas with θkNDVI > 0 covered 51,123.55 km2, representing 44.92% of the total study area. Vegetation coverage notably improved in the western Yili-Tianshan Mountains, with the most significant enhancement observed in the YIli Autonomous Prefecture in the study area’s northern region.
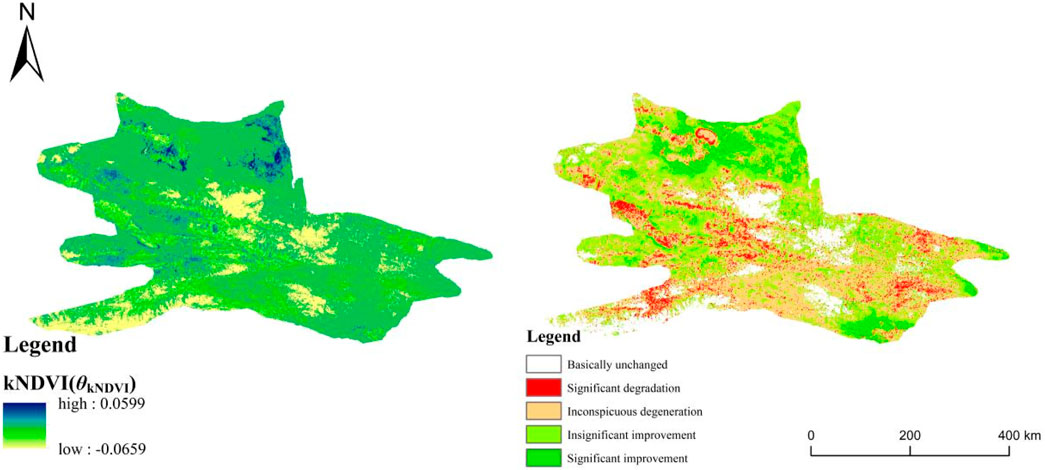
Figure 5. Trends in spatial and temporal evolution of kNDVI in the study area.
On the spatial scale, 19.40% (22,077.09 km2) of the area passed the significance test. Non-significant degradation covered 35.04% (39,877.35 km2), while significant degradation accounted for 7.57% (8,613.17 km2). Areas with significant and non-significant improvement totaled 44.92% (13,463.92 km2 and 37,659.63 km2, respectively). Significant changes, including both improvement and degradation, were most prominent in Yili Autonomous Prefecture in the north, the southwest margin of Junggar Basin, and the north slope of Tianshan Mountain in the south of the study area.
3.3 Future trends in vegetation cover in the study area
Figure 6 presents the spatial trend of the Hurst index and predicts the future trend of kNDVI in the study area. The Hurst index values range from 0.1164 to 0.9429, with areas where H > 0.5 covering 37,895.53 km2, representing only 33.30% of the total area. This suggests significant short-term changes in kNDVI in the western section of the Yili-Tianshan Mountains. Combined with the θkNDVI values, it is evident that kNDVI in this region is expected to improve in the future.
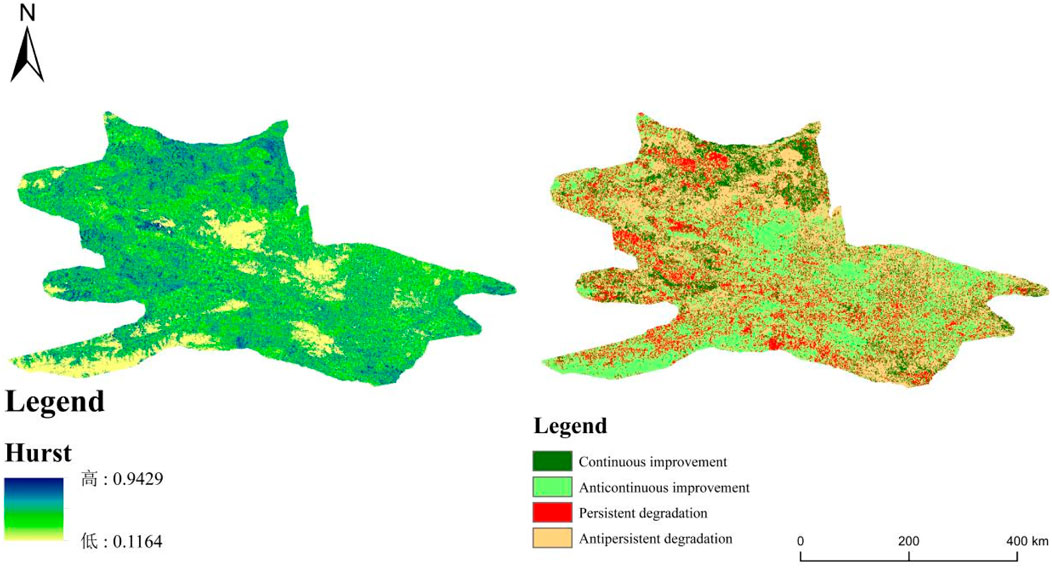
Figure 6. The hust index and future trends in kndvi in the Study Area.
Table 4 reveals that future trends are mainly characterized by anti-continuous improvement, where trends shift from degradation to improvement, and by continuous degradation. The anti-continuous improvement area constitutes 60.64%, the highest among all trend types, and is distributed throughout the region. Continuous improvement accounts for 16.50%, primarily in the western and northern parts of the study area. Continuous degradation represents 16.79%, mainly in the western and southern regions. Anti-continuous degradation covers 6.07% of the entire region.
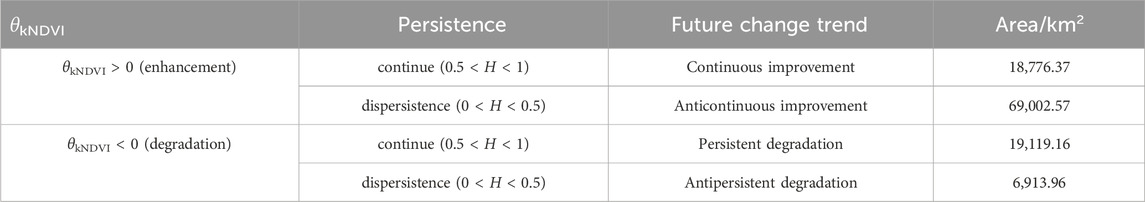
Table 4. Statistics on the results of the zoning of future trends in kNDVI in the study area.
3.4 Driving factors of spatial differentiation of vegetation cover in the study area
3.4.1 Single factor detection results
Utilizing RStudio’s geographic detector, ten driving factors were identified through single-factor analysis to examine their influence on the spatial differentiation of kNDVI in vegetation cover. The findings are presented in Table 5, highlighting the average driving force from 2000 to 2020. Elevation > vegetation type > Slope > soil erosion intensity > Average annual temperature > soil PH > average annual precipitation > soil type > slope direction > soil organic matter content. q values of elevation, vegetation type and slope are all greater than 0.0944, which are the main control factors driving the change of vegetation cover kNDVI in the study area.
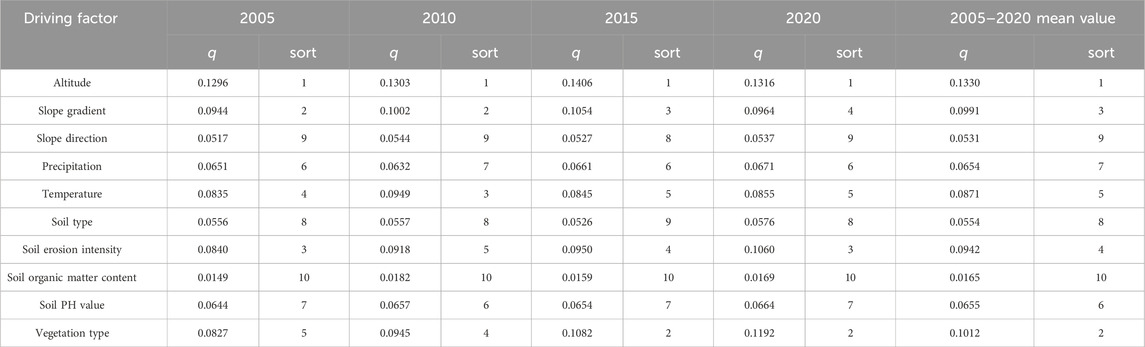
Table 5. Factor detection results in different years.
The study indicates that, except for soil erosion intensity and vegetation type, the relative influence of driving factors has remained relatively stable over the years. Since 2000, the impact of driving forces on soil erosion intensity has increased, with the q value rising from 0.0840 in 2000 to 0.1060 in 2020. Similarly, the q value for vegetation type has grown significantly from 0.0827 in 2000 to 0.1192 in 2020. Since the early 21st century, especially after 2010, the state has focused on ecological protection in the Tianshan region by implementing policies that established the Yili Species Resource Ecological Function Protection Area and the Tianshan Water Conservation Ecological Function Protection Area. These measures have effectively mitigated issues such as excessive reclamation and unregulated grazing. The study concludes that changes in the q value reflect an increasing influence of soil erosion intensity and vegetation type on vegetation cover kNDVI in the region.
3.4.2 Two factor interaction detection results
Figure 7 illustrates that the interaction results from the geographic detector indicate a stronger response of kNDVI vegetation cover changes to any two-factor interaction compared to single factors. All interaction detection results fall into two categories: two-factor and nonlinear enhancement. The strongest driving force of the interaction in the four study years is elevation and average annual temperature. Elevation, vegetation type, and slope significantly impact the interaction of various factors, confirming their dominant role in driving kNDVI spatial differentiation of vegetation cover in the western Yili-Tianshan Mountain ecological function reserve, as supported by previous single-factor analyses.
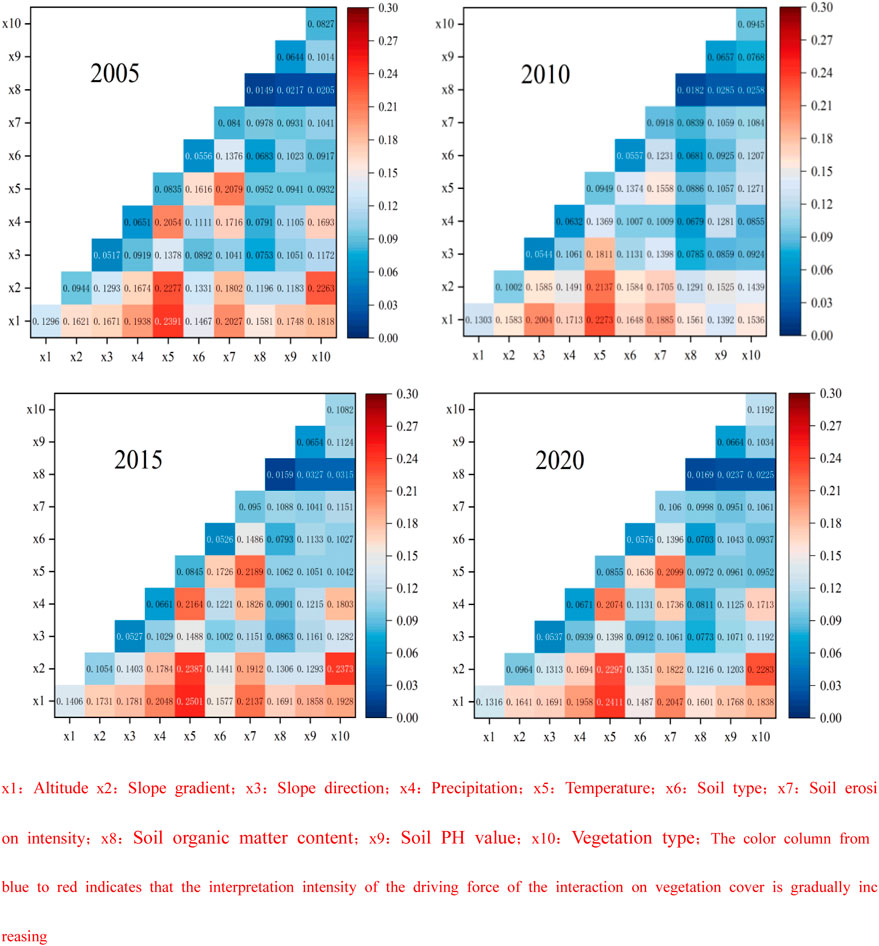
Figure 7. Interactive detection results in different years. x1:Altitude x2:Slope gradient; x3:Slope direction; x4:Precipitation; x5:Temperature; x6:Soil type; x7:Soil erosion intensity; x8:Soil organic matter content; x9:Soil PH value; x10:Vegetation type; The color column from blue to red indicates that the interpretation intensity of the driving force of the interaction on vegetation cover is gradually increasing.
kNDVI in the study area is influenced by multiple factors rather than a single factor independently. Elevation and average annual temperature significantly impact kNDVI in the study area, with elevation being crucial for the restoration and protection of vegetation cover. Therefore, different methods should be adopted for vegetation restoration and protection according to different elevation conditions in the study area. In addition, slope annual temperature and slope vegetation type show a synergistic effect of nonlinear enhancement in all study years, indicating that terrain conditions represented by slope have a more obvious driving force on kNDVI change under different environmental conditions, especially under different climatic conditions and different vegetation types.
3.4.3 Land use transfer
Table 6; Figure 8 show that from 2000 to 2022, the most notable land class changes in the study area were the conversion of unused land to grassland (7,432.08 km2) and cultivated land to forest land (5,118.97 km2), accounting for 6.53% and 4.49% of the total area, respectively. These changes, driven by effective forestry ecological projects and the farmland-to-forest policy in the Tianshan Mountains, have led to an increase in kNDVI in the region.
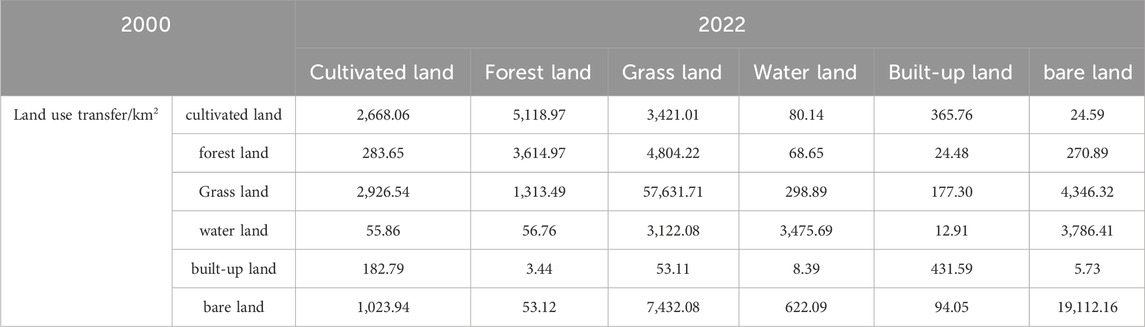
Table 6. Land use transfers in the study area from 2000 to 2022.
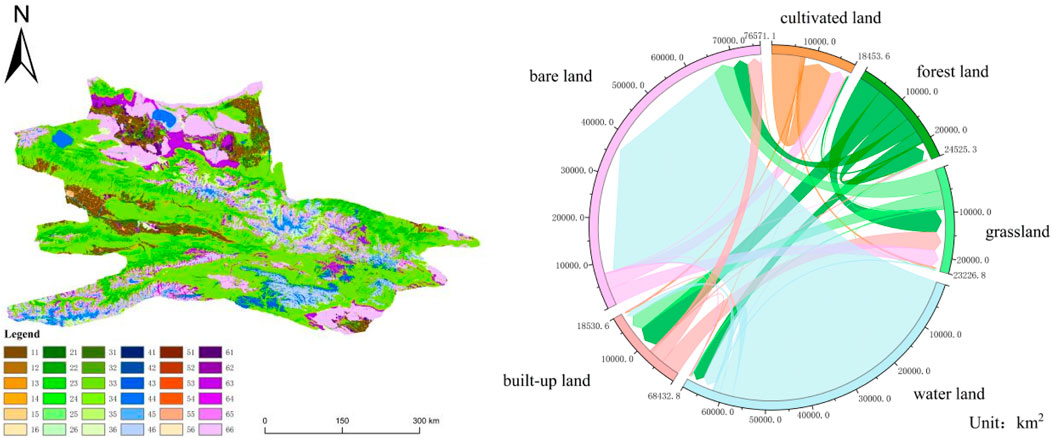
Figure 8. Land use transfer distribution pattern and transfer values in the study area from 2000 to 2022.1: cultivated land; 2: forest land; 3: grassland; 4: water land; 5: built-up land; 6: bare land; 11: the transfer of cultivated land to cultivated land; 12:the transfer of cultivated land to forests.
4 Discussion
4.1 Temporal variation and spatial distribution pattern of kNDVI
Between 2005 and 2022, kNDVI in the study area initially declined before rising, influenced by both individual and combined factors, aligning with previous research (Wang et al., 2021). The stable average annual temperature and precipitation, along with the ecosystem’s self-healing ability, indicate potential for kNDVI recovery in the western Yili Tianshan Mountains (Sun et al., 2023). This recovery is also linked to recent forestry ecological projects. Historically, indiscriminate land use reduced forest and grass areas. Since 2010, initiatives such as the Ecological Protection and Restoration of Tianshan Ecological Area, Tianshan Natural Forest Protection Project, and Forest Vegetation Protection and Restoration Project of Tianshan North Slope Valley have promoted vegetation and ecosystem restoration, enhancing kNDVI, consistent with earlier studies (Shi et al., 2021). However, kNDVI experienced a sharp decline in 2016 due to extreme weather events during the super-strong El Niño, corroborating Huang Jian’s findings (Huang and Yao, 2022).
The study area’s vegetation coverage, represented by kNDVI, shows a spatial trend of lower values in the north and higher in the south. The northern region, part of the southwest margin of the Junggar Basin, is characterized by the widespread Gobi Desert, limited vegetation types, poor soil conditions, and a challenging ecological environment, making forestry projects difficult and minimally effective (Zhang, 2023; Han et al., 2022; Wang J. G. et al., 2022). In contrast, the southern region benefits from its proximity to the north slope of the Tianshan Mountains, which block westerly air currents, capturing moisture from the Atlantic and Arctic Oceans and cold air from Siberia. The climate, marked by warmth, coolness, and abundant precipitation, supports extensive forests that play a crucial role in ecological regulation (Yao et al., 2022; Li et al., 2021; Wang et al., 2023). kNDVI analysis reveals an increase in vegetation cover from north to south in the study area.
4.2 Spatio-temporal evolution of vegetation cover and its future change trend
From 2000 to 2020, the kNDVI of vegetation cover in the study area showed a generally increasing trend with fluctuations, consistent with Aizizi et al. (2023) and Yan et al. (2021). Between 2000 and 2007, significant ecological degradation occurred, with low-grade vegetation coverage expanding from 12,519.33 km2 to 22,762.41 km2, an 8.86% increase. This aligns with studies (Liu et al., 2023; Zhang et al., 2024; Gao et al., 2024; Wang J. et al., 2022) indicating that major projects like the West-East gas transmission second-line project and the Yili River Bridge negatively impacted the ecosystem during construction. Since 2008, kNDVI in the western Yili-Tianshan Mountains has risen, with a decrease in low and middle-grade regions and an increase in middle and high-grade regions, reflecting vegetation improvement over degradation. This is consistent with previous research (Zhang et al., 2021; Qiu et al., 2023; Zhou et al., 2024) and is likely due to efforts in converting farmland to forest and ecological conservation in critical Tianshan areas. Since 2017, the integrated protection and restoration project in the West Tianshan region has further enhanced vegetation protection and restoration in the western Yili-Tianshan Mountains. Consequently, the high-grade vegetation coverage area expanded from 9,252.92 km2 to 21,635.67 km2, increasing from 8.13% to 19.01%. Analysis of the current vegetation cover and Hurst index in the study area indicates that future improvements in vegetation cover are likely. Future efforts in vegetation protection and restoration in the western Yili Tianshan Mountain should focus on preserving favorable climatic conditions, advancing the farmland-to-forest policy, and strictly regulating land use.
4.3 Effects of different control factors on kNDVI change of vegetation cover
The geographical detector’s single factor analysis identifies elevation, vegetation type, and slope as the primary drivers of kNDVI spatial differentiation in vegetation cover in the western Yili and Tianshan Mountains, aligning with prior research findings (Sun et al., 2021). Elevation is closely related to vegetation types and vegetation growth conditions, and affects temperature and precipitation, thus affecting vegetation cover. Therefore, elevation has the highest influence on vegetation cover kNDVI in the western section of the Yili and Tianshan Mountains. Vegetation cover status is directly related to vegetation type, with significant variations observed among different types. Slope is a key indicator of regional topography, directly influencing the types of vegetation present.
The detection of two-factor interactions indicates that the combined influence of factors surpasses individual effects, highlighting mutual enhancement as the driving force behind kNDVI spatial differentiation. Consequently, vegetation cover change in the western Yili-Tianshan Mountains results from the interplay of multiple factors. Thus, vegetation protection and restoration strategies should be tailored to local conditions, considering variations in elevation, slope zones, vegetation cover types, and climate characteristics. Various strategies have been implemented to improve vegetation coverage in this region.
5 Conclusion
(1) From 2000 to 2022, kNDVI in the western section of the Yili - Tianshan Mountains first decreased and then increased, reaching a maximum value of 0.1841 in 2022. The proportion of lower coverage grade has always dominated, and the proportion of higher coverage and high coverage area increased by 5.03% and 12.76%, respectively.
(2) The vegetation coverage of the study area is low in the north and high in the south. The vegetation coverage of the southwest margin of the Junggar Basin in the north is mostly low-low clustering, and the area with high vegetation coverage is mainly concentrated in the north slope of the Tianshan Mountains in the south. The overall vegetation cover improved significantly, and the largest area of improvement was the northern Yili Autonomous Prefecture, and the change trend of vegetation cover would still be mainly improved in the future.
(3) Elevation is the strongest single driving force for kNDVI change in the western section of the Yili - Tianshan Mountains, and elevation ∩ annual temperature is the strongest interactive driving force. The driving force strength of annual temperature has an obvious upward trend, indicating that kNDVI has a closer relationship with slope in the study area.
Data availability statement
The original contributions presented in the study are included in the article/supplementary material, further inquiries can be directed to the corresponding author.
Author contributions
ZD: Writing – original draft, Visualization. SG: Writing – original draft. FX: Software, Writing – review and editing. MJ: Software, Writing – original draft.
Funding
The author(s) declare that financial support was received for the research and/or publication of this article. National Natural Science Foundation of China. The study was sponsored by “Supported by the Opening Project of Key Laboratory of Road Traffic Environmental Protection Technology, Ministry of Transport, PRC”.
Conflict of interest
The authors declare that the research was conducted in the absence of any commercial or financial relationships that could be construed as a potential conflict of interest.
Generative AI statement
The author(s) declare that no Generative AI was used in the creation of this manuscript.
Publisher’s note
All claims expressed in this article are solely those of the authors and do not necessarily represent those of their affiliated organizations, or those of the publisher, the editors and the reviewers. Any product that may be evaluated in this article, or claim that may be made by its manufacturer, is not guaranteed or endorsed by the publisher.
References
Aizizi, Y., Kasimu, A., Liang, H., Zhang, X., and Zhao, Y. (2023). Evaluation of ecological space and ecological quality changes in urban agglomeration on the northern slope of the Tianshan Mountains. Ecol. Indic. 146, 109896. doi:10.1016/j.ecolind.2023.109896
Camps-Valls, G., Campos-Tabemner, M., Moreno-Martinez, Á., Walther, S., Duveiller, G., Cescatti, A., et al. (2021). A unified vegetation index for quantifying the terrestrial biosphere. Sci. Adv. 7 (9), eabc7447. doi:10.1126/sciadvabc7447
Cosh, M. H., and Brutsaert, W. (2003). Microscale structural aspects of vegetation density variability. J. Hydrology 276 (1-4), 128–136. doi:10.1016/s0022-1694(03)00068-4
Duveiller, G., Hooker, J., and Cescatti, A. (2017). The mark of vegetation change on earth's surface energy balance. Nat. Commun. 9, 679. doi:10.1038/s41467-017-02810-8
Forzieri, G., Miralles, D. G., Ciais, P., Alkama, R., Ryu, Y., Duveiller, G., et al. (2020). Increased control of vegetation on global terrestrial energy fluxes. Nat. Clim. Change 10 (4), 356–362. doi:10.1038/s41558-020-0717-0
Gao, J., Jiao, K., and Wu, S. (2019). Climate impact analysis of spatial heterogeneity of vegetation NDVI in China from 1982 to 2013. J. Geogr. 74 (3), 534–543. doi:10.11821/dlxb201903010
Gao, Y. J., Tariq, A., Zeng, F. J., Sardans, J., Al-Bakre, D. A., and Peñuelas, J. (2024). Drying and rewetting affect the chemical speciation and bioavailability of soil phosphorus in a hyper-arid desert ecosystem. Pedosphere. doi:10.1016/j.pedsph.2024.08.004
Gitelson, A. A., Kaufman, Y. J., Stark, R., and Rundquist, D. (2002). Novel algorithms for remote estimation of vegetation fraction. Remote Sens. Environ. 80 (1), 76–87. doi:10.1016/s0034-4257(01)00289-9
Gu, Z., Chen, J., Chen, Y., Qiu, Y., Zhu, X., and Chen, X. (2023). Agri-Fuse: a novel spatiotemporal fusion method designed for agricultural scenarios with diverse phenological changes. Remote Sens. Environ. 299, 113874. doi:10.1016/j.rse.2023.113874
Han, C. Q., Zheng, J. H., Guan, J. Y., Du, J., and Zhang, Q. (2022). Evaluating and simulating resource and environmental carrying capacity in arid and semiarid regions: a case study of Xinjiang, China. J. Clean. Prod. 338, 130646. doi:10.1016/j.jclepro.2022.130646
He, X., Guan, D., Yang, X., Zhou, L., and Gao, W. (2024). Quantifying the trends and affecting factors of CO2 emissions under different urban development patterns: an econometric study on the yangtze river economic belt in China. Sustain. Cities and Society 107, 105443. doi:10.1016/j.scs.2024.105443
Huang, J., and Yao, F. L. (2022). Vegetation and climate change on the northern slope of the Western Tien Shan over the past millennium. J. Stratigr. 46 (3), 306–315. (in Chinese).
Jiang, L., Liu, Y., Wu, S., and Yang, C. (2021). Analyzing ecological environment change and associated driving factors in China based on NDVI time series data. Ecol. Indic. 129, 107933. doi:10.1016/j.ecolind.2021.107933
Jin, K., Wang, F., Han, J., Shi, S., and Ding, J. (2020). Impacts of climate change and human activities on vegetation NDVI changes in China from 1982 to 2015. J. Geogr. 75 (5), 961–974. doi:10.11821/dlxb202005009
Li, J., Gao, Y., and Wang, Q. (2021). Anisotropic zoning in the upper crust of the tianshan tectonic belt. Sci. China Earth Sci. 64 (4), 651–666. doi:10.1007/s11430-020-9709-0
Li, J., Wang, J., and Zhang, J. (2022). Growing-season vegetation coverage patterns and driving factors in the China-Myanmar Economic Corridor based on Google Earth Engine and geographic detector. Ecol. Indic. 136, 108620. doi:10.1016/j.ecolind.2022.108620
Li, Y., Piao, S. L., Li, L. Z. X., Chen, A. P., Wang, X. H., Ciais, P., et al. (2018). Divergent hydrological response to large-scale afforestation and vegetation greening in China. Science Advances 4 (5), eaar4182. doi:10.1126/sciadv.aar4182
Liu, Y., Yuan, X., Li, J., Qian, K., Yan, W., Yang, X., et al. (2023). Trade-offs and synergistic relationships of ecosystem services under land use change in Xinjiang from 1990 to 2020: a Bayesian network analysis. Sci. Total Environ. 858, 160015. doi:10.1016/j.scitotenv.2022.160015
Ma, B. X., He, C. X., Jing, C. X., Wang, J. L., Li, J., Liu, B., et al. (2023). Attribution of vegetation change in Southwest China, 1982-2019. J. Geogr. 78 (3), 714–728. doi:10.11821/dlxb202303010
Miguez-Macho, G., and Fan, Y. (2021). Spatiotemporal origin of soil water taken up by vegetation. Nature 598 (7882), 624–628. doi:10.1038/s41586-021-03958-6
Ministry of Water Resources of the People’s Republic of China (2007). Soil erosion classification and grading standards (SL190-2007). (Standard).
Peng, W., Zhang, D., Luo, Y., Wang, Z., and Hu, Y. (2019). Geodetection of NDVI changes of vegetation in Sichuan by natural factors. J. Geogr. 74 (9), 1758–1776. doi:10.11821/dlxb201909008
Qiu, H., Zhang, J., Han, H., and Cheng, X. (2023). Study on the impact of vegetation change on ecosystem services in the Loess Plateau, China. Ecol. Indic. 154, 110812. doi:10.1016/j.ecolind.2023.110812
Sha, Z. Y., Bai, Y. F., Li, R. R., Xie, Y., Ji, W., Li, F., et al. (2022). The global carbon sink potential of terrestrial vegetation can be increased substantially byoptimal land management. Commun. Earth&Environment 3 (1). doi:10.1038/s43247-021-00333-1
Shi, M., Wu, H., Fan, X., Jia, H., Dong, T., He, P., et al. (2021). Trade-Offs and Synergies of multiple ecosystem services for different land Use Scenarios inthe Yili River valley, China. Sustainability 13, 1577. doi:10.3390/su13031577
Shi, T., Hu, Z., Shi, Z., Guo, L., Chen, Y., Li, W., and Wu, G. (2018). Geo-detection of factors controlling spatial patterns of heavy metals in urban topsoil using multi-source data. Sci. Total Environ. 643, 451–459. doi:10.1016/j.scitotenv.2018.06.224
Sun, C., Ma, Y., and Gong, L. (2021). Response of ecosystem service value to land use/cover change in the northern slope economic belt of the Tianshan Mountains, Xinjiang, China. J. Arid Land 13 (10), 1026–1040. doi:10.1007/s40333-021-0082-5
Sun, F. H., Wang, Y. G., Sun, J. J., Zhang, Y., Chen, Y. P., and Li, Z. Q. (2023). Spatial and temporal dynamics of vegetation carbon utilization efficiency and its influencing factors in mountain ecosystems on the northern slope of Tianshan Mountain. J. Ecol. 1-13. doi:10.13292/j.1000-4890.202305.004
Thakur, S., Mondal, l., Bar, S., Das, P., and Ghosh, P. B. (2021). Shoreline changes and its impact on the mangrove ecosystems of some islands of Indian Sundarbans, North-East coast of India. Journal Clean. Prod. 284, 124764. doi:10.1016/j.jclepro.2020.124764
Wang, J., Ding, J., Ge, X., Qin, S., and Zhang, Z. (2022b). Assessment of ecological quality in Northwest China (2000–2020) using the Google Earth Engine platform: climate factors and land use/land cover contribute to ecological quality. J. Arid Land 14, 1196–1211. doi:10.1007/s40333-022-0085-x
Wang, J. F., and Xu, C. D. (2017). Geoprobes: Principles and prospects. J. Geogr. 72 (1), 116–134. doi:10.11821/dlxb201701010
Wang, J. G., Zhang, F., Jim, C. Y., He, H., and Wang, H. (2022a). Spatio-temporal variations and drivers of ecological carrying capacity in a typical mountain-oasis-desert area, Xinjiang. China. Ecol. Eng. 180, 106672. doi:10.1016/j.ecoleng.2022.106672
Wang, Q., Moreno-Martínez, Á., Muñoz-Marí, J., Campos-Taberner, M., and Camps-Valls, G. (2023). Estimation of vegetation traits with kernel NDVI. ISPRS J. Photogrammetry Remote Sens. 195, 408–423. doi:10.1016/jisprsjprs.2022.12.019
Wang, S., Zhang, Y., Ju, W., Chen, J. M., Ciais, P., Cescatti, A., et al. (2020). Recent global decline of CO2 fertilization effects on vegetation photosynthesis. Science 370 (6522), 1295–1300. doi:10.1126/science.abb7772
Wang, X., Meng, Q., Zhang, L., and Hu, D. (2021). Evaluation of urban green space interms of thermal environmental benefits using geographical detector analysis. Int. J. Appl. Earth Observation Geoinformation 105, 102610. doi:10.1016/j.jag.2021.102610
Wang, Y. N., Zhang, J., Huang, X., and Wang, Z. J. (2023). Cenozoic exhumation of the Tianshan as constrained by regional low-temperature thermochronology. Earth-Science Rev. 237, 104325. doi:10.1016/j.earscirev.2023.104325
Wang, X., Biederman, J. A., Knowles, J. F., Scott, R. L., Turner, A. J., Berry, J. A., et al. (2022). Satellite solar-induced chlorophyll fluorescence and near-infrared reflectance capture complementary aspects of dryland vegetation on productivity dynamics. Remote Sens. Environ. 270, 112858. doi:10.1016/j.rse.2021.112858
Xu, Z., Cao, L., Zhong, S., He, H., Wang, L., and Liu, X. (2020). Trends in global vegetative drought from long-term satellite remote sensing data. IEEE J. Selected Top. Appl. Earth Observations and Remote Sens (13), 815–826. doi:10.1109/JSTARS.2020.2970113
Yan, Y. B., Chai, Z. Y., Yang, X. D., Chen, Y., and Wang, X. Y. (2021). The temporal and spatial changes of the ecological environment quality of the urban agglomeration on the northern slope of Tianshan Mountain and the influencing factors. Ecol. Indic. 33. doi:10.1016/jecolind.2021.108380
Yao, J., Chen, Y., Guan, X., Zhao, Y., Chen, J., and Mao, W. (2022). Recent climate and hydrological changes in a mountain-basin system in Xinjiang, China. Earth-Sci. Rev. 226, 103957. doi:10.1016/j.earscirev.2022.103957
Zhang, J., Hao, X., Li, X., Fan, X., and Zhang, S. (2024). Evaluation and regulation strategy for ecological security in the Tarim River Basin based on the ecological footprint. J. Clean. Prod. 435 (2024), 140488. doi:10.1016/j.jclepro.2023.140488
Zhang, L., Yang, H., Qiao, L., Wang, Z., and Li, F. (2021). Spatial and temporal analyses of vegetation changes at multiple time scales in the qilian mountains. Remote Sens. 13 (24), 5046. doi:10.3390/rs13245046
Zhang, Y. (2023). “Vertical vegetation zone variation and soil carbon stock in Tianshan Mountain since 1980s under the background of climate change,” Lanzhou University. doi:10.27204/d.cnki.glzhu.2023.000008 (in Chinese).
Zhao, Y., Tzedakis, P. C., Li, Q., Qin, F., Cui, Q., Liang, C., et al. (2020). Evolution of vegetation and climate variability on the Tibetan Plateau over the past 1.74 million years. Sci. Adv. 6 (19), eaay6193. doi:10.1126/sciadv.aay6193
Keywords: vegetation cover, Google Earth Engine, time and space changes, geodetector, driving mechanism
Citation: Dong Z, Gang S, Xiang F and Jun M (2025) Study on vegetation cover change and its driving mechanism in the western section of Yili-Tianshan mountainous ecological functional reserve from 2000 to 2022. Front. Environ. Sci. 13:1540789. doi: 10.3389/fenvs.2025.1540789
Received: 06 December 2024; Accepted: 15 May 2025;
Published: 25 November 2025.
Edited by:
Shuisen Chen, Guangzhou Institute of Geography, ChinaReviewed by:
Xinyao Xie, Chinese Academy of Sciences (CAS), ChinaYali Zhu, Chinese Academy of Sciences (CAS), China
Copyright © 2025 Dong, Gang, Xiang and Jun. This is an open-access article distributed under the terms of the Creative Commons Attribution License (CC BY). The use, distribution or reproduction in other forums is permitted, provided the original author(s) and the copyright owner(s) are credited and that the original publication in this journal is cited, in accordance with accepted academic practice. No use, distribution or reproduction is permitted which does not comply with these terms.
*Correspondence: Fukai Xiang, MTc4NjE1MTAwMThAMTYzLmNvbQ==