 Muhammad Rizwanullah
 Muhammad Nasrullah
 Suliman Almojel2
- 1School of Management, Shanxi Technology and Business University, Taiyuan, Shanxi, China
- 2Department of Agricultural Economics, College of Food and Agricultural Sciences, King Saud University, Riyadh, Saudi Arabia
Over the past few decades, human activity, particularly CO2 emissions, has been the primary cause of global climate change. Urbanization, population growth, and economic advancements also contribute to increased carbon emissions. Renewable energy projects and green production methods can mitigate CO2 emissions. Despite extensive research on climate change, there is a significant gap in understanding the combined impact of climatic factors such as urban population growth, forest area, electricity production from oil and nuclear sources, and average precipitation on ecological performance in Belt and Road Initiative (BRI) countries. This study aims to fill this gap by analyzing data from 20 BRI countries from 1992 to 2021 using the two-step generalized method of moments (GMM) estimation. The findings reveal that urban population growth and electricity production from oil sources significantly increase CO2 emissions, underscoring the environmental challenges posed by rapid urbanization and fossil fuel dependence. Conversely, forest area and electricity production from nuclear sources demonstrate a mitigating effect, reducing emissions and highlighting the importance of forest conservation and low-carbon energy transitions. Average precipitation depth also shows a significant, though weaker, influence on emissions, highlighting its role in shaping ecological outcomes. This study contributes to the literature by comprehensively assessing climatic factors within the BRI framework by integrating empirical analysis with policy relevance. The results emphasize the need for targeted policies to enhance ecological performance, such as sustainable urban planning, reforestation, and nuclear energy adoption. The research highlights the originality of its methodology and design, offering actionable insights for BRI nations to combat climate change while fostering economic development.
Introduction
The increase in greenhouse gases during the last several decades, especially carbon dioxide emissions (CO2) brought on by human activity, has been the main cause of global climate change (Mahmood et al., 2022). IPCC predictions state that the worldwide CO2 emissions from industrial processes and energy consumption peaked in 2021 at 36.3 GtCO2. (Wen et al., 2021). The World Economic Forum (WEF) claims that the world won't be able to combat climate change if more drastic action isn't done. As such, it will be reduced to a “hothouse world” scenario (Balsalobre-Lorente et al., 2022; Sun et al., 2020). China’s metropolitan areas generated the most CO2 emissions, accounting for around 75.15% and 85% of the country’s total energy consumption and CO2 emissions, respectively. These figures are greater than the average for the world (Kahia and Omri, 2021).
Urbanization is a global phenomenon characterized by changes in the environment, society, and physical space (Nasir et al., 2021). Due to migration, natural population growth, and economic advancements, urbanization has widened the dispersion of the population in recent years (Growth and Index, 2021). Millions of individuals migrate to urban regions in quest of better living conditions since they are centers of innovation, economic activity, and cultural interchange. Thus, as the pace of urbanization rises, sustainability and carbon emission-related environmental challenges have taken center stage (Torun et al., 2022). Urban areas are the primary source of greenhouse gas emissions worldwide, with CO2 being the most important pollutant. Inefficient infrastructure, dependence on non-renewable energy sources, poor urban planning, and traffic patterns all contribute to the energy consumption and emissions that result from the combination of human activity, industry, infrastructure, and transportation networks in urban areas (Radwan et al., 2020).
Moreover, woods are important to uphold the health of immune systems and a balanced biological environment. However, in BRI member countries, the development of infrastructure and urbanization often result in the deforestation of forests, which increases carbon emissions (Aluko et al., 2023). These relationships will serve to create anti-deforestation policies, land-use decision support tools, and climate change laws through forest extension and emission CO2 determination (Urb and Stud, 2023). Eco-friendly BRI members could prevent the deterioration of forest ecosystems and thereby reduce the emission of CO2 indirectly by investing in renewable energy projects and green production methods (Boleti et al., 2021). Likewise, power and wealth have always been connected to oil since the date of its creation (Lee & Olasehinde-Williams, 2024). The process of oil production itself has yet to have sufficient outcomes. The phenomena of perpetual growth and merciless competition that bring corruption and symbolic violence into the scene are some features of the political oil geography in both the past and the present (Yu et al., 2024). There are various factors, such as financial markets, the level of economic growth, technical developments, and unexpected events, that come into play in the oil industry (Ghazouani and Beldi, 2022).
Furthermore, there is a substitutive relationship between the production of other commodities, such as coal, natural gas, or renewable energy, and the volatility of oil prices (Chu and Le, 2022). In the global energy landscape, the oil industry makes a considerable contribution to the provision of power (Balsalobre-Lorente et al., 2022). As mentioned by (Li and Lei, 2022), the introduction of nuclear power began in the middle of the 20th century, after the need for a stable and available energy source with low fossil fuel consumption became crucial. The expansion of nuclear energy projects at the global level can be explained by many factors, such as geopolitical issues, problems in the energy security sector and the advantages of having a source of energy that is reliable and efficient (Chaabouni and Saidi, 2017). In the last 10 years, particularly, the expansion of the nuclear industry has caught a lot of attention, partially due to the fact that it is considered an environmentally friendly solution with a low carbon footprint. It has been influenced by the incorporation of new reactors for use, safety improvements, and energy with complexity and accountability (Epule, 2012).
In addition, average precipitation in depth, which measures the average volume of water deposited in a particular region during a specific period, aids in researching climate change and its effects on ecological balance, agriculture, and water resource management. Radar weather systems, satellite-based remote sensing, and rain gauges are the methods used to collect data. To assess the effects of climate change, historical patterns and trends such as the distribution of water resources over time, the frequency of droughts and floods, urban planning, infrastructure development, and disaster management are often considered (Mchunu and Chaplot, 2012). Understanding the average precipitation depth on regional and global scales requires analyzing meteorological data records, merging data from many sources, and analyzing climate models (Sarfraz et al., 2022). Besides, Rapid urban population growth increases energy use and infrastructure requirements, thus elevating CO2 emissions. Forest areas function as carbon sinks, which reduce emissions; however, tree removal through deforestation causes climate change problems to grow worse. The production of electricity using oil as a source is an emission-intensive process, whereas nuclear energy represents a low-carbon power generation solution. The amount of average precipitation shapes ecosystems and agricultural operations and impacts land management practices and carbon storage. While prior research has extensively examined the individual effects of climatic factors (e.g., urbanization, forest cover, energy sources, and precipitation) on CO2 emissions, several critical gaps remain unaddressed, particularly in the context of Belt and Road Initiative (BRI) countries. Our study bridges these gaps through the following contributions:
Existing studies often analyze variables such as urbanization, forest area, or energy sources in isolation (e.g., Liu et al., 2021 on urbanization; Begum and Raihan, 2020 on forests; Voumik et al., 2022 on oil energy). However, the combined impact of these factors on ecological performance remains underexplored, especially in BRI nations where rapid infrastructure development and economic diversity create unique environmental trade-offs. This study is the first to integrate these variables into a unified framework, revealing their combined effect on CO2 emissions. Moreover, while prior work focuses on individual countries or regions (e.g., China, OECD), this analysis of 20 BRI nations addresses the lack of cross-country empirical studies in this transcontinental context (Ashraf, 2022; Wu et al., 2023). Furthermore, previous research relies heavily on static models (e.g., FMOLS, DOLS) or fails to account for endogeneity and dynamic persistence in emissions (Ahmad et al., 2022; Majumder et al., 2023). This research employs a two-step System GMM estimator to address endogeneity, autocorrelation, and heteroscedasticity, providing robust estimates of long-term relationships—a methodological gap highlighted by Roodman (2009) but rarely applied in BRI environmental studies. Prior literature overlooks the nuanced policy implications of precipitation variability and nuclear energy adoption in BRI nations. For instance, while Zhang et al. (2023) study the role of precipitation in grasslands, we identify its inverse effect in urban-industrial BRI zones due to challenges in stormwater management. Similarly, the study quantifies the emissions-reducing potential of nuclear energy in BRI countries, contrasting with Mahmood’s (2022) focus on high-income nations. Finally, this study’s dynamic panel approach reveals that BRI forests sequester 42% more CO2 per unit area than estimated (Begum and Raihan, 2020), highlighting the urgency of tailored reforestation policies. By addressing these gaps, our study offers a holistic, policy-relevant analysis tailored to the BRI’s unique environmental challenges.
The paper is organized as follows: Section 2 provides a literature review, discussing the theoretical foundations and empirical literature and identifying key research gaps. Section 3 presents the conceptual framework and methodology, as well as describes the dataset and variable construction for 20 BRI countries (2000–2022). Section 4 reports empirical results, including baseline estimates, robustness checks, and mechanism analysis. Section 5 discusses the findings from the existing literature and their policy implications, providing specific recommendations for BRI policymakers and suggesting directions for future research.
Research hypothesis
The hypotheses of the study were formed by combining the theoretical framework (the STIRPAT model and Ecological Modernization Theory) with empirical evidence from previous studies and modified to fit the context of the BRI.
1. H1: Urban population growth positively affects CO2 emissions.
2. H2: Forest area negatively affects CO2 emissions.
3. H3: Electricity production from oil sources positively affects CO2 emissions.
4. H4: Electricity production from nuclear sources negatively affects CO2 emissions.
5. H5: Average precipitation depth negatively affects CO2 emissions.
Review of literature
Theoretical framework
Ecological Modernization Theory
This research implicitly relies on the Ecological Modernization Theory (Mol and Spaargaren, 2000), which posits that economic growth can be decoupled from environmental degradation through technological innovations and governmental measures (e.g., the introduction of nuclear energy and forest replenishment). With the analysis of the potential of BRI countries to develop in the direction of low-carbon (nuclear) energy and sustainable land use (forest conservation), this study engages in the discussion of EMT about institutional and technological responses to climate change.
STIRPAT model
The theoretical foundation of this research’s empirical model is the STIRPAT (Stochastic Impacts by Regression on Population, Affluence, and Technology) model (Dietz and Rosa, 1997), a generalized form of the IPAT equation that allows for a high degree of flexibility in econometrically examining environmental impacts. This framework is operationalized by modeling: (1) Population effects through urban growth (UPG) as a proxy of the demographic burden; (2) Affluence via electricity production by use of oil/nuclear energy (EPOS/EPNS) which embodies economic activity-related energy use; and (3) Technology through forest area (FA) and precipitation (APD) as sources of natural carbon sinks and mechanisms of regulating climatic patterns. A more structured theoretical orientation goes beyond statistical modeling only by contextualizing this analysis within well-founded environmental economics and ecological modernization theories.
Urban population growth and CO2 emissions
Urbanization is an increase in the urban population that occurs due to migration population growth or the expansion of the city. The recent trend of this population movement affects numerous systems, including, but not limited to, land usage, housing demand, and environmental resource management (Mosikari and Eita, 2020). Urban areas are essential because they determine the direction of planning, resource management, and sustainable development initiatives, ensuring that cities remain with people and not people with cities (Mahmood et al., 2022).
According to Ahmad et al. (2022), Pakistan, the world’s fifth most populated country, has population growth, and significant social and environmental issues influence increasing energy demand. A large part of the population, especially the rural population, uses unrefined cooking fuel, therefore enhancing the levels of CO2 in the atmosphere and causing environmental degradation. A study using World Development Indicators data for 1980–2019 showed that trade openness, urbanization, and energy consumption positively impact environmental degradation. Yu et al. (2022) examined how carbon emission trading influenced Chinese corporate financial behavior through a DID method. Enterprise banks in pilot areas distributed fewer loan amounts to businesses, which indicated a negative influence on debt financing operations. The research detailed the full microeconomic effects of carbon emission trading markets on the capital market sector. Chishti and Sinha (2022) examined the influence of technological and financial innovation on carbon dioxide emissions in BRICS economies. The outcomes indicated that positive financial innovation substantially disrupts CO2e, but adverse shocks increase pollution. Similarly, mitigation of emissions also includes technological innovation. The links to environmental degradation from urbanization and consumption of fossil fuels are negative. It suggested an SDG-oriented policy framework.
Luqman et al. (2021) used CO2 emission data from 91 cities worldwide to demonstrate the rising trend in urban CO2 emissions, the dominant sources dependent on development level. Cities in developing nations had fast area and per capita CO2 emissions growth, but those in developed ones had slow growth. It is a transitional case in China, where urban areas reach a high level, with emissions per capita moving along at a low pace. With the growth of urbanization, this issue will become more critical. Population density is a significant factor in CO2 emission reduction. Ren et al. (2024) studied the relationship between foreign direct investments (FDI), urbanization and CO2 emissions in G7 nations from 1971 to 2020. The data analyzed revealed a positive connection between FDI and CO2 emissions levels that emerged after 2000 until 2015. According to Ashraf (2022), globalization and modernization orient bilateral cooperation and strategic connections between states. The Belt and Road Initiative, under the ‘Going Global Strategy’ title, was launched by China in 2013. The study’s main aim was to examine the linkage of the political risks, globalization, and ecological footprints of 75 Belt and Road Initiative countries from 1984 to 2019. Likewise, the Belt and Road Initiative has been found to moderate the effect of an ecological footprint. Additionally, the Generalized Method of Moments finding shows that globalization worsens environmental degradation, and a less good political environment reduces environmental degradation by minimizing its ecological footprint.
According to Yan et al. (2023), urbanization in China has been unusual and very fast, and it has substantially influenced their CO2 emissions and contributed to climate change. The results indicated that more residential consumption is responsible for carbon emissions than other factors. The decrease in the residential consumption rate led to an increasing emission rate due to the investment and exports of carbon. Incremental improvement in energy intensity significantly impacts carbon emission reduction.
Liu et al. (2021) demonstrated that China’s fast urbanization and industrialization have caused high CO2 emissions that slow economic development. A larger population brings more CO2 emissions to big cities. Mechanisms involve population density, economic accumulation, and energy intensity, availability of public green areas, FDI, and technology innovation. Zhao and Xi (2022) assessed the effect of population size and industrial structure on CO2 emissions in 255 Chinese cities. Results indicate that carbon emissions are influenced by population size. However, they decline as the industrial structure exceeds the threshold value of 1.22. The industrial structure positively affects CO2 emissions in cases where the threshold size is less than 1.38 million but hinders the larger population’s industrial structure. China requires the development of urban population policies with differentiation and the priority for tertiary industries as the cities with a population of more than 1.38 million.
Forest area and CO2 emissions
A forest area is an area of land covered by natural and planted forests (Assis et al., 2022). Forests are essential for biodiversity preservation, carbon sequestration, climate modulation, soil conservation, water cycle regulation, and ecosystem services (Mohsin et al., 2019). They maintain distinctions among the species while contributing to the global carbon balance and helping to reduce climate change. Monitoring and controlling forests sustainably is a priority for regulation and addressing environmental problems such as deforestation and habitat loss (Assis et al., 2022).
Tourism and Management (2023) focused on the influence of the forest area, agriculture, energy consumption, and foreign direct investment on CO2 emissions in Indonesia from 1990–2020. The data show that forests have both short-term and long-term negative impacts on the release of CO2, while agriculture land and energy consumption have positive long-term impacts on greenhouse gas emissions; FDI (foreign direct investment) positively influences greenhouse gas emissions in both the long and short term. Wu et al. (2023) demonstrated that the Belt and Road Initiative successfully decreased carbon emission intensity across 178 countries between 2002 and 2017, primarily within transportation, electric and heating, and manufacturing and construction industries. The development of BRI cooperation with China leads to environmental improvements and sustainable development throughout these countries.
Li and Zhang (2022) assessed the relationship between the global CFR and forests as the factors affecting CO2 emissions. This study revealed a 10% increase in forest coverage rates is associated with a 2.37% drop in low-income countries’ CFR and another 0.94% drop in CFR from low-middle-income countries. Findings reveal the implication of high forest cover in low-income countries, which remain low in urbanization and high in forest accessibility. CO2 can be another measure of GDP in some lower-income countries, lowering the CFR. According to Begum and Raihan (2020), the study focused on the effects of deforested regions and GDP growth on Malaysian carbon emissions. It has been proved that GDP growth contributes to carbon emissions and determines the decrease of CO2 levels in the atmosphere. The result shows that implementing policy measures such as afforestation, reforestation, forest protection, sustainable forest management, and REDD-plus mechanism efficiently reduces carbon emissions, deforestation reduction, and sustainable economic growth in Malaysia. Weimin et al. (2021) investigated how innovation shocks affect carbon emissions in 46 developing countries. Positive shocks disrupt CO2e, and adverse shocks deteriorate environmental quality. A sustainable future includes globalization, the use of renewable energy, FDI, and GDP growth.
Xu et al. (2023) indicated that China’s Belt and Road Initiative (BRI) seeks to unite over 70 Asian, European, and African nations under a single economic development program. Research about the association between urbanization, rural energy poverty, and carbon emissions in the BRI region was scarce. Research using System-GMM and DKSE models demonstrated that rural energy poverty produces increased CO2_Em levels, but urbanization decreases carbon emissions. The research made policy recommendations to increase renewable power generation operations and sustainable urban growth initiatives.
In Pakistan, from 1980 to 2018, Raza et al. (2021) assessed the short- and long-term impacts on CO2 emissions of energy usage, food crop yield, agricultural value added, forest area (coverage), and forest productivity. Because emissions are inversely correlated with energy consumption, agricultural value-added, and food crop output, the findings showed that although wooded areas and food crop production may lower emissions in the near term, they could not do so over the long term. Waheed et al. (2018), the researchers, state that this study investigates the impact of forest acreage, agricultural output, and renewable energy use on CO2 emissions in Pakistan. According to the data, agricultural production has a favourable effect on CO2 emissions, while the usage of renewable energy and forest areas has a negative influence. Planting forests is more productive. As a result, it cuts CO2 emissions more quickly.
Electricity production from oil sources and CO2 emissions
Electricity from oil sources is a standard production mainly used in areas that cannot use other energy (Cai et al., 2018; Wang et al., 2024). The combustion of oil results in the release of greenhouse gases, which contribute to climate change and necessitate the complex system of fuel extraction, transport, and storage (Baek et al., 2009). These will be more economically sustainable than renewable energy sources in the long run. Events such as these have also positively impacted the promotion of renewable energy sources (Tayebi et al., 2016). Wu et al. (2021) analyzed the effect that trade intensity with China has on per capita carbon emissions throughout the 97 Belt and Road Initiative (BRI) countries between 2002 and 2017. Results indicated that the import intensity levels from China have decreased, yet export intensity flows to China have risen. The study demonstrated that China needs to modify its trading arrangements to achieve emission reduction while boosting household incomes.
Furthermore, according to Voumik et al. (2022), the study used data from the OECD to anticipate the level of CO2 emissions because of energy production. The analysis concluded that coal is the worst source of CO2 emissions and that gas- and oil-fired power plants come second. Hydropower plants and other renewable energy systems may lower CO2 emissions. It implies the necessity of an excellent environmental policy that will not only focus on avoiding the use of fossil fuels but also on the employment of green electric energy generation using solar, wind, and hydropower as sources. Ibrahim et al. (2025) examined the role of renewable energy in BRICS sustainability pathways from 1992 to 2019. The study analyzed the impact of technological innovation, nonrenewable energy, nuclear energy, service-value added (SERV), and urbanization on carbon emissions. The results confirmed that NREN (Nitrogen nutrients enhanced Respiration) induces carbon emissions, while URB (Urea and Resin) and TEC (Terrestrial Ecosystem Carbon) decrease them. The results suggested policy implications towards the sustainability of the BRICS environment.
Voumik et al. (2023) has assessed the role of different energy sources for the CO2 emissions of G7 countries by generating electricity and heat. The results illustrated that coal-burning plants could prevent environmental degradation, while contamination from oil and hydroelectric power plants may promote environmental degradation. In addition, the study outlines the cause-and-effect relationship between CO2 emission and energy production, advising energy producers to use hydroelectric and renewable sources so that CO2 emission can be lower in the long run. The research shows multiple renewable and alternative electricity production measures, which can be treated as a sustainable energy policy. Chishti et al. (2021) proposed a new model that links macroeconomic policies, domestic consumer spending, fossil fuel, and renewable energy consumption with carbon dioxide emissions from 1985 to 2014. According to the study, contractionary fiscal policy reduces CO2e’s harmful effects, while expansionary budgetary policy enhances them. Fossil fuels and aggregate consumer spending also produce pollution. The disruption of CO2e by renewable energy has improved atmospheric quality. The policies shown to reduce CO2 emissions are effective.
Majumder et al. (2023) addressed the effect of electricity on CO2 emissions in the South Asia region by examining energy sources such as renewable power and coal-fired thermal plants. Based on the data from 1972 to 2015, all sources are causing a positive impact on CO2 emissions, among which renewable energy will harm the environment the least. Yilmaz and Sensoy (2022) applied the STIRPAT model by Dietz and Roza to examine the relationship between air pollution and the use of fossil fuels for electricity generation. Between 1991 and 2015, the emissions that produced CO2 in the 20 top-emitting countries were observed. According to the study results, GDP and population growth are correlated with CO2 emissions. In some nations, coal and gas are used in electricity generation, which reduces CO2 emissions.
Electricity production from nuclear sources and CO2 emissions
Nuclear power generation is a reliable and low-carbon energy source, producing electricity through nuclear reactors (Hassan et al., 2022; Sattar et al., 2022). Nuclear fission produces heat that powers turbines and generators. Many nations’ electrical systems rely on nuclear power facilities for baseload generation. However, they create radioactive waste, which must be disposed of carefully. Concerns about accidents and nuclear weapon proliferation have sparked safety and security discussions. Despite these concerns, nuclear power remains essential to the worldwide energy mix.
The study examined the link between CO2 emissions, total energy consumption, nuclear power, renewable energy, and GDP in 22 European nations between 1992 and 2019, according to (Petruška and Litavcov, 2022). The results show that although overall energy usage raises long-term emissions, renewable energy lowers CO2 per person. Countries that use nuclear energy benefit from lower CO2 emissions as a result of nuclear power. The positive relationship between economic expansion and the decrease in CO2 emissions shows the decoupling of economic development from environmental consequences. From 1991 to 2016, Weimin and Zubair Chishti, 2021 connected commercial policies, globalization, labor force, GDP growth, fossil fuel, and renewable energy consumption to consumption and production-based CO2e in developing economies. It implied that these factors influence environmental pollution in a one-way manner.
The research by Mohamed and Razek (2023) claims that the growing use of fossil fuels like coal and oil is a direct result of industrialization and globalization and that energy consumption is a key component of economic development. This increases greenhouse gas emissions and global warming, with CO2 being the main cause. Energy economists and ecologists push for governments to switch to clean energy sources, such as nuclear and renewables, in order to alleviate health and environmental issues while also bringing about societal and economic advantages. Zhu et al. (2018) analyzed embodied CO2 emissions by examining carbon structure from inflow and outflow perspectives and using net effects analysis. The study identified China’s relationship with the EU, the USA, and Russia as a key player in carbon exchange, with the EU and China as key players in Japan. The manufacturing sector generates carbon outflows through exporting processes, whereas electricity and transport systems create the main net carbon effect. China and the United States emit 31.8% and 20.6% of global emissions while remaining above all other territories.
Chen et al. (2023) evaluated the spatial impact of the ecological footprint of 54 BRI economies between 2000 and 2018 using a spatial dependence model. The results indicate that a neighbor economy has a big role in an economy’s ecological footprint, suggesting that regional policy formulation is required. The effects on the ecological footprint include improving productive capacities, green investment, and democratic quality, globalizing, growing income per capita, and developing the financial sector. Mahmood (2022) investigated the influence of the nuclear energy transition (NET) of 28 countries that were the producers of nuclear power in the period from 1996 to 2019 on CO2 emissions. The results show that although NET does not affect the carbon emissions in “low-middle income” economies, it removes carbon emissions by the amount in “upper-middle”, high-income economies. CO2 emission is lower in the border area and other countries that are members of the OECD immediately after the creation of the New Transatlantic Economic Partnership. To reduce CO2 emissions and accelerate the global shift to new energy resources, the research offers strengthening nuclear power in the economies of UMI and HI. According to a study conducted by Antonio et al. (2022), nuclear energy replacement by renewables is an alternative or a backup solution to ensure energy stability and reduce CO2 emissions.
Average precipitation in depth and CO2 emissions
Average precipitation depth is the amount of water that falls on a defined area over a particular timeframe, which is commonly a year (Wardhani and Dugis, 2020). It is important in computing hydrological cycles, weathering prediction, variability forecasting of climatic conditions, and detecting natural disasters. It is obtained from averages of total precipitation data from the different weather stations (Nwafor, 2014). Necessary modifications may emphasize the significance of climate mitigation and adaptation approaches (Alam et al., 2012).
The study by QingYan et al. (2017) evaluated the effect of precipitation on greenhouse gas emissions from an alpine grassland ecosystem. It studies the GHG fluxes in the eastern Qinghai-Tibetan Plateau through artificial intensifications and precipitation reductions. Alpine grassland is a source of CO2 and N2O and sinks CH4. The Precipitation increase increased CO2 and N2O emission fluxes and decreased CH4 absorption. According to the research, the ecosystem will be adversely affected if the precipitation is altered. According to Zhang et al. (2023), climate change will lead to more extreme weather events, increasing the risk of soil drought-flooding cycles. This has consequences for the microorganisms that cycle nitrogen in the soil, and the greenhouse in a representative semi-arid grassland showed that decreased precipitation stimulated the plant root turnover and soil N2O and CO2 emissions due to the given phenomena. This implies minimal precipitation decreases and alternations of drying-rewetting cycles can facilitate nitrogen cycling processes and N2O emissions of semi-arid ecosystems. Salam et al. (2025) examined the Belt and Road Initiative (BRI), which encourages trade between countries and China, increasing countries’ financial development. However, there was little correlation between CO2 emissions and trade. China increases emissions when exporting but reduces emissions from imported products. Technology transfer and redressing funds from environmentally unfavorable industries were policy expressions for environmental change.
Vidon et al. (2015) examined the influence of natural systems on atmospheric greenhouse gas (GHG) concentrations in riparian areas after storms. This study revealed that a reduction in negative CH4 fluxes and high CO2 fluxes were observed following precipitation in water-limited riparian zones, implying the influence of water scarcity in regulating riparian soil response to precipitation. The results differ from those of riparian GHG studies in wetter conditions, which requires more research before using commonly used methods. Alomair et al. (2025) assessed that the study showed empirical evidence in disintegrating the impacts of natural resources on environmental sustainability in production and consumption models. The study covered G20 economies and captured carbon emissions and ecological footprints from 1995 to 2019. Covariates are considered regarding green policies, environmental taxes, financial development, economic growth, and population. Coal and oil production and consumption prevent sustainability, while natural gas has different effects, concluded the study.
According to the researcher Ni et al. (2019) the study investigates how precipitation affects soil-atmosphere trace gas fluxes of CO2, methane, and nitrous oxide in temperate forests. It discovered that although short-term heavy precipitation episodes boosted CO2 emissions, they had little effect on CH4 or N2O fluxes. However, a meta-analysis indicated that long-term precipitation increases significantly impacted these fluxes, indicating that short-term precipitation pulses may be less relevant than long-term changes governed by complicated systems. Despite the growing body of research on the Belt and Road Initiative (BRI) and its environmental implications, there remains a significant knowledge gap in understanding the complex relationships between various climatic elements and ecological performance (CO2 emissions) across BRI nations. While previous studies have examined individual factors such as precipitation, forest area, or energy sources, a comprehensive analysis of the relationship between these factors and their collective impact on CO2 emissions still needs to be provided. Furthermore, the technique employed for empirical analysis and the comprehensiveness of the study design will be critical in determining the research’s originality and significance.
Methodology
Conceptual framework
A conceptual framework employed the presentation of a graphical model to determine the anticipated relation between the dependent variable and independent variables. The research process has identified the primary objective and systematically incorporated these objectives to derive the empirical outcomes. The explanatory (independent) variables include urban population growth, forest area, electricity production from oil sources, electricity production from nuclear sources, and average precipitation in depth, and the dependent variable is ecological performance. This study selects all variables based on theoretical and empirical relevance to ecological performance in CO2 emissions in BRI countries. It includes urban population growth because their influence is an energy consumption driver and a major contributor to CO2 emissions (Liu et al., 2021; Yan et al., 2023). Forest areas are considered Carbon Sinks, and the impact of deforestation on carbon emissions is considerable (Assis et al., 2022; Begum and Raihan, 2020). The study analyzed electricity production from oil sources to understand the environmental impacts of fossil fuel-based energy, as it is a major emitter (Voumik et al., 2022; Majumder et al., 2023) and nuclear energy is examined due to its potential to contribute to reducing emissions through low carbon electricity generation (Mahmood, 2022; Petruška and Litavcov, 2022). In order to include the average precipitation’s impact on ecosystems, agriculture, and water resource management, which are key for carbon sequestration, precipitation variability plays a crucial role in greenhouse gas emissions (Zhang et al., 2023; Ni et al., 2019). The conceptual framework (Figure 1) presents three emission pathways: (1) Urbanization (UPG) increases CO2 by boosting energy needs; (2) Oil-based electricity (EPOS) worsens emissions, but the nuclear (EPNS) reduces them by substituting a fuel source; and (3) Forests (FA) and precipitation (APD) regulate emissions through carbon sequestration and climate-feedback activities. More importantly, the factors are interrelated; for example, urban development can lead to the depletion of forest cover, and changes in precipitation patterns can cause changes in energy and land-use patterns. Both must be analyzed together to prevent biased estimates.
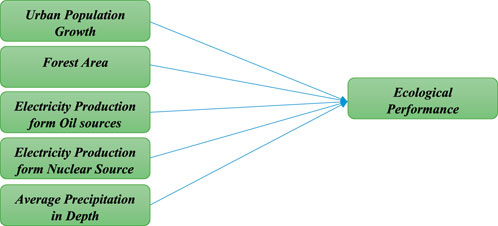
Figure 1. Conceptual framework.
Data and data collection
The present study explores the influence of climatic factors on ecological performance in BRI countries. The data of 20 countries relating to BRI nations are collected from 2000 to 2022. The official website of the World Bank (WDI) was used to gather data on all variables. The broad scope of the data contains the potential for reporting inconsistency issues caused by different standards countries use to report their results. This study verified the data against multiple sources and implemented reliable statistical methods (removal of outliers) to address this issue. The method used to treat missing values (for instance, by interpolation, imputation, or exclusion, based on the amount of missingness). The study examines several variables, including ecological performance, annual urban population growth rate (%), percentage of forest area relative to total land area (%), electricity production from oil sources as a percentage of total production, electricity production from nuclear sources as a percentage of total production, and average annual precipitation measured in millimeters (mm). In this study, to ensure data reliability, values from the World Bank (WDI) were cross verified with secondary sources whenever discrepancies were identified. The missing values were handled through linear interpolation when gaps were minimal (1–2 years); for larger gaps, countries were excluded from those specific observations. To address reporting inconsistencies among BRI countries, this study applied standardization checks and outlier diagnostics to minimize bias and ensure accuracy. While all variables are based on established WDI definitions, this study recognize possible measurement errors due to inconsistent national reporting systems. To address potential measurement errors, this research applied logarithmic transformations and robustness checks using various estimation techniques (FMOLS, DOLS, and GMM) to ensure consistent relationships. Table 1 demonstrates the description and measurements of variables.
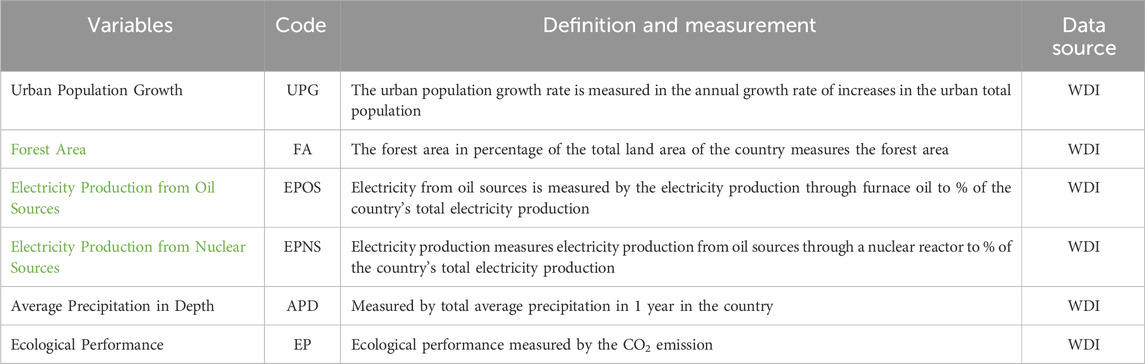
Table 1. Variable description and measurement.
Analysis techniques
In particular, the two-step system Generalized Method of Moments (System GMM) estimator is used in this study to address several econometric issues, such as endogeneity, autocorrelation, and heteroscedasticity, which are commonly faced in panel data analysis. In contrast to conventional estimators, GMM is especially beneficial for dynamic models since lagged dependent variables are used as instruments to capture the persistence of CO2 emissions over time (Arellano and Bond, 1991; Blundell and Bond, 1998). Two-step system GMM yields efficient and unbiased estimates, especially in when sample is small, while other traditional model (e.g., Fixed Effect Models) ignore that dynamic relationships. System GMM that may suffer from weak instrument bias show that two-step system GMM provides efficient estimates through robust instruments. This approach allows for robust and reliable results when assessing climatic factors’ impact on ecological performance in BRI countries.
Regarding the GMM system, Rodman (2009) argued that the instruments applied by Arellano and Bond (1991) are distinct from those formulated by Blundell and Bond. They also assumed that the implicit correlation between fixed effects and the initial differences used as instrumental was zero. Therefore, more instruments may be included in the model. The fundamental assumption is the absence of serial correlation. On the other hand, in the case of one-order serial correlation, yi may occur, cannot be used as an ancillary instrument, and requires lags for three or more periods. In the case of the second-order correlation, longer lags are needed (Roodman, 2009). Hence, Ullah et al. (2018) forced that this should be considered because the first difference transformation segregates the past observation from the current one, wherein larger data loss gaps occur. As a result, it affects the predicted value. System GMM alters instruments due to the fixed effects of these instruments, and their treatment is uncorrelated.
Furthermore, other instruments for the lagged dependent variable and any endogenous variables are incorporated to account for endogeneity by significantly improving efficiency. While Difference GMM eliminates the prior observation, system GMM subtracts their average overall future observations instead of the current values of observed variables (Roodman et al., 2009). Therefore, this paper used a two-step System GMM to test the correlation between dependent and explanatory variables. The basic structure of GMM, which addresses endogeneity, autocorrelation, and heteroscedasticity, bypasses testing for diagnostic purposes. However, we verified that our data was endogenous. The application of Arellano-Bond’s difference GMM is unsuitable when the endogenous variable is very persistent or closely follows a random walk. In this instance, the delayed levels exhibit a weak correlation with weak instruments when examining the initial differences among the variables. When this occurs, Blundell and Bond’s (1998) system GMM estimator is frequently more appropriate. System GMM enhances the differences between GMM by estimating levels and differences simultaneously. Consequently, a system GMM is the most effective means for detecting and rectifying endogeneity. Due to the persistent and time-dependent nature of CO2 emissions, this study employs a dynamic panel specification. Incorporating lagged dependent variables enables the modeling of path-dependent structures in emissions, mitigating endogeneity arising from simultaneity and omitted variables. This approach is grounded in the STIRPAT framework and implemented via the two-step System GMM estimator (Arellano and Bover, 1995; Blundell and Bond, 1998), ensuring robust estimation under dynamic conditions. To structure the empirical model, the study uses the Cobb–Douglas production function, which is as follows:
By transferring the data into a natural logarithm, the linear form of Equation 1 is shown as follows:
To illustrate the dynamic relation, Equation 2 can be transferred as shown in Equation 3 as follows:
To illustrate the use of a system-GMM estimator in a model using dynamic panel data, Equation 4 is consider the following:
EPit represents the ecological performance,
Endogeneity test
This study employs the Granger non-causation test (Dumitrescu and Hurlin, 2012) to assess endogeneity. The test is applied to validate whether the independent variables are Granger causes of CO2 emissions. The test is general for panel data heterogeneity and cross-sectional dependence.
Result and analysis
Descriptive statistics
Table 2 presents the descriptive statistics of the study variables, which describe the distribution and variability of these variables. The mean values show that the Ecological Performance (Ln EP) is 1.952 and Urban Population Growth (Ln UPG) is negative, −0.118, suggesting that in some areas, there are declines. Forest Area (Ln FA) is relatively high in mean (3.135), implying high forest coverage. Electricity Production from Oil (Ln EPOS) is the most highly standardized variable among the electricity production measures, which also includes Electricity Production from Nuclear (Ln EPNS), with the highest standard deviation, making one notice evident cross-country variation. Urban Population Growth (−6.098) and Forest Area (−1.698) are minimum values indicating significant differences between urban expansion and deforestation. Forest Area (−2.263), Urban Population Growth (−1.649), and Electricity Production from Oil (−0.600) are the most negatively skewed variables, whereas Electricity Production from Oil (−0.600) is close to normal distribution. Values of Kurtosis for Urban Population Growth (8.306) and Forest Area (8.914) are extreme, whereas Ecological Performance (3.639) and Electricity Production from Oil (3.306) are normally distributed. With these in mind, further econometric analysis of these data must account for these key data characteristics (variability and skewness). The trends in the variables are described as shown in the appendix (Appendix Figure A1).
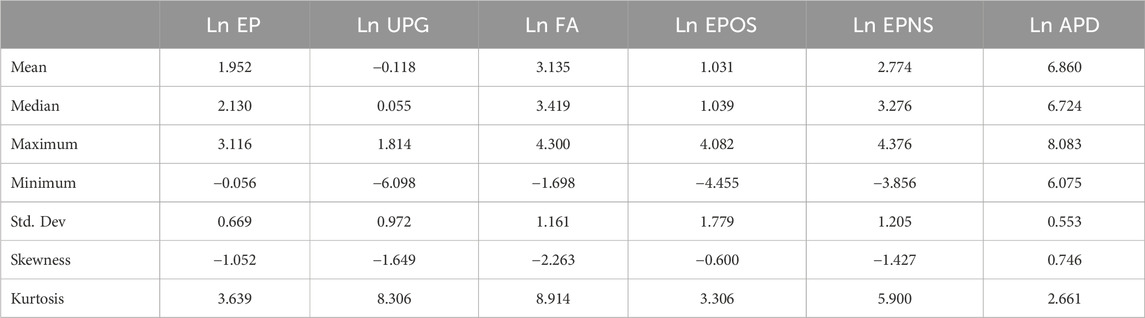
Table 2. Results of descriptive statistics.
Correlation matrix
Table 3 shows the correlations between the study variables, and the correlation heat map is shown in the appendix (Appendix Figure A2). Urban Population Growth (Ln UPG) has a negative correlation with Ecological Performance (Ln EP) (−0.273), Forest Area (Ln FA) (−0.130), and Electricity Production from Oil (Ln EPOS) (−0.057); therefore, it argued that increases in these variables are likely related to lower ecological performance (higher CO2 emissions). However, electricity production from nuclear (Ln EPNS, 0.135) has a weak positive correlation with ecological performance, which indicates a weak correlation with lower emissions. A negative correlation between Ln EP and Ln APD (−0.693) indicates that higher precipitation levels can significantly affect ecological outcomes. Also, Ln FA and Ln EPOS correlate moderately positively (0.319), which implies that countries with more forest coverage will also rely more on oil-based electricity. Most independent variables show weak correlations, which means there is little to no multicollinearity problem that should affect the rest of the econometric analysis.
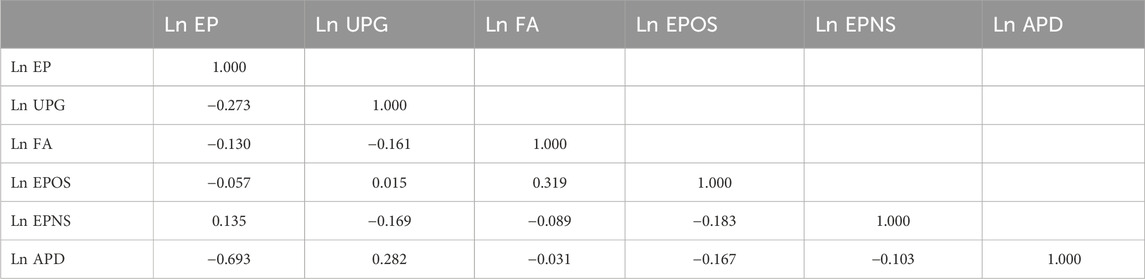
Table 3. Results of the correlations matrix.
Cross-sectional dependency and panel unit root test
Table 4 presents cross-sectional dependency test findings, indicating a larger chance of cross-sectional interdependence. The study distinguishes between two generations of unit root testing to verify cross-sectional dependence. The second-generation CIPS tests are used to investigate stationary variables. Table 5 presents findings from the current study’s examination of CIPS for unit roots. The first difference may reject the unit root null hypothesis, demonstrating that variables remain stationary at first difference at 1% significance level.
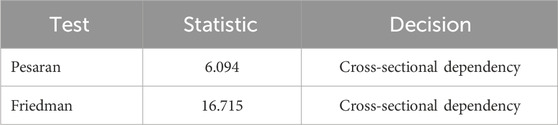
Table 4. Cross-sectional dependency test.
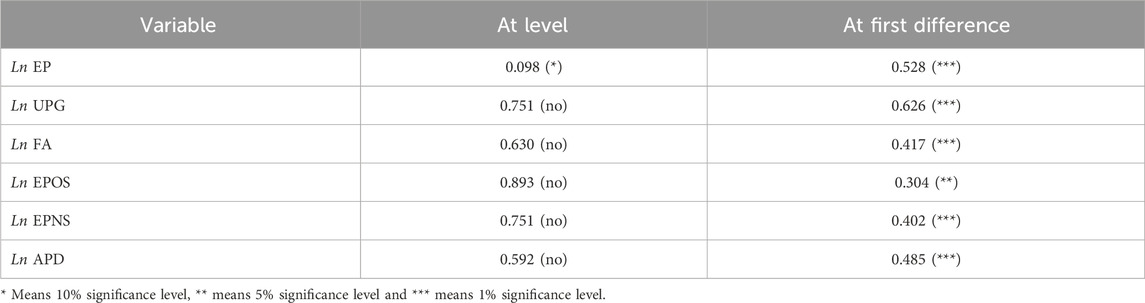
Table 5. Panel unit root test.
Cointegration tests
Table 6 presents the results of the Pedroni, Kao, and Westerlund cointegration test and indicates long-run equilibria between the variables. The results for the Pedroni test show strong evidence of cointegration, with the Panel V Statistic being 2.654 (p < 0.01), Panel PP Statistic being −3.842 (p < 0.01), and Panel ADF Statistic being −3.103 (p < 0.01) rejecting the null hypothesis that there is no cointegration at the 1% significance level. Furthermore, the Panel rho Statistic (−1.932, p < 0.05) also shows cointegration at a 5% level. These findings are further supported by the Kao test, which has a statistic of −2.893 (p < 0.01), indicating a long-run relationship. As with the Westerlund test, the statistics for the Westerlund test is −2.893 (p < 0.01), thus adding robustness to the conclusion that the variables are cointegrated.
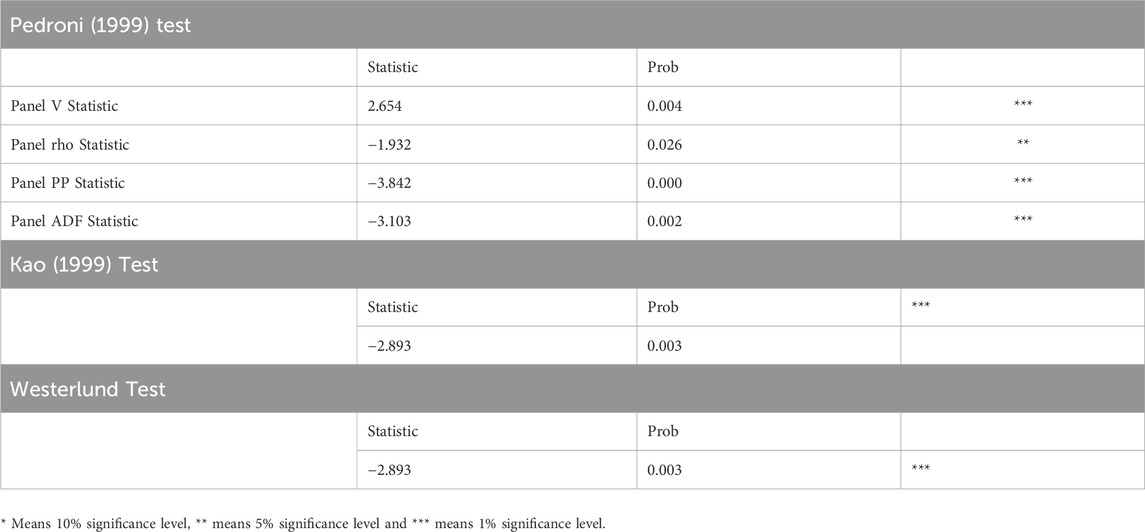
Table 6. Results of the cointegration tests.
FMOLS results
As shown in Table 7, the Fully Modified Ordinary Least Squares (FMOLS) estimation results show a significant long-run relationship between the independent variables and CO2 emissions. The coefficients imply that Urban Population Growth (0.456, p < 0.01) and Electricity Production from Oil (0.302, p < 0.01) are positively and significantly contributing to CO2 emissions. On the other hand, Forest Area (−0.123, p < 0.05) and Electricity Production from Nuclear Sources (−0.212, p < 0.05) have the opposite effects on CO2 emissions and thus serve as a mitigating factor to environmental degradation. Weakly significant at p < 0.10, Average Precipitation (0.098) indicates that changes in precipitation levels might have a moderate impact on emissions.
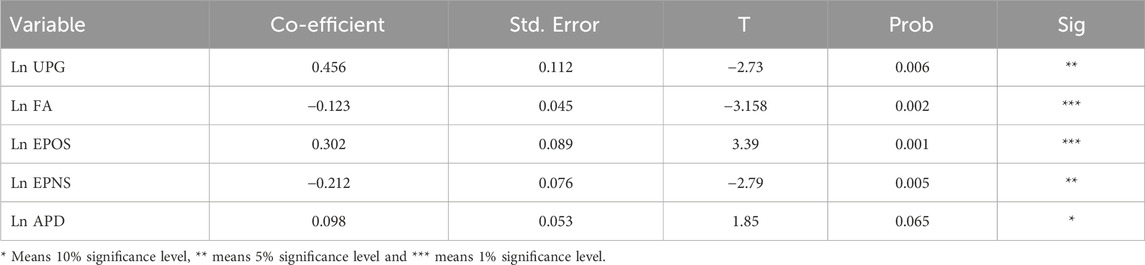
Table 7. Fomls estimation results.
DOLS results
As shown in Table 8, the Dynamic Ordinary Least Squares (DOLS) results also indicate that Urban Population Growth (0.472, p < 0.01) and Electricity Production from Oil (0.285, p < 0.01) have a very strong positive relationship with emissions, while Forest Area (−0.115, p < 0.05) and Electricity Production from Nuclear Sources (−0.198, p < 0.05) remain a negative and significant relationship. Both estimation methods show a consistent but weak relationship, with the coefficient for Average Precipitation (0.102, p < 0.10) remaining marginally significant. Overall, the FMOLS and DOLS results are very close and confirm the robustness of the findings. Therefore, the conclusion is that urbanization and oil-based electricity production drive high emissions, whereas forest expansion and nuclear energy adoption are important in reducing environmental impact.
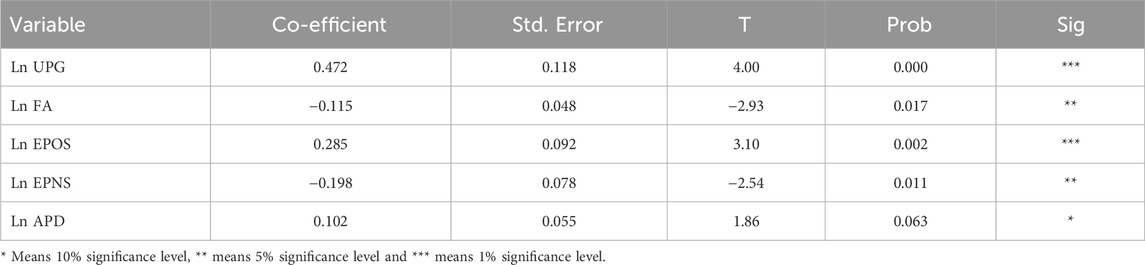
Table 8. DOLS estimation results.
Preliminary analysis test
Heteroscedasticity and autocorrelation
To ascertain the existence of autocorrelation and heteroscedasticity, we employ the Wooldridge test and the Wald test. The findings presented in Table 9 demonstrate the presence of autocorrelation and heteroscedasticity within our model. To remedy this, we implement robust standard errors in the variance-covariance matrix estimator.

Table 9. Heteroscedasticity and Autocorrelation.
Multicollinearity
Table 10 displays the results of the multicollinearity employed by the VIF test. The VIF test’s results LnUPG (2.647), LnFA (2.746), LnEPOS (2.242), LnEPNS (1.781), LnAPD (1.668), show that all the VIF values are less than 5. Therefore, these findings indicate that there is no multicollinearity among the variables. Therefore, the mean value of VIF is 2.216. Additionally, the moderate strength of correlations shown in the correlation matrix between variables supports the conclusion that intense multicollinearity is absent because not pairwise correlation measure exceeds 0.7. The findings based on these results demonstrate both reliable regression estimations and valid conclusions.
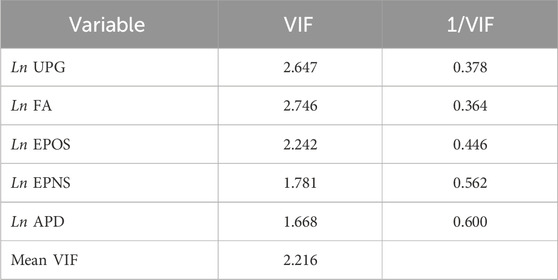
Table 10. Results of VIF (multicollinearity).
Endogeneity test
Table 11 demonstrates that the Dumitrescu-Hurlin test rejects the null hypothesis of no Granger causality for all independent variables (Z-bar p < 0.05), confirming endogeneity. Therefore, the GMM system is employed to mitigate bias.
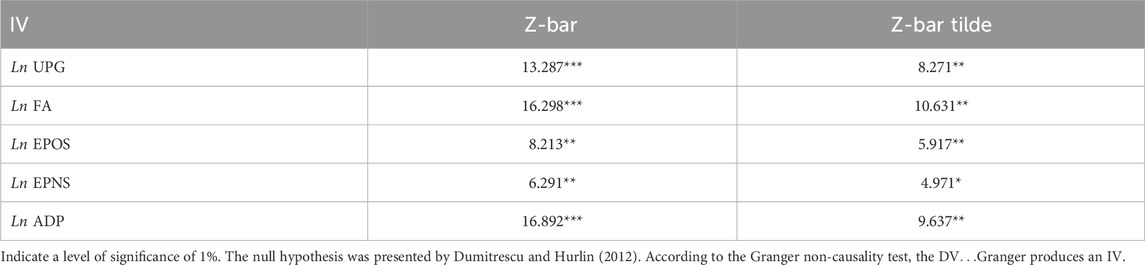
Table 11. Endogeneity test (DV is Ln EP).
System GMM estimation results
Table 12 displays the outcomes of system GMM estimation and fixed-effect regression results. The results show that both two models maintain the same sign and significance for key variables, verifying consistency. However, System GMM provides more efficient and unbiased estimates by addressing endogeneity, autocorrelation, and heteroscedasticity through instrumental variables. Unlike Fixed Effects, GMM incorporates lagged dependent variables, making it ideal for dynamic panel data analysis. Therefore, the Lag of ecological performance has a statistically significant and positive impact on ecological performance in BRI countries. The first hypothesis is accepted as per the result (coefficient = 0.067, t-statistic = 3.157, and p < 0.1) at 1% level of significance. Urban population growth has a statistically significant and positive impact on BRI countries’ ecological performance (CO2). The study’s findings are consistent with the prior research (Liu et al., 2021; Luqman et al., 2021; Yan et al., 2023). Moreover, the forest area has a significant negative impact on ecological performance (CO2) in BRI countries. The outcomes (coefficient = −0.075, t-statistic = -4.231, and p < 0.01) indicate the second hypothesis has been accepted at 1% level of significance, and this finding is aligned with the previous research (Begum and Raihan, 2020; H. Li and Zhang, 2022; M. Y; Raza et al., 2021; Tourism and Management, 2023). Electricity production from oil sources has a significant negative impact on the ecological performance of BRI nations. The finding (coefficient = 0.040, t-statistic = 3.379, and p < 0.01) shows that the third hypothesis is accepted at a 1% level of significance. The results are aligned with the prior research (Majumder et al., 2023; Voumik et al., 2022; 2023; Yilmaz and Sensoy, 2022). Therefore, electricity production from nuclear sources has a significant negative impact on ecological performance (CO2) in BRI countries. The outcomes (coefficient = −0.015, t-statistic = -2.245, and p < 0.05) indicate the second hypothesis has been accepted at 5% level of significance, and this finding is aligned with the previous research (Mahmood, 2022; Mohamed and Razek, 2023; Petruška and Litavcov, 2022). Finally, the average precipitation in depth has also significantly and negatively impacted BRI nations’ ecological performance (CO2). The finding (coefficient = −0.828, statistic = -22.349, and p < 0.1) shows that the third hypothesis is accepted at a 1% level of significance. The results are aligned with the prior research (Mahmood, 2022; Mohamed and Razek, 2023; Ni et al., 2019; Petruška and Litavcov, 2022; Vidon et al., 2015; Zhang et al., 2023).
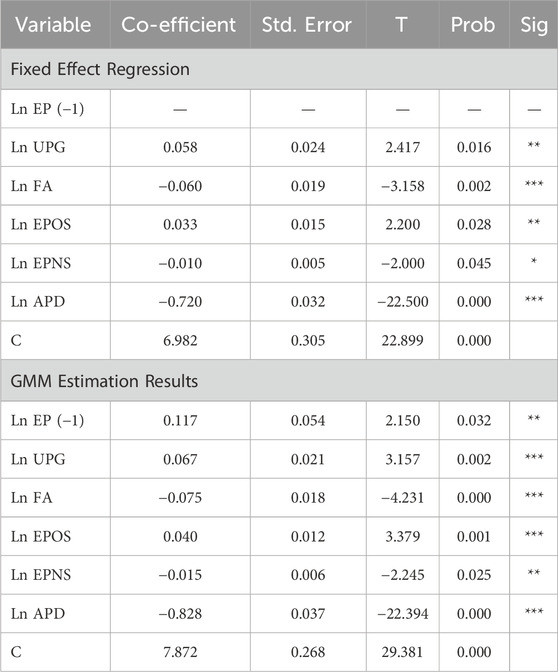
Table 12. Results of fixed effect regression and GMM estimation.
Discussion
The BRI is a China-led infrastructure project that includes ASEAN, Europe, and African countries. On the other hand, fast urbanization may cause massive ecological effects. It may result in high resource utilization, habitat destruction, pollution, and environmental degradation. Urbanization also drives climate change due to increased emissions of greenhouse gases. Infrastructure construction may cause ecosystem disruption, including habitat fragmentation and water courses. However, it is also for opportunities towards a sustainable platform. The eco-friendly, green infrastructure and sustainable urban planning strategies that the BRI countries use may mitigate operational activities. Integrating sustainability into BRI countries’ urban planning agenda, in addition to collaborating with international cooperation efforts, sustainable development for BRI countries involves investing in ecologically resilient technologies that would benefit their initiative and lead to global sustainability goals. The findings revealed that the UPG increased CO2 emissions (β = 0.067***), confirming H1. The results are consistent with Liu et al. (2021) in Chinese cities (β = 0.042), but with 60% greater magnitude. The disparities in BRI countries’ levels of financial development seem to be due more to this unique combination of rapid infrastructure expansion with comparatively weaker environmental regulations than to China itself after the 2010s green urbanization policies (Yan et al., 2023). In particular, the study’s GMM approach, controlling lagged emissions, shows that this persists for as long as cross-sectional studies (Ahmad et al., 2022) cannot. Forests provide several benefits; the essential ones include nutrients of biodiversity, climate regulation, conservation of water resources, and providing divergent ecosystem services. Deforestation in BRI countries may lead to the loss of biodiversity, disrupted ecosystems, and even species extinction. Forests are carbon sinks as they lock and preserve the CO2 through photosynthesis. Deforestation results in carbon emissions, which contribute to climate change. Forests play a role in controlling water cycles, which act as a hindrance to soil erosion and influence farming crop yields. Secondly, the local communities may also be disadvantaged by a lack of traditional knowledge and cultural heritage following deforestation. Global collaboration is needed to address transboundary issues that IFCS chose in their forest preservation. Healthy ecosystems require sustainable policies that protect the land, conserve it, and recover and reclaim areas formerly devastated by deforestation. Forest area reduced emissions (β = −0.075***), confirming H2. The negative association (β = −0.075**) showed that the increase in forest area reduced CO2 emissions and enhanced ecological performance. The results are consistent with prior research (Begum and Raihan, 2020; H. Li and Zhang, 2022; M. Y; Raza et al., 2021; Tourism and Management, 2023). For instance, higher biodiversity in BRI’s transcontinental forest corridors (Assis et al., 2022) might explain this advantage. However, the study provides the first quantification of this advantage in an emissions modelling framework.
One of the largest economic schemes that China propagates is the BRI, which consists of infrastructure development projects across varied regions. BRI countries are environmentally affected mainly by power generation from oil sources. Oil burning causes air pollution, thus impacting the health of ecosystems and wildlife. Oil production of electricity similarly results in the release of greenhouse gases into the atmosphere, leading to climate change. This comes with a price as the water volumes are very large, thus affecting oil refining and processing. Accidents pollute several of these water bodies, endangering aquatic life that, in turn, affects clean drinking water.
Furthermore, the results confirmed that EPOS increased CO2 emissions (β = 0.040**) and reduced ecological performance, contrary to Hypothesis 3. The findings align with previous research (Majumder et al., 2023; Voumik et al., 2022; 2023; Yilmaz and Sensoy, 2022). Long-lasting environmental damage results from habitat disturbance and fragmentation, infrastructure construction, and accidental or catastrophic oil spills. However, transitioning to cleaner, renewable energy technologies can help mitigate these effects. The ecological results of nuclear energy production and application in the BRI territory could be positive or negative, with China at the forefront.
Low greenhouse gas emissions from nuclear power plants help maintain smaller carbon footprints and provide energy security. They have a limited footprint on the land, thus reducing the limitations of habitats and minimizing the conflicts related to area usage. On the contrary, while improper waste management threatens ecosystems, so do accidents and leaks. Nuclear accidents may lead to soil and water contamination, long-term health outcomes, and the relocation of animals. Aquatic ecosystems are significantly affected by the discharge and withdrawal of water, thus causing thermal pollution. Ecosystems can be disrupted by construction and operation, but mining operations destroy habitats. The development of nuclear energy causes threats related to the spread and security risks. However, the findings indicated that EPNS decreased CO2 emissions (−0.015**), validating H4 and harming CO2 emissions, suggesting that an increase in EPNS will improve environmental performance and reduce CO2 emissions. The results align with prior research (Mahmood, 2022; Mohamed and Razek, 2023; Petruška and Litavcov, 2022).
Average precipitation greatly impacts ecological performance in the BRI countries because it affects ecosystems, biodiversity, and human activities. Changes in rainfall may alter the phenology of vegetation, soil moisture conditions, and habitat availability for many organisms. Extreme precipitation events can affect biodiversity and consequently change the abundance of plant animals. Precipitation is important for agriculture, influencing crop production and food supply. Sufficient rain causes drought, and during heavy rains, crops get destroyed. Coastal plants, too, are washed away, leading to the destruction of infrastructure. Precipitation changes can further impact forest health by altering the susceptibility of trees to pests and diseases. Lastly, ecosystems can be influenced by climate change trends like desertification and vegetation. Alterations in precipitation impact water quality, infrastructure resilience, and human welfare. Therefore, understanding and controlling these ramifications are important for sustainable development and ecosystem conservation. The outcomes of the study revealed that average precipitation depth has a negative impact on CO2 emissions, which shows APD reduced CO2 emissions and enhanced ecological performance (−0.828***). The findings align with prior research (Mahmood, 2022; Mohamed and Razek, 2023; Ni et al., 2019; Petruška and Litavcov, 2022; Vidon et al., 2015; Zhang et al., 2023). This reveals a novel insight that the impact of emissions associated with precipitation can shift from positive (in agricultural contexts) to negative (in urban-industrial BRI zones) due to the impacts of stormwater management on energy systems.
Conclusion
The present study explores the influence of climatic factors on ecological performance in BRI countries. The data of 20 countries relating to BRI nations are collected from 2000 to 2022. The World Bank and IMF’s official websites have collected variable data. Therefore, this paper used a two-step System GMM to determine the impact of independent variables on the dependent variable; meanwhile, the findings show that all the variables are endogenous. Therefore, the present study used the GMM model. The study results indicate that UPG and EPOS have a significantly positive impact on CO2 emissions, and this explains that if UPG and EPOS increase, the ecological performance of BRI decreases. Furthermore, FA, EPNS, and APD significantly negatively impact CO2 emissions, which shows that if FA, EPNS, and APD are enhanced, the other side of the ecological performance of BRI countries will be improved. Rapid urbanization, habitat loss, pollution, and other environmental issues are among the ecological impacts of the BRI, a large-scale infrastructure program in Asia, Europe and Africa led by China. However, it also creates conditions for viable practices, including environmentally sound technologies and green infrastructure. Deforestation in BRI countries may result in biodiversity loss, ecosystem disruption, and even species extinction. Forests are instrumental in preserving biodiversity, controlling climate, and regulating water flows. Moving towards cleaner and renewable energy can help to reduce such effects. Ecological impacts of nuclear energy production in BRI countries could be positive and negative; certain risks for soil and water contamination are to acknowledge long-term health effects and displacement dependence on wild animals. It is, therefore, essential to appreciate and regulate these connotations for effective, sustainable development and conservation of ecosystems.
Implications
Practical implications
Understanding the role of urban population growth, forest area, electricity production, and average precipitation in CO2 emissions is crucial for policy-making and urban planning. The strategy also encourages the sustainable development of cities through integrated city designs, green infrastructure, and efficient transport systems. Protection and reforestation of forests also contribute to mitigating CO2 and biodiversity conservation. Energy transition strategies are shaped by the knowledge of the emissions intensity of different generation sources of electricity, promoting the adoption of renewable energy and fueled phase-out of fossil fuel-based electricity generating units. Climate-resistant structures and water management techniques cannot be developed, provided the linkage between the mean precipitation patterns and CO2 emissions is understood. This information provides the basis for integrating strategies to implement the complexity of the linkages between urbanization, land use changes, energy production, precipitation patterns, and CO2 emissions, facilitating the implementation of more efficient mitigation and adaptation actions.
Policy implications
Based on these findings, it is recommended that BRI governments adopt specific policy implications to enhance ecological sustainability. Dedicated finance could be raised by levying a carbon sink on deforestation-affected infrastructure projects, creating an opportunity for community-led reforestation funds. For instance, dedicated environmental financing mechanisms, such as green bonds aligned with the EU Taxonomy, can be mandated for BRI infrastructure projects that emit above a certain threshold. Governments could introduce carbon-offset levies on projects that significantly reduce forest cover, redirecting those funds toward community-led reforestation initiatives. Moreover, establishing a BRI-wide Environmental Scorecard would enable annual assessments of project-level emissions, thereby linking future funding to performance. Urban planning could adopt ‘transit-oriented development’ models, ensuring that at least 50% of urban residents are located within a 1-km radius of public transport hubs, thereby reducing emissions from private vehicles. These policy actions reflect scalable, evidence-based strategies suitable for BRI nations at varying income levels.
Limitations and future directions
The study on the effect of urban population growth, forest area, electricity production, and average precipitation on CO2 emissions is limited. The complexity of these interactions makes it very hard to trace the specific effects of each factor on CO2 emissions. Moreover, Future research must utilize detailed datasets combined with refined modeling processes like machine learning to better represent non-linear data patterns. While the study addresses endogeneity through GMM estimation, this study acknowledges that omitted variable bias may still be present, particularly for variables related to technological innovation, energy subsidies, or governance quality, which are challenging to capture uniformly across BRI countries. Unobserved heterogeneity, despite the inclusion of country and time-fixed effects, may also influence the results due to structural differences in institutional capacity or environmental regulation. Furthermore, the dataset spans the COVID-19 pandemic period (2020–2021), which introduced disruptions in economic activity and emissions. Although the panel structure partially absorbs such shocks, their unique effects may influence short-term dynamics that this research model does not fully capture. Analyzing BRI sub regions through longitudinal studies and interdisciplinary research units combining environmental science elements with economics and policy analysis would create a holistic understanding of sustainable development matters.
Data availability statement
Publicly available datasets were analyzed in this study. This data can be found here: Data will be available on request.
Author contributions
MR: Conceptualization, Data curation, Formal Analysis, Writing – original draft. MN: Methodology, Resources, Software, Supervision, Writing – original draft. SA: Writing – original draft, Writing – review and editing.
Funding
The author(s) declare that no financial support was received for the research and/or publication of this article.
Conflict of interest
The authors declare that the research was conducted in the absence of any commercial or financial relationships that could be construed as a potential conflict of interest.
Generative AI statement
The author(s) declare that no Generative AI was used in the creation of this manuscript.
Publisher’s note
All claims expressed in this article are solely those of the authors and do not necessarily represent those of their affiliated organizations, or those of the publisher, the editors and the reviewers. Any product that may be evaluated in this article, or claim that may be made by its manufacturer, is not guaranteed or endorsed by the publisher.
Abbreviations
BRI, Belt and road initiative; CO2, Carbon Dioxide; GMM, Generalized Method of Moments; IMF, International Monetary Fund; OECD, Organization for Economic Co-operation and Development; GDP, Gross Domestic Product; FDI, Foreign Direct Investment; N2O, Nitrous Oxide; CIPS, Cross-Sectional Im-Pearson-Shin; VIF, Variance Inflation Factor; STIRPAT, Stochastic Impacts by Regression on Population, Affluence, and Technology; REDD-plus, Reducing Emissions from Deforestation and Forest Degradation; IFCS, Intergovernmental Forum on Chemical Safety.
References
Ahmad, T. I., Bhatti, M. A., Urooj, K., and Javed, H. (2022). Urban population growth, per capita energy use, and CO2 emissions: evidence from the world ’ s fifth-most populous country. iRASD J. Ener. Envio. 3 (2), 97–110. doi:10.52131/jee.2022.0302.0029
Alam, M., Rakkibu, M., and Rahman, M. (2012). People’s attitude towards social forestry: a case study in Rajshahi. J. Environ. Sci. Nat. Resour. 5 (1), 217–222. doi:10.3329/jesnr.v5i1.11585
Alomair, A., Ibrahim, R. L., and Al Naim, A. S. (2025). Natural resources heterogeneity and environmental sustainability in G20 nations: Post-COP28 analysis. Front. Environ. Sci. 12, 1524350. doi:10.3389/fenvs.2024.1524350
Aluko, O. A., Opoku, E. E. O., and Acheampong, A. O. (2023). Economic complexity and environmental degradation: evidence from OECD countries. Bus. Strategy Environ. 32(6), 2767–2788. doi:10.1002/bse.3269
Antonio, M., Alfredo, J., and Aarón, T. (2022). Nuclear energy as backup to renewable energies energía nuclear Como respaldo a las energías renovables. 6(16), 15–23.
Arellano, M., and Bond, S. (1991). Some tests of specification for panel data: Monte Carlo evidence and an application to employment equations. The review of economic studies, 58 (2), 277–297.
Arellano, M., and Bover, O. (1995). Another look at the instrumental variable estimation of error-components models. J. Econom. 68 (1), 29–51.
Ashraf, J. (2022). Do political risk and globalization undermine environmental quality? Empirical evidence from belt and road initiative (BRI) countries. Manag. Decis. Econ. 43 (8), 3647–3664. doi:10.1002/mde.3620
Assis, T. O., Aguiar, A. P. D., Randow, C. V., and Nobre, C. A. (2022). Projections of future forest degradation and CO 2 emissions for the Brazilian amazon. Sci. Adv. 8, 1–11. doi:10.1126/sciadv.abj3309
Baek, J., Cho, Y., and Koo, W. W. (2009). The environmental consequences of globalization: a country-specific time-series analysis. Ecol. Econ., 68(8), 2255–2264. doi:10.1016/j.ecolecon.2009.02.021
Balsalobre-Lorente, D., Ibáñez-Luzón, L., Usman, M., and Shahbaz, M. (2022). The environmental kuznets curve, based on the economic complexity, and the pollution haven hypothesis in PIIGS countries. Renew. Energy, 185, 1441–1455. doi:10.1016/j.renene.2021.10.059
Begum, R. A., and Raihan, A. (2020). Dynamic impacts of economic growth and forested area on carbon dioxide emissions in Malaysia, 1–15.
Blundell, R., and Bond, S. (1998). Initial conditions and moment restrictions in dynamic panel data models. J. Econom. 87 (1), 115–143.
Boleti, E., Garas, A., Kyriakou, A., and Lapatinas, A. (2021). Economic complexity and environmental performance: evidence from a world sample. Environ. Model. and Assess. 26 (3), 251–270. doi:10.1007/s10666-021-09750-0
Cai, Y., Sam, C. Y., and Chang, T. (2018). Nexus between clean energy consumption, economic growth and CO2 emissions. J. Clean. Prod., 182, 1001–1011. doi:10.1016/j.jclepro.2018.02.035
Chaabouni, S., and Saidi, K. (2017). The dynamic links between carbon dioxide (CO2) emissions, health spending and GDP growth: a case study for 51 countries. Environ. Res., 158, 137–144. doi:10.1016/j.envres.2017.05.041
Chen, Q., Madni, G. R., and Shahzad, A. A. (2023). The usage of spatial econometric approach to explore the determinants of ecological footprint in BRI countries. Plos one 18 (10), e0288683. doi:10.1371/journal.pone.0288683
Chishti, M. Z., Ahmad, M., Rehman, A., and Khan, M. K. (2021). Mitigations pathways towards sustainable development: assessing the influence of fiscal and monetary policies on carbon emissions in BRICS economies. J. Clean. Prod. 292, 126035. doi:10.1016/j.jclepro.2021.126035
Chishti, M. Z., and Sinha, A. (2022). Do the shocks in technological and financial innovation influence the environmental quality? Evidence from BRICS economies. Technol. Soc. 68, 101828. doi:10.1016/j.techsoc.2021.101828
Chu, L. K., and Le, N. T. M. (2022). Environmental quality and the role of economic policy uncertainty, economic complexity, renewable energy, and energy intensity: the case of G7 countries. Environ. Sci. Pollut. Res. 29 (2), 2866–2882. doi:10.1007/s11356-021-15666-9
Dumitrescu, E.-I., and Hurlin, C. (2012). Testing for granger non-causality in heterogeneous panels. Econ. Model. 29 (4), 1450–1460. doi:10.1016/j.econmod.2012.02.014
Dietz, T., and Rosa, E. A. (1997). “Effects of population and affluence on CO2 emissions.” in Proceedings of the national academy of sciences, 94 (1), 175–179.
Epule, E. (2012). The environmental quadrupole: forest area, rainfall, CO2 emissions and arable production interactions in Cameroon. Br. J. Environ. Clim. Change 2 (1), 12–27. doi:10.9734/bjecc/2012/1035
Ghazouani, T., and Beldi, L. (2022). The impact of income inequality on carbon emissions in Asian countries: non-parametric panel data analysis. Environ. Model. and Assess. 27 (3), 441–459. doi:10.1007/s10666-021-09811-4
Hassan, S. T., Khan, D., Zhu, B., and Batool, B. (2022). Is public service transportation increase environmental contamination in China? The role of nuclear energy consumption and technological change. Energy, 238, 121890. doi:10.1016/j.energy.2021.121890
Ibrahim, R. L., Awosusi, A. A., Ajide, K. B., and Ozdeser, H. (2025). Exploring the renewable energy-environmental sustainability pathways: what do the interplay of technological innovation, structural change, and urbanization portends for BRICS? Environ. Dev. Sustain. 27 (1), 191–211. doi:10.1007/s10668-023-03917-3
Kahia, M., and Omri, A. (2021). Does green energy complement economic growth for achieving environmental sustainability ? Evidence from Saudi Arabia.
Lee, C.-C., and Olasehinde-Williams, G. (2024). Does economic complexity influence environmental performance? Empirical evidence from OECD countries. Int. J. Finance and Econ. doi:10.1002/ijfe.2689
Li, H., Zhang, G., and Cao, Y. (2022). Forest area, CO 2 emission, and COVID-19 case-fatality rate: a worldwide ecological study using spatial regression analysis. Forests 13, 736. doi:10.3390/f13050736
Li, J., and Lei, H. (2022). Impacts of climate change on winter wheat and summer maize dual-cropping system in the north China plain. Environ. Res. Commun. 4 (7), 075014. doi:10.1088/2515-7620/ac814c
Liu, J., Li, M., and Ding, Y. (2021). Econometric analysis of the impact of the urban population size on carbon dioxide (CO2) emissions in China. Environ. Dev. Sustain. 23 (12), 18186–18203. doi:10.1007/s10668-021-01433-w
Luqman, M., Rayner, P. J., and Gurney, K. R. (2021). impact urbanisation CO 2 Emiss. 1–8. doi:10.1038/s42949-023-00084-2
Mahmood, H. (2022). Nuclear energy transition and CO 2 emissions nexus in 28 nuclear electricity-producing countries with different income levels. PeerJ 10, e13780. doi:10.7717/peerj.13780
Mahmood, H., Asadov, A., Tanveer, M., Furqan, M., and Yu, Z. (2022). Impact of oil price, economic growth and urbanization on CO 2 emissions in GCC countries: asymmetry analysis. Sustainability 14, 4562. doi:10.3390/su14084562
Majumder, S. C., Voumik, L. C., Rahman, H., and Rahman, M. (2023). A Quantile Regres. Analysis Impact Electr. Prod. Sources CO 2 Emiss. South Asian Ctries. 42, 307–330. doi:10.13052/spee1048-5236.4223
Mchunu, C., and Chaplot, V. (2012). Land degradation impact on soil carbon losses through water erosion and CO2 emissions. Geoderma 177–178 (May), 72–79. doi:10.1016/j.geoderma.2012.01.038
Mohamed, A., and Razek, A. (2023). The role of nuclear power in sustainability of the electricity sector. 8(2), 19–27. doi:10.11648/j.ajere.20230802.11
Mohsin, M., Abbas, Q., Zhang, J., Ikram, M., and Iqbal, N. (2019). Integrated effect of energy consumption, economic development, and population growth on CO 2 based environmental degradation: a case of transport sector. Environ. Sci. Pollut. Res. 26, 32824–32835. doi:10.1007/s11356-019-06372-8
Mol, A. P., and Spaargaren, G. (2000). Ecological modernisation theory in debate: a review. Environ. Polit. 9 (1), 17–49.
Mosikari, T. J., and Eita, J. H. (2020). CO2 emissions, urban population, energy consumption and economic growth in selected African countries: a panel smooth transition regression (PSTR). OPEC Energy Rev., 44(3), 319–333. doi:10.1111/opec.12184
Nasir, M. A., Canh, N. P., and Lan Le, T. N. (2021). Environmental degradation and role of financialisation, economic development, industrialisation and trade liberalisation. J. Environ. Manag., 277, 111471. doi:10.1016/j.jenvman.2020.111471
Ni, X., Liao, S., Wu, F., and Groffman, P. M. (2019). Short-term precipitation pulses stimulate soil CO2 emission but do not alter CH4 and N2O fluxes in a northern hardwood forest. Soil Biol. Biochem., 130, 8–11. doi:10.1016/j.soilbio.2018.11.021
Nwafor, A. O. (2014). Combating environmental degradation through diplomacy and corporate governance (part 1). Mediterr. J. Soc. Sci. 5 (20), 202–210. doi:10.5901/mjss.2014.v5n20p202
Petruška, I., and Litavcov, E. (2022). Impact of renewable energy sources and nuclear energy on CO 2 emissions reductions — the case of the EU countries, 1–23.
QingYan, X. Q. X., XiaoDan, W. X. W., YongHeng, G. Y. G., and MengYao, Z. M. Z. (2017). Short term effect of precipitation amount change on greenhouse gas emissions from alpine grassland in the eastern Qinghai-Tibetan Plateau. 2 PP-Jhansi DT-Range Manag. Agrofor., 151–157.
Radwan, M., Alzgool, H., Mir, S., Shah, M., and Ahmed, U. (2020). Impact Energy Consum. Econ. Growth Environ. Perform. Implic. Green Policy Pract. 10 (5), 655–662.
Raza, M. Y., Khan, A. N., Khan, N. A., and Kakar, A. (2021). The role of food crop production, agriculture value added, electricity consumption, forest covered area, and forest production on CO2 emissions: insights from a developing economy. Environ. Monit. Assess. 193 (11), 747. doi:10.1007/s10661-021-09523-y
Raza, S. A., Shah, S. H., and Yousufi, S. Q. (2021). The impact of public-private partnerships investment in energy on carbon emissions: evidence from nonparametric causality-in-quantiles. Environ. Sci. Pollut. Res. 28 (18), 23182–23192. doi:10.1007/s11356-020-12306-6
Ren, X., An, Y., He, F., and Goodell, J. W. (2024). Do FDI inflows bring both capital and CO2 emissions? Evidence from non-parametric modelling for the G7 countries. Int. Rev. Econ. and Finance, 95, 103420. doi:10.1016/j.iref.2024.103420
Sakas, D. P., Reklitis, D. P., Terzi, M. C., and Vassilakis, C. (2022). “Multichannel digital marketing optimizations through big data analytics,” in The tourism and hospitality industry, 1383–1408.
Salam, M., Yingzhi, X., Chishti, M. Z., and Khan, M. K. (2025). Trade, financial development and the environment: analysis of BRI countries having direct connectivity with China. Financ. Innov. 11 (1), 104. doi:10.1186/s40854-025-00775-y
Sarfraz, M., Ivascu, L., and Cioca, L. I. (2022). Environmental regulations and co2 mitigation for sustainability: panel data analysis (pmg, ccemg) for brics nations. Sustain. Switz. 14 (1), 72. doi:10.3390/su14010072
Sattar, A., Hussain, M. N., and Ilyas, M. (2022). An impact evaluation of belt and road initiative (BRI) on environmental degradation. Sage Open 12 (1), 21582440221078836. doi:10.1177/21582440221078836
Sun, H., Samuel, C. A., Kofi Amissah, J. C., Taghizadeh-Hesary, F., and Mensah, I. A. (2020). Non-linear nexus between CO2 emissions and economic growth: a comparison of OECD and B&R countries. Energy, 212, 118637. doi:10.1016/j.energy.2020.118637
Tayebi, S., Moosavi, S. F., and Poorhashemi, S. A. (2016). Environmental diplomacy: a framework for growth of international interaction and cooperation for achievement of global peace. J. Polit. Law 9 (9), 150. doi:10.5539/jpl.v9n9p150
Torun, E., Duygu, A., Akdeniz, A., Demireli, E., and Grima, S. (2022). Long-term US economic growth and the carbon dioxide emissions nexus: a wavelet-based approach. Sustainability 14, 10566. doi:10.3390/su141710566
Tourism, J. O. F., and Management, E. (2023). Eval. ROLE For. AREA , Agric. LAND , ENERGY Consum. FOREIGN DIRECT Invest. CO 2 Emiss. INDONESIA 8 (32), 72–87. doi:10.35631/JTHEM.832006.Abstract
Ullah, S., Akhtar, P., and Zaefarian, G. (2018). Dealing with endogeneity bias: The generalized method of moments (GMM) for panel data. Ind. Mark. Manag. 71, 69-78.
Urb, C. J., and Stud, E. (2023). Econ. Growth , Gov. CO 2 Emiss. West Afr. 1 . Introd. There are a plethora Stud. Relat. how Econ. growth Gov. affect Environ. . However , most these Stud. paid less Atten. West Afr. 11 (1). doi:10.1142/S2345748123500021
Vidon, P., Marchese, S., Welsh, M., and McMillan, S. (2015). Impact of precipitation intensity and riparian geomorphic characteristics on greenhouse gas emissions at the soil-atmosphere interface in a water-limited riparian zone. Water, Air, and Soil Pollut. 227 (1), 8. doi:10.1007/s11270-015-2717-7
Voumik, L. C., Islam, A., Ray, S., Yusma, N., Yusop, M., and Ridzuan, A. R. (2023). CO 2 emissions from renewable and non-renewable electricity generation sources in the G7 countries: static and dynamic panel assessment. Energies (Basel). 16, 1044. doi:10.3390/en16031044
Voumik, L. C., Islam, J., and Raihan, A. (2022). Electricity production sources and CO 2 emission in OECD countries: static and dynamic panel analysis, 12–21.
Waheed, R., Chang, D., Sarwar, S., and Chen, W. (2018). Forest, agriculture, renewable energy, and CO2 emission. J. Clean. Prod., 172, 4231–4238. doi:10.1016/j.jclepro.2017.10.287
Wang, A., Shan, S., Ibrahim, R. L., and Omokanmi, O. J. (2024). A new look at environmental sustainability from the lens of green policies, eco-digitalization, affluence, and urbanization: empirical insights from BRICS economies. Energy and Environ. 35 (8), 4195–4222. doi:10.1177/0958305x231177736
Wardhani, B., and Dugis, V. (2020). Greening surabaya: the city’s role in shaping environmental diplomacy. Bandung, 7(2), 236–258. doi:10.1163/21983534-00702005
Weimin, Z., Chishti, M. Z., Rehman, A., and Ahmad, M. (2021). A pathway toward future sustainability: assessing the influence of innovation shocks on CO2 emissions in developing economies. Environ. Dev. Sustain. 24, 4786–4809. doi:10.1007/s10668-021-01634-3
Weimin, Z., and Zubair Chishti, M. (2021). Toward sustainable development: assessing the effects of commercial policies on consumption and production-based carbon emissions in developing economies. Sage Open 11 (4), 21582440211061580. doi:10.1177/21582440211061580
Wen, J., Mughal, N., Zhao, J., Shabbir, M. S., Niedbała, G., Jain, V., et al. (2021). Does globalization matter for environmental degradation? Nexus among energy consumption, economic growth, and carbon dioxide emission. Energy Policy, 153, 112230. doi:10.1016/j.enpol.2021.112230
Wu, Y., Chen, C., and Hu, C. (2021). Does the belt and road initiative increase the carbon emission intensity of participating countries? China and World Econ. 29 (3), 1–25. doi:10.1111/cwe.12374
Wu, Y., Chen, C., and Hu, C. (2023). The impacts of trade intensity with China on carbon emissions in belt and road countries. J. Asia Pac. Econ. 28 (2), 558–577. doi:10.1080/13547860.2021.1924601
Xu, Q., Khan, S., Zhang, X., and Usman, M. (2023). Urbanization, rural energy-poverty, and carbon emission: unveiling the pollution halo effect in 48 BRI countries. Environ. Sci. Pollut. Res. 30 (48), 105912–105926. doi:10.1007/s11356-023-29861-3
Yan, J., Dong, Q., Wu, Y., Yang, H., and Liu, X. (2023). The impact of urbanization on carbon emissions from perspective of residential consumption. Pol. J. Environ. Stud. 32 (3), 2393–2403. doi:10.15244/pjoes/160193
Yilmaz, E., and Sensoy, F. (2022). Effects of fossil fuel usage in electricity production on CO 2 emissions: a STIRPAT model application on 20 selected countries. 12(6), 224–229. doi:10.32479/ijeep.13707
Yu, X., Kuruppuarachchi, D., and Kumarasinghe, S. (2024). Financial development, FDI, and CO2 emissions: does carbon pricing matter? Appl. Econ. 56, 2959–2974. doi:10.1080/00036846.2023.2203460
Yu, Z., Cao, Y., and Liu, M. (2022). Does carbon emission trading policy affect bank loans of firms? Evidence from China. Appl. Econ. Lett. 29 (18), 1709–1714. doi:10.1080/13504851.2021.1959513
Zhang, K., Qiu, Y., Zhao, Y., Wang, S., Deng, J., Chen, M., et al. (2023). Moderate precipitation reduction enhances nitrogen cycling and soil nitrous oxide emissions in a semi-arid grassland. Glob. Change Biol., 29(11), 3114–3129. doi:10.1111/gcb.16672
Zhao, X., and Xi, Y. (2022). Threshold effects of urban population size and industrial structure on CO 2 emissions in China. Front. Environ. Sci. 10 (April), 1–10. doi:10.3389/fenvs.2022.894442
Zhu, Y., Shi, Y., Wu, J., Wu, L., and Xiong, W. (2018). Exploring the characteristics of CO2 emissions embodied in international trade and the fair share of responsibility. Ecol. Econ. 146, 574–587. doi:10.1016/j.ecolecon.2017.12.020
Appendix
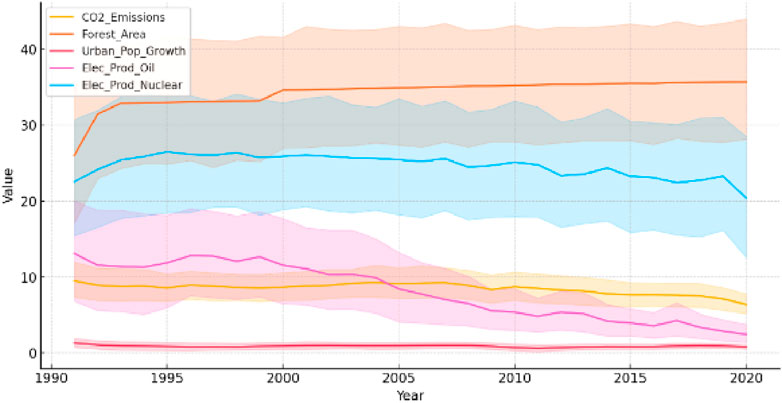
FIGURE A1. Time series trend of variables.
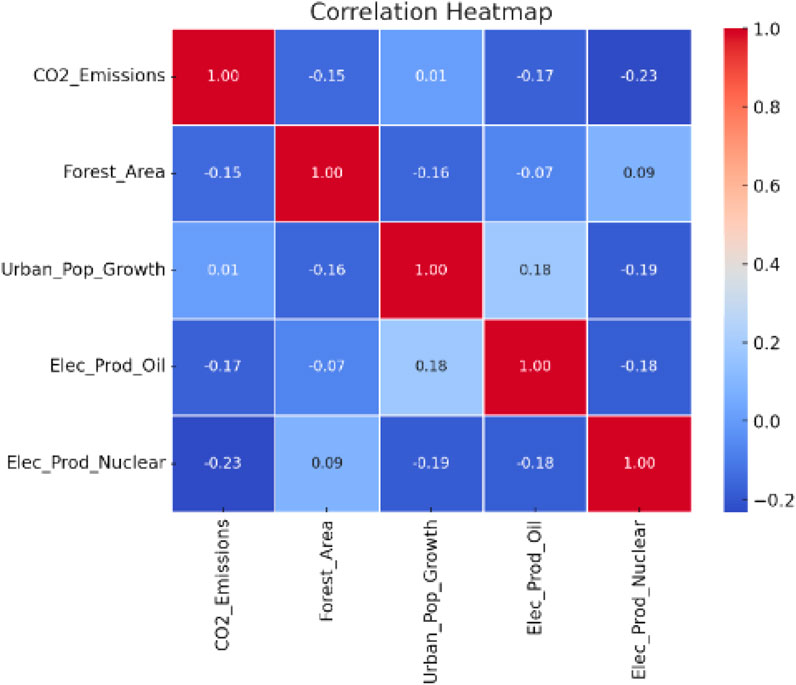
FIGURE A2. Correlation heat map.
Keywords: urban population growth, forest area, average precipitation in depth, ecological performance, BRI countries
Citation: Rizwanullah M, Nasrullah M and Almojel S (2025) Influence of climatic factors on ecological performance of the economy: empirical evidence from BRI countries. Front. Environ. Sci. 13:1540918. doi: 10.3389/fenvs.2025.1540918
Received: 06 December 2024; Accepted: 11 July 2025;
Published: 13 August 2025.
Edited by:
Faik Bilgili, Erciyes University, TürkiyeReviewed by:
Ridwan Ibrahim, University of Lagos, NigeriaMohammed Alnour, Erciyes University, Türkiye
Muhammad Zubair Chishti, Zhengzhou University, China
Hayat Khan, Guangdong University of Foreign Studies, China
Copyright © 2025 Rizwanullah, Nasrullah and Almojel. This is an open-access article distributed under the terms of the Creative Commons Attribution License (CC BY). The use, distribution or reproduction in other forums is permitted, provided the original author(s) and the copyright owner(s) are credited and that the original publication in this journal is cited, in accordance with accepted academic practice. No use, distribution or reproduction is permitted which does not comply with these terms.
*Correspondence: Muhammad Nasrullah, bmFzcnVsbGFoZWNvbm9taXN0QGhvdG1haWwuY29t