 Han Han
- Key Laboratory for Humid Subtropical Eco-Geographical Processes of the Ministry of Education, School of Geographical Sciences, Fujian Normal University, Fuzhou, China
Transportation emissions are a key source of surface fine particulate matter (PM2.5) and ozone air pollution. However, the impacts of transportation emissions on global PM2.5 and ozone over a long-term have not been documented until now. Here, we show that transportation-induced PM2.5 and ozone concentrations have increased worldwide during 1990–2019, with global means of 18% and 19% respectively. Spatially, the increases are higher over China and South Asia. We further show that global transportation-induced PM2.5 and ozone mortality has increased by 105% (315 thousand) during 1990–2019. Land transportation and air pollutant concentration are the dominant drivers of mortality increases from perspectives of transportation means and mortality influencing factors, respectively. Radiative forcing of transportation-induced PM2.5 and ozone has increased over developed countries, while decreased over developing countries during 1990–2019, with a slight global mean increase of 0.7%. Radiative forcing of transportation-induced ozone has increased across the globe, with mean changes of 23%. Increased transportation-induced PM2.5 and ozone can be effectively mitigated by emission reductions of the shared socio-economic pathways. Overall, our assessment suggests an increasing role of transportation emissions in global PM2.5 and ozone air pollution formation during 1990–2019, and highlights the necessity of abatement of transportation air pollutant emissions.
Highlights
• Global transportation-induced air pollution mortality has increased during 1990–2019.
• Radiative forcing of transportation-induced PM2.5 has changed contrastingly over developed and developing countries.
• China and South Asia dominate the increases in global transportation-induced air pollution mortality.
• Global transportation-induced air pollution mortality would decrease by 67% under SSP1-1.9 in 2045.
1 Introduction
Transportation emissions are one of key sources of global air pollution, including fine particulate matter (PM2.5) and ozone (O3). Transportation emissions can be divided into land transportation (road, rail, and the others over land), international shipping, and aviation from perspective of transportation means (Dedoussi et al., 2020; Khomenko et al., 2023). Previous studies estimated that land transportation contributed to 5%–12% (165–361 thousand premature deaths) global air pollution-attributable mortality in 2010 (Anenberg et al., 2019; Lelieveld et al., 2015), and 3%–20% regional air pollution-attributable mortalities over Northern Hemispheric countries (Han and Naeher, 2006; Karagulian et al., 2015; Silva et al., 2016; Wang et al., 2020; Zhang et al., 2017). Land transportation worsens air quality on local to global scales and leads to large-scale extreme air pollution events (Shu et al., 2020; 2024; Wang et al., 2021; Zhang et al., 2015). International shipping and aviation can lead to ∼100 thousand air pollution premature deaths globally per year, having lower impacts than land transportation (Barrett et al., 2013; Corbett et al., 2007; Eastham et al., 2024; Yim et al., 2015). Transportation-induced PM2.5 and ozone further influence global climate change through their radiative effects (Lee et al., 2021; Liu et al., 2016).
The United States (US) and Europe have controlled most of the key air pollutants emissions since 1990 and improved their overall PM2.5 and ozone air quality (McDuffie et al., 2020; Li et al., 2023; Sicard et al., 2023). However, emissions of air pollutants have shown increasing trends over developing countries such as China and India since 1990 because of their fossil fuel-based economic development, despite recent emission control over China since 2013 (Zhang et al., 2019). Transportation emissions have changed substantially over the globe during past decades. Researches on the impacts of transportation emission changes on air pollution unravel the causes of air pollution evolution and benefit policy-making of transportation air pollutant emission control. However, influences of transportation emission changes on air pollution on global scale during a long-term have not been reported until now, despite many evaluation studies on regional scale and limited sectors (Liu et al., 2020; Silva et al., 2016). A comprehensive assessment on the impacts of transportation-induced PM2.5 and ozone on global premature mortality and radiative forcing is lacked.
Here, we investigate the impacts of global transportation changes on air pollution and its mortality and radiative effects during 1990–2019. We focus on PM2.5 and ozone, because they are the two major air pollutants that contribute to air pollution mortality and radiative forcing. We estimate transportation-induced PM2.5 and ozone concentrations using sensitivity simulations from a global chemical transport model, GEOS-Chem (Bey et al., 2001). Emission inventories of land transportation, international shipping, and aviation are used. We calculate PM2.5- and ozone-attributable premature mortality and radiative forcing using exposure-response and radiative transfer modeling respectively. At last, we assess the effectiveness of reductions in transportation emissions in mitigation of transportation-induced PM2.5 and ozone premature mortality and radiative forcing.
2 Methodology
2.1 GEOS-Chem model description
We apply the chemical transport model GEOS-Chem v14.0.1 (https://geoschem.github.io/) to simulate global distribution of air pollutants. GEOS-Chem simulates a detailed tropospheric O3-NOx-hydrocarbon-aerosol-halogen chemistry. Because of its good performance in reproducing distributions and variations of PM2.5 and ozone, GEOS-Chem has been widely used in researches of PM2.5 and ozone air pollution (Eastham et al., 2024; Han et al., 2024; Xu et al., 2023; Zhang et al., 2017). We drive the model using the MERRA-2 assimilated meteorological data provided by the Global Modeling and Assimilation Office (GMAO) at NASA and apply the horizontal resolutions of 2° × 2.5° (latitude × longitude) and vertical resolutions of 72 layers from surface to 0.01 hPa. We use the Community Emissions Data System (CEDS) inventory for global land transportation and international shipping emissions (Hoesly et al., 2018) and the Aviation Emissions Inventory Code (AEIC) for global aviation emissions (Lee et al., 2021; Simone et al., 2013). Anthropogenic emissions excluding transportation are from CEDS. For natural emissions, we use biomass burning emissions from GFED v4.1 (van der Werf et al., 2017), biogenic NMVOCs from MEGAN v2.1 (Guenther et al., 2012), Lightning NOx from Ott et al. (2010), and soil NOx from Hudman et al. (2012). PM2.5 concentrations are calculated by the sum of ammonium, nitrate, sulfate, black carbon, organic carbon, mineral dust, sea salt, and secondary organic aerosol. CEDS inventory is derived using a bottom-up approach with reported activity data, source- and region-specific emission factors and has the advantage of consistent long-term emission trends over time, space, and emission species (Hoesly et al., 2018; McDuffie et al., 2020). CEDS inventory has been widely used in global air pollution studies (McDuffie et al., 2021; Tessum et al., 2022). AEIC inventory estimates air pollutant emissions from landing, take-off, climb, cruise, and descent flight (Simone et al., 2013) with considering of global aviation growth (Lee et al., 2021).
We explore changes in transportation emissions on global and regional scales. We classify the globe into 15 regions, considering their geographical positions and economic levels. North America (NAM), Central America (CAM), South America (SAM), Europe (EUR), Africa (AFR), North Asia, Central Asia, and Mongolia (NCAM), Middle East (MDE), China (CHN), South Asia (SAS), Korea and Japan (KAJ), Southeast Asia (SEAS), Pacific, Australia, and New Zealand (PAN), Arctic (NPO), Antarctic (SPO), and Ocean (OCN) are classified (Supplementary Figure S1). Most of the transportation emissions have increased and decreased continuously over the globe and the 15 world regions during 1990–2019 (Supplementary Figure S2). Therefore, we conduct GEOS-Chem simulations in 1990 and 2019 to investigate the trends in transportation-induced air pollution during 1990–2019 to save computing resources (Table 1). All the GEOS-Chem simulations are initiated after 6-month spin-up.

Table 1. Configuration of GEOS-Chem control and sensitivity experiments.
2.2 Determination of transportation-induced PM2.5 and ozone
Firstly, we correct the GEOS-Chem simulated surface PM2.5 and ozone to make them being close to observations. We adjust PM2.5 and ozone simulations using annual mean estimates from the Global Burden of Disease (GBD) study for 2021 (GBD, 2021 Risk Factors Collaborators, 2024). We produce downscaled 0.1°latitude × 0.1°longitude surface PM2.5 and ozone data using linear interpolation of the GEOS-Chem 2°latitude × 2.5°longitude simulations, and then correct the data on each 0.1°latitude × 0.1°longitude grid (Chen et al., 2022; Zhang et al., 2017). We calculate ratios of satellite-derived PM2.5 and ozone to GEOS-Chem simulations over each 0.1°latitude × 0.1°longitude grid cell in 2019 and then apply them to 1990 and 2019. The corrected GEOS-Chem PM2.5 and ozone simulations perform well in representing spatial distributions of PM2.5 and ozone when validated using US, Europe, and China surface observations and GBD2021 estimates (Supplementary Text S1; Supplementary Figures S3–S5; Supplementary Table S1).
Secondly, we determine the transportation-induced PM2.5 and ozone concentrations using corrected simulations from one control (CTRL) and four sensitivity experiments (SEB1–SEB4). Differences between CTRL and SEB1 are estimated as contributions of total transportation emissions to PM2.5 and ozone air pollution. The sensitivity experiment method can reasonably represent the contributions of air pollutant emissions from one sector to the overall PM2.5 and ozone concentrations (Han et al., 2019; Ni et al., 2018; Zhang et al., 2017). Contributions of each sector of transportation are calculated using linearly normalization of SEB2–SEB4. The linearly normalization keeps mass conservation in the results (Han et al., 2019; Li et al., 2016).
2.3 Uncertainty resulted from emission inventory
We evaluate regional uncertainties in transportation-induced PM2.5 and ozone that result from emission inventory by comparing GEOS-Chem control simulations with sensitivity simulations that using regional emission inventories. We add two sensitivity experiments (SEC1–SEC2). In the two experiments, transportation emissions from CEDS inventory over the US and China are replaced by the US National Emissions Inventory (NEI) and the Multi-resolution Emission Inventory for China (MEIC) in 2019, respectively. NEI includes fossil fuel combustion emissions from point, nonpoint, onroad, and nonroad sources. MEIC includes a series of improved emission inventory models (Li et al., 2017; Zheng et al., 2014). The two inventories are widely used in regional air pollution studies over China and the US (Dedoussi et al., 2020; Ni et al., 2018; Shu et al., 2024).
2.4 Effectiveness of transportation emission reductions
We choose six emission reduction scenarios to assess the effectiveness of emission reductions in mitigation of transportation-induced PM2.5 and ozone air pollution (SED1–SED6). In two of the six scenarios, we reduce transportation emissions by 20% and 50% relative to 2019 over the globe. In the other four scenarios, we use transportation emissions from two shared socio-economic pathways (SSPs): SSP1-1.9 in 2045 and 2095 and SSP5-8.5 in 2045 and 2095, which are created for the experiments of the Coupled Model Intercomparison Project Phase 6 (CMIP6) (Gidden et al., 2019; O'Neill et al., 2016). SSP1-1.9 and SSP5-8.5 allow global radiative forcings of 1.9 and 8.5 Wm−2 respectively. Air pollutant emissions decrease persistently from 2015 to 2100 in SSP1-1.9 and SSP5-8.5. We name the six scenarios as R20, R50, SSP119-2045, SSP119-2095, SSP585-2045, and SSP585-2095. Changes in transportation-induced PM2.5 and ozone mortality under the six scenarios are calculated using baseline mortality rate and population count in 2019 and simulated changes in PM2.5 and ozone concentrations relative to 2019.
2.5 Calculation of PM2.5 and ozone mortality
We estimate PM2.5-attributable premature deaths of noncommunicable diseases and lower respiratory infections using the newly developed Global Exposure Mortality Model (GEMM) (Burnett et al., 2018). We estimate ozone-attributable deaths based on the respiratory diseases (Turner et al., 2016). We calculate PM2.5 and ozone premature mortalities using population count, baseline mortality rate, and the concentration-response factor. Concentration-response factor is defined using PM2.5 and ozone concentrations and parameters that shape the relationship between PM2.5 and ozone and their health impacts.
Corrected GEOS-Chem PM2.5 and ozone concentrations and country-scale baseline mortality rate from the Global Health Data Exchange (GHDx) database are used. The population count data for 1990 and 2019 are generated using 2000–2020 gridded total population count from the NASA Socioeconomic Data and Applications Center (GPWv4), 1990–2000 global total population count from GHDx, and 1990–2019 country-scale population structure data from the United Nations’ (UN) Department of Economic and Social Affairs. We use GHDx 1990 global total population count constrained by the GPWv4 2000 global population patterns to represent the global gridded population count in 1990.
The results show that PM2.5 has resulted in 4.7 and 8.0 million premature deaths globally in 1990 and 2019 respectively, and ozone has resulted in 0.5 and 1.05 million premature deaths in 1990 and 2019 respectively. Our results are comparable with previous studies, which calculated PM2.5 and ozone mortality with validated PM2.5 and ozone data and concentration-response functions (Burnett et al., 2018; Malley et al., 2017).
We further estimate the contributions of air pollutant concentration, base mortality rate, and population count to the changes in the transportation-induced PM2.5 and ozone mortality during 1990–2019 using the decomposition method from Cohen et al. (2017). The method calculates contributions of each factor incrementally and determines their contributions by average of all the change sequences of air pollutant concentration, base mortality rate, and population count (Supplementary Table S1).
2.6 Calculation of PM2.5 and ozone radiative forcing
We calculate the radiative effects of PM2.5 and ozone using the coupled radiative module, Rapid Radiative Transfer Model (RRTMG) implemented in GEOS-Chem. RRTMG calculates the long-wave and shortwave atmospheric fluxes of each aerosol species and ozone (Heald et al., 2014). We estimate the anthropogenic radiative forcing of PM2.5 and ozone relative to the preindustrial era using sensitivity experiments. In the sensitivity experiments, global anthropogenic emissions are turned off (SEA). The results show that anthropogenic radiative forcing of PM2.5 and ozone is −1.7 and 0.07 W m−2 in 1990 respectively, and is −1.6 and 0.09 W m−2 in 2019 respectively. Our results are comparable with the aerosol radiative forcing of −1.1 (90% confidence interval: −1.7 to −0.4) W m−2 during 1750–2019 from the intergovernmental panel on climate change (IPCC) 6th assessment report (IPCC, 2023).
3 Results
3.1 Spatial distribution of transportation-induced PM2.5 and ozone in 2019
Figure 1 presents the spatial distributions of transportation-induced surface PM2.5 and ozone concentrations in 2019. Global average transportation-induced PM2.5 and ozone concentrations are 0.8 μg m−3 and 5.3 ppbv respectively, accounting for 4% and 13% of surface PM2.5 and ozone in 2019. Spatially, transportation-induced surface PM2.5 and ozone concentrations are higher over Northern Hemispheric countries, i.e., North America, Europe, East Asia, and South Asia. Transportation-induced PM2.5 and ozone has led to 615 thousand premature deaths (6.8% of PM2.5 and ozone total mortality) and −213 mW m−2 radiative forcing (6.2% of PM2.5 and ozone total radiative forcing) over the globe in 2019. The three transportation sectors of land transportation, international shipping, and aviation have respectively contributed to 81%, 11%, and 8% transportation-induced PM2.5 and ozone mortality. The three sectors have contributed to 78%, 19%, and 3% transportation-induced PM2.5 and ozone radiative forcing respectively. Aviation has stronger impacts on ozone mortality and radiative forcing than international shipping over the globe in 2019.

Figure 1. Spatial distributions of annual mean transportation-induced surface daily mean PM2.5 and MDA8 ozone concentrations by total transportation (a,b), land transportation (c,d), international shipping (e,f), and aviation (g,h) in 2019. Numbers at the bottom of each panel present global mean concentrations of PM2.5 and ozone. Please note the different scales in PM2.5 and ozone concentrations in the panels.
Transportation-induced PM2.5 and ozone concentrations accounts for 5%–12% of surface PM2.5 and 14%–19% of surface ozone in Northern Hemispheric countries in 2019. Transportation-induced PM2.5 and ozone has led to 46, 89, 155, 173 and 24 thousand premature deaths in North America, Europe, China, South Asia, and Korea and Japan respectively in 2019, where China and South Asia contribute the most among the 15 world regions. Transportation-induced PM2.5 and ozone has led to −304, −712, −1,109, −1,455, and −987 mW m−2 radiative forcing over the above five regions in 2019. International shipping-induced PM2.5 mortality is the highest in Europe (19.7 thousand) among the 15 world regions in 2019. Aviation-induced ozone mortality is the highest in South Asia (14.5 thousand) among the 15 world regions in 2019.
3.2 Trends in transportation-induced PM2.5 and ozone during 1990–2019
Figure 2 presents spatial distributions of changes in transportation-induced surface PM2.5 and ozone concentrations during 1990–2019. Global mean transportation-induced PM2.5 and ozone concentrations have increased by 18% and 19% during 1990–2019 respectively. Transportation-induced PM2.5 and ozone concentrations have decreased over developed countries of North America (−45% for PM2.5 and −4% for ozone), Europe (−29% for PM2.5 and 4% for ozone), and Korea and Japan (−33% form PM2.5 and −2% for ozone). However, transportation-induced PM2.5 and ozone concentrations have increased over developing countries in Asia, such as China (133% for PM2.5 and 38% for ozone), South Asia (142% for PM2.5 and 56% for ozone), and Southeast Asia (118% for PM2.5 and 138% for ozone). The contributions of international shipping and aviation to PM2.5 and ozone have increased during 1990–2019.
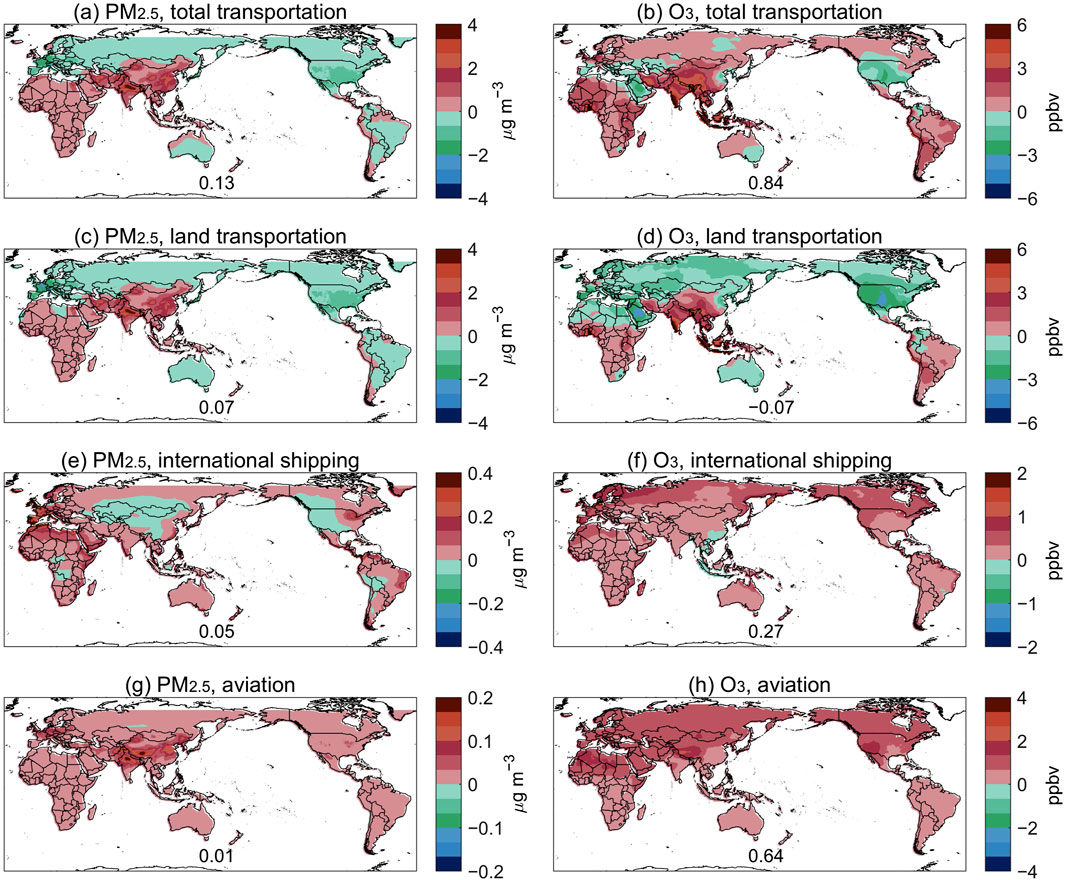
Figure 2. Spatial distributions of changes in annual mean transportation-induced surface daily mean PM2.5 and MDA8 ozone concentrations by total transportation (a,b), land transportation (c,d), international shipping (e,f), and aviation (g,h) during 1990–2019. Numbers at the bottom of each panel present changes in global mean concentrations of PM2.5 and ozone. Please note the different scales in PM2.5 and ozone concentrations in the panels.
Transportation-induced PM2.5 mortality has increased by 191 thousand over the globe during 1990–2019 (109% relative to 1990), including 148 thousand from land transportation, 33 thousand from international shipping, and 9 thousand from aviation (Figure 3; Table 2). Transportation-induced ozone mortality has increased by 124 thousand over the globe during 1990–2019 (100% relative to 1990), including 87 thousand, 11 thousand, and 26 thousand from the three transportation sectors respectively. China and South Asia contribute to 27% and 40% global increases in transportation-induced PM2.5 and ozone mortality respectively (Figures 3–5). The contributions of land transportation to increases in transportation-induced PM2.5 and ozone mortality are the highest among the three transportation sectors (78% for PM2.5 and 70% for ozone). The contributions of international shipping to transportation-induced PM2.5 mortality increases are the strongest in Europe among the 15 world regions. The influences of aviation on transportation-induced ozone mortality increases are the strongest in South Asia among the 15 world regions.
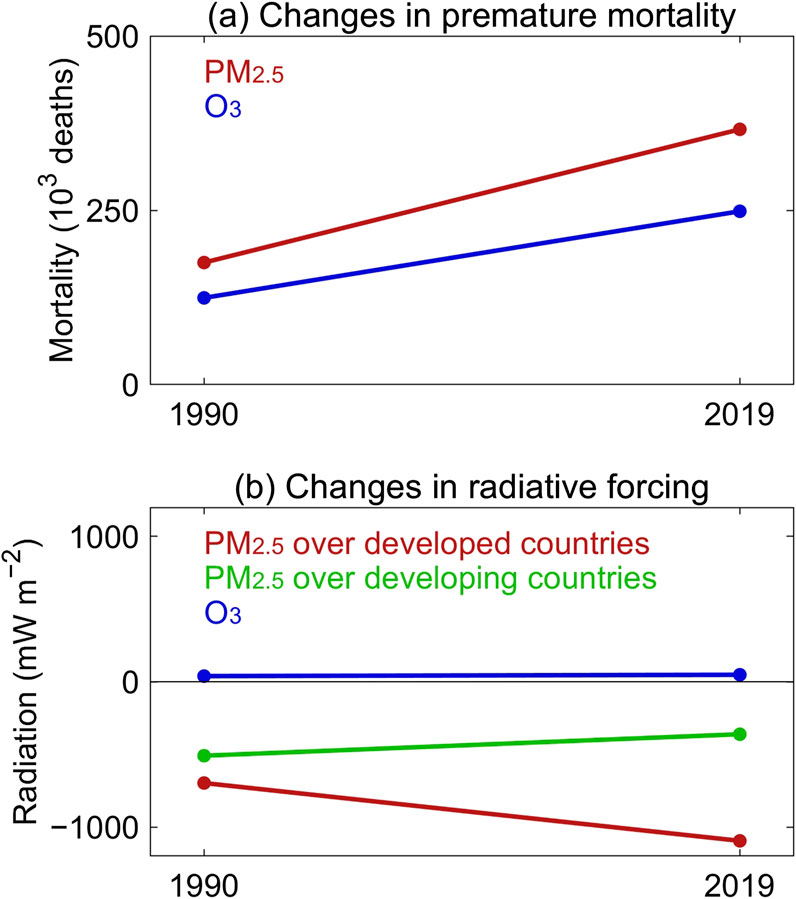
Figure 3. Changes in premature mortality (a) and radiative forcing (b) attributed to transportation-induced PM2.5 and ozone over the globe during 1990–2019.
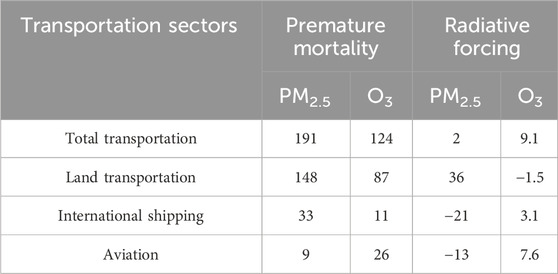
Table 2. Changes in premature mortality (thousand deaths) and radiative forcing (mW m−2) attributed to transportation-induced PM2.5 and ozone for different transportation sectors over the globe during 1990–2019.

Figure 4. Spatial distributions of changes in premature mortality (a,b) and radiative forcing (c,d) attributed to transportation-induced PM2.5 and ozone over the 15 world regions during 1990–2019. Please note the different scales in PM2.5 and ozone radiative forcing in the panels.
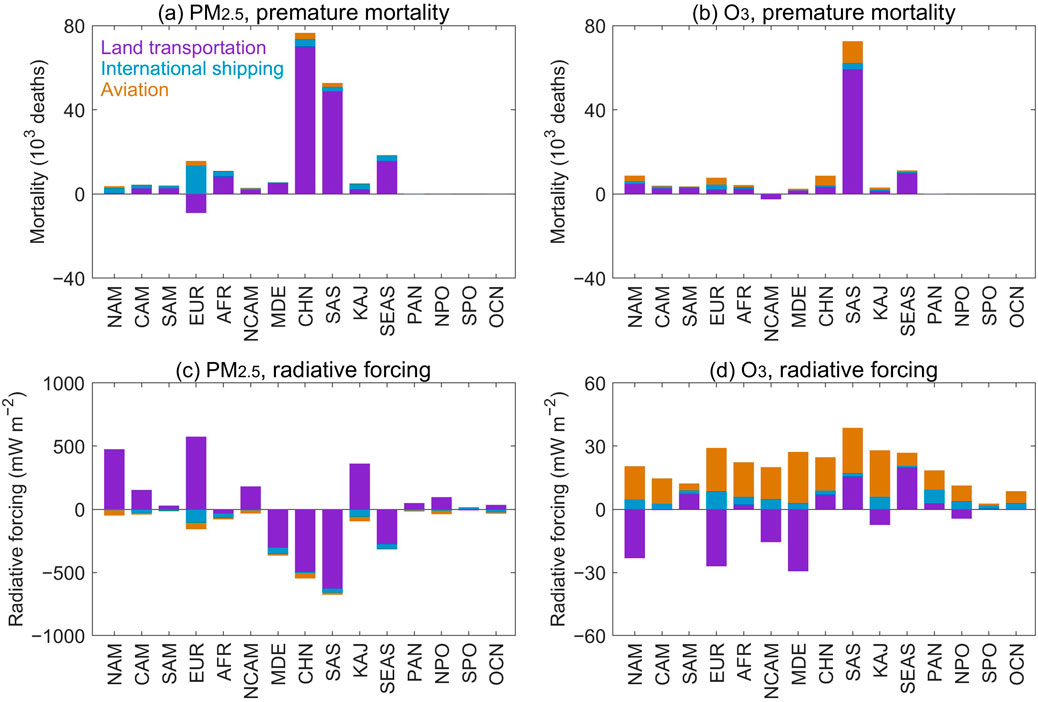
Figure 5. Changes in premature mortality (a,b) and radiative forcing (c,d) attributed to transportation-induced PM2.5 and ozone over the 15 world regions during 1990–2019. Please note the different scales in PM2.5 and ozone radiative forcing in the panels.
Radiative forcing of transportation-induced PM2.5 and ozone has increased over 10 of the 15 world regions during 1990–2019 (Figures 3–5). Radiative forcing of transportation-induced PM2.5 has increased over developed countries of North America (52% relative to 1990), Europe (33%), and Korea and Japan (20%), while it has decreased over developing countries of China (83%) and South Asia (74%). Radiative forcing of transportation-induced PM2.5 has changed little on global mean (2 mW m−2, 0.7% relative to 1990). Radiative forcing of transportation-induced ozone has increased by 9 mW m−2 on global mean (23% relative to 1990). Land transportation is the predominant driver of changes in transportation-induced PM2.5 radiative forcing over most of the 15 world regions. Aviation is the predominant driver of increases in transportation-induced ozone radiative forcing over most of the 15 world regions.
From the perspective of mortality influencing factors, PM2.5 concentration is the primary driver of global transportation-induced PM2.5 mortality increases during 1990–2019, with contributions of 93 thousand or 49% total changes (Table 3; Figure 6). However, regionally, population increases are the predominant drivers of transportation-induced PM2.5 mortality increases over North America, Europe, and Korea and Japan. Ozone concentration (41 thousand), baseline mortality rate (41 thousand), and population count (42 thousand) have contributed equally to increases of global transportation-induced ozone mortality. Ozone concentration contributes higher to transportation-induced ozone mortality increases over South Asia and Southeast Asia than baseline mortality rate and population count.
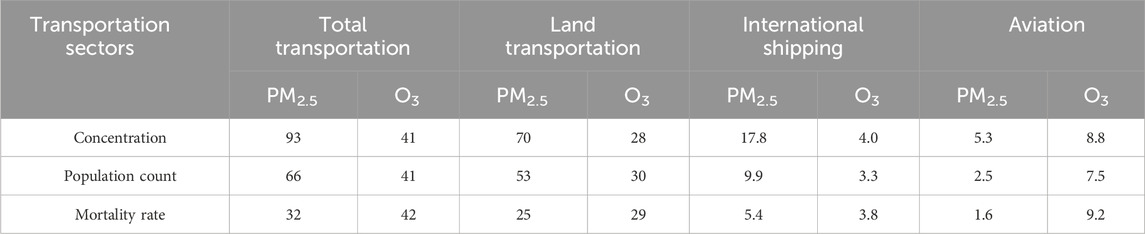
Table 3. Contributions of air pollutant concentration, baseline mortality rate of diseases, and population count to transportation-induced PM2.5 and ozone mortality changes (thousand deaths) for total transportation, land transportation, international shipping, and aviation over the globe during 1990–2019.
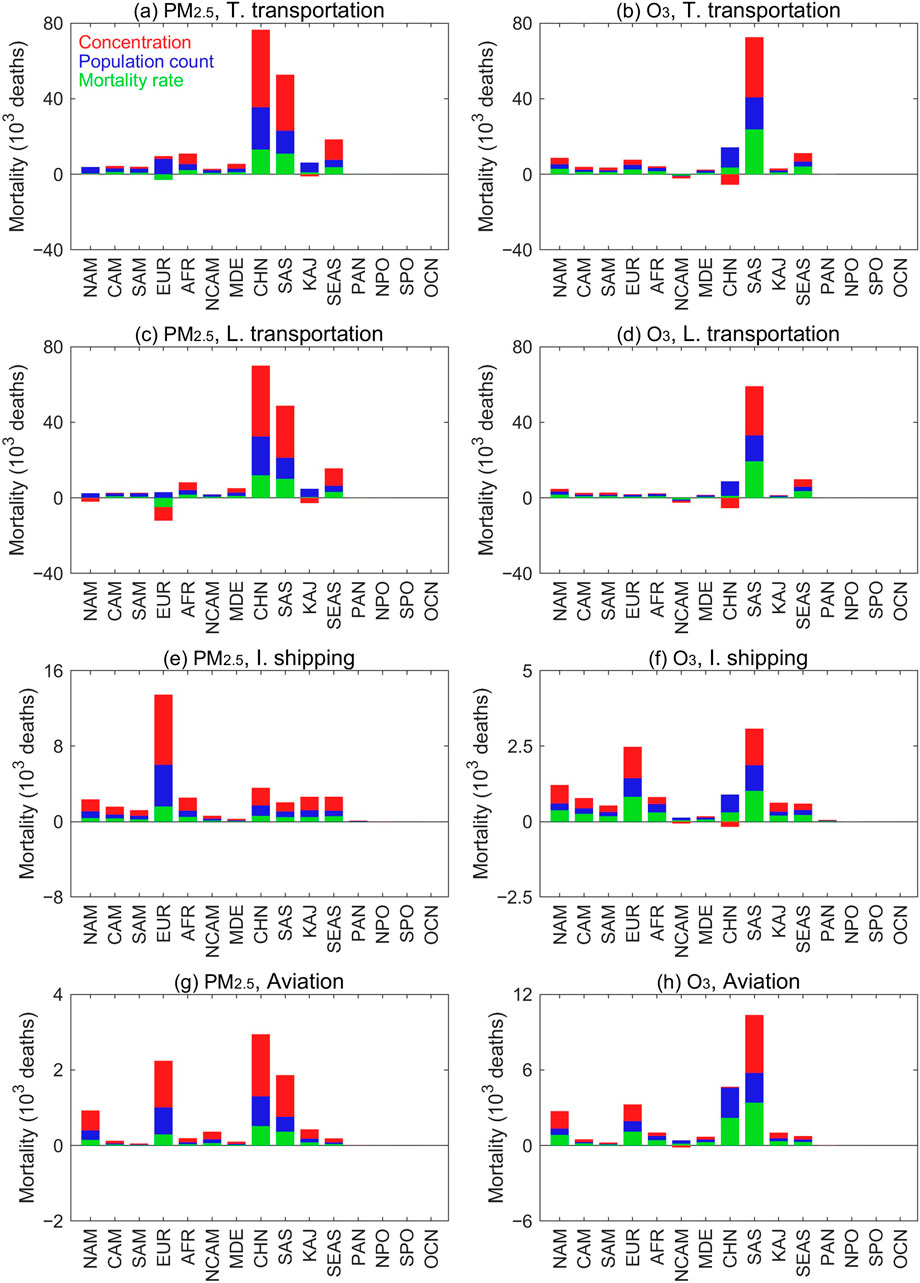
Figure 6. Contributions of air pollutant concentration, baseline mortality rate of diseases, and population count to transportation-induced PM2.5 and ozone mortality changes for total transportation (a,b), land transportation (c,d), international shipping (e,f), and aviation (g,h) over the 15 world regions during 1990–2019. Please note the different scales in PM2.5 and ozone mortalities in the panels.
3.3 Implications for future emission control
We evaluate the effectiveness of transportation air pollutant emission reductions in the mitigation of transportation-induced PM2.5 and ozone over the globe using six emission reductions scenarios (see methods in Section 2.6). Figure 7 presents changes in transportation-induced PM2.5 and ozone mortality and radiative forcing relative to 2019 under the six reduction scenarios over the 15 world regions. Global transportation-induced PM2.5 and ozone mortality would decrease by 110 thousand (18% relative to 2019), 286 thousand (46%), 412 thousand (67%), 535 thousand (87%), and 10 thousand (2%) per year under R20, R50, SSP119-2045, SSP119-2095, and SSP585-2095 respectively, while it would increase by 365 thousand (59%) per year under SSP585-2045. Europe, China, and South Aisa are top three regions where transportation-induced PM2.5 mortality has decreases under R20, R50, SSP119-2045, and SSP119-2095 among the 15 world regions. Europe, China, and South Aisa contribute to 62%–64% global transportation-induced PM2.5 mortality decreases under R20, R50, SSP119-2045, SSP119-2095, and SSP585-2095. China and South Asia contribute to 102% increases in global transportation-induced PM2.5 mortality in SSP585-2045.
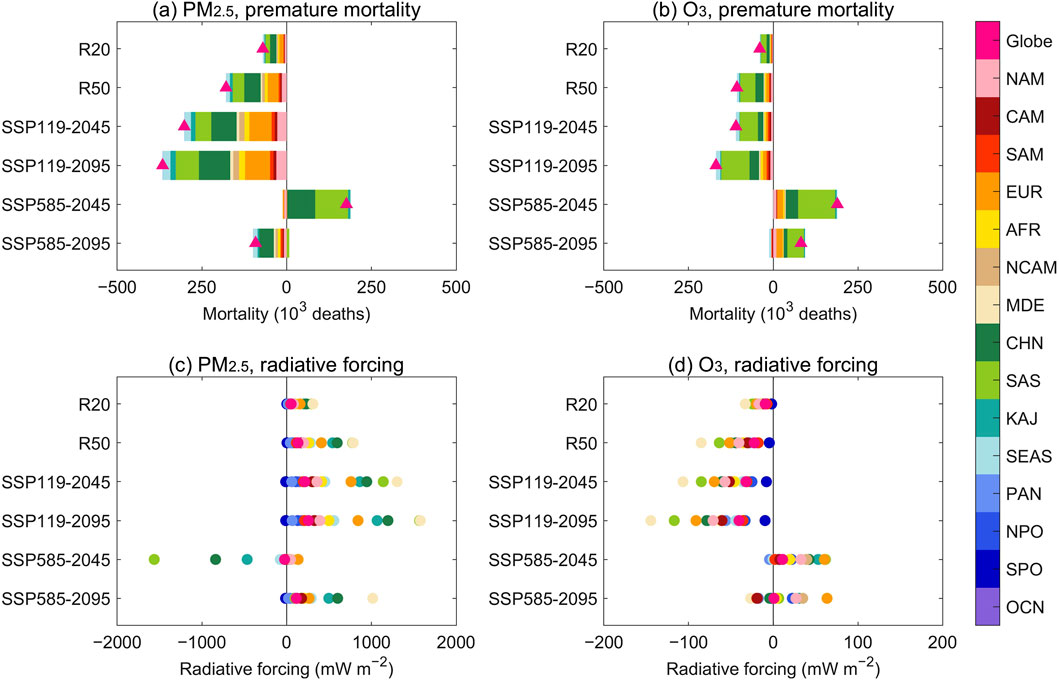
Figure 7. Changes in premature mortalities and radiative forcing attributed to transportation-induced PM2.5 and ozone over the 15 world regions under the six emission reduction scenarios relative to 2019. Please note the different scales in PM2.5 and ozone radiative forcing in the panels. (a) PM2.5, premature mortality; (b) O3 premature mortality; (c) PM2.5, radiative forcing; (d) O3, radiative forcing.
Radiative forcing of transportation-induced PM2.5 would increase across the globe under R20, R50, SSP119-2045, and SSP119-2095 relative to 2019. Transportation-induced ozone radiative forcing would decrease across the globe under R20, R50, SSP119-2045, and SSP119-2095, but with magnitude smaller than PM2.5. Increases in transportation-induced PM2.5 radiative forcing are the highest over Middle East, China, and South Asia among the 15 world regions under R20, R50, SSP119-2045, and SSP119-2095. Decreases in transportation-induced ozone radiative forcing are the highest over Middle East and South Asia among the 15 world regions under R20, R50, SSP119-2045, and SSP119-2095. In general, emission reductions under R20, R50, SSP119-2045, SSP119-2095, SSP585-2095 can substantially mitigate transportation-induced PM2.5 and ozone mortality and radiative forcing over the globe relative to 2019.
4 Conclusion and discussion
In summary, we find that transportation-induced PM2.5 and ozone concentrations and their mortality and radiative effects have increased over the globe during 1990–2019. Transportation-induced surface PM2.5 and ozone concentrations are 0.8 μg m−3 (4% of total PM2.5) and 5.3 ppbv (13% of total ozone) in 2019 respectively, and have rose by 18% for PM2.5 and 19% for ozone during 1990–2019. Transportation-induced PM2.5 and ozone mortality has increased by 109% (191 thousand) and 100% (124 thousand) during 1990–2019 respectively. China and South Asia have contributed the highest to increases in global transportation-induced PM2.5 and ozone mortality among the 15 world regions. Transportation-induced PM2.5 radiative forcing changes have strong regional disparities, and have increased by 0.7% on global mean. Land transportation contributes the most to increases in transportation-induced PM2.5 and ozone mortality among the three transportation sectors. PM2.5 concentration contributes higher than baseline mortality rate and population to increases in transportation-induced PM2.5 mortality from perspective of influencing factors of mortality. Transportation-induced PM2.5 and ozone mortality would decrease by 412 thousand (67%) and 535 thousand (87%) under SSP1-1.9 in 2045 and 2095 relative to 2019 respectively.
Uncertainties in emission inventories, modeling resolutions, physical and chemical processes in our modeling can lead to biases in our results of transportation-induced PM2.5 and ozone concentrations and their mortality. Here, we evaluate the uncertainties in transportation-induced PM2.5 and ozone that resulting from emission inventory using two regional emission inventories (see methods in Section 2.3). The results show that uncertainties of transportation-induced PM2.5 and ozone concentrations range −1.2%∼8.2% over China and US in 2019, when applying MEIC inventory over China and NEI inventory over the US (Supplementary Figures S6, S7). Transportation-induced surface PM2.5 and ozone concentrations would decrease by −7.7% and −1.2% over China in 2019 respectively, when applying MEIC inventory over China. Transportation-induced surface PM2.5 and ozone concentrations would increase by 8.2% and 2.5% over US in 2019 respectively, when applying NEI inventory over the US. Transportation-induced PM2.5 and ozone mortality and radiative forcing changes by 0.4%–16.2% and 0.1%–3.3% over China and the US respectively, when replacing the inventories.
Our results of increases in transportation-induced PM2.5 and ozone mortality are comparable with most of previous studies that estimated transportation-induced PM2.5 and ozone using numerical simulations and exposure-response mortality modeling, but have some differences in some specific transportation sectors and regions (Dedoussi et al., 2020; Liu et al., 2020; McDuffie et al., 2021; Tessum et al., 2022). Few studies have investigated the long-term trends in global transportation-induced PM2.5 and ozone. Our results agree with Liu et al. (2020) that transportation-induced PM2.5 mortality has increased over China since 1990. Liu et al. (2020) estimated that land transportation-induced PM2.5 mortality has increased by 158 thousand in China during 1990–2015, with small differences in the increased values of land transportation-induced PM2.5 mortality, as our estimates are 70 thousand during 1990–2019. Differences between our study and Liu et al. (2020) in calculating the transportation-induced PM2.5 mortality are that Liu et al. (2020) used PM2.5 concentrations from the WRF-CMAQ regional air quality model. Correlation coefficient, root mean square error (RMSE), and normalized mean bias (NMB) between PM2.5 concentrations from Liu et al. (2020) and observations are 0.73, 34.2 μg m−3 and 9.1% in 2015 respectively. Liu et al. (2020) used the same exposure-response mortality model, baseline mortality rate and population count with our study. Dedoussi et al. (2020) and Choma et al. (2021) reported 22.5 thousand and 7.9 thousand decreases in transportation-induced PM2.5 and ozone mortality in US during 2005–2018 and 2008–2017 respectively. We find that transportation-induced PM2.5 and ozone mortality has increased by 12.5 thousand in North America during 1990–2019, which are opposite to Dedoussi et al. (2020) and Choma et al. (2021). The discrepancies are because that PM2.5 concentration change alone has led to decreases of transportation-induced PM2.5 mortality in North America during 1990–2019. However, increases in population count have led to growth in transportation-induced PM2.5 and ozone mortality in North America during 1990–2019. Our results of aviation-induced PM2.5 and ozone mortalities are lower but close to those estimated by Eastham et al. (2024). Eastham et al. (2024) estimated 21.2 thousand aviation-induced PM2.5 and 53.1 thousand aviation-induced ozone mortalities globally in 2015.
In this study, we estimate the impacts of transportation emissions based on GEOS-Chem simulations with horizontal resolutions of 2° × 2.5° (latitude × longitude) and linearly adjust our simulations using 0.1°latitude × 0.1°longitude GBD2021 dataset. The corrections may have uncertainties because of nonlinear physical and chemical processes over regions and connections among air pollutants. Eastham et al. (2024) simulated the impacts of aviation emissions on global air quality using the GEOS-Chem model at a higher resolution of 0.5° × 0.625° (latitude × longitude). The greater resolution has two effects: physical phenomena are more finely resolved, and changes in surface air quality which occur local to population centers can be more accurately collocated (Eastham et al., 2024). Future work can address the regional impacts of transportation emissions on air quality over regional and city scales using GEOS-Chem simulations with higher resolutions. Future studies can also focus on impacts of atmospheric transboundary transport on transportation-induced PM2.5 and ozone. The increased transportation-induced ozone radiative forcing across the globe and increased PM2.5 radiative forcing over developed countries can enhance global warming. The decreased PM2.5 radiative forcing over developing countries can lead to surface warming. The consequent impacts of transportation-induced PM2.5 and ozone on air temperature, humidity, and the other meteorological variables can be investigated in future work.
Optimizing traffic structure and travel mode, promoting new clean energy, improving transportation efficiency and management shall be effective measures to reduce transportation emissions of air pollutants. Recent studies have found that the operation of high-speed rail has improved air quality over China on national scale because of spillover effects of high-speed rail on the environment (Huang et al., 2023). Increasing the mileage of subways has reduced the air pollution level over China (Xiao et al., 2020). Increasing stringent standards, controlling light-duty passenger vehicle population growth and use, introducing alternative fuels and new energy vehicles would reduce 57%–84% the key air pollutants emissions over China in 2030 relative to 2013 (Wu et al., 2017). Gettelman et al. (2024) have found an obvious decrease in ship-induced PM2.5 because of the International Marine Organization (IMO) ship emission regulations since 2020 that reducing sulfur emissions by 80% from ships, in the Northern Hemisphere during 2022–2023. Overall, our results suggest that more attention shall be paid to abate transportation-induced air pollution and have provided valuable referenced ranges for future transportation emission reductions. Our results help improve our understanding on the impacts of global transportation changes on air pollution.
Data availability statement
The raw data supporting the conclusions of this article will be made available by the authors, without undue reservation.
Author contributions
HH: Conceptualization, Formal Analysis, Investigation, Writing – original draft, Writing – review and editing.
Funding
The author(s) declare that no financial support was received for the research and/or publication of this article.
Acknowledgments
We sincerely ackonwledge the Atmospheric Chemistry Modeling Group at Harvard University for developing and managing the GEOS-Chem model. Surface PM2.5 and ozone obervations are provided by the US EPA, EEA, and CNEMC. GBD2021 PM2.5 and ozone estimates are provided by the Institute for Health Metrics and Evaluation (IHME). GEOS-Chem simulations are supported by the High-Performance Computation Platform of Fujian Normal University.
Conflict of interest
The author declares that the research was conducted in the absence of any commercial or financial relationships that could be construed as a potential conflict of interest.
Generative AI statement
The author(s) declare that no Generative AI was used in the creation of this manuscript.
Publisher’s note
All claims expressed in this article are solely those of the authors and do not necessarily represent those of their affiliated organizations, or those of the publisher, the editors and the reviewers. Any product that may be evaluated in this article, or claim that may be made by its manufacturer, is not guaranteed or endorsed by the publisher.
Supplementary material
The Supplementary Material for this article can be found online at: https://www.frontiersin.org/articles/10.3389/fenvs.2025.1545924/full#supplementary-material
References
Anenberg, S. C., Miller, J., Henze, D. K., Minjares, R., and Achakulwisut, P. (2019). The global burden of transportation tailpipe emissions on air pollution-related mortality in 2010 and 2015. Environ. Res. Lett. 14, 094012. doi:10.1088/1748-9326/ab35fc
Barrett, S. R. H., Britter, R. E., and Waitz, I. A. (2013). Impact of aircraft plume dynamics on airport local air quality. Atmos. Environ. 74, 247–258. doi:10.1016/j.atmosenv.2013.03.061
Bey, I., Jacob, D. J., Yantosca, R. M., Logan, J. A., Field, B. D., Fiore, A. M., et al. (2001). Global modeling of tropospheric chemistry with assimilated meteorology: model description and evaluation. J. Geophys. Res. 106 (D19), 23073–23095. doi:10.1029/2001JD000807
Burnett, R., Chen, H., Szyszkowicz, M., Fann, N., Hubbell, B., Pope, C. A., et al. (2018). Global estimates of mortality associated with long-term exposure to outdoor fine particulate matter. P. Natl. Acad. Sci. USA. 115 (38), 9592–9597. doi:10.1073/pnas.1803222115
Chen, L., Lin, J., Martin, R., Du, M., Weng, H., Kong, H., et al. (2022). Inequality in historical transboundary anthropogenic PM2.5 health impacts. Sci. Bull. 67 (4), 437–444. doi:10.1016/j.scib.2021.11.007
Choma, E. F., Evans, J. S., Gómez-Ibáñez, J. A., Di, Q., Schwartz, J. D., Hammitt, J. K., et al. (2021). Health benefits of decreases in on-road transportation emissions in the United States from 2008 to 2017. P. Natl. Acad. Sci. USA. 118 (51), e2107402118. doi:10.1073/pnas.2107402118
Cohen, A. J., Brauer, M., Burnett, R., Anderson, H. R., Frostad, J., Estep, K., et al. (2017). Estimates and 25-year trends of the global burden of disease attributable to ambient air pollution: an analysis of data from the Global Burden of Diseases Study 2015. Lancet 389, 1907–1918. doi:10.1016/S0140-6736(17)30505-6
Corbett, J. J., Winebrake, J. J., Green, E. H., Kasibhatla, P., Eyring, V., and Lauer, A. (2007). Mortality from ship emissions: a global assessment. Environ. Sci. Technol. 41 (24), 8512–8518. doi:10.1021/es071686z
Dedoussi, I. C., Eastham, S. D., Monier, E., and Barrett, S. R. H. (2020). Premature mortality related to United States cross-state air pollution. Nature 578, 261–265. doi:10.1038/s41586-020-1983-8
Eastham, S. D., Chossière, G. P., Speth, R. L., Jacob, D. J., and Barrett, S. R. H. (2024). Global impacts of aviation on air quality evaluated at high resolution. Atmos. Chem. Phys. 24, 2687–2703. doi:10.5194/acp-24-2687-2024
GBD 2021 Risk Factors Collaborators Roth, G. A., Aravkin, A. Y., Zheng, P., Abate, K. H., Abate, Y. H., et al. (2024). Global burden and strength of evidence for 88 risk factors in 204 countries and 811 subnational locations, 1990–2021: a systematic analysis for the Global Burden of Disease Study 2021. Lancet 403, 2162–2203. doi:10.1016/S0140-6736(24)00933-4
Gettelman, A., Christensen, M. W., Diamond, M. S., Gryspeerdt, E., Manshausen, P., Stier, P., et al. (2024). Has reducing ship emissions brought forward global warming? Geophys. Res. Lett. 51, e2024GL109077. doi:10.1029/2024GL109077
Gidden, M. J., Riahi, K., Smith, S. J., Fujimori, S., Luderer, G., Kriegler, E., et al. (2019). Global emissions pathways under different socioeconomic scenarios for use in CMIP6: a dataset of harmonized emissions trajectories through the end of the century. Geosci. Model Dev. 12, 1443–1475. doi:10.5194/gmd-12-1443-2019
Guenther, A. B., Jiang, X., Heald, C. L., Sakulyanontvittaya, T., Duhl, T., Emmons, L. K., et al. (2012). The Model of Emissions of Gases and Aerosols from Nature version 2.1 (MEGAN2.1): an extended and updated framework for modeling biogenic emissions. Geosci. Model Dev. 5, 1471–1492. doi:10.5194/gmd-5-1471-2012
Han, H., Liu, J., Yuan, H., Wang, T., Zhuang, B., and Zhang, X. (2019). Foreign influences on tropospheric ozone over East Asia through global atmospheric transport. Atmos. Chem. Phys. 19, 12495–12514. doi:10.5194/acp-19-12495-2019
Han, H., Zhang, L., Wang, X., and Lu, X. (2024). Contrasting domestic and global impacts of emission reductions in China on tropospheric ozone. J. Geophys. Res.-Atmos. 129, e2024JD041453. doi:10.1029/2024JD041453
Han, X., and Naeher, L. P. (2006). A review of traffic-related air pollution exposure assessment studies in the developing world. Environ. Int. 32 (1), 106–120. doi:10.1016/j.envint.2005.05.020
Heald, C. L., Ridley, D. A., Kroll, J. H., Barrett, S. R. H., Cady-Pereira, K. E., Alvarado, M. J., et al. (2014). Contrasting the direct radiative effect and direct radiative forcing of aerosols. Atmos. Chem. Phys. 14, 5513–5527. doi:10.5194/acp-14-5513-2014
Hoesly, R. M., Smith, S. J., Feng, L., Klimont, Z., Janssens-Maenhout, G., Pitkanen, T., et al. (2018). Historical (1750–2014) anthropogenic emissions of reactive gases and aerosols from the Community Emissions Data System (CEDS). Geosci. Model Dev. 11, 369–408. doi:10.5194/gmd-11-369-2018
Huang, Y., Ma, L., and Cao, J. (2023). Exploring spatial heterogeneity in the high-speed rail impact on air quality. J. Transp. Geogr. 106, 103498. doi:10.1016/j.jtrangeo.2022.103498
Hudman, R. C., Moore, N. E., Mebust, A. K., Martin, R. V., Russell, A. R., Valin, L. C., et al. (2012). Steps towards a mechanistic model of global soil nitric oxide emissions: implementation and space based-constraints. Atmos. Chem. Phys. 12, 7779–7795. doi:10.5194/acp-12-7779-2012
Intergovernmental Panel on Climate Change (IPCC) (2023). Climate change 2021 –the physical science basis: working group I contribution to the sixth assessment report of the intergovernmental Panel on climate change. Cambridge University Press.
Karagulian, F., Belis, C. A., Dora, C. F. C., Prüss-Ustün, A. M., Bonjour, S., Adair-Rohani, H., et al. (2015). Contributions to cities' ambient particulate matter (PM): a systematic review of local source contributions at global level. Atmos. Environ. 120, 475–483. doi:10.1016/j.atmosenv.2015.08.087
Khomenko, S., Pisoni, E., Thunis, P., Bessagnet, B., Cirach, M., Iungman, T., et al. (2023). Spatial and sector-specific contributions of emissions to ambient air pollution and mortality in European cities: a health impact assessment. Lancet Publc Health 8, e546–e558. doi:10.1016/S2468-2667(23)00106-8
Lee, D. S., Fahey, D. W., Skowron, A., Allen, M. R., Burkhardt, U., Chen, Q., et al. (2021). The contribution of global aviation to anthropogenic climate forcing for 2000 to 2018. Atmos. Environ. 244, 117834. doi:10.1016/j.atmosenv.2020.117834
Lelieveld, J., Evans, J. S., Fnais, M., Giannadaki, D., and Pozzer, A. (2015). The contribution of outdoor air pollution sources to premature mortality on a global scale. Nature 525, 367–371. doi:10.1038/nature15371
Li, B., Gasser, T., Ciais, P., Piao, S., Tao, S., Balkanski, Y., et al. (2016). The contribution of China’s emissions to global climate forcing. Nature 531, 357–361. doi:10.1038/nature17165
Li, C., van Donkelaar, A., Hammer, M. S., McDuffie, E. E., Burnett, R. T., Spadaro, J. V., et al. (2023). Reversal of trends in global fine particulate matter air pollution. Nat. Commun. 14, 5349. doi:10.1038/s41467-023-41086-z
Li, M., Liu, H., Geng, G., Hong, C., Liu, F., Song, Y., et al. (2017). Anthropogenic emission inventories in China: a review. Natl. Sci. Rev. 4 (6), 834–866. doi:10.1093/nsr/nwx150
Liu, H., Fu, M., Jin, X., Shang, Y., Shindell, D., Faluvegi, G., et al. (2016). Health and climate impacts of ocean-going vessels in East Asia. Nat. Clim. Change 6 (11), 1037–1041. doi:10.1038/nclimate3083
Liu, J., Zheng, Y., Geng, G., Hong, C., Li, M., Li, X., et al. (2020). Decadal changes in anthropogenic source contribution of PM2.5 pollution and related health impacts in China, 1990–2015. Atmos. Chem. Phys. 20, 7783–7799. doi:10.5194/acp-20-7783-2020
Malley, C. S., Henze, D. K., Kuylenstierna, J. C. I., Vallack, H. W., Davila, Y., Anenberg, S. C., et al. (2017). Updated global estimates of respiratory mortality in adults ≥30Years of age attributable to long-term ozone exposure. Environ. Health. Persp. 125 (8), 087021. doi:10.1289/EHP1390
McDuffie, E. E., Martin, R. V., Spadaro, J. V., Burnett, R., Smith, S. J., O’Rourke, P., et al. (2021). Source sector and fuel contributions to ambient PM2.5 and attributable mortality across multiple spatial scales. Nat. Commun. 12 (1), 3594. doi:10.1038/s41467-021-23853-y
McDuffie, E. E., Smith, S. J., O'Rourke, P., Tibrewal, K., Venkataraman, C., Marais, E. A., et al. (2020). A global anthropogenic emission inventory of atmospheric pollutants from sector- and fuel-specific sources (1970–2017): an application of the Community Emissions Data System (CEDS). Earth Syst. Sci. Data 12, 3413–3442. doi:10.5194/essd-12-3413-2020
Ni, R., Lin, J., Yan, Y., and Lin, W. (2018). Foreign and domestic contributions to springtime ozone over China. Atmos. Chem. Phys. 18, 11447–11469. doi:10.5194/acp-18-11447-2018
O'Neill, B. C., Tebaldi, C., van Vuuren, D. P., Eyring, V., Friedlingstein, P., Hurtt, G., et al. (2016). The scenario model Intercomparison Project (ScenarioMIP) for CMIP6. Geosci. Model Dev. 9, 3461–3482. doi:10.5194/gmd-9-3461-2016
Ott, L. E., Pickering, K. E., Stenchikov, G. L., Allen, D. J., DeCaria, A. J., Ridley, B., et al. (2010). Production of lightning NOx and its vertical distribution calculated from three-dimensional cloud-scale chemical transport model simulations. J. Geophys. Res. 115, D04301. doi:10.1029/2009JD011880
Shu, L., Wang, T., Han, H., Xie, M., Chen, P., Li, M., et al. (2020). Summertime ozone pollution in the Yangtze River Delta of eastern China during 2013–2017: synoptic impacts and source apportionment. Environ. Pollut. 257, 113631. doi:10.1016/j.envpol.2019.113631
Shu, L., Wang, T., Liu, J., Chen, Z., Wu, H., Qu, Y., et al. (2024). Elucidating drivers of severe wintertime fine particulate matter pollution episodes in the Yangtze River Delta region of eastern China. Sci. Total. Environ. 912, 169546. doi:10.1016/j.scitotenv.2023.169546
Sicard, P., Agathokleous, E., Anenberg, S. C., Marco, A. D., Paoletti, E., and Calatayud, V. (2023). Trends in urban air pollution over the last two decades: a global perspective. Sci. Total. Environ. 858, 160064. doi:10.1016/j.scitotenv.2022.160064
Silva, R. A., Adelman, Z., Fry, M. M., and West, J. J. (2016). The impact of individual anthropogenic emissions sectors on the global burden of human mortality due to ambient air pollution. Environ. Health. Persp. 124 (11), 1776–1784. doi:10.1289/EHP177
Simone, N. W., Stettler, E. J., and Barrett, S. R. H. (2013). Rapid estimation of global civil aviation emissions with uncertainty quantification. Transp. Res. D-TR. E. 25, 33–41. doi:10.1016/j.trd.2013.07.001
Tessum, M. W., Anenberg, S. C., Chafe, Z. A., Henze, D. K., Kleiman, G., Kheirbek, I., et al. (2022). Sources of ambient PM2.5 exposure in 96 global cities. Atmos. Environ. 286, 119234. doi:10.1016/j.atmosenv.2022.119234
Turner, M. C., Jerrett, M., Pope, C. A., Krewski, D., Gapstur, S. M., Diver, W. R., et al. (2016). Long-term ozone exposure and mortality in a large prospective study. Am. J. Respir. Crit. Care Med. 193 (10), 1134–1142. doi:10.1164/rccm.201508-1633OC
van der Werf, G. R., Randerson, J. T., Giglio, L., van Leeuwen, T. T., Chen, Y., Rogers, B. M., et al. (2017). Global fire emissions estimates during 1997–2016. Earth Syst. Sci. Data 9, 697–720. doi:10.5194/essd-9-697-2017
Wang, H., He, X., Liang, X., Choma, E. F., Liu, Y., Shan, L., et al. (2020). Health benefits of on-road transportation pollution control programs in China. P. Natl. Acad. Sci. USA. 117 (41), 25370–25377. doi:10.1073/pnas.1921271117
Wang, X., Fu, T.-M., Zhang, L., Cao, H., Zhang, Q., Ma, H., et al. (2021). Sensitivities of ozone air pollution in the beijing–tianjin–hebei area to local and upwind precursor emissions using adjoint modeling. Environ. Sci. Technol. 55 (9), 5752–5762. doi:10.1021/acs.est.1c00131
Wu, Y., Zhang, S., Hao, J., Liu, H., Wu, X., Hu, J., et al. (2017). On-road vehicle emissions and their control in China: a review and outlook. Sci. Total. Environ. 574, 332–349. doi:10.1016/j.scitotenv.2016.09.040
Xiao, D., Li, B., and Cheng, S. (2020). The effect of subway development on air pollution: evidence from China. J. Clean. Prod. 275, 124149. doi:10.1016/j.jclepro.2020.124149
Xu, J.-W., Lin, J., Luo, G., Adeniran, J., and Kong, H. (2023). Foreign emissions exacerbate PM2.5 pollution in China through nitrate chemistry. Atmos. Chem. Phys. 23, 4149–4163. doi:10.5194/acp-23-4149-2023
Yim, S. H. L., Lee, G. L., Lee, I. H., Allroggen, F., Ashok, A., Caiazzo, F., et al. (2015). Global, regional and local health impacts of civil aviation emissions. Environ. Res. Lett. 10 (3), 034001. doi:10.1088/1748-9326/10/3/034001
Zhang, L., Liu, L., Zhao, Y., Gong, S., Zhang, X., Henze, D. K., et al. (2015). Source attribution of particulate matter pollution over North China with the adjoint method. Environ. Res. Lett. 10, 084011. doi:10.1088/1748-9326/10/8/084011
Zhang, Q., Jiang, X., Tong, D., Davis, S. J., Zhao, H., Geng, G., et al. (2017). Transboundary health impacts of transported global air pollution and international trade. Nature 543, 705–709. doi:10.1038/nature21712
Zhang, Q., Zheng, Y., Tong, D., Shao, M., Wang, S., Zhang, Y., et al. (2019). Drivers of improved PM2.5 air quality in China from 2013 to 2017. P. Natl. Acad. Sci. USA. 116 (49), 24463–24469. doi:10.1073/pnas.1907956116
Keywords: air pollution, transportation emission, air pollution mortality, radiative forcing, shared socio-economic pathways
Citation: Han H (2025) Increases in global transportation-induced air pollution mortality and radiative forcing during 1990–2019. Front. Environ. Sci. 13:1545924. doi: 10.3389/fenvs.2025.1545924
Received: 16 December 2024; Accepted: 19 May 2025;
Published: 30 May 2025.
Edited by:
Rui Mao, Beijing Normal University, ChinaReviewed by:
Sarkawt Hama, University of Sulaymaniyah, IraqHewen Niu, Chinese Academy of Sciences (CAS), China
Copyright © 2025 Han. This is an open-access article distributed under the terms of the Creative Commons Attribution License (CC BY). The use, distribution or reproduction in other forums is permitted, provided the original author(s) and the copyright owner(s) are credited and that the original publication in this journal is cited, in accordance with accepted academic practice. No use, distribution or reproduction is permitted which does not comply with these terms.
*Correspondence: Han Han, aGhhbkBmam51LmVkdS5jbg==