 Hongxing He1*†
 Tim Moore1†
 Peter Lafleur2†Oliver Sonnentag3†Elyn Humphreys4†
 Mousong Wu5†
 Nigel Roulet1†
- 1Department of Geography, McGill University, Montreal, QC, Canada
- 2School of Environment, Trent University, Peterborough, ON, Canada
- 3Département de géographie, Université de Montréal, University of Montréal, Montréal, QC, Canada
- 4Geography and Environmental Studies, Carleton University, Ottawa, ON, Canada
- 5International Institute for Earth System Science, Nanjing University, Nanjing, China
Predicting the carbon dynamics of northern peatlands requires adequate representation of the vegetation phenology in terrestrial biosphere models. In this study, we analyzed the relative importance of various environmental controls to explain the start of the growing season through photosynthetic CO2 uptake for a temperate continental bog; accordingly, we used a multiyear measured dataset comprising eddy covariance (EC), supporting environmental measurements, and a digital image archive obtained using repeat photography. The vegetation in the studied bog is dominated by “evergreen” shrubs and mosses. The vegetation phenological indices data, including enhanced vegetation index, normalized difference vegetation index, and green chromatic coordinate, showed high correlations with the gross primary productivity (GPP) of the ecosystem obtained from EC measurements, near-surface soil temperatures, and the growing degree-day sum (∑GDD). We developed a new phenology scheme in the process-based CoupModel using ∑GDD to represent the gradual greening of the evergreen shrubs that regulate spring photosynthesis turn-on and increase. The new model simulates the earlier photosynthesis turn-on of the mosses and photosynthesis onset of the shrubs from days with ∑GDD = 50°C. Model simulations incorporating the new phenology subroutine for two vegetation layers (shrubs and mosses) show improved agreement with the daily EC-derived GPP. Our results show that when the spring phenology is not explicitly factored in, the CoupModel overestimates GPP by 24% and MODIS GPP by 45% at the end of the spring season. The results from this study are expected to advance our understanding of ecosystem dynamics and provide a foundation for refining ecosystem models to better capture the intricate interplay between phenology, carbon dynamics, and environmental conditions.
Highlights
• Environmental controls for the spring phenology of a temperate bog were analyzed.
• An explicit phenology scheme of two canopies was suggested based on ∑GDD to better model the GPP.
• Spring phenology shows unrecognized importance for regulating peatland CO2 exchanges.
1 Introduction
Long-term observations of vegetation indicate that the ongoing climate changes have altered the timings of key phenological events, including earlier onset of spring photosynthesis in mid- and high-latitude regions (Zhou et al., 2001; Jeong et al., 2011; Richardson et al., 2013; Huang et al., 2023). Such phenological changes have been shown to potentially increase the length of the growing season, thus enhancing vegetation growth (Nemani et al., 2003; Menzel et al., 2020). Peatlands are regions in which almost 21% of the global soil carbon is stored (Leifeld and Menichetti, 2018), and changing spring phenology is expected to impact the carbon dynamics of photosynthesis, productivity, and ecosystems (Koebsch et al., 2020; Antala et al., 2022).
Many species of “evergreen” shrubs that grow in the northern peatlands turn brownish during winter (Figure 1). This is mainly because the soil freezes during winter, and root water uptake is slower than the leaf evaporation losses (Goulden, 1998; Jarvis and Linder, 2000), leading to desiccation of the leaves and degradation of leaf chlorophyll-a (Hendry et al., 1987). During “spring greening,” the soil temperatures are lower than air temperatures owing to the presence of snow and ice as well as the high heat capacity of saturated peat (Kujala et al., 2008). Cold temperatures and slow development of photosynthetic capacity inhibit the ability of vascular vegetation to utilize the radiation potential (Moore et al., 2006; Rafat et al., 2021).
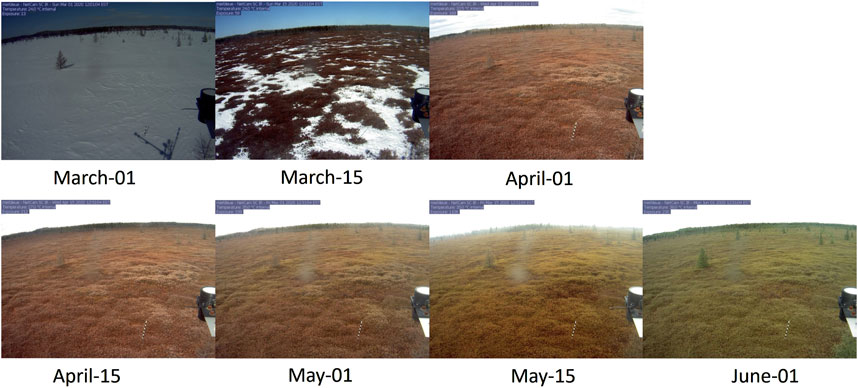
Figure 1. Spring seasonal color changes at Mer Bleue in 2020 based on figures acquired with PhenoCam. Credit: Oliver Sonnentag.
Spring greening of the northern peatlands is also controlled by overstory and understory phenology (Richardson and O’Keefe, 2009). On the one hand, overstory shrubs and trees, whose roots are embedded in frozen soil, must wait for soil thawing before new materials can be supplied to the leaves/needles (Moore et al., 2006). On the other hand, the peat surface comprises Sphagnum spp. and other mosses (such as Polytrichum strictum) that do not have roots, thereby offering several advantages that can hasten spring turn-on days to weeks earlier than for vascular plants (Peichl et al., 2018). Since mosses do not have a root system, they require only a few centimeters of thaw depth before becoming active. They can use “local water” availability (near the capitulum) to support photosynthesis (Strack and Price, 2009). Moreover, the light saturation of photosynthetic active radiation for gross primary productivity (GPP) in Sphagnum is lower than that for most vascular plants (Small, 1972; Chong et al., 2015), so high light levels are not required for photosynthesis at optimum rates. Field observations have been used to report the photosynthetic uptake of CO2 beneath a spring snowpack in a boreal bog (Bubier et al., 1998).
Thus far, the environmental controls of spring phenology in the northern peatlands remain unclear. Aurela et al. (2004) showed that the timing of the snowmelt is the most important variable regulating the spring uptake of CO2 for a subarctic fen; however, data from two low arctic tundra sites support the importance of leaf area development as a key factor instead of snowmelt (Humphreys and Lafleur, 2011). Moore et al. (2006) analyzed data from a temperate bog and found that although snow cover loss controlled the onset of photosynthesis, soil rather than air temperature had a high correlation with the increasing spring GPP. Conversely, Peichl et al. (2015) applied the green chromatic coordinate (Gcc) as a phenological greenness index to trace the vegetation development of a boreal fen and found that the GPP is highly correlated with Gcc; the authors also noted that the main control of onset of spring vegetation green-up was air temperature expressed in terms of the growing degree-day sum (∑GDD). These studies demonstrate the incomplete understanding of phenology controls, which have led to large biases in vegetation phenology simulations in current peatland models (Richardson et al., 2012; Hanninen et al., 2019).
Descriptions of vegetation phenology and their impacts on CO2 fluxes differ widely among the current ecosystem models used to simulate peatland C dynamics (for a brief review, see Table 1). Generally, these models can be divided into two groups, where the first group does not consider phenology or implicitly considers the impacts of phenology using air temperature as a master variable to describe the GPP (i.e., PDM, HPM, CaMP, ECOSSE, PEATLAND, and PMS models in Table 1). Thus, the phenological changes and their feedback to the C cycles are not explicitly considered in these models. The second group of models explicitly describes the phenological processes, with the majority of models using the ∑GDD approach, such as the PCARS and other global vegetation models (PEAT-CLSM, LPJ, ORCHIDEE-PEAT, and ELM). These models assume that the vegetation phenology for spring leaf flush and growth can be modeled as linear increases in biomass as the ∑GDD exceeds some defined thresholds. However, these models vary in the air temperature values from which the GDD accumulation commences, the optimum value, and number of ∑GDDs needed to initiate the spring flush. In addition, some existing models (LPJ, ORCHIDEE-PEAT, ELM, PCARS, and MWM in Table 1) generally assume that the phenology impacts GPP indirectly through changes in the leaf area index (LAI) and hence light interception. Although the DNDC model assumes a direct impact of GPP by regulating the photosynthetically active biomass, it does not consider phenology for the woody plants, i.e., shrubs (Zhang et al., 2002).
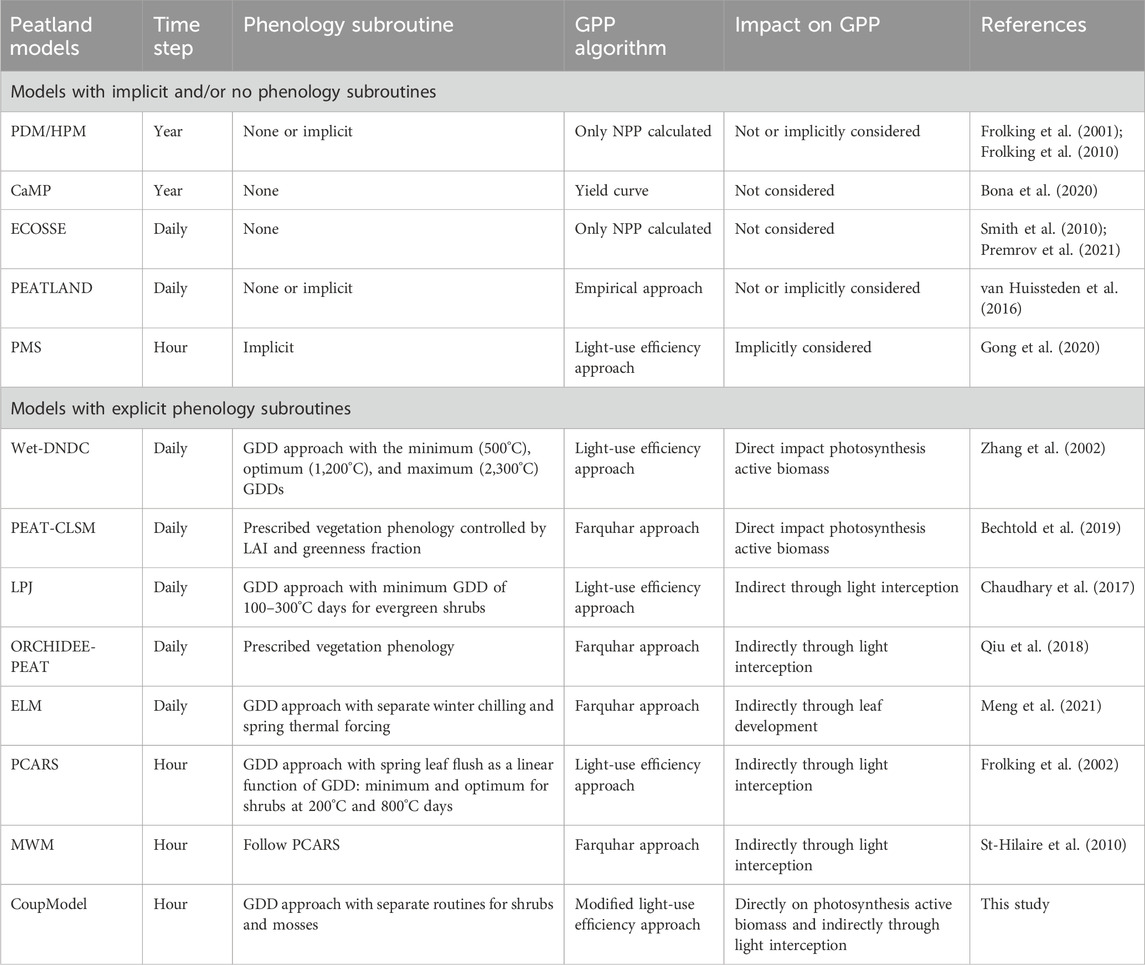
Table 1. Review of phenology and GPP descriptions in process-based ecosystem models that have been applied to peatlands.
The net ecosystem exchange (NEE) has been continuously measured for more than 20 years at Mer Bleue, a shrub and moss-dominated raised bog located in southern Canada (Roulet et al., 2007; He et al., 2023). Large annual variabilities are observed in terms of the magnitude and timing of changes from positive to negative NEE (Supplementary Figure S1). The overall aim of this study is to elucidate the environmental controls of spring phenology for the Mer Bleue bog and to suggest an improved empirical phenology model scheme of two canopies thereafter to better simulate peatland GPP. Accordingly, we use a detailed dataset (2013–2018) combining eddy covariance (EC) CO2 flux data, environmental measurements, and vegetation indices via PhenoCam (Sonnentag et al., 2012; Richardson et al., 2018) and MODIS data to track plant phenology. We then test this scheme using the CoupModel, which was calibrated in a previous study (He et al., 2023) for the entire year against measured data but resulted in an anomalous overestimate of the GPP (or NEE) for spring (Figure 4 in He et al., 2023). Our specific objectives are as follows:
1) to identify the environmental controls for spring phenology;
2) to evaluate the common model assumption that the spring phenology can be described by the ∑GDD function; and
3) to revise the CoupModel scheme for GPP by considering the influence of phenology.
2 Study site and methods
2.1 Brief description of the study site
Mer Bleue peatland is a large (∼28 km2) raised, ombrotrophic bog located 10 km east of Ottawa, Canada (45.41oN, 75.48oW). The regional climate (1971–2020) is cool temperate continental, with a mean annual temperature and precipitation of 6.1°C and 948 mm, respectively. The study area is gently sloped with hummock–hollow microtopographic differences of ∼0.25 m (Wilson, 2012). Hummocks cover approximately 70% of the surface area. Vegetation on the hummocks is dominated by “evergreen” (Chamaedaphne calyculata, Rhododendron groenlandicum, and Kalmia angustifolia) and sparse deciduous (Vaccinium myrtilloides) shrubs. These shrubs have an average height of 0.2–0.3 m and LAI of ∼1.3 (Moore et al., 2002; Bubier et al., 2006). Both hummocks and hollows are covered by a continuous mat of Sphagnum mosses (S. capillifolium; S. magellanicum), with the capitulum area cover of ∼100%. The evergreen vegetation shows pronounced seasonal phenology at the site owing to the continental climate featuring cold winters around January (−10.8°C ± 2.9 °C) and warm summers around July (20.9°C ± 1.1 °C). The leaves of the shrubs turn brown over winter and gradually turn green by the end of May (Figure 1). He et al. (2023) provided a detailed description of the site, measured environmental parameters, EC flux data (i.e., 1998–2020 GPP derived from NEE) (Lafleur et al., 2003), and CoupModel structure and parameters. Herein, we additionally acquired data on the vegetation phenological indexes to trace vegetation development and focused on the months of March to May (i.e., spring onset period).
2.2 Vegetation phenological indexes
Two sets of vegetation phenological indexes were used in this study: onsite greenness index data and MODIS products as means with available pixels downloaded from the MODIS land product subset website (http://daac.ornl.gov/MODIS, accessed on 3 July 2021). The greenness index data as a part of the PhenoCam Network, Type I PhenoCam sites (Seyednasrollah et al., 2019) were obtained from hourly photographs with a digital camera (PlantCam WSCA04, Wingscapes, Calera, AL, United States) from the flux tower located ∼3 m above the peat surface (Figure 1). The Gcc index was calculated from the red-green-blue color channel information following the methods of Filippa et al. (2016). As suggested by Sonnentag et al. (2012), the 90th percentile of the Gcc value obtained from 3-day moving windows was assigned to the central day to reduce the time-series variability. We used two MODIS products, namely, the 16-day maximum value composites of the 250 m normalized difference vegetation index (NDVI) and enhanced vegetation index (EVI) data, as well as downloaded the MODIS GPP data to compare the modeled GPP results with different model schemes. The temporal coverage of the vegetation phenological indexes is 2013–2018. All MODIS datasets were screened and filtered using the quality flags included in each product.
2.3 Explicit phenology modeling in CoupModel
The main structure of CoupModel is a one-dimensional vertical model with several layers of vegetation (e.g., a shrub and moss layer, as in the present application) on a multilayered soil profile (He et al., 2023). The vegetation is described using the “multiple big leaves” concept by simulating two canopies considering mutual competition for light interception and water uptake. He et al. (2023) described the detailed soil–plant–atmospheric model structure of the CO2 fluxes, vegetation, and abiotic processes at Mer Bleue using the implicit (default) phenology model governed by air temperature. In this study, we report an explicit phenology model and compare the results with the earlier implicit and MODIS modeling approaches.
For the implicit GPP approach, CoupModel utilized a light-use efficiency approach (Monteith, 1965) regulated by water availability and air temperature (Equation 3) without f(∑GDD)). CoupModel separates the onsets of spring photosynthesis for the shrub and moss vegetation layers. Parameterizations were then defined based on previous studies conducted at Mer Bleue (Moore et al., 2006; Chong et al., 2015; Kross et al., 2016). The mosses were assumed to start photosynthesis when the air temperature was higher than 0°C, and the corresponding value for the shrubs was considered to be 5°C. Water influences GPP differently for the two layers, and a higher light-use efficiency was defined for the shrubs than mosses (Supplementary Table S1 of He et al. (2023)). MODIS GPP used a similar light-use efficiency model but with different water and temperature scalars. The EC footprint of Mer Bleue was classified as Woody Savannas according to the IGBP MODIS landcover scheme. A daily minimum air temperature above −8°C was considered to initiate GPP, which was noted to reach maximum efficiency when the minimum air temperature exceeded 11.4°C. MODIS GPP did not separate the aboveground and surface moss layers. For a more detailed description of MODIS GPP, readers may refer to its user guide (https://www.umt.edu/numerical-terradynamic-simulation-group/files/modis/MOD17UsersGuide2015_v3.pdf; accessed on 3 July 2023).
In this study, an additional modification was made to account for the phenology when modeling GPP, i.e., the explicit approach, whereby a new scalar f(∑GDD) was introduced. First, CoupModel calculates the cumulative ∑GDD daily as in Equation 1:
where d is the day of the year, di and df are the initial (i.e., first day when daily air temperature exceeds 5°C) and final values of d for the growing season degree-day sum, Ta is the mean daily air temperature. Thus, di was identified as the first day in spring when the daily air temperature exceeded 0°C and accumulated to exceed 5°C. The calculated ∑GDD is then used as a thermal accumulation index to trace the events of the vegetation phenology. Shrub photosynthesis was defined to commence on days when the ∑GDD threshold crossed 50°C (Figure 3). A new scalar of f(∑GDD) is defined as a linear function of ∑GDD and calculated as in Equation 2:
where pTsum and pTsum, opt are parameters. The initial photosynthesis rate (pTsum) of the shrubs was set to 25% of its full potential (further regulated by air temperature, water, and radiation) on days when ∑GDD exceeded 50°C and increased linearly with ∑GDD, reaching the optimum rate (also regulated by air temperature, water, and radiation) when ∑GDD (pTsum, opt) reached 1,200°C in the middle of July. The explicit GPP for the shrubs is then calculated as in Equation 3):
where GPP is the photosynthesis rate (g C m-2 d-1); Rs is the global radiation absorbed by the vegetation (J m-2 d-1); εL is the radiation use efficiency (g C J-1); and f(Ta), f(∑GDD), and f(E/Etp) are scalars with values between 0 (i.e., no photosynthesis) and 1 (i.e., optimum photosynthesis rate) for the air temperature, plant phenology, and plant available water.
Research shows that Sphagnum mosses do not exhibit air temperature acclimation or profound phenology (Chong et al., 2015); thus, f(∑GDD) = 1 was assumed for the mosses. In other words, the moss GPP on any day was directly regulated by radiation, air temperature, and water conditions, which are the same parameters as those used in the implicit approach. These three model approaches (implicit, explicit, and MODIS) were then evaluated against the tower GPP measurements.
2.4 Data processing and statistical analysis
To investigate the environmental controls of spring phenology and CO2 flux, 3-day average NEE, GPP, ecosystem respiration (ER), and vegetation indices (Gcc, NDVI, and EVI) were analyzed for correlations with the measured environmental variables. Details about the EC measurements and data processing were reported earlier in He et al. (2023). CoupModel was previously evaluated against the hydrological, thermal, and CO2 flux data from Mer Bleue (He et al., 2023). Herein, we report the model evaluation results with the tower GPP data. The evaluations were conducted using time series and goodness of fit and were quantified by the linear regression coefficient of determination (R2) and mean values of the simulated and measured data.
3 Results
The measured air temperature and precipitation data from 2013 to 2018 show a generally warmer and wetter March, a colder but wetter April, and a warmer and slightly drier May compared to the long-term (1971–2020) climate normals (Table 2). Large annual variations in climate were recorded over the spring periods, particularly in March, with the air temperature ranging from −20 to 0°C for the 6-year study period. Over winter, the site was covered by an average of ∼0.4 m depth of snow, with less snow on the hummocks. The average relief between the hummocks and hollows was 25 cm without snow cover but reduced to ∼12 cm for peak snow depth, and the site was permanently snow-free from the middle of April to May, as illustrated in Figure 1 for 2020. The snow first disappeared from the hummocks then the hollows, but the hollows had warmer soil temperatures than the hummocks owing to insulation by the snow. The soil temperature at a depth of 10 cm below the hummocks was less than 0°C for most of March and increased to above 0°C after the snow melted. The water table depth (WTD) showed large variations over the study duration, with a large rise in April due to snow melting and decrease till the end of May (Figure 2). The melt rise was thus earlier in 2016 than the other years, and the water table changed by about 10–15 cm each year. Intermittent volumetric soil moisture data at depths of 5 cm below the hummocks fluctuated between 20% and ∼100% over the study period (Supplementary Figures S2, S3).
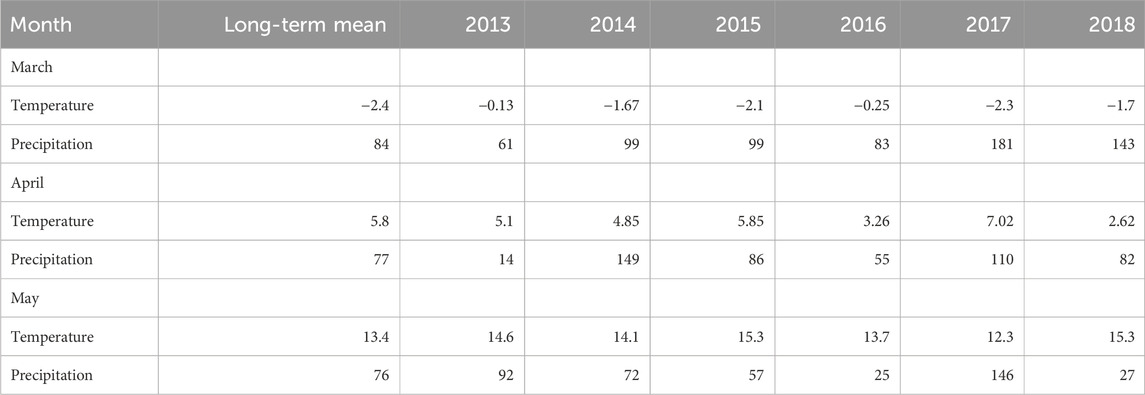
Table 2. Long-term (1971–2020) mean monthly temperature (°C) and mean monthly precipitation (mm) values for March, April, and May based on data from the Ottawa airport located 10 km southwest of the Mer Bleue site as well as values for 2013–2018 measured on site.
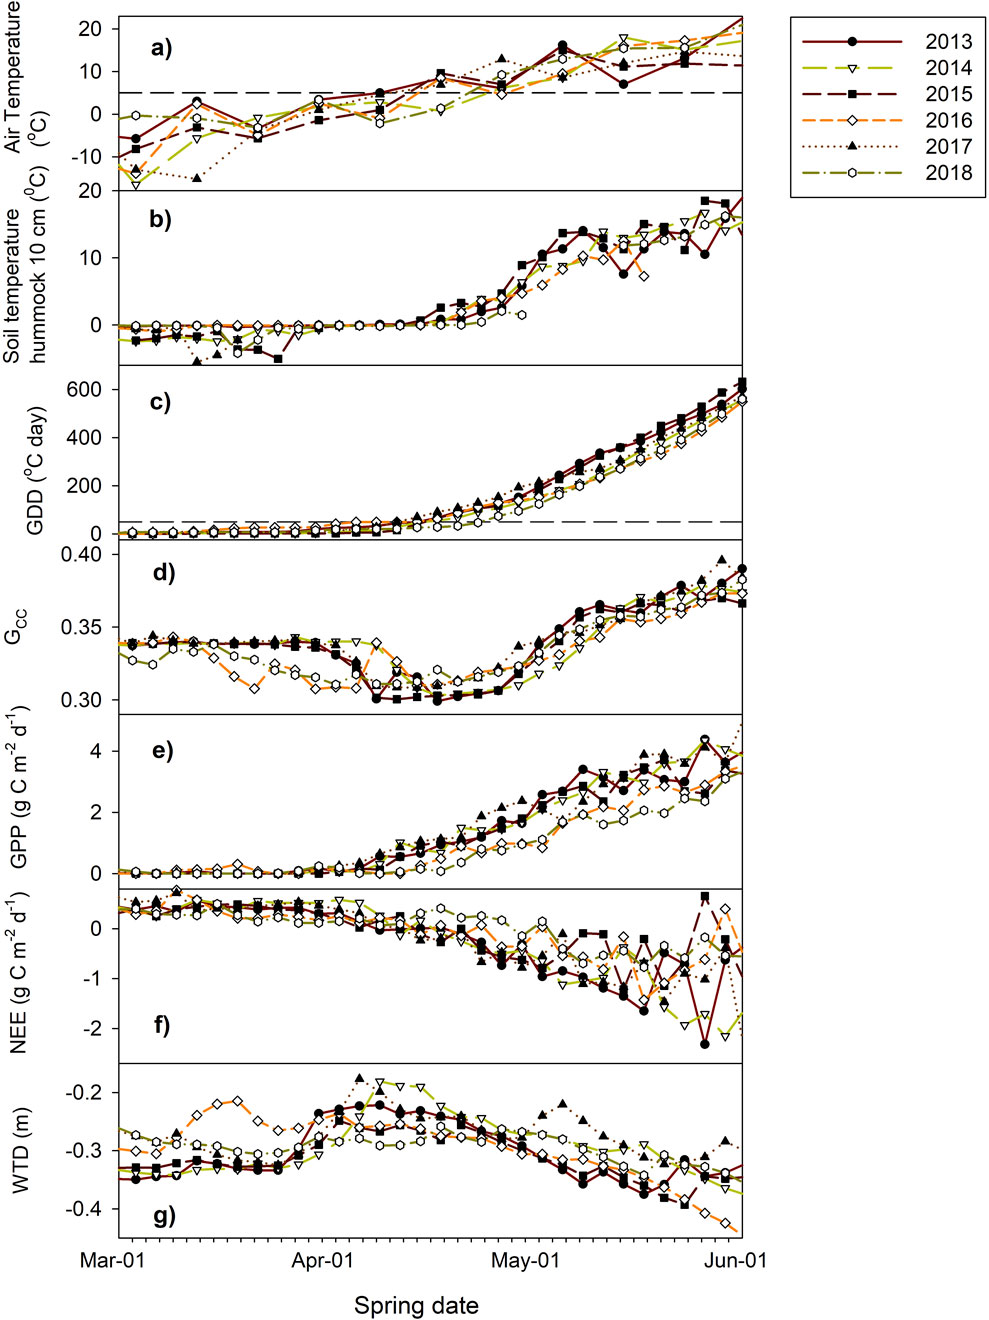
Figure 2. Measured spring seasonal patterns at Mer Bleue over 2013–2018: (a) air temperature, (b) soil temperature at a hummock depth of 10 cm, (c) growth degree-day sum (∑GDD), (d) green chromatic coordinate (Gcc), (e) growth primary productivity (GPP), (f) net ecosystem exchange (NEE), and (g) water table depth (WTD). All data are in terms of 3-day average, where the dashed lines indicate 5°C in (a) and 50°C day in (c).
The measured phenological index Gcc varied little during winter, reaching the lowest value when ∑GDD reached 50°C day in the middle of April (Figures 2, 3); this coincided with snowpack disappearance and soil temperatures above 0°C as well as increased linearly until the end of May (Figure 2). The green-up days (defined as days with the lowest Gcc index values) started between day of year (DOY) 107 (7 April 2015) and DOY 110 (20 April 2018) over the studied years and reached peak Gcc values between DOY 163 (12 June 2014) and DOY 192 (10 July 2016). The MODIS EVI values showed slightly delayed green-up days between DOY 110 (20 April 2017) and DOY 117 (27 April 2014) compared to Gcc, probably owing to the coarser temporal resolution, and reached peak EVI on DOY 168 (17 June 2018). Thus, it takes approximately 2 months (55 days based on EVI and 53–83 days based on Gcc) for the shrub vegetation to reach peak greenness at the Mer Bleue site.
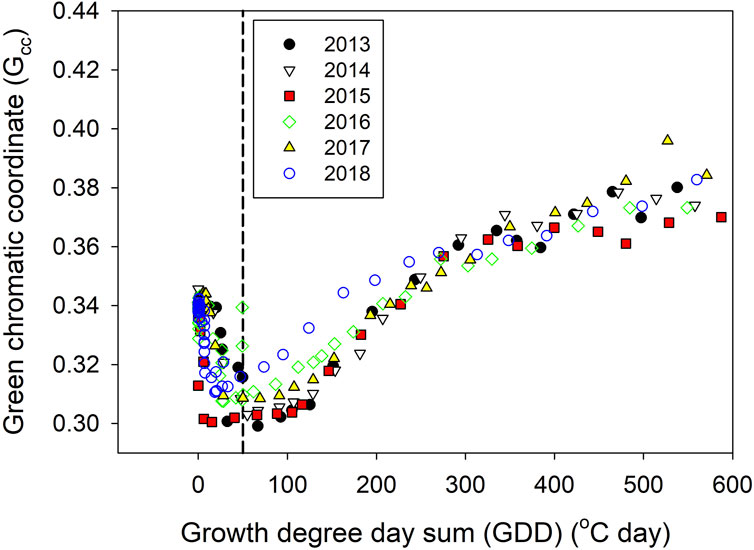
Figure 3. Measured green chromatic coordinate (Gcc) and growth degree-day sum (∑GDD) over the spring seasons of 2013–2018, where dashed line indicates the threshold of 50°C day.
The starting date of daily photosynthesis, derived from the GPP flux data, ranged from DOY 69 (9 March 2016) to DOY 92 (2 April 2015), which is a slightly earlier onset than the DOYs 86 and 101 identified from the GPP data for 1999–2003 (Moore et al., 2006). These dates are also earlier than the green-up days identified by the phenological indices (Gcc, EVI) and are likely attributable to the earlier onset of the moss layer (Supplementary Figure S3). The daily photosynthesis rates over the 6 years showed a strong linear increase from onset, reaching an average value of ∼3.5 g C m-2 d-1 at the end of May and an average daily change of ∼0.06 g C m-2 d-1 (Figure 2). The measured tower-NEE data showed that the CO2 loss over winter had a rate of ∼0.5 g C m-2 d-1 but switched to uptake around the middle of April. At the end of May, the NEE reached −1 to −2 g C m-2 d-1, with large annual variations between the years (Figure 2).
The 6-year data of the peatland CO2 fluxes (NEE, GPP, and ER) show high correlations with the phenological indices, including Gcc, NDVI, and EVI (Table 3). Among the environmental factors, the thermal indices including ∑GDD and near-soil surface temperatures showed the highest correlations with the phenological indices (Table 3). Water seems to have a lower influence on spring phenology, as the precipitation shows no correlation with any of the phenological indices, and the WTD is only moderately correlated with Gcc. Similar to Moore et al. (2006), we found that soil temperature rather than air temperature had the highest correlations with the CO2 fluxes and that the accumulating soil temperatures did not increase the correlation. However, accumulating air temperature to ∑GDD increased the correlations between the air temperature and CO2 fluxes as well as phenological indexes to the same level as those of soil temperature (Table 3). In particular, ∑GDD showed a higher correlation with Gcc than soil temperature. A strong correlation between ∑GDD and soil temperature was also identified; this is expected since the air and soil temperatures are correlated with a time lag (Table 3).
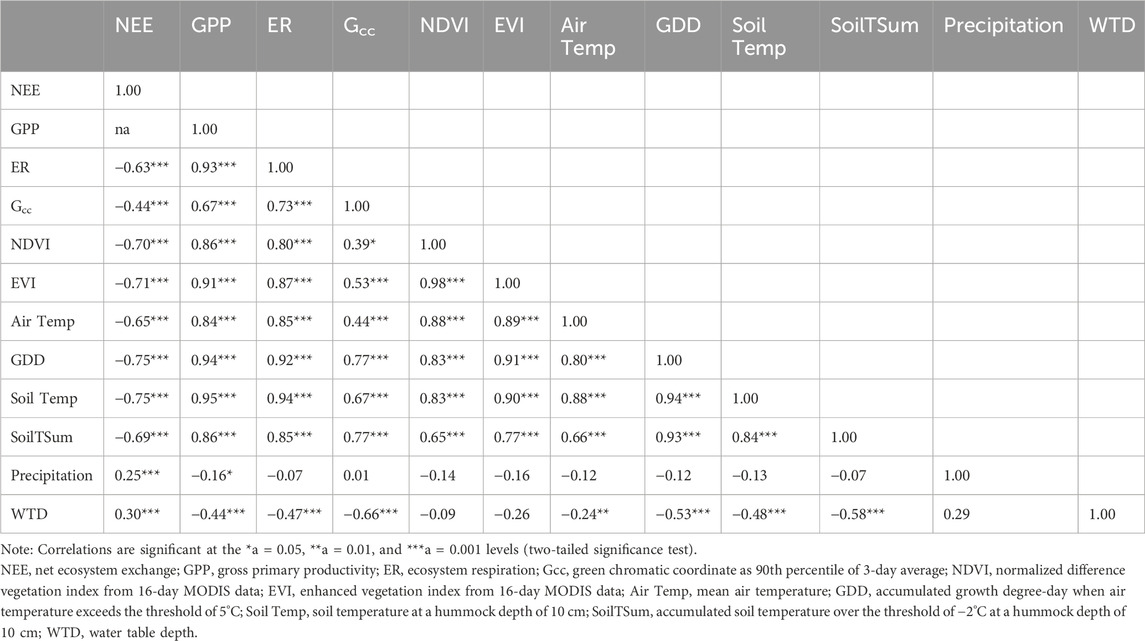
Table 3. Correlation matrix with measured spring season (March–May) data of 2013–2018 at Mer Bleue (n = 186).
To evaluate the importance of spring green-up in regulating photosynthesis, we compared the GPPs under three model structures with the measured data. The model evaluation results show improved fit with reduced mean errors for the GPP data when the shrub phenology was explicitly included in the GPP algorithm in CoupModel (Figure 4). Without factoring in the ∑GDD-induced phenology, the commonly used light-use efficiency model (implicit approach) overestimated the GPP by up to 17%. Model simulations also showed that the moss layer had an earlier onset than the shrubs during spring and dominates the GPP from March to May with an average uptake rate of ∼0.25 g C m-2 d-1 before the shrubs take over (Supplementary Figure S3). The MODIS GPP overestimated the tower-derived GPP by 22% over the entire study period; at the end of May, the MODIS GPP overestimated the GPP by 45% (Figure 4). Therefore, models need to consider vegetation phenology in their structures to improve the accuracy of simulating peatland CO2 fluxes.
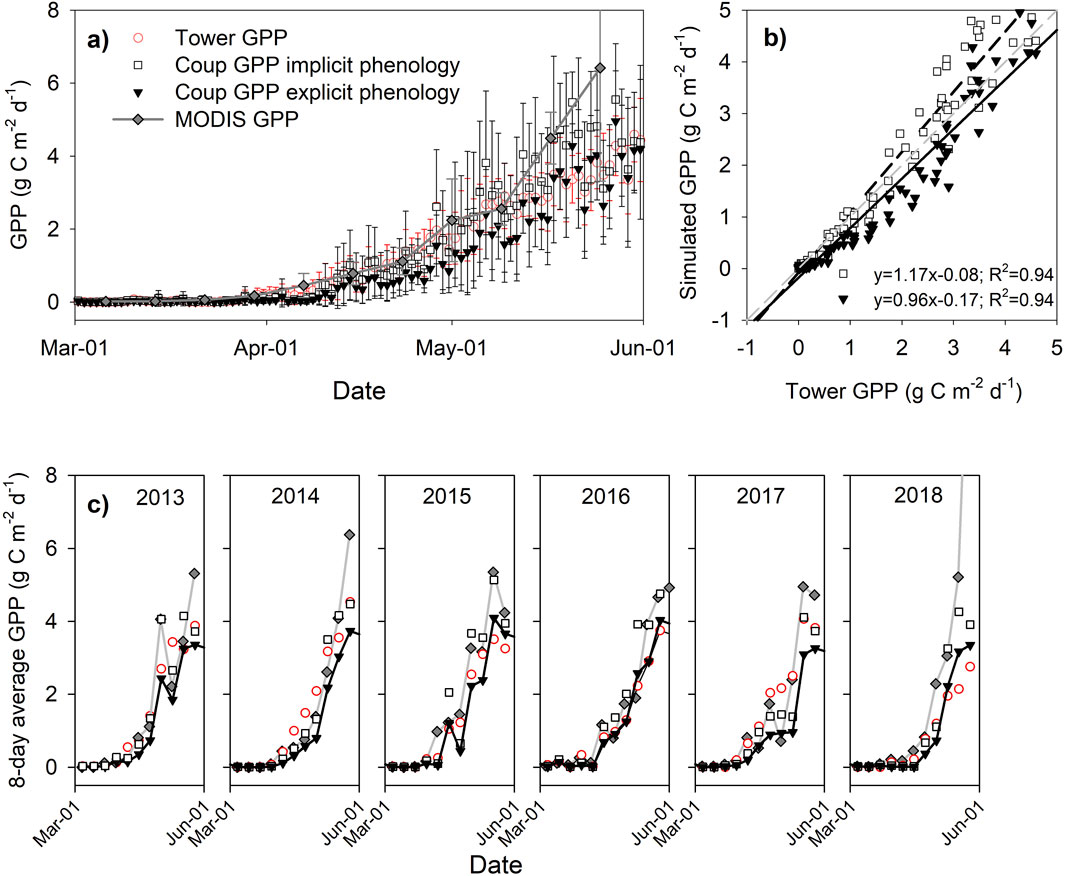
Figure 4. (a) Simulated GPP in the CoupModel, MODIS GPP, and tower-measured GPP; (b) scatter plot of GPP simulated with implicit and explicit phenology in the CoupModel; (c) 8-day averages of the MODIS GPP and GPP values simulated by CoupModel. The average of data over 6 years is used in (a, b), and the error bars indicate the standard deviations over the study years.
4 Discussion
4.1 Environmental control of spring phenology and implications for modeling
Our data analyses and evaluations of the three GPP model schemes show the substantial impacts of spring phenology changes, both in timing and recovery rate of the active photosynthetic biomass, on the CO2 fluxes at the Mer Bleue peatland. The conventional focus of vegetation phenology studies has predominantly been on leaf unfolding or budburst during spring, with leaf color changes being discussed more in the context of the autumn season (Tang et al., 2016; Piao et al., 2019). However, the findings from our study reveal a previously underexplored significance of spring green-up for evergreen shrubs in peatland ecosystems. This emergence of the spring green-up as a crucial phenological event for photosynthesis recovery suggests the need for photosynthesis models to incorporate these effects into their algorithms alongside temperature, water, and radiation factors. Peichl et al. (2018) applied a light-use efficiency model similar to the CoupModel to simulate the GPP for a boreal peatland and found that the maximum GPP parameter at light saturation (GPPmax) has large temporal variations that are mainly related to vegetation species composition and phenology. They concluded that vegetation phenology is the main driver of the seasonal GPPmax trajectory and that the photosynthetically active biomass constrains potential peatland photosynthesis. In our study, we advanced the common light-use efficiency model by developing an explicit phenology scheme to account for the influences of phenological changes on spring photosynthesis. The simulation results suggest that spring greening could account for approximately 22% of the mean GPP during this period. This can be partly explained by the four dominant shrub covers (aboveground biomass: 61% shrubs vs. 30% for mosses from Moore et al. (2002)) showing “spring greening” at the Mer Bleue site and more importantly by the extended duration of the spring recovery process. This extended green-up duration aligns with the cold peat soils in winter for a continental climate, thick acrotelm layer (∼40 cm), and deep penetration of frost (up to 30 cm) (Lafleur et al., 2003). Model simulations of peat heat transport by He et al. (2023) illustrate that thawing of the frozen peat, from the surface to the majority of the rooting depth of approximately 20 cm, takes approximately 2 months from late March to May after the disappearance of snow. Earlier studies have investigated the relationships between vegetation-index-derived start of leaf development and GPP-based start of photosynthesis for evergreen vegetation (Barr et al., 2009; Melaas et al., 2013; Shen et al., 2014; D’Odorico et al., 2015; Gao et al., 2023) but not peatlands, as in this study.
Our correlation analysis results linking peatland CO2 fluxes (NEE, GPP, and ER) with phenological indices reaffirm the strong relationships between these variables, including Gcc, NDVI, and EVI, as observed in several earlier studies (Peichl et al., 2015; Knox et al., 2017; Jarveoja et al., 2018; Peichl et al., 2018; Koebsch et al., 2020; Linkosalmi et al., 2022). These connections can be attributed to their shared dependency on the amount of green leaf area (Körner and Basler, 2010; Bauerle et al., 2012; Schädel et al., 2023). Among the environmental variables, our study confirms the earlier findings at the same site that near-soil surface temperatures control the spring GPP uptake (Moore et al., 2006). Moreover, we identified that the ∑GDD is a composite variable integrating temperature and photoperiod information that also shows important controls for the spring recovery. Similar relationships between ∑GDD and GPP were reported for a boreal fen (Peichl et al., 2015) and for a temperate forest bog recently (Schädel et al., 2023). Thus ∑GDD may serve as a useful proxy for modeling spring phenology across different types of peatlands, as assumed in several peatland models (Table 1). From a modeling perspective, air temperature is a standard model-forcing variable, and implementing ∑GDD in the models is much easier than using soil temperatures. Moreover, our Gcc data analysis shows that evergreen shrubs at our site have a constant threshold of 50°C days for the onset of green-up despite the large annual variations in climate (Figure 3). This differs largely from the default values used in other peatland models (e.g., 200°C to 800°C days in the PCARS, 100°C days in the LPJ, and 500°C days in WETDNDC models, Table 1). However, this threshold will need to be confirmed for other peatlands before it can be broadly applied as a default model parameter for phenological modeling.
4.2 Importance of antecedent nitrogen and water conditions
Another factor that potentially contributes to spring recovery is leaf N content. The assumed photosynthetic increase with ∑GDD scale in the model echoes the increases in leaf nutrient and chlorophyll contents over the spring period (Moore et al., 2006; Moore and Bubier, 2019) as these are known to be linearly related to photosynthesis (Reich et al., 1998). At the Mer Bleue site, Moore et al. (2006) and Moore and Bubier (2019) observed a 0.4–1 g N m-2 increase in shrub leaf N content over the spring period; this increase could not be explained by the direct N inputs from deposition, fixation, and mineralization. Since the background N deposition in this site is only approximately 0.8 g N m-2 year-1, approximately <0.2 g N m-2 can be from deposition over the spring period. The annual N fixation by Sphagnum mosses is estimated to be 0.3 g N m-2 (Živković et al., 2022) and regulated by soil temperature, with the peak fixation rates occurring in mid-August; thus, the fixation over spring is likely to be low. Similarly, the net annual N mineralization is also slow, with estimates in the range of 0.1 g N m-2 (Moore and Bubier, 2019). Thus, the total direct N inputs are only about 0.2 g N m-2 over the spring period. The annual litterfall at Mer Bleue varies from 85 to 112 g m-2 (Moore, unpublished data); given the shrub leaf N concentration of approximately 1.1% (Moore and Bubier, 2019), the annual shrub litterfall N is about 0.9–1.2 g N m-2. The field measurements indicate N resorption values of 50% before autumn litterfall for C. calyculata and 20% for R. groenlandicum (Wang et al., 2014); assuming that approximately 35% of the average N value was resorbed before litterfall of the earlier year, we estimate 0.3–0.4 g N m-2 year-1 as the N reserve. Taking all these together, we suggest that the increased N content in the shrub leaves during spring green-up is probably mostly derived from resorbed N from the previous year(s) and can thus be an additional internal control for leaf chlorophyll-a as well as spring greening of the shrubs.
Finally, our analysis further highlights the varying importance of environmental factors on spring phenology across different years. Over the last 20 years at Mer Bleue, the year 2012 had the lowest recorded WTD at summer and hence the driest summer (He et al., 2023). Our data analysis shows that in the spring of 2013 (the year following the dry 2012 summer), the hummock soil moisture at a depth of 5 cm was correlated strongly with the measured Gcc data (R2 = 0.65, p < 0.01) but the moisture data were not correlated with the Gcc the following year (2014; R2 = 0.01) (Supplementary Figures S2, S3). This phenomenon underscores the potential for the influences of antecedent conditions, especially drought years, on the subsequent responses of the plants to environmental factors. Therefore, the well-documented temperature effects on driving spring plant recovery (Moore et al., 2006; Körner and Basler, 2010; Tang et al., 2016; Piao et al., 2019), including the observations of our present study, may mask the water and nutrient effects. Accordingly, future field observation and modeling studies need to investigate these joint processes together.
5 Conclusion
In this study, we evaluated the control of spring phenology for a temperate continental bog. The vegetation phenological indices data revealed close links with thermal indices, including ∑GDD and near-surface soil temperature. Given that similar relationships were previously identified for other types of peatlands, our identified spring phenology control based on ∑GDD may have broader applicability. Hence, including a phenology subroutine using ∑GDD as a proxy in the CoupModel, a common light-use efficiency model, improved the model fit with tower-derived GPP data. Our results emphasize the role of ∑GDD as a control for spring phenology and highlight the interconnectedness of multiple environmental variables in driving photosynthetic processes. The legacy effects of nitrogen and influences of the conditions of previous years further underscore the complexity of the phenological responses. These insights contribute to advancing our understanding of ecosystem dynamics and provide a foundation for refining ecosystem models to better capture the intricate interplay between phenology, carbon dynamics, and environmental conditions.
6 Plain Language Summary
Predicting the carbon dynamics of northern peatlands requires adequate representation of the vegetation phenology in terrestrial biosphere models. This paper first reviews the phenology descriptions in current ecosystem models applied to peatlands and highlights the large differences in the model settings and parameter uncertainties. We then analyze detailed datasets acquired over a period of 6 years from a well-investigated temperate bog to identify the environmental controls and then develop an explicit phenology scheme in the numerical CoupModel to better simulate the ecosystem's gross primary productions. We also discuss the broad applications of our results in understanding phenology as well as its linked ecosystem processes and modeling.
Data availability statement
The original contributions presented in this study are archieved at https://doi.org/10.5281/zenodo.12724238.
Author contributions
HH: conceptualization, data curation, formal analysis, investigation, methodology, project administration, resources, software, validation, visualization, writing – original draft, and writing – review and editing. TM: data curation, resources, visualization, and writing – review and editing. PL: data curation and writing – review and editing. OS: data curation, methodology, resources, and writing – review and editing. EH: data curation, resources and writing – review and editing. MW: data curation, software, and writing – review and editing. NR: funding acquisition, methodology, resources, supervision, and writing – review and editing.
Funding
The author(s) declare that financial support was received for the research and/or publication of this article. This work was supported by a Canadian NSERC CRD strategic grant to Nigel Roulet as well as various NSERC grants to Nigel Roulet and coinvestigators to support the long-term measurements at Mer Bleue. Hongxing He was supported in part by a grant to Nigel Roulet from the Trottier Institute for Science and Public Policy.
Acknowledgments
The authors thank the National Capital Commission for their continued support and permission to work at Mer Bleue.
Conflict of interest
The authors declare that the research was conducted in the absence of any commercial or financial relationships that could be construed as a potential conflict of interest.
The reviewer HL declared a past coauthorship with author HH to the handling editor.
Generative AI statement
The authors declare that no Generative AI was used in the creation of this manuscript.
Publisher’s note
All claims expressed in this article are solely those of the authors and do not necessarily represent those of their affiliated organizations, or those of the publisher, the editors and the reviewers. Any product that may be evaluated in this article, or claim that may be made by its manufacturer, is not guaranteed or endorsed by the publisher.
Supplementary material
The Supplementary Material for this article can be found online at: https://www.frontiersin.org/articles/10.3389/fenvs.2025.1548578/full#supplementary-material
References
Antala, M., Juszczak, R., van der Tol, C., and Rastogi, A. (2022). Impact of climate change-induced alterations in peatland vegetation phenology and composition on carbon balance. Sci. Total Environ. 827, 154294–154315. doi:10.1016/j.scitotenv.2022.154294
Aurela, M., Laurila, T., and Tuovinen, J.-P. (2004). The timing of snow melt controls the annual CO2 balance in a subarctic fen. Geophys. Res. Lett. 31 (16), 1–4. doi:10.1029/2004gl020315
Barr, A. G., Black, A., and McCaughey, H. (2009). “Climatic and phenological controls of the Carbon and energy balances of three contrasting boreal forest ecosystems in western Canada,” in Phenology of ecosystem processes. Editor A. Noormets (Springer).
Bauerle, W. L., Oren, R., Way, D. A., Qian, S. S., Stoy, P. C., Thornton, P. E., et al. (2012). Photoperiodic regulation of the seasonal pattern of photosynthetic capacity and the implications for carbon cycling. Proc. Natl. Acad. Sci. U. S. A. 109 (22), 8612–8617. doi:10.1073/pnas.1119131109
Bechtold, M., De Lannoy, G. J. M., Koster, R. D., Reichle, R. H., Mahanama, S. P., Bleuten, W., et al. (2019). PEAT-CLSM: a specific treatment of peatland hydrology in the NASA catchment land surface model. J. Adv. Model Earth Syst. 11 (7), 2130–2162. doi:10.1029/2018MS001574
Bona, K. A., Shaw, C., Thompson, D. K., Hararuk, O., Webster, K., Zhang, G., et al. (2020). The Canadian model for peatlands (CaMP): a peatland carbon model for national greenhouse gas reporting. Ecol. Model. 431, 109164–109221. doi:10.1016/j.ecolmodel.2020.109164
Bubier, J. L., Crill, P. M., Moore, T. R., Savage, K., and Varner, R. K. (1998). Seasonal patterns and controls on net ecosystem CO2exchange in a boreal peatland complex. Glob. Biogeochem. Cycles 12 (4), 703–714. doi:10.1029/98gb02426
Bubier, J. L., Moore, T. R., and Crosby, G. (2006). Fine-scale vegetation distribution in a cool temperate peatland. Can. J. Bot. 84 (6), 910–923. doi:10.1139/b06-044
Chaudhary, N., Miller, P. A., and Smith, B. (2017). Modelling Holocene peatland dynamics with an individual-based dynamic vegetation model. Biogeosciences 14 (10), 2571–2596. doi:10.5194/bg-14-2571-2017
Chong, M., Humphreys, E., and Moore, T. R. (2015). Microclimatic response to increasing shrub cover and its effect on Sphagnum CO2 exchange in a bog. Écoscience 19 (1), 89–97. doi:10.2980/19-1-3489
D’Odorico, P., Gonsamo, A., Gough, C. M., Bohrer, G., Morison, J., Wilkinson, M., et al. (2015). The match and mismatch between photosynthesis and land surface phenology of deciduous forests. Agric. For. Meteorology 214-215, 25–38. doi:10.1016/j.agrformet.2015.07.005
Filippa, G., Cremonese, E., Migliavacca, M., Galvagno, M., Forkel, M., Wingate, L., et al. (2016). Phenopix: a R package for image-based vegetation phenology. Agric. For. Meteorology 220, 141–150. doi:10.1016/j.agrformet.2016.01.006
Frolking, S., Roulet, N. T., Moore, T. R., Lafleur, P. M., Bubier, J. L., and Crill, P. M. (2002). Modeling seasonal to annual carbon balance of mer Bleue bog, Ontario, Canada. Glob. Biogeochem. Cycles 16 (3), 1–4-21. doi:10.1029/2001gb001457
Frolking, S., Roulet, N. T., Moore, T. R., Richard, P. J., Lavoie, M., and Muller, S. D. (2001). Modeling northern peatland decomposition and peat accumulation. Ecosystems 4, 479–498. doi:10.1007/s10021-001-0105-1
Frolking, S., Roulet, N. T., Tuittila, E., Bubier, J. L., Quillet, A., Talbot, J., et al. (2010). A new model of Holocene peatland net primary production, decomposition, water balance, and peat accumulation. Earth Syst. Dyn. 1 (1), 1–21. doi:10.5194/esd-1-1-2010
Gao, X., McGregor, I. R., Gray, J. M., Friedl, M. A., and Moon, M. (2023). Observations of satellite land surface phenology indicate that maximum leaf greenness is more associated with global vegetation productivity than growing season length. Glob. Biogeochem. Cycles 37 (3). doi:10.1029/2022gb007462
Gong, J., Roulet, N., Frolking, S., Peltola, H., Laine, A. M., Kokkonen, N., et al. (2020). Modelling the habitat preference of two key Sphagnum species in a poor fen as controlled by capitulum water content. Biogeosciences 17 (22), 5693–5719. doi:10.5194/bg-17-5693-2020
Goulden, M. L., Wofsy, S. C., Harden, J. W., Trumbore, S. E., Crill, P. M., Gower, S. T., et al. (1998). Sensitivity of boreal forest carbon balance to soil thaw. Science 279, 214–217. doi:10.1126/science.279.5348.214
Hanninen, H., Kramer, K., Tanino, K., Zhang, R., Wu, J., and Fu, Y. H. (2019). Experiments are necessary in process-based tree phenology modelling. Trends Plant Sci. 24 (3), 199–209. doi:10.1016/j.tplants.2018.11.006
He, H., Jansson, P.-E., and Gärdenäs, A. I. (2020). CoupModel (v6.0): code and evaluating database. 6.0 ed. Zenodo. doi:10.5281/zenodo.3547628
He, H., Moore, T., Humphreys, E. R., Lafleur, P. M., and Roulet, N. T. (2023). Water level variation at a beaver pond significantly impacts net CO2 uptake of a continental bog. Hydrology Earth Syst. Sci. 27, 213–227. doi:10.5194/hess-27-213-2023
He, H., Moore, T., Lafleur, P. M., Sonnentag, O., Humphreys, E., Wu, M., et al. (2024). Side chain crosslinked anion exchange membrane for acid concentration by electrodialysis. Chem. Bio Eng. 1, 647–657. [Dataset]. doi:10.1021/cbe.4c00096
Hendry, G. A. F., Houghton, J. D., and Brown, S. B. (1987). The degradation of Chlorophyll-A biological enigma. New Phytol. 107 (2), 255–302. doi:10.1111/j.1469-8137.1987.tb00181.x
Huang, Z., Zhou, L., and Chi, Y. (2023). Spring phenology rather than climate dominates the trends in peak of growing season in the Northern Hemisphere. Glob. Chang. Biol. 00, 4543–4555. doi:10.1111/gcb.16758
Humphreys, E. R., and Lafleur, P. M. (2011). Does earlier snowmelt lead to greater CO2 sequestration in two low Arctic tundra ecosystems? Geophys. Res. Lett. 38 (9), 1–5. doi:10.1029/2011gl047339
Jansson, P.-E., and Karlberg, L. (2011). COUP manual: coupled heat and mass transfer model for soil-plant-atmosphere systems. Stockholm.
Jarveoja, J., Nilsson, M. B., Gazovic, M., Crill, P. M., and Peichl, M. (2018). Partitioning of the net CO(2) exchange using an automated chamber system reveals plant phenology as key control of production and respiration fluxes in a boreal peatland. Glob. Chang. Biol. 24 (8), 3436–3451. doi:10.1111/gcb.14292
Jarvis, P., and Linder, S. (2000). Constraints to growth of boreal forests. Nature 405, 904–905. doi:10.1038/35016154
Jeong, S.-J., Ho, C.-H., Gim, H.-J., and Brown, M. E. (2011). Phenology shifts at start vs. end of growing season in temperate vegetation over the Northern Hemisphere for the period 1982-2008. Glob. Change Biol. 17 (7), 2385–2399. doi:10.1111/j.1365-2486.2011.02397.x
Knox, S. H., Dronova, I., Sturtevant, C., Oikawa, P. Y., Matthes, J. H., Verfaillie, J., et al. (2017). Using digital camera and Landsat imagery with eddy covariance data to model gross primary production in restored wetlands. Agric. For. Meteorology 237-238, 233–245. doi:10.1016/j.agrformet.2017.02.020
Koebsch, F., Sonnentag, O., Jarveoja, J., Peltoniemi, M., Alekseychik, P., Aurela, M., et al. (2020). Refining the role of phenology in regulating gross ecosystem productivity across European peatlands. Glob. Chang. Biol. 26 (2), 876–887. doi:10.1111/gcb.14905
Körner, C., and Basler, D. (2010). Phenology under global warming. Science 327, 1461–1462. doi:10.1126/science.1186473
Kross, A., Seaquist, J. W., and Roulet, N. T. (2016). Light use efficiency of peatlands: variability and suitability for modeling ecosystem production. Remote Sens. Environ. 183, 239–249. doi:10.1016/j.rse.2016.05.004
Kujala, K., Seppälä, M., and Holappa, T. (2008). Physical properties of peat and palsa formation. Cold Regions Sci. Technol. 52 (3), 408–414. doi:10.1016/j.coldregions.2007.08.002
Lafleur, P. M., Roulet, N. T., Bubier, J. L., Frolking, S., and Moore, T. R. (2003). Interannual variability in the peatland-atmosphere carbon dioxide exchange at an ombrotrophic bog. Glob. Biogeochem. Cycles 17 (2), 1–14. doi:10.1029/2002gb001983
Leifeld, J., and Menichetti, L. (2018). The underappreciated potential of peatlands in global climate change mitigation strategies. Nat. Commun. 9, 1071–1077. doi:10.1038/s41467-018-03406-6
Linkosalmi, M., Tuovinen, J.-P., Nevalainen, O., Peltoniemi, M., Taniş, C. M., Arslan, A. N., et al. (2022). Tracking vegetation phenology of pristine northern boreal peatlands by combining digital photography with CO2 flux and remote sensing data. Biogeosciences 19 (19), 4747–4765. doi:10.5194/bg-19-4747-2022
Melaas, E. K., Richardson, A. D., Friedl, M. A., Dragoni, D., Gough, C. M., Herbst, M., et al. (2013). Using FLUXNET data to improve models of springtime vegetation activity onset in forest ecosystems. Agric. For. Meteorology 171-172, 46–56. doi:10.1016/j.agrformet.2012.11.018
Meng, L., Mao, J., Ricciuto, D. M., Shi, X., Richardson, A. D., Hanson, P. J., et al. (2021). Evaluation and modification of ELM seasonal deciduous phenology against observations in a southern boreal peatland forest. Agric. For. Meteorology 308-309, 108556–108610. doi:10.1016/j.agrformet.2021.108556
Menzel, A., Yuan, Y., Matiu, M., Sparks, T., Scheifinger, H., Gehrig, R., et al. (2020). Climate change fingerprints in recent European plant phenology. Glob. Chang. Biol. 26, 2599–2612. doi:10.1111/gcb.15000
Moore, T., Bubier, J., Frolking, S., Lafleur, P. M., and Roulet, N. T. (2002). Plant biomass and production and CO2 exchange in an ombrotrophic bog. J. Ecol. 90, 25–36. doi:10.1046/j.0022-0477.2001.00633.x
Moore, T. R., and Bubier, J. L. (2019). Plant and soil nitrogen in an ombrotrophic peatland, southern Canada. Ecosystems 23 (1), 98–110. doi:10.1007/s10021-019-00390-w
Moore, T. R., Lafleur, P. M., Poon, D. M. I., Heumann, B. W., Seaquist, J. W., and Roulet, N. T. (2006). Spring photosynthesis in a cool temperate bog. Glob. Change Biol. 12 (12), 2323–2335. doi:10.1111/j.1365-2486.2006.01247.x
Nemani, R. R., Keeling, C. D., Hashimoto, H., Jolly, W. M., Piper, S. C., Tucker, C. J., et al. (2003). Climate-driven increases in global terrestrial net primary production from 1982 to 1999. Science 300, 1560–1563. doi:10.1126/science.1082750
Peichl, M., Gazovic, M., Vermeij, I., de Goede, E., Sonnentag, O., Limpens, J., et al. (2018). Peatland vegetation composition and phenology drive the seasonal trajectory of maximum gross primary production. Sci. Rep. 8, 1–11. doi:10.1038/s41598-018-26147-4
Peichl, M., Sonnentag, O., and Nilsson, M. B. (2015). Bringing color into the picture: using digital repeat photography to investigate phenology controls of the carbon dioxide exchange in a boreal mire. Ecosystems 18 (1), 115–131. doi:10.1007/s10021-014-9815-z
Piao, S., Liu, Q., Chen, A., Janssens, I. A., Fu, Y., Dai, J., et al. (2019). Plant phenology and global climate change: current progresses and challenges. Glob. Chang. Biol. 25 (6), 1922–1940. doi:10.1111/gcb.14619
Premrov, A., Wilson, D., Saunders, M., Yeluripati, J., and Renou-Wilson, F. (2021). CO2 fluxes from drained and rewetted peatlands using a new ECOSSE model water table simulation approach. Sci. Total Environ. 754, 142433–142518. doi:10.1016/j.scitotenv.2020.142433
Qiu, C., Zhu, D., Ciais, P., Guenet, B., Krinner, G., Peng, S., et al. (2018). ORCHIDEE-PEAT (revision 4596), a model for northern peatland CO2, water, and energy fluxes on daily to annual scales. Geosci. Model Dev. 11 (2), 497–519. doi:10.5194/gmd-11-497-2018
Rafat, A., Rezanezhad, F., Quinton, W. L., Humphreys, E. R., Webster, K., and Van Cappellen, P. (2021). Non-growing season carbon emissions in a northern peatland are projected to increase under global warming. Commun. Earth and Environ. 2 (1), 111–112. doi:10.1038/s43247-021-00184-w
Reich, P. B., Ellsworth, D. S., and Walters, M. B. (1998). Leaf structure (specific leaf area) modulates photosynthesis-nitrogen relations: evidence from within and across species and functional groups. Funct. Ecol. 12 (6), 948–958. doi:10.1046/j.1365-2435.1998.00274.x
Richardson, A. D., Anderson, R. S., Arain, M. A., Barr, A. G., Bohrer, G., Chen, G., et al. (2012). Terrestrial biosphere models need better representation of vegetation phenology: results from the North American Carbon Program Site Synthesis. Glob. Change Biol. 18 (2), 566–584. doi:10.1111/j.1365-2486.2011.02562.x
Richardson, A. D., Hufkens, K., Milliman, T., Aubrecht, D. M., Chen, M., Gray, J. M., et al. (2018). Tracking vegetation phenology across diverse North American biomes using PhenoCam imagery. Sci. Data 5, 180028–180124. doi:10.1038/sdata.2018.28
Richardson, A. D., Keenan, T. F., Migliavacca, M., Ryu, Y., Sonnentag, O., and Toomey, M. (2013). Climate change, phenology, and phenological control of vegetation feedbacks to the climate system. Agric. For. Meteorology 169, 156–173. doi:10.1016/j.agrformet.2012.09.012
Richardson, A. D., and O’Keefe, J. (2009). “Phenological differences between understory and overstory,” in Phenology of ecosystem processes, 87–117.
Roulet, N. T., Lafleur, P. M., Richard, P. J. H., Moore, T. R., Humphreys, E. R., and Bubier, J. (2007). Contemporary carbon balance and late Holocene carbon accumulation in a northern peatland. Glob. Change Biol. 13 (2), 397–411. doi:10.1111/j.1365-2486.2006.01292.x
Schädel, C., Seyednasrollah, B., Hanson, P. J., Hufkens, K., Pearson, K. J., Warren, J. M., et al. (2023). Using long-term data from a whole ecosystem warming experiment to identify best spring and autumn phenology models. Plant-Environment Interact. 4, 188–200. doi:10.1002/pei3.10118
Seyednasrollah, B., Young, A. M., Hufkens, K., Milliman, T., Friedl, M. A., Frolking, S., et al. (2019). Tracking vegetation phenology across diverse biomes using Version 2.0 of the PhenoCam Dataset. Sci. Data 6 (1), 222–311. doi:10.1038/s41597-019-0229-9
Shen, M., Tang, Y., Chen, J., Yang, X., Wang, C., Cui, X., et al. (2014). Earlier-season vegetation has greater temperature sensitivity of spring phenology in northern hemisphere. PLoS One 9 (2), e88178. doi:10.1371/journal.pone.0088178
Small, E. (1972). Photosynthetic rates in relation to nitrogen recycling as an adaptation to nutrient deficiency in peat bog plants. Can. J. Bot. 50, 2227–2233. doi:10.1139/b72-289
Smith, J., Gottschalk, P., Bellarby, J., Chapman, S., Lilly, A., Towers, W., et al. (2010). Estimating changes in Scottish soil carbon stocks using ECOSSE. I. Model description and uncertainties. Clim. Res. 45, 179–192. doi:10.3354/cr00899
Sonnentag, O., Hufkens, K., Teshera-Sterne, C., Young, A. M., Friedl, M., Braswell, B. H., et al. (2012). Digital repeat photography for phenological research in forest ecosystems. Agric. For. Meteorology 152, 159–177. doi:10.1016/j.agrformet.2011.09.009
St-Hilaire, F., Wu, J., Roulet, N. T., Frolking, S., Lafleur, P. M., Humphreys, E. R., et al. (2010). McGill wetland model: evaluation of a peatland carbon simulator developed for global assessments. Biogeosciences 7 (11), 3517–3530. doi:10.5194/bg-7-3517-2010
Strack, M., and Price, J. S. (2009). Moisture controls on carbon dioxide dynamics of peat-Sphagnummonoliths. Ecohydrology 2 (1), 34–41. doi:10.1002/eco.36
Tang, J., Körner, C., Muraoka, H., Piao, S., Shen, M., Thackeray, S. J., et al. (2016). Emerging opportunities and challenges in phenology: a review. Ecosphere 7 (8), 1–17. doi:10.1002/ecs2.1436
van Huissteden, J., van den Bos, R., and Marticorena Alvarez, I. (2016). Modelling the effect of water-table management on CO2 and CH4 fluxes from peat soils. Neth. J. Geosciences - Geol. en Mijnbouw 85 (1), 3–18. doi:10.1017/s0016774600021399
Wang, M., Murphy, M. T., and Moore, T. R. (2014). Nutrient resorption of two evergreen shrubs in response to long-term fertilization in a bog. Oecologia 174 (2), 365–377. doi:10.1007/s00442-013-2784-7
Wilson, P. G. (2012). “The relationship among micro-topographic variation, water table depth and biogeochemistry in an ombrotrophic bog,” in Master of science. Montreal, Quebec: McGill University.
Zhang, Y., Li, C., Trettin, C. C., Li, H., and Sun, G. (2002). An integrated model of soil, hydrology, and vegetation for carbon dynamics in wetland ecosystems. Glob. Biogeochem. Cycles 16 (4), 1–9-17. doi:10.1029/2001gb001838
Zhou, L., Tucker, C. J., Kaufmann, R. K., Slayback, D., Shabanov, N. V., and Myneni, R. B. (2001). Variations in northern vegetation activity inferred from satellite data of vegetation index during 1981 to 1999. J. Geophys. Res. Atmos. 106 (D17), 20069–20083. doi:10.1029/2000jd000115
Keywords: phenology, gross primary productivity, peatland, growing degree-day, model, green chromatic coordinate
Citation: He H, Moore T, Lafleur P, Sonnentag O, Humphreys E, Wu M and Roulet N (2025) Spring phenology in photosynthesis control and modeling for a temperate bog. Front. Environ. Sci. 13:1548578. doi: 10.3389/fenvs.2025.1548578
Received: 19 December 2024; Accepted: 10 March 2025;
Published: 14 April 2025.
Edited by:
Jianghua Wu, Memorial University of Newfoundland, CanadaReviewed by:
Zhao-Jun Bu, Northeast Normal University, ChinaHaojie Liu, University of Rostock, Germany
Copyright © 2025 He, Moore, Lafleur, Sonnentag, Humphreys, Wu and Roulet. This is an open-access article distributed under the terms of the Creative Commons Attribution License (CC BY). The use, distribution or reproduction in other forums is permitted, provided the original author(s) and the copyright owner(s) are credited and that the original publication in this journal is cited, in accordance with accepted academic practice. No use, distribution or reproduction is permitted which does not comply with these terms.
*Correspondence: Hongxing He, aG9uZ3hpbmcuaGVAbWNnaWxsLmNh, aG9uZ3hpbmctaGVAaG90bWFpbC5jb20=
†ORCID: Hongxing He, orcid.org/000-0003-4953-7450; Tim Moore, orcid.org/0000-0001-7472-7569; Peter Lafleur, orcid.org/0000-0003-0347-9128; Oliver Sonnentag, orcid.org/0000-0001-9333-9721; Elyn Humphreys, orcid.org/0000-0002-5397-2802; Mousong Wu, orcid.org/0000-0003-1141-3022; Nigel Roulet, orcid.org/0000-0001-9571-1929