 Shibiru Chengu
 Mohammed Assen2†
 Elias Gebeyehu
- 1Department of Geography and Environmental Studies, College of Social Sciences and Humanities, Arba Minch University, Arba Minch, Ethiopia
- 2Department of Geography and Environmental Studies, College of Social Science, Addis Ababa University, Arba Minch, Ethiopia
- 3Department of Hydraulic and Water Resources Engineering, Faculty of Hydraulic and Water Resources Engineering, Arba Minch University, Arba Minch, Ethiopiaa
Flood risk perception plays a critical role in shaping household preparedness and response strategies. This study examines flood risk perceptions among vulnerable households in the Itang Watershed, Lower Baro-Akobo Basin, southwestern Ethiopia, and explores the socio-economic factors influencing these perceptions. Data were collected from 373 households across nine kebeles (smallest administrative unit, functioning as a local government structure) using a survey questionnaire, with binary logistic regression analysis. The results showed that prior flood experience made respondents 3.35 times more likely to perceive high flood risk (coefficient 3.353, p < 0.001), making this the strongest predictor in the study. Income was positively associated with flood risk perception (coefficient = 1.363, p = 0.001), indicating that wealthier individuals are more concerned about protecting their assets. Homeowners were less likely to perceive high flood risk compared to renters (coefficient = −1.664, p = 0.007), suggesting greater confidence or resources to mitigate flood risks. Employment status also had a substantial impact, with unemployed individuals significantly more likely to perceive high flood risk than employed ones (coefficient = −2.916, p < 0.001), underscoring the critical role of socio-economic conditions. Proximity to the river had a marginally significant effect (coefficient = 1.105, p = 0.053), with those living closer to the river perceiving slightly higher flood risk. Residents in lower watershed kebeles were more likely to perceive high flood risk compared to those in upper watershed kebeles (coefficient = −1.664, p = 0.072). However, age, household size, and education level were not significantly associated with flood risk perception. This study provides valuable insights for disaster management authorities to design region-specific flood risk preparedness and response strategies, eventually enhancing community resilience.
1 Introduction
Flooding is one of the most widespread and destructive natural disasters, affecting millions of people globally. As the most frequent natural hazard, flood hazards cause extensive damage to lives, livelihoods, infrastructure, and ecosystems. According to Alfieri et al. (2016) global projections of river flood risk suggest that the frequency and severity of flooding are expected to increase in a warmer world, highlighting the growing threat of flood events (Tanoue et al., 2016). Further emphasize the significant rise in global-scale river flood vulnerability over the past 50 years, demonstrating how environmental, societal, and infrastructural changes have heightened flood risks. Additionally (Jones et al., 2023), question the reliability of global data on natural disasters, urging caution in interpreting such data for policy and planning decisions. The increasing frequency and severity of floods have been largely attributed to climate change, rapid urbanization, and inadequate land-use planning (Green, 2004). Climate change is intensifying extreme weather events, including floods (Abid et al., 2016; Ho et al., 2023) while urbanization continues to exacerbate flood risks due to the loss of natural floodplains and poor drainage infrastructure (Liu et al. 2018; Qasim et al. 2015). Additionally, inadequate land-use planning and deforestation contribute to higher flood vulnerability by reducing natural water absorption and increasing surface runoff (Pelling et al., 2021). Low-lying regions and river valleys are particularly vulnerable, with developing nations in Africa and Asia experiencing the highest levels of flood risk (Arnell and Gosling, 2016). With its diverse topography and seasonal rainfall patterns, Ethiopia frequently experiences recurrent floods, especially in lowland areas along major river basins like the Baro-Akobo Basin. These floods, often caused by prolonged heavy rainfall and river overflows, result in substantial socioeconomic losses, displacement of communities, and widespread infrastructure damage (Getahun and Gebre, 2015). Effective flood risk management necessitates an understanding of how communities perceive flood-related risks. Risk perception, defined as the subjective evaluation of the likelihood and consequences of a hazard, plays a critical role in influencing how individuals and communities prepare for and respond to flood risks (Kellens et al., 2011). In the context of floods, perceptions of vulnerability and risk severity directly impact individuals’ willingness to adopt precautionary measures and support disaster risk reduction (DRR) policies (Schanze et al., 2006). Research has demonstrated that communities with heightened risk perception are more likely to engage in adaptive actions, such as constructing flood defenses or participating in disaster preparedness initiatives (Rana et al., 2020; Ullah et al., 2015).
Flood risk perception is shaped by various socio-economic factors, including age, education, income, previous flood experience, and proximity to flood-prone areas (Kellens et al., 2011). These factors influence how individuals assess the likelihood and impact of flooding, as well as their levels of preparedness and responses to governmental initiatives (Diakakis et al., 2018). However, perceptions often differ significantly across demographic groups and regions, posing challenges to effective risk communication and management strategies (Wang P. et al., 2021). In Ethiopia, particularly in the flood-prone regions of the Gambella Regional State, understanding local flood risk perception is vital for developing effective and targeted flood risk management strategies. Studies conducted in Ethiopia have highlighted the importance of localized flood risk assessments in various regions (Getahun and Gebre, 2015). Examined the causes and impacts of flooding in the Awash River Basin, emphasizing the critical need for community-level engagement and tailored interventions. Similarly (Taye et al., 2018), analyzed flood vulnerability in the Lake Tana Basin, identifying socio-economic and spatial factors that contribute to increased risk. The primary aim of this study is to examine how vulnerable households in the study kebeles (the smallest administrative units in Ethiopia) of Itang Watershed perceive flood risks, with a particular emphasis on the socio-economic factors shaping these flood risk perceptions. Through a structured questionnaire survey, the research seeks to quantify flood risk perception and identify the determinants influencing these views among different household groups with in the study kebeles. The study employs binary logistic regression models to analyze the relationships between socio-economic variables and flood risk perception.
2 Materials and methods
2.1 Description of study area
This study was carried out in the Itang watershed of the lower Baro-Akobo River basin, in southwest Ethiopia. The watershed is located between 08°3′30″- 08°24″0′N latitude and 34°10′0″- 34°30′0″E longitude with 1383 km2 areas (Figure 1). The study area is characterized by a slight change in elevation, with elevations ranging from 404 to 530 m above sea level (Woube, 1999). The study area is predominantly a flat plain, making it highly susceptible to climatic variations. Over the 15-year period from 2008 to 2022, annual precipitation (Figure 2) exhibited a declining trend. In the earlier years, precipitation exceeded 2,500 mm, but later dropped to approximately 1,200 mm at its lowest point. The rainfall pattern in the region is strongly influenced by the seasonal migration of the Intertropical Convergence Zone (ITCZ), which drives monsoonal precipitation across East African (Ellison et al., 2017; Teshome, 2020). The interaction between the ITCZ and large-scale atmospheric circulations, such as the Indian Ocean Dipole (IOD) and El Niño–Southern Oscillation (ENSO), also affects rainfall variability and flood events in the region (Teshome, 2020; Messner et al., 2006).
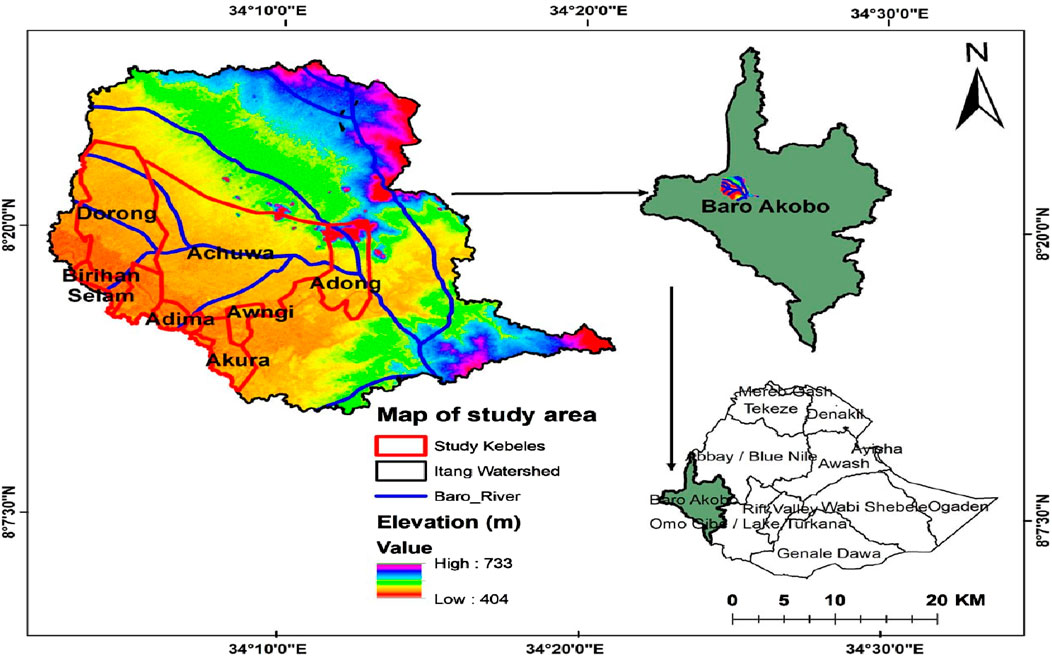
Figure 1. Map of the study kebeles.
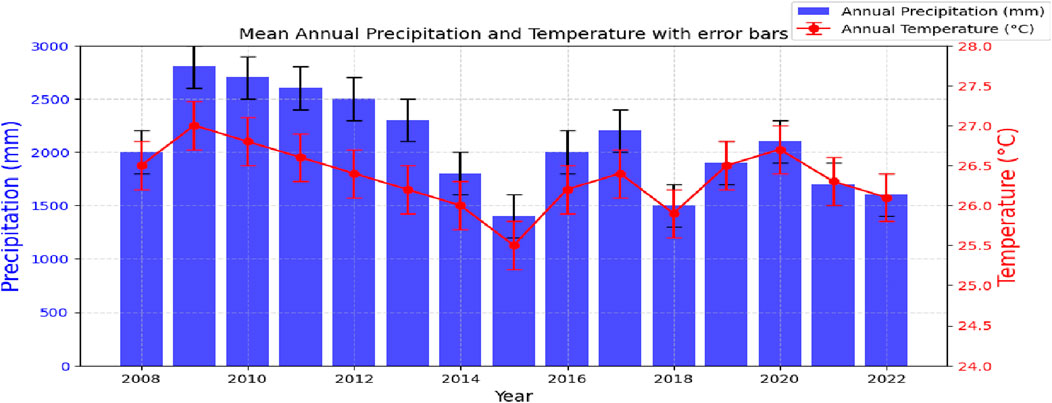
Figure 2. Mean annual precipitation and temperature.
The annual precipitation for 2008–2022 is based on observational data collected from three in situ weather stations, as recorded by the Ethiopian Meteorological Agency. Although some recovery occurred, variability remained significant. Annual temperature fluctuated between approximately 24.5°C and 27.0°C, peaking above 27.0°C before slightly decreasing in recent years. The inverse relationship between precipitation and temperature suggests possible climatic shifts influencing rainfall patterns.
The wet season (June–September) sees peak rainfall in June–July (250–300 mm), while temperatures drop to 21°C–22°C. The dry season (October–February) has minimal rainfall (10–20 mm) with rising temperatures, peaking at 26°C in March. Rainfall and temperature show an inverse relationship, indicating a distinct wet-dry cycle (Figure 3).
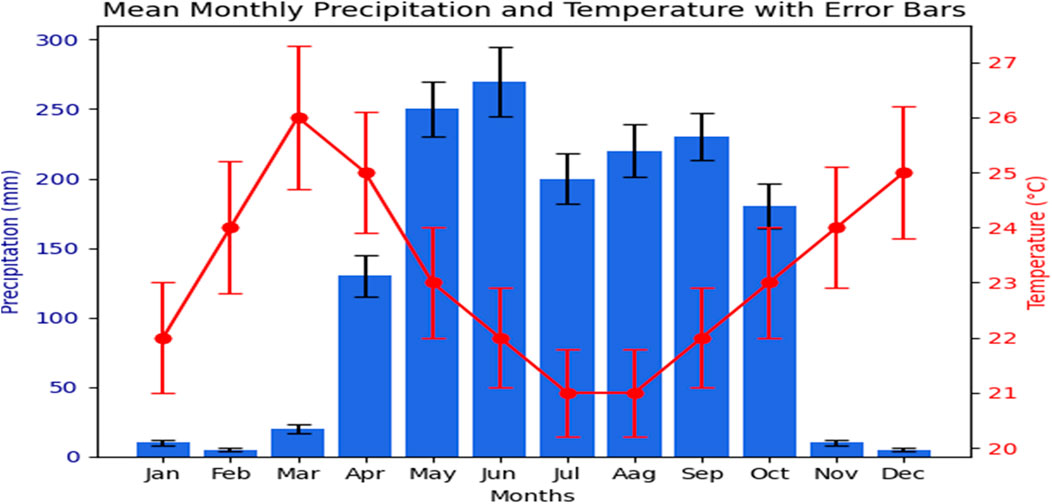
Figure 3. Mean monthly precipitation and temperature.
Animal husbandry is the main economic activity of the area. Subsistence farming, traditional fishing, hunting, and gathering of wild animals and plants are used as sources of living in the rural parts of the region (Wakuma Abaya et al., 2009). Unplanned settlement and population increases are major causes of the land use change. Before 1984, the Gambella region was occupied by a few indigenous people in sparsely populated settlements (Wal and Asseffa, 2025). However, between 1983 and 1996, a total of 733,600 people settled in the region. Due to this relocation of people, more than 140,000 ha of natural forest was cleared and large-scale farming increased in the region to meet the needs of the population (Woube, 1999). The deforestation that occurred in the study area may have reduced the storing capacity of the river network, similar to what happened in other areas (Bihonegn and Awoke, 2023; Tilahun et al., 2018). According to Greenough et al. (2001) deforestation increases the occurrence of a higher volume runoff which can result in flooding in low-lying areas. The impacts of deforestation on river hydrology, including increased surface runoff, reduced infiltration, and higher sedimentation rates, which alter river flow regimes and exacerbate flood risks (Bradshaw et al., 2007; Bruijnzeel, 2004). Additionally, deforestation leads to a decline in evapotranspiration and disrupts the natural water balance, further intensifying hydrological extremes (Ellison et al., 2017). The Data were collected from 373 households across nine kebeles, most of which are situated in the floodplain zones of the Baro River, the second-longest river in Ethiopia after the Abay (Blue Nile) River. During the summer season, heavy rainfall causes floods in the region, and anomalous monsoon activity can lead to high surface runoff with peak discharge as noted in studies like (Teshome, 2020). The selected households are particularly prone to flooding because of three main factors: the proximity, topography/morphology of the area and hydrological characteristics (Figures 4A–C). Most of the study kebeles are located within 1.5 km of the river (Figure 4A), making them highly vulnerable to seasonal and extreme flow events. This vulnerability is supported by studies such as (Messner et al., 2006) and (Teshome, 2020), which highlight that settlements located in floodplains and near watercourses are particularly prone to flooding. Therefore, integrating these factors enhances the precision of identifying flood-prone kebeles in the study watershed.
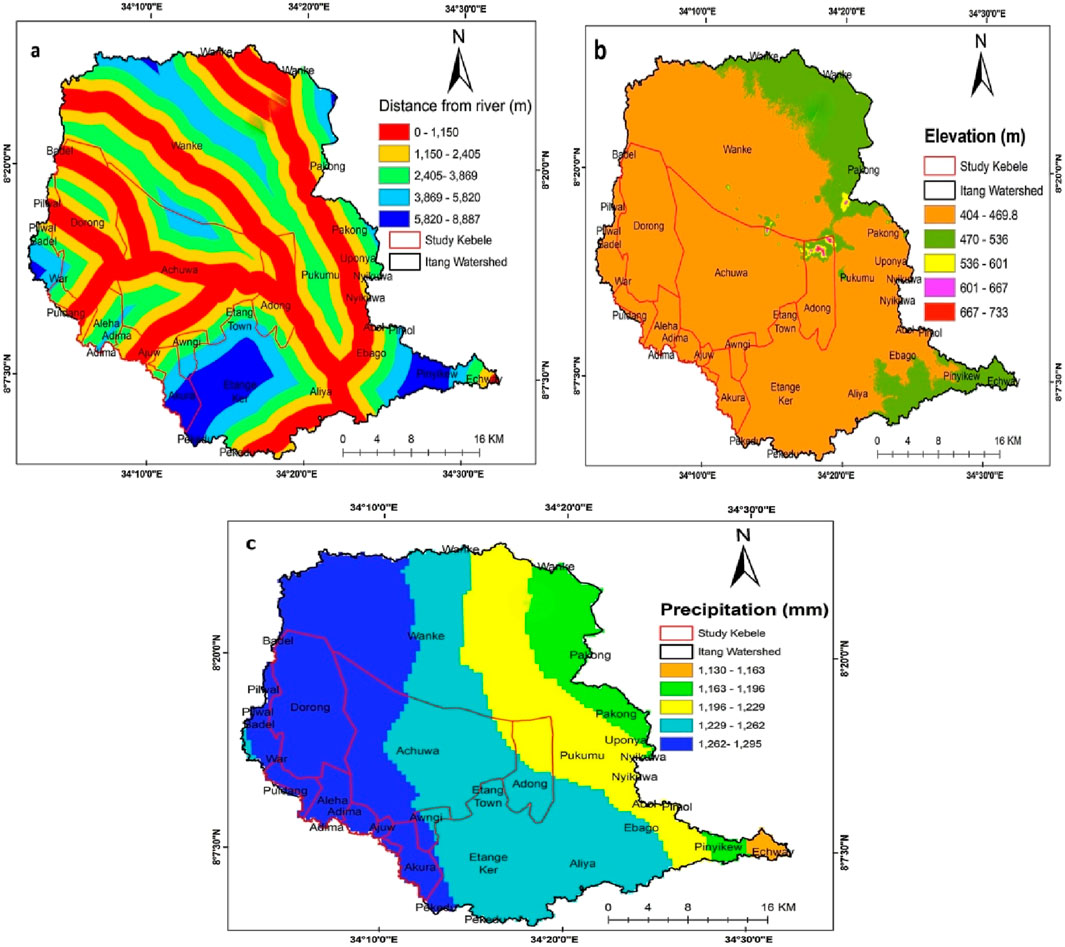
Figure 4. Map of (a) distance from the river and (b) elevation and (c) precipitation.
2.2 Research approach and design
This study used Different methods of data collection such as survey questionnaires, focal group discussions, and field observations were employed to produce primary data. In addition, secondary data have been collected from existing documents, books, journals, and reports. The approach integrates stakeholder perspectives by combining GIS with socio-economic data analysis, community interviews, and expert opinions, ensuring a comprehensive understanding that incorporates both technical assessment and local community insights. GIS-based flood risk mapping was conducted using elevation and climate data. Simultaneously, socio-economic data were collected through household surveys, community interviews, and focus group discussions. Descriptive statistics were used to summarize key socio-economic variables, while inferential statistical methods, such as logistic regression and correlation analysis, were applied to examine the relationships between flood risk perception and influencing factors. This combination of GIS-based mapping and statistical analysis provided a robust framework for understanding flood vulnerability in the Study watershed.
2.3 Study population sampling
Data collection was done using multistage sampling. Firstly, the Itang watershed was purposively selected due to the high flood damage caused by the 2022 floods (Gambella Disaster Preparedness and Food Security Agency report of 2022). Secondly, 21 kebeles were selected from the total vulnerable kebeles in the watershed. Thirdly, nine vulnerable kebeles (Dorong, Birhan Selame, Aleha Adima, Ajuwa, Akura, Adong, Awangi, and Achuwa) were selected based on their proximity to the Baro River. Fourthly, vulnerable households were sampled from a total of 13,410 households in the selected nine kebeles, which provided baseline data on household vulnerability. Fifthly, a sample size of 373, with a 95% confidence level and a 5% margin of error (confidence interval), was calculated using Cochran’s Formula (Cochran, 1977) mentioned in Equations 1, 2. Lastly, following the method suggested by Pickering et al. (2021), the total sample was proportionally allocated between the upper and lower kebeles of the study watershed. From the upper kebeles, 203 samples of households (Birhane Selem, Dorong, Aleha, Achuwa, And Awagni) were used and 170 samples of households were from the lower kebeles (Adong, Akura, Ajuwa, and Adima) was selected using random sampling.
Where: N= Population size. = 13,410
no = required return sample size because sample >5% of population = 384
p = percentage picking a choice expressed as a decimal (0.5 used for sample size needed).
(p)(q) = estimate of variance = 0.25 n = Sample size for a given population
Z = Z value (e.g., 1.96 for 95% confidence level) e = confidence interval (0.05)2.
Data was collected using a survey questionnaire from 16 September 2022 to 30 November 2022. The questionnaire has three main sections. In section one, demographic data of the respondents such as age, education, household size, flood experience, household location, and household distance from the river was collected. Section two contained the economic status of the households such as monthly income, employment status, and household ownership. Section three was about flood risk perception factors. The questionnaire was tested among 30 respondents who were not part of the sample to improve clarity and understanding. The entire dataset was analyzed using Stata 18 software.
2.4 Flood risk indicators
All these indicators are selected from previous research studies carried out in the fields related to disaster risk science and climate change. These indicators are tested in a similar socio-cultural context in different areas and regions of the world. Nine indicators are selected and used for risk perception, which is categorized into five classes. These classes were formulated to illustrate the degree of flood risk perception. Risk perception is generally qualitative; however, indices have proved to be useful as one of the methods to quantify it. Indices in disaster risk science and climate change vulnerability are seen as a robust methodology to summarize and quantify complicated data into a simpler form (Fang et al., 2014;Shah et al., 2017). For this study, indicators were carefully selected with the help of the literature review on risk perception as can be seen in Table 1. Some of the selected indicators such as the perceived ability to cope, knowledge about emergency protocols, and trust in government policies, although do not provide the “direct measure of risk perception”, do give the measure of the “ability to cope with the risk” which indirectly relates to the overall perceived risk. Each indicator was analyzed using a weight scale ranging from one to 0.2, as shown in Table 1.
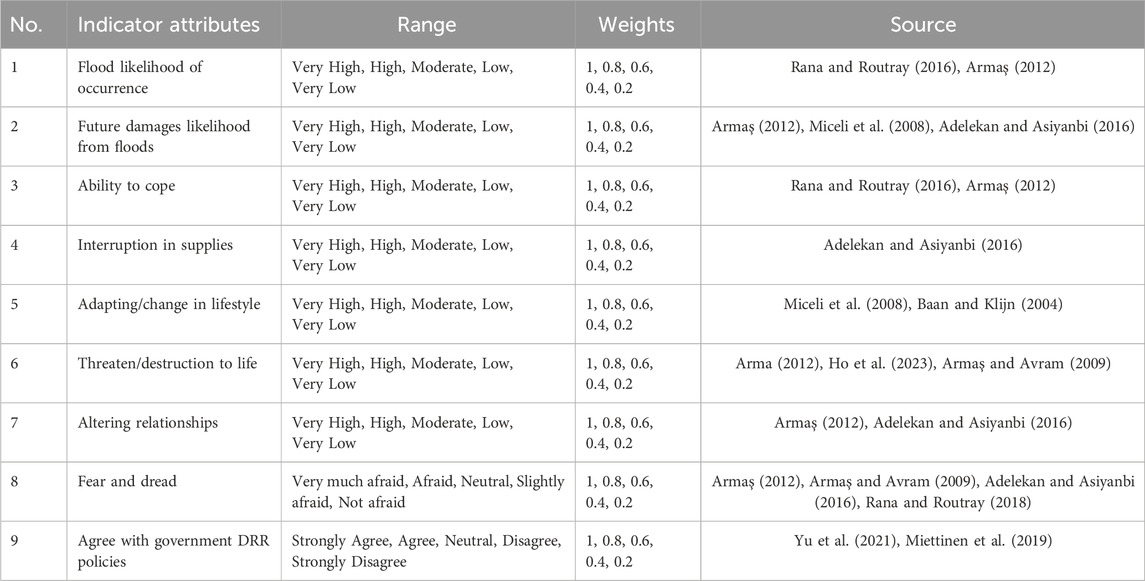
Table 1. Indicators used for flood risk perception with their respective weights and sources.
2.5 Data analysis methods
This study has also been extended to discover the relationship between respondents’ socioeconomic characteristics and their risk perception. In this study, the researcher has preferred logistic regression over the following reasons: first, the logistic regression model allows the evaluation of multiple explanatory variables by extension of the basic principles (Miettinen et al., 2019). Second, the researcher has more freedom when using logistic regression and the method may be more appropriate for non-normally distributed data. Third, multiple regressions rely critically on the assumptions of linearity, constant variance, absence of special causes, normality, and independence of the test data (Fang et al., 2014). Last, different studies have preferred dichotomous data for risk perception (Czepiel, 2002; Ludy and Kondolf, 2012; Botzen et al., 2009). For this purpose, the risk perception is transformed into a dichotomous variable. The dependent variable is dichotomous (y), where y takes the value 0 = low-risk perception and 1 = high-risk perception (Equation 3). The expected value of y, E(y) = π, where π denotes P(y = 1). The regression model is given as:
Instead of least-square methods, the maximum likelihood was used to obtain estimated parameters due to the nonlinear function of E(y) = π (Czepiel, 2002) When, π = P(y = 1), then 1−π = P(y = 0), and OR denotes the odds ratio. The ratio is known as the odds (Equation 4) of the event y = 1:
3 Result
3.1 Socioeconomic profile
The socioeconomic characteristics of the respondents in the study area are summarized in Table 2. Of the 373 respondents, 44.24% were aged below 50 years, while 55.76% were over 50 years old, indicating a balance between younger and older respondents. Monthly income was measured in Ethiopian Birr (Birr) per household. The largest proportion of respondents (59.52%) earned less than 5,000 Birr per month, followed by 10.19% earning more than 10,000 Birr, and 30.29% earning between 5,000 and 10,000 Birr.
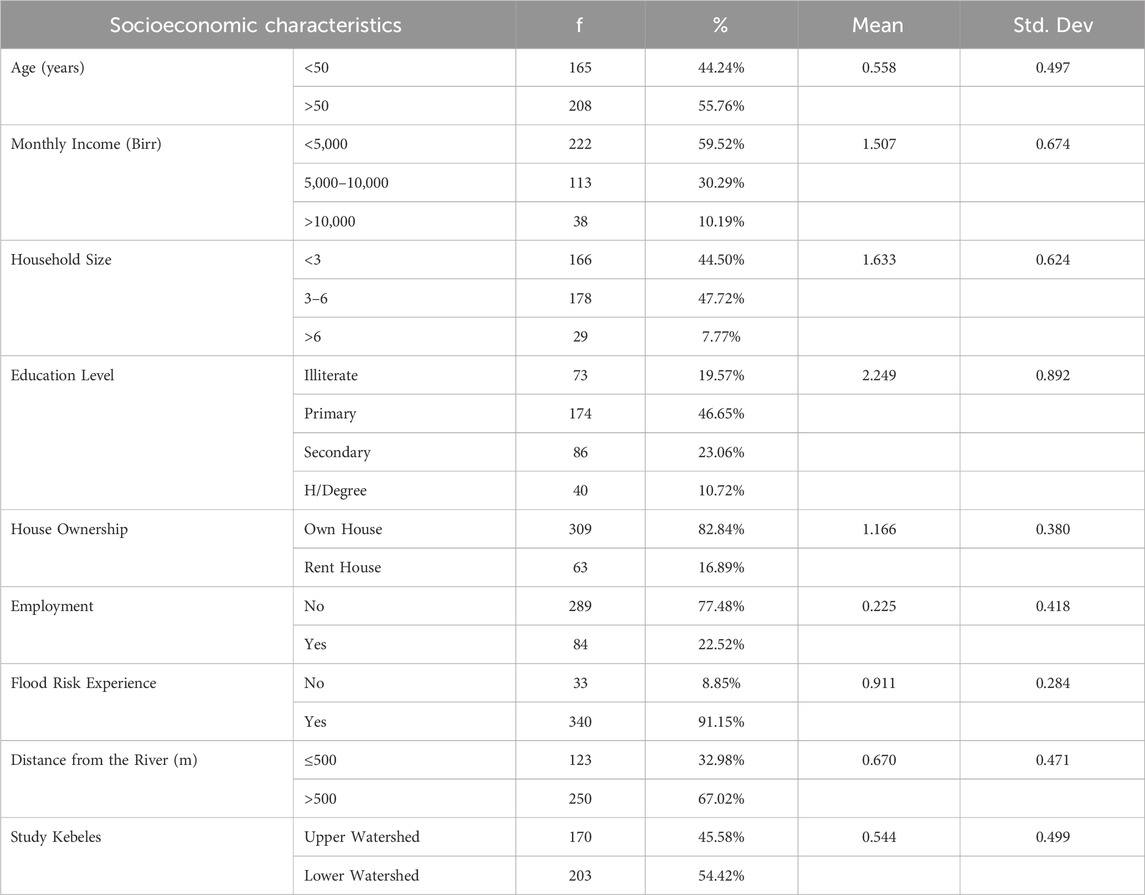
Table 2. Socioeconomic characteristics of the respondents (Field survey, 2022).
This highlights a significant portion of the population within the lower-income group. Regarding household size, households were almost evenly distributed, with 44.50% having fewer than three members, 47.72% having between three and six members, and 7.77% with more than six members. Educational level varied, with 19.57% of respondents being illiterate, 46.65% having completed primary education, 23.06% with secondary education, and 10.72% holding higher education degrees (H/Diploma and Degree). In terms of housing, the majority of respondents (82.84%) owned their homes, while 16.89% rented.
Most respondents 77.48% were unemployed, while 22.52% were employed. Flood risk experience was reported by 91.15% of respondents, indicating prior exposure to flooding.
In addition, 32.98% of households were located within 500 m of the river, while 67.02% were farther than 500 m. Geographically, 45.58% of respondents lived in upper watershed kebeles, whereas 54.42% resided in lower watershed kebeles. These findings, as presented in Table 2, provide a comprehensive overview of the socioeconomic characteristics of the respondents, highlighting factors such as age, income, household size, education, and proximity to flood-prone areas.
3.2 Descriptive statistics of risk perception indicators
The risk perception levels of respondents were analyzed using a weight scale ranging from 1 to 0.2, (1.0 = very high to 0.2 = very low). Among respondents, 33.24% perceived flood occurrence as high and 58.98% as very high, while only 6.17% and 1.61% rated it as low or very low, respectively. The strong consensus on flood likelihood is reflected in a high mean (0.899, SD = 0.137). Similarly, flood damages were widely considered severe, with 54.96% rating them as high and 38.61% as very high, while only 6.43% perceived them as low. The high mean (0.864, SD = 0.118) indicates strong agreement on the severity of flood impacts. Coping ability was rated as low by 56.57% and very low by 13.14%, while only 19.03% considered it moderate and 11.26% rated it as high or very high. The low mean (0.469, SD = 0.196) suggests significant challenges in coping, reflecting disparities in preparedness and access to resources. Supply disruptions were a major concern, with 58.45% perceiving them as high and 31.37% as very high, while only 8.85% considered them moderate. The high mean (0.840, SD = 0.129) indicates widespread concern with relatively low variation. Lifestyle changes due to floods showed diverse perceptions, with 45.04% rating them as high and 28.15% as very high, while 15.01% considered them moderate and 11.80% rated them as low or very low. The moderate mean (0.774, SD = 0.202) reflects significant but varied impacts. Concerns about loss of life due to floods were substantial, with 40.21% rating the risk as high and 31.37% as very high, while 14.75% considered it moderate and 13.67% rated it as low or very low. The high mean (0.771, SD = 0.217) highlights strong concerns. Altering relationships due to floods was perceived as high by 47.99% and very high by 30.03%, while only 6.17% rated it as moderate. The high mean (0.774, SD = 0.222) suggests significant social disruptions. Emotional responses to floods varied widely, with 60.86% reporting being slightly afraid, 22.25% expressing no fear, 7.24% being moderately afraid, and 9.65% experiencing high or very high fear. The high mean (0.785, SD = 0.183) reflects a broad emotional range. Perceptions of government disaster risk reduction (DRR) policies were mixed, with 37.53% agreeing, 26.01% strongly agreeing, 11.53% disagreeing, and 11.26% remaining neutral. The moderate mean (0.494, SD = 0.251) suggests some support but also skepticism. Generally, the findings highlight significant flood risks, limited coping and adaptation capacity, and concerns over social and economic impacts.
The high mean values across key indicators suggest widespread agreement on major risks, while varying standard deviations reflect differences in personal experiences and perspectives. Although government policies receive moderate support, skepticism underscores the need for stronger community engagement and enhanced disaster preparedness measures (Table 3).
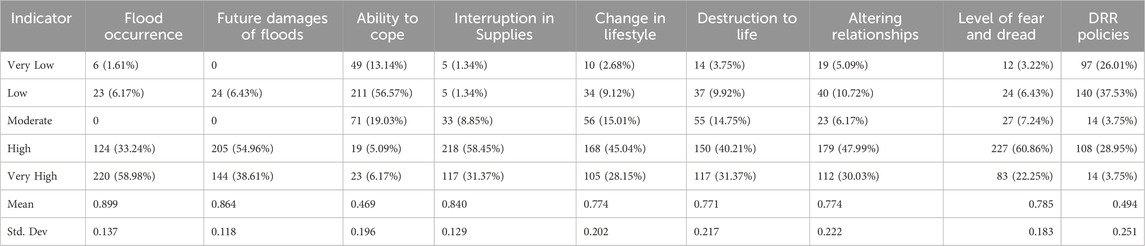
Table 3. Descriptive statistics of flood risk perception indicators (Field survey, 2022).
3.3 Comparison of households based on level of risk perception
Respondents were categorized into two groups based on their level of risk perception, using the mean score as a cutoff (Table 4). Low-risk perception respondents comprised 143 individuals (38.34%), while high-risk perception respondents totaled 230 individuals (61.66%). The Chi-square test results revealed significant differences across several socio-demographic factors. Monthly income significantly correlated with risk perception (p-value = 0.001). Respondents earning between 5,000 and 10,000 Birr had the highest proportion of high-risk perception (70.37%), followed by those earning less than 5,000 Birr (61.76%) and more than 10,000 Birr (55.74%). Although not statistically significant (p-value = 0.368), education level revealed that respondents with higher educational attainment (H/Diploma and Degree) exhibited a higher proportion of high-risk perception (68.09%) compared to those with primary (64.04%) and secondary education (58.62%). House ownership was significantly associated with risk perception (p-value = 0.007), with renters slightly more likely to perceive high risk (63.54%) compared to homeowners (61.23%). Employment status also demonstrated a strong and significant relationship with risk perception (p-value = 0.000). Unemployed respondents were more likely to have high-risk perceptions (63.18%) compared to employed respondents (57.29%). Prior flood risk experience showed a highly significant association with risk perception (p-value = 0.000), as respondents who had experienced flooding were much more likely to perceive high risk (65.99%) compared to those without prior experience (10.34%). The proximity of households to the river was marginally significant (p-value = 0.053). Households located within 500 m of the river were more likely to perceive high risk (65.56%) compared to those farther away (51.46%). Although not statistically significant (p-value = 0.072), watershed location indicated that respondents from lower watershed kebeles were more likely to perceive high risk (64.32%) compared to those from upper watershed kebeles (58.13%).
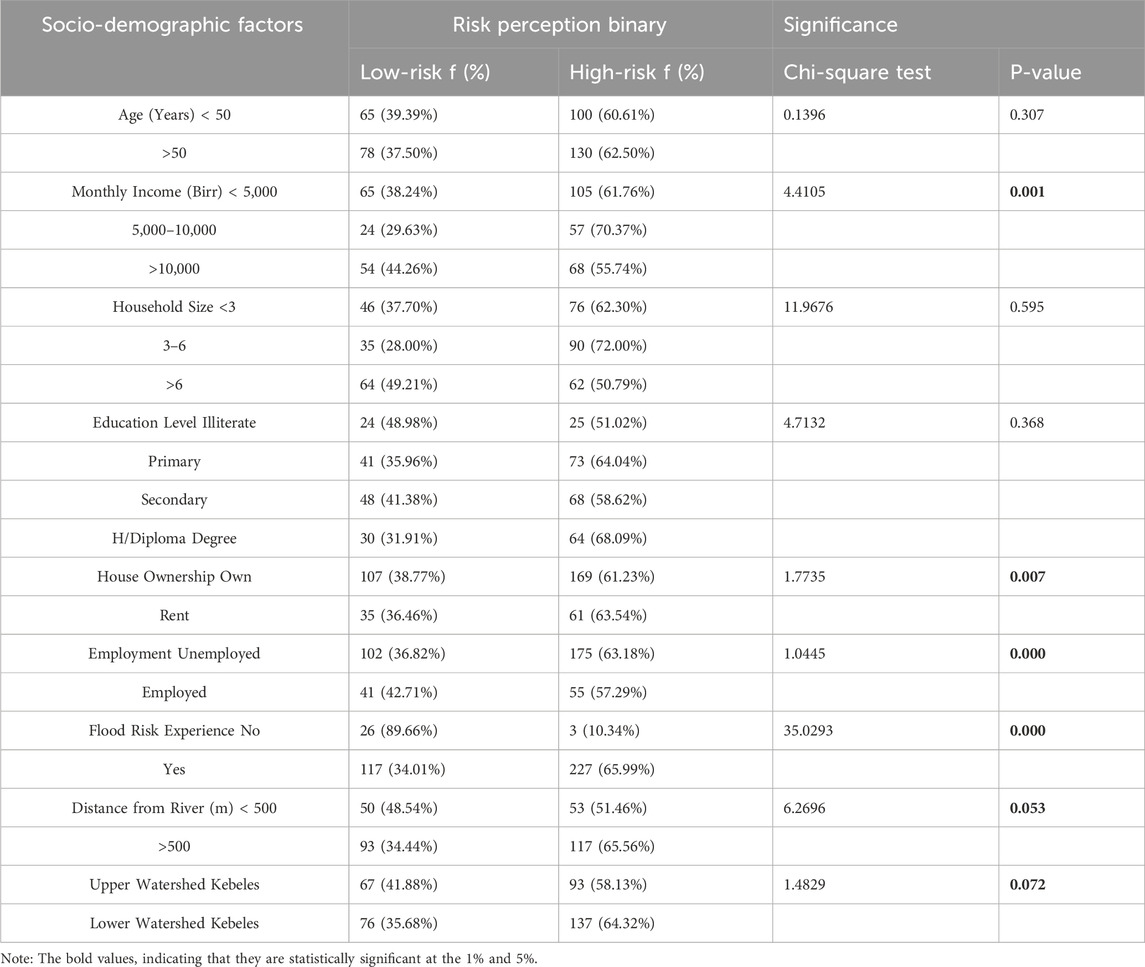
Table 4. Comparison of households based on flood risk perception (Field survey, 2022).
These results, presented in Table 4, highlight the significant role of socio-demographic factors in shaping flood risk perception among respondents.
3.4 Results of the regression model
The relationship between various socio-demographic factors and flood risk perception was analyzed using a binary logistic regression model, with the results presented in Table 5. The dependent variable was dichotomous, where 0 represented low-risk perception and one represented high-risk perception. The model demonstrated a good fit, with a pseudo-R-squared value of 0.490 and a highly significant Chi-square statistic of 99.964 (p-value = 0.000). The Akaike Information Criterion (AIC) and Bayesian Information Criterion (BIC) values were 125.869 and 169.006, respectively, indicating the model’s reliability in predicting flood risk perception. Key findings reveal that flood risk experience was the most significant factor influencing risk perception.
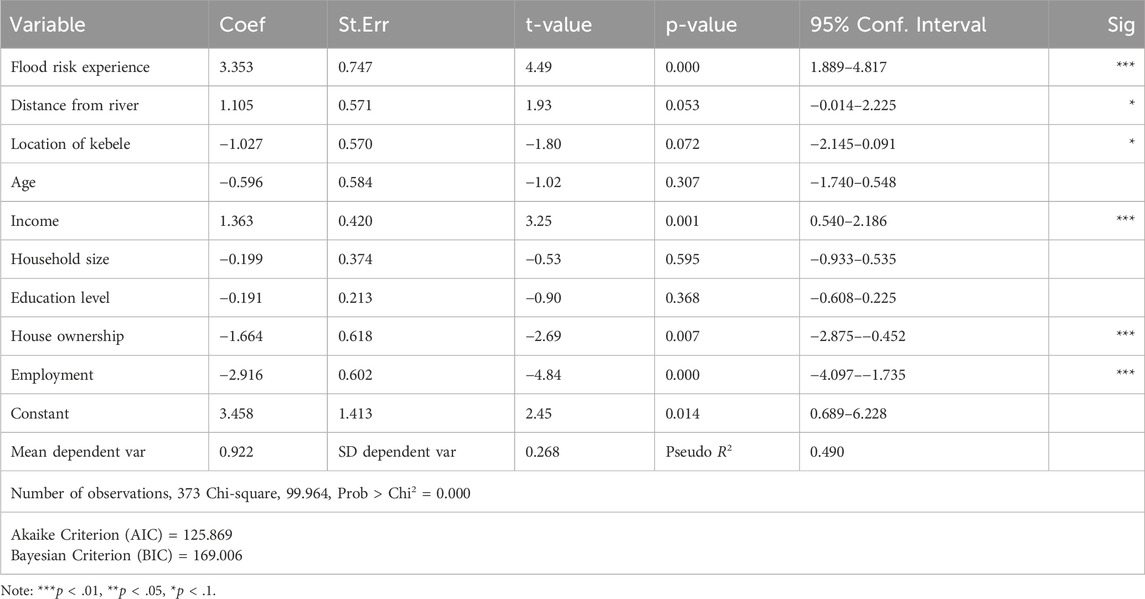
Table 5. Results of logistic regression (Field survey, 2022).
Respondents with prior flood experience were 3.35 times more likely to perceive high flood risk compared to those without such experience (p-value = 0.000), underscoring the role of personal experience in shaping perceptions of flood hazards. Income was also positively associated with flood risk perception; individuals with higher income levels were more likely to perceive higher flood risk (coefficient = 1.363, p-value = 0.001). This may reflect better awareness or higher stakes in safeguarding their assets. Similarly, house ownership significantly influenced perception, with homeowners being less likely to perceive high flood risk compared to renters (coefficient = −1.664, p-value = 0.007). This could be attributed to greater confidence or resources in managing flood risks. Employment status also played a critical role, as unemployed respondents were significantly more likely to perceive higher flood risk than employed individuals (coefficient = −2.916, p-value = 0.000), potentially reflecting increased vulnerability or reduced coping capacity. Environmental factors also contributed to risk perception. Proximity to the river was marginally significant (p-value = 0.053), with respondents living closer to the river being more likely to perceive high flood risk (coefficient = 1.105).
Similarly, geographical context influenced perceptions, as respondents from lower watershed kebeles showed a higher perception of flood risk compared to those in upper watershed kebeles, though this result was marginally significant (p-value = 0.072). On the other hand, certain factors did not show significant associations with flood risk perception. Age, Household size and education level had no significant impact on flood risk perception.
4 Discussion
In Ethiopia, particularly in the flood-prone regions of the Gambella Regional State, understanding local flood risk perception is vital for developing effective and targeted flood risk management strategies. Studies conducted in Ethiopia have highlighted the importance of localized flood risk assessments in various regions. In the study area local communities exhibit varying levels of flood risk perception, which are influenced by a range of socio-economic, geographical, and environmental factors. The primary determinants influencing flood risk perception in the study area include monthly income, house ownership, employment status, flood risk experience, distance from rivers, and the location of the kebele within the study watershed. Flood experience emerges as a key factor in shaping flood risk perception, with individuals who have previously experienced floods demonstrating heightened awareness and preparedness for future events. This aligns with findings from Getahun and Gebre (2015), Taye et al. (2018), who emphasized the significant influence of past flood experiences on risk perception. These studies highlight that direct exposure to flood events plays a crucial role in how individuals perceive and respond to flood risks. Additionally Bradshaw et al. (2007), Ludy and Kondolf (2012) found that individuals with direct experience of floods exhibited greater concern and preparedness for future events. Higher-income individuals in the study area perceive greater flood risks, likely due to their increased awareness of potential economic losses associated with flooding. This finding is consistent with the literature, which suggests that wealthier individuals are more likely to recognize and assess flood risks accurately due to their financial stakes and the potential for significant asset loss. Studies by Botzen et al. (2009), Wang et al. (2018), demonstrate that individuals with higher incomes tend to exhibit a greater awareness of flood risks and are more concerned about the economic damages that floods may cause to their properties and assets. Higher-income individuals are often more vulnerable to the financial impacts of floods, and their awareness may lead to increased preparedness and risk mitigation behaviors (Bubeck et al., 2012a). Homeownership is a significant factor in flood risk perception, with homeowners, who have a more permanent investment in their property, being more likely to perceive higher flood risks compared to renters. Homeowners are generally more concerned about property damage because they bear the full economic burden of flood-related losses. This finding aligns with studies by Botzen et al. (2009), Wang et al. (2018), who found that homeowners, due to their long-term financial stake in their property, tend to have heightened perceptions of flood risks. The increased awareness among homeowners can be attributed to the potential loss of both property value and personal belongings, which renters, with less long-term financial investment, might not prioritize as much (Ludy and Kondolf, 2012). Additionally, studies by Alfieri et al. (2016), Tanoue et al. (2016) have demonstrated that climate change is exacerbating the frequency and intensity of floods, which in turn influences communities’ perceptions of flood risks. Environmental factors, such as proximity to rivers, played a significant role in shaping flood risk perception in this study, aligning with the findings of Taye et al. (2018), Getahun and Gebre (2015). Both studies observed that households situated closer to rivers exhibited heightened perceptions of flood risks, a trend also noted in the Lake Tana Basin and Awash River Basin. In this study Younger individuals did not exhibit significantly higher flood risk perception compared to older individuals, contrast with (Taye et al., 2018), who observed a stronger flood risk perception among younger individuals in the Lake Tana Basin.
Education level also did not significantly influence flood risk perception in this study, diverging from Taye et al. (2018), Adger et al. (2005), Wang H. et al. (2021), who found a positive correlation between higher education and flood risk awareness. The expectation of severe flood damages aligns with findings from Bubeck et al. (2012b), who emphasized that perceived risk directly affects adaptive behavior and willingness to take precautionary measures. Coping capacity varies significantly, with some respondents feeling prepared while others lack confidence. This reflects the role of institutional and social support in resilience, as highlighted by Adger et al. (2005), who noted that social capital and governance structures are crucial in disaster response. Supply interruptions are a major concern, reflecting broader impacts on infrastructure and daily life, consistent with Wang H. et al. (2021), who found that service disruptions heighten flood-related distress and economic vulnerability. Adaptation remains a challenge, as some individuals believe they can adjust while others express doubts. This finding echoes (Terpstra, 2011), who demonstrated that adaptation efforts depend on public trust in governance and the perceived effectiveness of risk management strategies. Fear of flooding is prevalent, influencing preparedness and response, similar to the conclusions drawn by Kellens et al. (2013), who linked heightened fear to increased demand for flood protection measures. Social cohesion is also at risk, as disasters can alter community interactions and trust (Wachinger et al., 2013). Skepticism toward government policies highlights the importance of transparency and community involvement in disaster risk reduction, reinforcing the findings of Terpstra (2011), who argued that public trust significantly affects policy acceptance. Strengthening institutional engagement and fostering trust can enhance public confidence in flood management strategies, ensuring more effective mitigation and response efforts. The results further underscore geographical differences in risk perception, as residents in lower watershed areas perceived higher flood risks compared to those in upper watershed areas (Alfieri et al., 2016; Tanoue et al., 2016). This reflects the influence of local environmental conditions and flood exposure. The discrepancies observed in the relationship between age, education level, and flood risk perception when compared to existing literature highlight the importance of flood risk management strategies that are adaptable to the unique socio-economic, environmental, and cultural contexts of each region. Several studies emphasize that risk perception is influenced by multiple demographic factors, but these relationships are often context-dependent (Bubeck et al., 2012b). Found that education level and prior flood experience significantly shape flood risk perception, yet the strength of these associations varies across different regions and socio-economic backgrounds (Bubeck et al., 2012b). Similarly (Wachinger et al., 2013), argue that personal experience with floods often outweighs educational influences, leading to variations in risk perception across different age groups and educational levels. These findings suggest that policymakers should move away from generalized, one-size-fits-all approaches and instead develop localized, community-driven strategies that account for the specific factors influencing flood risk perception in different areas (Terpstra, 2011). Supports this argument, noting that flood risk communication should be tailored to different demographic groups to enhance public engagement and preparedness. By adopting such a tailored approach, policymakers can create more effective and inclusive flood risk management strategies that enhance community resilience and better address the diverse needs of vulnerable communities.
5 Conclusion
This study employed a comprehensive approach to assessing flood risk perception in rural communities by analyzing socio-demographic factors, flood experience, geographical exposure, and economic conditions. The findings indicate that prior flood experience significantly increases risk perception, with affected individuals being 3.35 times more likely to perceive high flood risk. Higher income levels were also positively associated with risk perception, while house ownership and employment status played key roles, with renters and unemployed individuals perceiving greater risks. Additionally, proximity to the river and the location of the kebeles were significant determinants, with residents in flood-prone kebeles of the study watershed and those living closer to the river perceiving higher flood risks. These results highlight the importance of integrating community perspectives into flood risk management strategies. Authorities should implement community-based disaster preparedness programs; ensuring vulnerable communities receive adequate support. Sustainable land-use planning should account for community perceptions, while flood-resistant infrastructure should be prioritized where needed, based on objective flood risk assessments. Integrating local knowledge into policy design can enhance flood risk management strategies, making them more inclusive and responsive. To strengthen flood risk mitigation, disaster management authorities should incorporate flood risk perception into planning and policies. Enhancing awareness and improving risk communication can foster better preparedness and long-term resilience, particularly for communities living in flood-prone kebeles of study watershed.
Data availability statement
The raw data supporting the conclusions of this article will be made available by the authors, without undue reservation.
Ethics statement
Informed consent was obtained from all participants involved in interviews and group discussions for this study.
Author contributions
SC: Conceptualization, Data curation, Formal Analysis, Investigation, Methodology, Software, Resources, Validation, Visualization, Writing – original draft, Writing – review and editing. MA: Supervision, validation, Methodology, Writing –review and editing. EG: Supervision, validation, Methodology, Writing – review and editing.
Funding
The author(s) declare that no financial support was received for the research and/or publication of this article.
Conflict of interest
The authors declare that the research was conducted in the absence of any commercial or financial relationships that could be construed as a potential conflict of interest.
Generative AI statement
The authors declare that no Generative AI was used in the creation of this manuscript.
Publisher’s note
All claims expressed in this article are solely those of the authors and do not necessarily represent those of their affiliated organizations, or those of the publisher, the editors and the reviewers. Any product that may be evaluated in this article, or claim that may be made by its manufacturer, is not guaranteed or endorsed by the publisher.
References
Abid, M., Schilling, J., Scheffran, J., and Zulfiqar, F. (2016). Climate change vulnerability, adaptation and risk perceptions at farm level in Punjab, Pakistan. Sci. Total Environ. 547, 447–460. doi:10.1016/j.scitotenv.2015.11.125
Adelekan, I. O., and Asiyanbi, A. P. (2016). Flood risk perception in flood-affected communities in Lagos, Nigeria. Nat. Hazards 80 (1), 445–469. doi:10.1007/s11069-015-1977-2
Adger, W. N., Hughes, T. P., Folke, C., Carpenter, S. R., and Rockström, J. (2005). Social-ecological resilience to coastal disasters. Science 309 (5737), 1036–1039. doi:10.1126/science.1112122
Alfieri, L., Feyen, L., and Di Baldassarre, G. (2016). Increasing flood risk under climate change: a pan-European assessment of the benefits of four adaptation strategies. Clim. Change 136 (3–4), 507–521. doi:10.1007/s10584-016-1641-1
Armaş, I. (2012). Multi-criteria vulnerability analysis to earthquake hazard of Bucharest, Romania. Nat. Hazards 63 (2), 1129–1156. doi:10.1007/s11069-012-0209-2
Armaş, I., and Avram, E. (2009). Perception of flood risk in danube Delta, Romania. Nat. Hazards 50 (2), 269–287. doi:10.1007/s11069-008-9337-0
Arnell, N. W., and Gosling, S. N. (2016). The impacts of climate change on river flood risk at the global scale. Clim. Change 134, 387–401. doi:10.1007/s10584-014-1084-5
Baan, P. J., and Klijn, F. (2004). Flood risk perception and implications for flood risk management in The Netherlands. Int. J. River Basin Manag. 2 (2), 113–122. doi:10.1080/15715124.2004.9635226
Bihonegn, B. G., and Awoke, A. G. (2023). Evaluating the impact of land use and land cover changes on sediment yield dynamics in the Upper Awash Basin, Ethiopia the case of Koka reservoir. Heliyon 9 (12), e23049. doi:10.1016/j.heliyon.2023.e23049
Botzen, W. J. W., Aerts, J. C. J. H., and Van Den Bergh, J. C. J. M. (2009). Dependence of flood risk perceptions on socioeconomic and objective risk factors. Water Resour. Res. 45 (10), 2009WR007743. doi:10.1029/2009WR007743
Bradshaw, C. J. A., Sodhi, N. S., Peh, K. S.-H., and Brook, B. W. (2007). Global evidence that deforestation amplifies flood risk and severity in the developing world. Glob. Change Biol. 13 (11), 2379–2395. doi:10.1111/j.1365-2486.2007.01446.x
Bruijnzeel, L. A. (2004). Hydrological functions of tropical forests: not seeing the soil for the trees? Agric. Ecosyst. Environ. 104 (1), 185–228. doi:10.1016/j.agee.2004.01.015
Bubeck, P., Botzen, W. J. W., and Aerts, J. C. (2012a). A review of risk perceptions and other factors that influence flood mitigation behavior. Risk Anal. Int. J. 32 (9), 1481–1495. doi:10.1111/j.1539-6924.2011.01783.x
Bubeck, P., Botzen, W. J. W., Suu, L. T. T., and Aerts, J. C. J. H. (2012b). Do flood risk perceptions provide useful insights for flood risk management? Findings from central V ietnam. J. Flood Risk Manag. 5 (4), 295–302. doi:10.1111/j.1753-318X.2012.01151.x
Czepiel, S. A. (2002). Maximum likelihood estimation of logistic regression models: theory and implementation. Available online at: https://www.stat.cmu.edu/∼brian/valerie/617-2022/617-2021/week07/resources/mlelr.pdf (Accessed February 24, 2025).
Diakakis, M., Priskos, G., and Skordoulis, M. (2018). Public perception of flood risk in flash flood prone areas of Eastern Mediterranean: the case of Attica Region in Greece. Int. J. Disaster Risk Reduct. 28, 404–413. doi:10.1016/j.ijdrr.2018.03.018
Ellison, D., Morris, C. E., Locatelli, B., Sheil, D., Cohen, J., Murdiyarso, D., et al. (2017). Trees, forests and water: Cool insights for a hot world. Glob. Environ. Change 43, 51–61. doi:10.1016/j.gloenvcha.2017.01.002
Fang, S., Xu, L., Pei, H., Liu, Y., Liu, Z., Zhu, Y., et al. (2014). An integrated approach to snowmelt flood forecasting in water resource management. IEEE Trans. Ind. Inf. 10 (1), 548–558. doi:10.1109/TII.2013.2257807
Getahun, Y. S., and Gebre, S. L. (2015). Flood hazard assessment and mapping of flood inundation area of the Awash River Basin in Ethiopia using GIS and HEC-GeoRAS/HEC-RAS model. J. Civ. Environ. Eng. 5 (4), 1.
Green, C. (2004). The evaluation of vulnerability to flooding. Disaster Prev. Manag. Int. J. 13 (4), 323–329. doi:10.1108/09653560410556546
Greenough, G., McGeehin, M., Bernard, S. M., Trtanj, J., Riad, J., and Engelberg, D. (2001). The potential impacts of climate variability and change on health impacts of extreme weather events in the United States. Environ. Health Perspect. 109 (Suppl. 2), 191–198. doi:10.1289/ehp.109-1240666
Ho, M., Wasko, C., O’Shea, D., Nathan, R., Vogel, E., and Sharma, A. (2023). Changes in flood-associated rainfall losses under climate change. J. Hydrol. 625, 129950. doi:10.1016/j.jhydrol.2023.129950
Ho, W. (2008). Integrated analytic hierarchy process and its applications – a literature review. Eur. J. Oper. Res. 186 (1), 211–228. doi:10.1016/j.ejor.2007.01.004
Jones, A., Kuehnert, J., Fraccaro, P., Meuriot, O., Ishikawa, T., Edwards, B., et al. (2023). AI for climate impacts: applications in flood risk. Npj Clim. Atmos. Sci. 6 (1), 63. Available online at: https://www.nature.com/articles/s41612-023-00388-1 (Accessed: March 10, 2025).
Kellens, W., Vanneuville, W., Verfaillie, E., Meire, E., Deckers, P., and De Maeyer, P. (2013). Flood risk management in flanders: past developments and future challenges. Water Resour. Manag. 27 (10), 3585–3606. doi:10.1007/s11269-013-0366-4
Kellens, W., Zaalberg, R., Neutens, T., Vanneuville, W., and De Maeyer, P. (2011). An analysis of the public perception of flood risk on the Belgian coast. Risk Anal. Int. J. 31 (7), 1055–1068. doi:10.1111/j.1539-6924.2010.01571.x
Liu, D., Li, Y., Shen, X., Xie, Y., and Zhang, Y. (2018). Flood risk perception of rural households in western mountainous regions of Henan Province, China. Int. J. Disaster Risk Reduct. 27, 155–160. doi:10.1016/j.ijdrr.2017.09.051
Ludy, J., and Kondolf, G. M. (2012). Flood risk perception in lands ‘protected’ by 100-year levees. Nat. Hazards 61 (2), 829–842. doi:10.1007/s11069-011-0072-6
Messner, F., and Meyer, V. (2006). “Flood damage, vulnerability and risk perception – challenges for flood damage research,” in Flood risk management: hazards, vulnerability and mitigation measures. Editors J. Schanze, E. Zeman, and J. Marsalek (Dordrecht: Springer Netherlands), 149–167. doi:10.1007/978-1-4020-4598-1_13
Miceli, R., Sotgiu, I., and Settanni, M. (2008). Disaster preparedness and perception of flood risk: a study in an alpine valley in Italy. J. Environ. Psychol. 28 (2), 164–173. doi:10.1016/j.jenvp.2007.10.006
Miettinen, O. S., Steurer, J., and Hofman, A. (2019). “The logistic regression model,” in Clinical research transformed. Editors O. S. Miettinen, J. Steurer, and A. Hofman (Cham: Springer International Publishing), 61–70. doi:10.1007/978-3-030-06176-0_7
Pelling, R., Woodbridge, J., and Fyfe, R. (2021). Archaeology and agriculture: plants, people and past land-use. Trends Ecol. Evol. 36, 943–954. Available online at: https://pearl.plymouth.ac.uk/cgi/viewcontent.cgi?article=1373&context=gees-research (Accessed March 10, 2025).
Pickering, C. J., Dancey, M., Paik, K., and O’Sullivan, T. (2021). Informal caregiving and disaster risk reduction: a scoping review. Int. J. Disaster Risk Sci. 12 (2), 169–187. doi:10.1007/s13753-021-00328-8
Qasim, S., Nawaz Khan, A., Prasad Shrestha, R., and Qasim, M. (2015). Risk perception of the people in the flood prone Khyber Pukhthunkhwa province of Pakistan. Int. J. Disaster Risk Reduct. 14, 373–378. doi:10.1016/j.ijdrr.2015.09.001
Rana, I. A., Jamshed, A., Younas, Z. I., and Bhatti, S. S. (2020). Characterizing flood risk perception in urban communities of Pakistan. Int. J. Disaster Risk Reduct. 46, 101624. doi:10.1016/j.ijdrr.2020.101624
Rana, I. A., and Routray, J. K. (2016). Actual vis-à-vis perceived risk of flood prone urban communities in Pakistan. Int. J. Disaster Risk Reduct. 19, 366–378. doi:10.1016/j.ijdrr.2016.08.028
Rana, I. A., and Routray, J. K. (2018). Integrated methodology for flood risk assessment and application in urban communities of Pakistan. Nat. Hazards 91 (1), 239–266. doi:10.1007/s11069-017-3124-8
Schanze, J. (2006). “Flood risk management – a basic framework,” in Flood risk management: hazards, vulnerability and mitigation measures. Editors J. Schanze, E. Zeman, and J. Marsalek, Dordrecht: Springer Netherlands, 1–20. doi:10.1007/978-1-4020-4598-1_1
Shah, A. A., Ye, J., Abid, M., and Ullah, R. (2017). Determinants of flood risk mitigation strategies at household level: a case of Khyber Pakhtunkhwa (KP) province, Pakistan. Nat. Hazards 88 (1), 415–430. doi:10.1007/s11069-017-2872-9
Tanoue, M., Hirabayashi, Y., and Ikeuchi, H. (2016). Global-scale river flood vulnerability in the last 50 years. Sci. Rep. 6 (1), 36021. doi:10.1038/srep36021
Taye, M. T., Dyer, E., Hirpa, F. A., and Charles, K. (2018). Climate change impact on water resources in the Awash basin, Ethiopia. Water 10 (11), 1560. doi:10.3390/w10111560
Terpstra, T. (2011). Emotions, trust, and perceived risk: affective and cognitive routes to flood preparedness behavior. Risk Anal. 31 (10), 1658–1675. doi:10.1111/j.1539-6924.2011.01616.x
Teshome, M. (2020). A review of recent studies on urban stormwater drainage system for urban flood management. Preprints. Available online at: https://www.preprints.org/frontend/manuscript/20ef123fc16d418bfc9854d1ce2674f6/download_pub (Accessed March 01, 2025).
Tilahun, A. K., Haregeweyn, N., and Pingale, S. M. (2018). Landscape changes and its consequences on soil erosion in Baro river basin, Ethiopia. Model. Earth Syst. Environ. 4 (2), 793–803. doi:10.1007/s40808-018-0466-5
Ullah, R., Shivakoti, G. P., and Ali, G. (2015). Factors effecting farmers’ risk attitude and risk perceptions: the case of Khyber Pakhtunkhwa, Pakistan. Int. J. Disaster Risk Reduct. 13, 151–157. doi:10.1016/j.ijdrr.2015.05.005
Wachinger, G., Renn, O., Begg, C., and Kuhlicke, C. (2013). The risk perception paradox—implications for governance and communication of natural hazards. Risk Anal. 33 (6), 1049–1065. doi:10.1111/j.1539-6924.2012.01942.x
Wakuma Abaya, S., Mandere, N., and Ewald, G. (2009). Floods and health in Gambella region, Ethiopia: a qualitative assessment of the strengths and weaknesses of coping mechanisms. Glob. Health Action 2 (1), 2019. doi:10.3402/gha.v2i0.2019
Wal, S. M., and Asseffa, T. (2025). The effects of spatial, social, political and economic activities on ethinic segregation in Gambella city, Ethiopia. Available online at: https://www.researchgate.net/profile/Simon-Wal/publication/364251300_The_Effects_of_Spatial_Social_Political_and_Economic_Activities_on_Ethinic_Segregation_in_Gambella_City_Ethiopia/links/6340d5672752e45ef69f8c31/The-Effects-of-Spatial-Social-Political-and-Economic-Activities-on-Ethinic-Segregation-in-Gambella-City-Ethiopia.pdf?origin=journalDetail&_tp=eyJwYWdlIjoiam91cm5hbERldGFpbCJ9 (Accessed March 08, 2025).
Wang, H., Zhou, J., Tang, Y., Liu, Z., Kang, A., and Chen, B. (2021b). Flood economic assessment of structural measure based on integrated flood risk management: a case study in Beijing. J. Environ. Manage. 280, 111701. doi:10.1016/j.jenvman.2020.111701
Wang, P., Li, Y., Yu, P., and Zhang, Y. (2021a). The analysis of urban flood risk propagation based on the modified susceptible infected recovered model. J. Hydrol. 603, 127121. doi:10.1016/j.jhydrol.2021.127121
Wang, Z., Wu, J., Cheng, L., Liu, K., and Wei, Y.-M. (2018). Regional flood risk assessment via coupled fuzzy c-means clustering methods: an empirical analysis from China’s Huaihe River Basin. Nat. Hazards 93 (2), 803–822. doi:10.1007/s11069-018-3325-9
Woube, M. (1999). Flooding and sustainable land–water management in the lower Baro–Akobo river basin, Ethiopia. Appl. Geogr. 19 (3), 235–251. doi:10.1016/S0143-6228(99)00004-1
Keywords: climate-induced disasters, riverine floods, flash floods, rural flooding, risk perception, flood risk determinants
Citation: Chengu S, Assen M and Gebeyehu E (2025) Flood risk perception among households in flood-prone areas of the Itang watershed, lower Baro Akobo Basin, southwest Ethiopia. Front. Environ. Sci. 13:1548838. doi: 10.3389/fenvs.2025.1548838
Received: 20 December 2024; Accepted: 31 March 2025;
Published: 29 April 2025.
Edited by:
Farrukh Chishtie, University of British Columbia, CanadaReviewed by:
William Amponsah, Kwame Nkrumah University of Science and Technology, GhanaLivia Serrao, European Commission, Joint Research Centre (JRC), Italy
Copyright © 2025 Chengu, Assen and Gebeyehu. This is an open-access article distributed under the terms of the Creative Commons Attribution License (CC BY). The use, distribution or reproduction in other forums is permitted, provided the original author(s) and the copyright owner(s) are credited and that the original publication in this journal is cited, in accordance with accepted academic practice. No use, distribution or reproduction is permitted which does not comply with these terms.
*Correspondence: Shibiru Chengu, c2hpYmlydWNoYW5ndUBnbXUuZWR1LmV0
†ORCID: Mohammed Assen, 0000-0002-3409-141X