 Emily N. Jordan1
 Debabrata Sahoo2*
 Calvin B. Sawyer2
 Jeremy W. Pike2Dara M. Park1
 Sarah A. White1
 Brian E. Haggard3
- 1Plant and Environmental Sciences, Clemson University, Clemson, SC, United States
- 2Department of Agricultural Sciences, Clemson University, Clemson, SC, United States
- 3Department of Biological and Agricultural Engineering, University of Arkansas, Fayetteville, AR, United States
The United States invests billions of dollars annually to perform stream restoration projects, yet few studies have investigated the effects this ecosystem manipulation has on nutrient cycling and associated water quality. Water quality improvement remains a substantial motivation for mitigating catchment-scale disturbances, especially in urban streams. Various urban land use practices impact the transfer and transport of nutrients such as soluble reactive phosphorus, ammonium, and nitrate plus nitrite from land into the streams and rivers. The uptake length (Sw), or the distance a dissolved nutrient travels downstream within a stream reach, can be measured using short-term nutrient injections, where shorter uptake lengths suggest greater nutrient retention. This study evaluated the efficacy of using nutrient injection experiments as a monitoring tool to assess nutrient retention efficiency in first-order urban restored (RES) and urban unrestored (URE) stream reaches within the Piedmont ecoregion of South Carolina during the winter and summer seasons of 2022. Results suggested that the lack of fine sediment, such as silt and clay, may affect the nutrient cycling of phosphorus. The total nitrogen:total phosphorus ratio indicated the stream was phosphorus-limited during the experiments. The mean soluble reactive phosphorus uptake length throughout the study was shorter in RES than URE, suggesting that the restored reach was more efficient in retaining dissolved phosphorus. During summer injection, RES observed the shortest soluble reactive phosphorus uptake length of 77 m, while URE marked the longest uptake length of 3059 m during the same period. However, during winter injections, the URE segment had both the shortest and longest uptake lengths. In summer, RES exhibited noticeably shorter ammonium uptake lengths, while ammonium uptake lengths could not be calculated in URE. The presence of engineered pools in RES assisted in nutrient dynamics and helped trap nutrients, particularly soluble reactive phosphorus and ammonium, and could be prioritized in stream restoration efforts. Preliminary results from this study could provide helpful insights into the effectiveness of stream restoration and in-stream structures on nutrient dynamics, although further research is needed.
1 Introduction
Globally, stream ecosystems are experiencing a decline in water quality and biodiversity, primarily due to an excess of nutrients, such as nitrogen (N) and phosphorus (P), which have become more readily available due to significant land use changes and practices (Miserendino et al., 2011; Liao et al., 2018). In the United States, N and P are the most widespread and studied chemical stressors assessed in lotic ecosystems (EPA, 2022b). Nutrient contributions from both agriculture and urbanization exceed the intrinsic ability of freshwater ecosystems to process N and P enrichment (Nina and Jonathan, 1999; Cole et al., 1993; Manning et al., 2020; Caraco and Cole, 1999), causing poor water quality and reducing the quality of habitat for biota.
Depending on the watershed size and location, urban development generally encompasses a much smaller fraction of the total catchment area than agricultural development (Allan, 2004). However small these urban areas, their influence on watersheds is more pronounced because of impervious surfaces (Bledsoe and Watson, 2001; Paul and Meyer, 2001; Tranmer et al., 2022). The contrast between the geomorphology of riffles and pools, baseflows and stormflows, and hillslopes and in-stream dynamics is exacerbated by urbanization (Blaszczak et al., 2019). The urban land developmental process overwhelms the buffering capacity of streams through loss of riparian vegetation, increased stormwater drainage pipes, impervious surfaces, and runoff carrying various contaminants (Paul and Meyer, 2001). Together, these manipulations result in channel and geomorphic degradation from intense storm flows (Bledsoe and Watson, 2001; Russell et al., 2020), substantial loss of native biodiversity (Stranko et al., 2012), and increased nutrient export to downstream watersheds (Klocker et al., 2009).
The set of physical, biological, and chemical changes consistently observed within streams draining urban land is known as the urban stream syndrome (Walsh et al., 2005). The urban stream syndrome is rooted in rapidly urbanizing catchments that interrupt the natural organizational ability of streams to erode and deposit bed surface material in equilibrium (Wolman, 1967). While there are several explanations for channel modifications [e.g., channelization] due to changes in hydrology, on many occasions, the frequent hydraulic disturbance from storm flows leads to an unbalanced removal of sediment from the stream banks, causing channel enlargement and simplification (Russell et al., 2020). Advanced municipal infrastructure, like sanitary sewers and wastewater treatment plants, effectively reduces nitrogen waste from cities while potentially increasing diffuse nitrogen pollution across watersheds (Bernhardt et al., 2008; Howarth et al., 1996). It is well known that excess release of key contaminants such as N, P, and sediment/solids into stream water from stormwater runoff associated with watershed development deteriorates the physical environment and ecological processes within the stream (Brown et al., 2009; Kaushal et al., 2017; Kriech and Osborn, 2022; Paul and Meyer, 2001; Williams and Filoso, 2023).
The pressure from urban development has placed attention on reducing in-stream nutrient concentrations through a vast number of stream restoration projects (Lammers and Bledsoe, 2017). Stream restoration is a popular, multibillion-dollar investment practice implemented by state and federal agencies, non-government organizations (NGOs), and consultants to improve stream health, structure, and function (Bernhardt et al., 2005). Engineering design practices in the Southeastern United States traditionally follow the Rosgen’s Natural Channel Design to restore the natural pattern, profile, and dimensions of a disturbed stream by emulating a stable channel within the same watershed (Rosgen, 2007). However, these restoration approaches do not address water quality, nutrient dynamics, and their fate and transport. One of the main drivers behind the widespread adoption of stream restoration initiatives in the United States can be explained by mitigation credits issued by regulatory agencies as a financial incentive for developers to invest in stream restoration to meet a waterbody’s Total Maximum Daily Load requirement (Thompson et al., 2018; Williams et al., 2017).
Typically, urban stream restoration is an attempt to reduce the magnitude of flashiness produced by urbanization and reconnect the stream to the floodplain. Restoration involves installing native plant materials and constructing geomorphic complexity and channel stability with boulders, wood, and rock deflectors with the intention of dissipating water flow and increasing hydrologic residence time (Palmer et al., 2014). Previous studies of restored streams assume that once geomorphic complexity and hydrologic residence time are increased, then nutrient processing will be restored because water has more time to exchange back and forth between the surface water column and sediment (Ensign and Doyle, 2006; Craig et al., 2008; Bukaveckas, 2007; Roberts, Mulholland, and Houser, 2007; McMillan et al., 2014). Despite decades of stream restoration practice, factors that govern the responsiveness of in-stream nutrient dynamics to the restoration process are merely conceptual. Efforts to quantify the implications of N and P removal through stream monitoring research need more attention.
Current monitoring practices have focused on testing water quality improvement by analyzing nutrient cycling in post-restoration surface waters of streams (McMillan et al., 2014; Newcomer Johnson et al., 2016; Reisinger et al., 2016). Different stream features in a restored stream, such as riffle-pool sinuosity, change the interaction of the nutrients traveling downstream and potentially increase the retention of nutrient molecules within the stream by enhancing the timing and magnitude of downstream travel (Figure 1). Downstream transport of N and P in flowing water has been studied through short-term injections, where nutrient retention efficiency was measured as the spiraling length or downstream distance traveled before assimilation (Haggard et al., 2001; Chaubey et al., 2007). The rate at which aquatic ecosystems cycle nutrients from the dissolved state within the water column to the particulate state within the sediment or biota is defined as nutrient retention efficiency (Chaubey et al., 2007). This capture and release process influences the timing, magnitude, and form of nutrients that are transported downstream (Meyer et al., 1988).
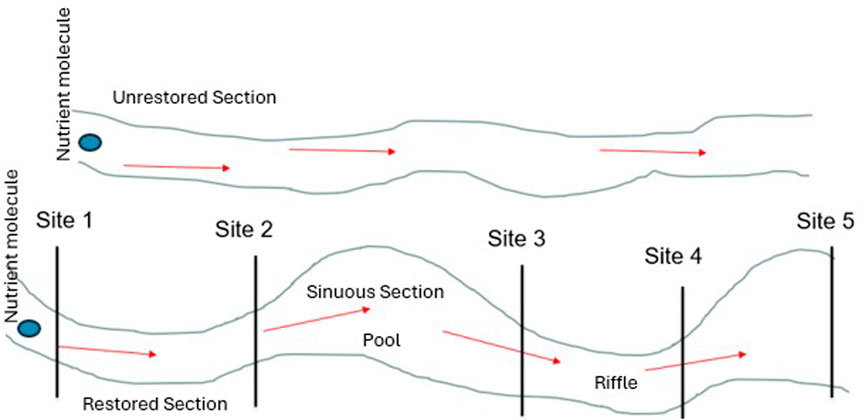
Figure 1. Conceptual diagram illustrating nutrient retention in a restored and unrestored first-order stream.
The spiraling length of a nutrient molecule is the sum of the distance traveled in the particulate form (turnover length, Sp) and dissolved form (uptake length, Sw) (Stream Solute Workshop, 1990). Under baseflow conditions, Sw calculates the distance a dissolved nutrient travels downstream before it is removed from the water column, and nutrient Sw dominates the total spiraling length (Newbold et al., 1983). This transport (Sw) represents retention efficiency and varies by land use, anthropogenic disturbances (e.g., urbanization), and restoration design (Beechie et al., 2010; Haggard et al., 2005; Klocker et al., 2009; McMillan et al., 2014). Assessment of nutrient uptake ability can be performed using short-term nutrient injections within the restored reach (Stream Solute Workshop, 1990).
The overarching goal of this research was to analyze how nutrient injections could aid in monitoring in-stream nutrient dynamics in low-order urban restored (RES) and unrestored (URE) streams in the Piedmont ecoregion of South Carolina. The research question for this study focused on the controls of soluble reactive phosphorus (SRP), ammonium (NH4-N), and nitrate plus nitrite (NO3-N + NO2-N) in two contrasting reaches of the same stream. The specific research questions of this study were to assess the influence of restoration design (e.g., riffle and pool geomorphology), reach length, season, discharge, and other background measurements on performance via estimated nutrient uptake lengths and nutrient trapping efficiencies. We hypothesized that unique spatial and temporal differences in nutrient retention would occur in RES and URE reaches.
To address these research questions, short-term nutrient injection techniques were used in restored and unrestored urban stream reaches to evaluate the spatial and temporal variations in N and P dynamics and understand nutrient retention, whole-stream nutrient trapping efficiency, and nutrient trapping efficiency in the engineered pools.
2 Materials and methods
2.1 Site description
The study was conducted in Richland Creek, a first-order urban stream in the southern inner piedmont ecoregion of South Carolina. For this study, reaches refer to the restored and unrestored locations, sites refer to sampling locations, and restored stream features refer to riffles and pools in RES and URE streams. Sampling occurred in winter (January–March) and summer (June–July) months of 2022. Two stream reaches were selected within Richland Creek in Greenville, South Carolina. The first stream reach was the RES reach in McPherson Park, and the second was the URE reach downstream, parallel to the E Park Ave highway (Figure 2). Richland Creek drains into the Saluda River basin (hydrological unit code 03050109) and is a tributary of the Reedy River with both reaches having approximately 1.8 km2 of the watershed area that consists of less than 1% of pasture, mixed forest, and deciduous forest and approximately 99% urban land use (United States Geographical Survey, 2019).
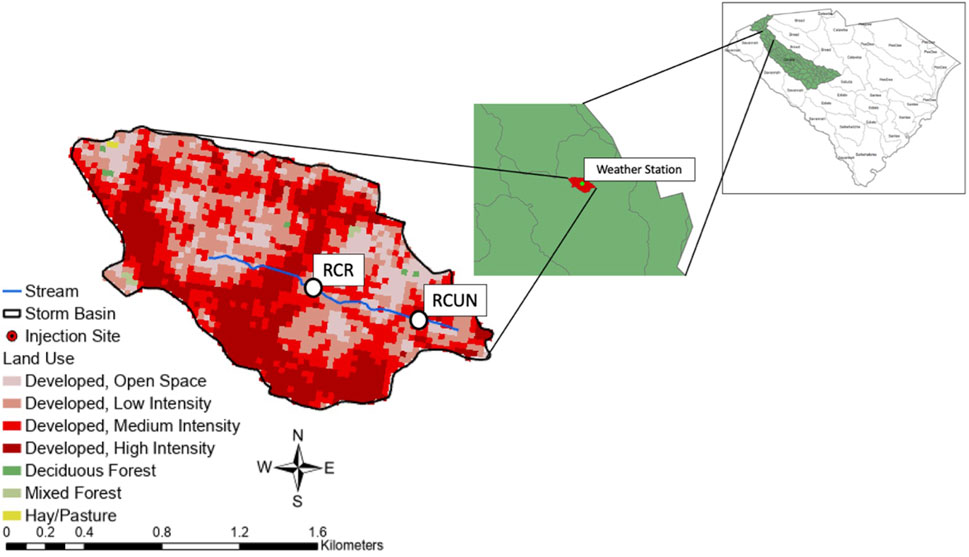
Figure 2. Richland Creek watershed and respective sites, Richland Creek—Restored (RES) and Richland Creek—Unrestored (URE), reside in the upper subwatershed of the Saluda River Basin in Greenville, South Carolina. The weather station is indicated by a green marker.
Based on the information provided by the City of Greenville (personal communication), stream restoration was completed in December 2018 using Rosgen’s Natural Channel Design that begins directly after a culvert in ∼150 m of stream. The objective of this restoration effort was to stabilize the bank and reduce nutrient loading [e.g., total phosphorus (TP) and total nitrogen (TN)] generated by urban land use within the Richland Creek watershed. The stream restoration design plan can be obtained from the City of Greenville, South Carolina. Based on the design plan, it was noticed that regenerative stormwater conveyances, native plants, and biodegradable materials were installed, and over-steepened bank sediment was removed. Detailed information on the installed pools, species of plants, type of plants, where they were planted, and type of biodegradable materials used can be referenced in the design plan. There are two types of stream features, one created step pool that is 25 m long, composed of five sub-pools ranging in length from 4 m to 6 m, and three constructed pools ranging in length from 8 m to 14 m (Table 1). The sequence of constructed step pools has a gradual decline in slope that dissipates energy from high stream discharge, controls erosion, enhances oxygenation, and improves downstream water quality; while the constructed pools provide diversity in stream discharge with a single, deeply excavated stream bed that impounds flow and captures sediment. The sequence of step pools and constructed pools was created during the stream restoration project. The study area focused on a restored reach of ∼70 m length and an unrestored reach of ∼80 m length, with injection experiments occurring at the top of the restored and unrestored reaches. The restored reach includes 11 sampling sites that were consistently sampled for each experiment. These sites contained three riffle and pool features and a step pool conveyance that was included in the sampling (Table 1). The study reach length was cut short due to an outlet pipe at the downstream boundary of the restored reach that continuously drains into the stream.
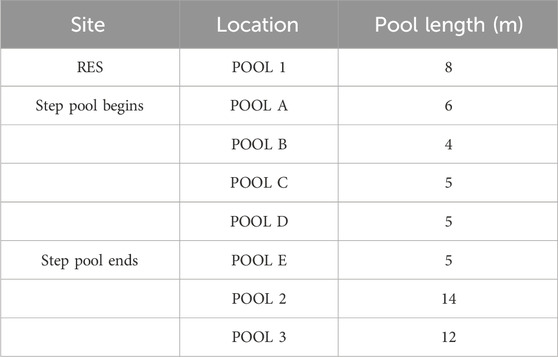
Table 1. Length (m) of each pool within the restored (RES) reach.
Approximately 0.5 km downstream of the RES (separated by a road culvert) section is the URE reach of Richland Creek (Figure 2). This reach is impacted by land uses similar to those of the RES reach. Anecdotal evidence and conversation with local residents within the project area indicated that the land was purchased around the 1930s, and the stream was channelized around the mid-1940s with a stone wall that currently runs parallel to the main road (East Park Ave.) along the entire stream reach. The stream bed is mainly composed of bedrock with remnant riffle-pool structures. Five sampling sites were consistently sampled for each experiment near these remnant riffle-pool structures. URE receives continuous discharge of the outlet pipe at the downstream boundary of the restored reach throughout the entire sampling period. Stormwater outlets recur throughout the reach but were not discharging during the sampling period.
The average width varied spatially (28%) between the RES and URE reaches where the RES reach (range: 2.4–2.7 m, average = 2.62 m
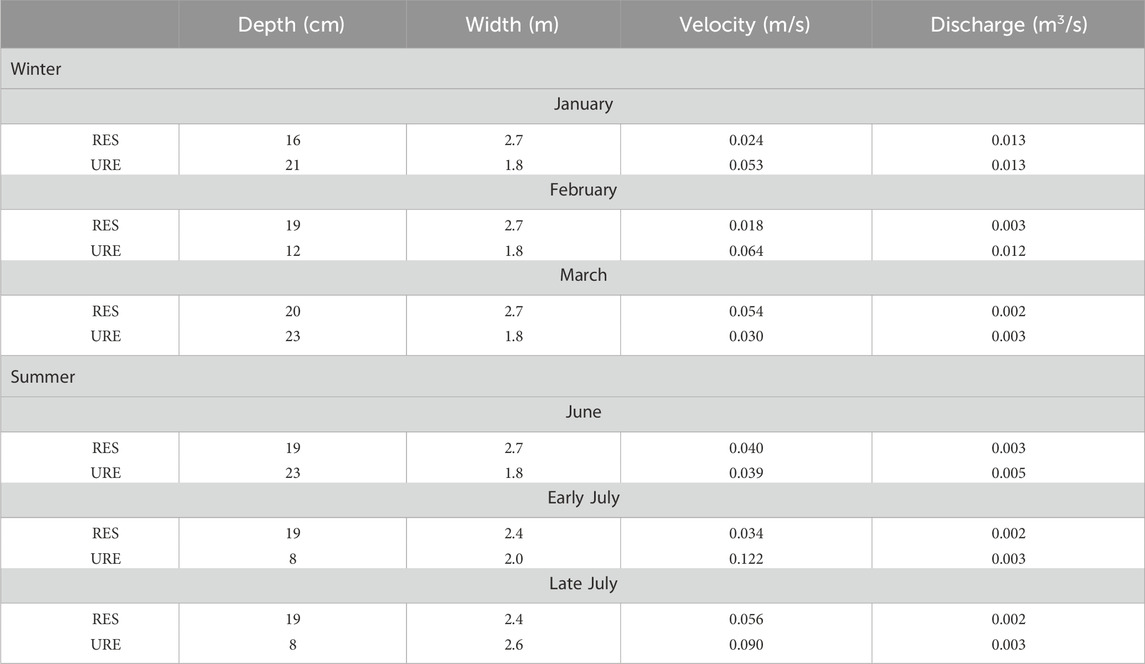
Table 2. Depth, width, velocity, and discharge of sites within restored (RES) and unrestored (URE) reaches of Richland Creek during injections.
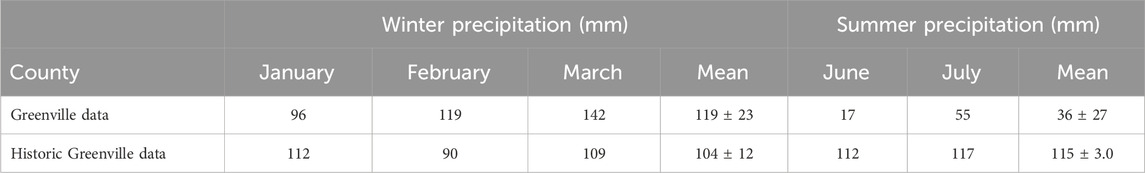
Table 3. Average monthly precipitation (mm) recorded in Greenville County from 2022 to 2023 (AccuWeather, Inc., 2023) and by historical Greenville County weather stations over the last 30 years (National Oceanic and Atmospheric Administration, 2020).
The impervious area in the watershed includes roads, bridges, and access areas in the park that potentially restrict the opportunity for organic matter to decompose into various particle sizes, consequently reducing the possibility of sediment transport into the stream. The dominant particle size of the creek was gravel. The creek contains minimal amounts of silt and clay particles, likely because they are typically found in pools where velocities decrease and allow them to settle (EPA, 2023). In general, the RES reach had 71% gravel, 29% sand, and less than 1% silt and clay, while the URE reach had 73% gravel, 27% sand, and less than 1% silt and clay as estimated during the sampling. [Advancing Standards Transforming Markets (2017)]
The average temperatures for the injection dates in winter were 10°C in January, 12°C in February, and 23°C in March. January and February average temperatures from the injection dates were within the 30-year minimum and maximum averages for Greenville County, where the study sites are located. However, March was 6°C higher than the historic average maximum temperature in the Greenville County area (National Oceanic and Atmospheric Administration, 2020). During the summer, the sampled sites collectively had an average temperature of 30°C in June and 28°C in July during the injection dates (Table 2), which was also within the 30-year minimum and maximum average temperature in Greenville County (National Oceanic and Atmospheric Administration, 2020). Given the overall weather data (Table 4), there were no atypical trends when compared with the long-range data. Therefore, there is a fair degree of confidence that the empirical findings from this study are representative of the seasonal conditions. The average monthly precipitation from a Greenville weather station was compared with the 30-year average precipitation in Greenville County to understand how rainfall may have influenced the watersheds during the study period. Based on weather station data, higher than the 30-year average precipitation occurred in the winter, while 3× lower-than-normal precipitation occurred during the summer (Table 3) (National Oceanic and Atmospheric Administration, 2020). June was the driest month, with the lowest precipitation amounts that were below the historical precipitation levels for Greenville County (Table 3). This dry summer period may have been a result of ongoing climate warming in the rapidly growing state of South Carolina (Sanchez et al., 2020).
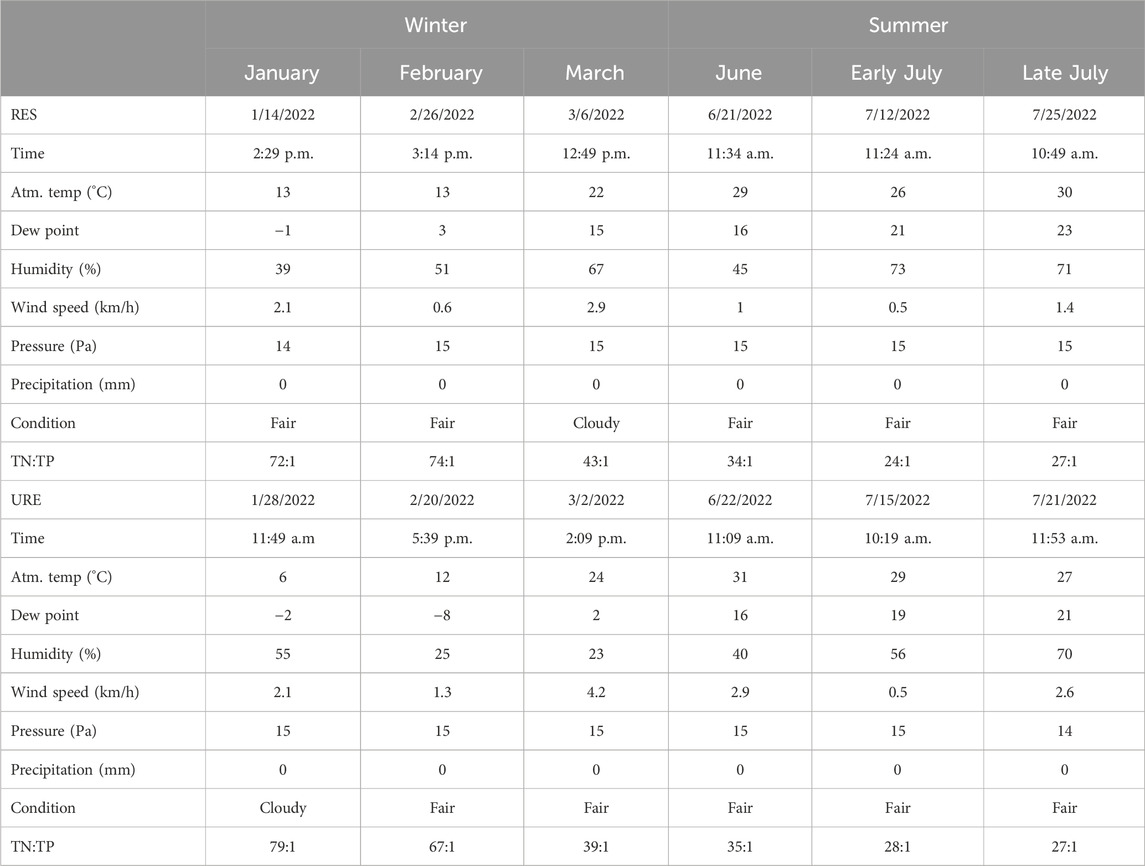
Table 4. Date of each injection along with the weather station data and background total nitrogen and total phosphorus ratio (TN:TP) recorded on each day of an injection for restored (RES) and unrestored (URE) reaches of Richland Creek.
2.2 Nutrient injection experiments
All experiments were conducted under baseflow conditions between sunrise and sunset (Table 4). Field experiments avoided periods of storm events. Stream velocity measurements (Marsh-McBirney Inc., 1990) were conducted and discharge (Turnipseed and Sauer, 2010) was calculated during baseflow conditions, the day before each experiment, near the most upstream injection site of each study reach using a Flo-Mate 2000 flow meter (Hach Company, Frederick, Maryland, United States). Stream velocity measurements were taken using the midsection method (Young, 1950). Velocity measurements were taken at every 0.15 m within the transect at the standard 0.6 water depth using the top-setting wading rod near the injection site. Discharge was then calculated to estimate the amount of salt to be added to the Marriott bottle. One modified Marriott bottle (20 L polypropylene bottle) with a constant effusion velocity was used for injection. The target solute injection concentration was determined by the discharge of the stream, spike concentration, emitter rate, volume of the Mariotte bottle, and molecular weight of each solute for each experiment.
To quantify the in-stream uptake of N as ammonium (NH4-N), nitrate plus nitrate (NO3-N + NO2-N), and soluble reactive phosphorus (SRP), 12 separate short-term solute addition experiments (six separate experiments per reach) were conducted during the winter season, January through March 2022, and the summer season, June through July 2022 (Table 4). Conductivity measurements were collected as part of the injection studies, and the measurements were also used to understand the spatial and temporal heterogeneity of stream flow and water quality. The duration of each injection depended on the discharge rate, but the plateau was generally reached over 1 h for the two selected reaches on all occasions. The plateau is the point in time when the downstream concentration of salt reaches a steady state condition, which is observed through the conductivity measurements using YSI ProDSS. The solute solution varied for each experiment date because the concentration of each solute depends on the discharge of the stream reach. The solute solution, containing sodium phosphate monobasic monohydrate (NaH2PO4.H2O, as a phosphate source), ammonium nitrate (NH4NO3, as an ammonium and nitrate source), and sodium chloride (NaCl, as a conservative tracer source), was added at constant flow rate using a Mariotte bottle at the injection site (beginning of the reach) on each separate experiment. This was conducted according to the standard procedures outlined in the Stream Solute Workshop (1990). NaCl was used to correct for dilution in NH4-N, NO3-N + NO2-N, and SRP concentrations within the reach because chloride concentration remains relatively constant as water moves downstream. Spike concentrations of SRP (0.03 mg/L), NH4-N (0.1 mg/L), NO3-N + NO2-N (0.1 mg/L), and NaCl (3 mg/L) solutes were set on each sampling date based on previous studies [e.g., Stream Solute Workshop, 1990; Haggard et al., 2001; Chaubey et al., 2007; McMillan et al., 2014; where a small spike concentration is set according to the demand for the nutrient. Excess nutrient concentration is not prescribed to avoid oversaturation of nutrients in the stream reach.].
The discharge of the stream was again calculated at the injection site on the injection day. If the discharge was within a 10% difference from the previous reading taken the day before injection, no change was made to the Mariotte bottle’s emitter rate. Weather conditions were recorded for reference.
The Mariotte bottle was placed ∼1.5 m upstream of the first sampling site inside the tripod consistently for all the experiments. Before injection started, background water samples were collected using acid-washed 250-mL HDPE wide-mouth bottles at each sampling site. Samples were taken in constricted, well-mixed areas of the stream, or riffles. At the RES sites, sampling was conducted at distinguished riffles, specifically at the head and the tail, where there was free-flowing, mixing water.
Water samples were taken at each site using three 250-mL bottles at the right, middle, and left portions of the stream channel. All three samples were mixed, and one composite sample was collected and analyzed. Sampling at each site was conducted with minimal disturbance by sampling from downstream to upstream. Water samples were filtered with 0.45-μm pore size filters before the injection started. The conductivity sensors were completely submerged in the nearest rifle next to the Mariotte bottle and at the most downstream sampling site. The Mariotte bottle was turned on once the sensors were in place. The conductivity readings were recorded at the most upstream site and the downstream site. Surface water plateau samples were collected in a manner similar to that of background samples when the conductivity reached a plateau at the downstream site. Once the samples were collected, injection was stopped, and conductivity measurements were recorded until conductivity readings returned to background conditions.
All water samples were filtered and acidified, if needed, then stored at < 4°C until delivery to the Arkansas Water Resources Center’s certified water quality lab (https://awrc.uada.edu/water-quality-lab/). Filtered water samples were analyzed for nitrate, sulfate, fluoride, and chloride using an ion chromatograph (EPA Method 300.0, Dionex System 1600). Filtered, acidified (pH < 2) water samples were analyzed for dissolved nutrients on a wet chemistry autoanalyzer (Skalar Sans++ System), including SRP (EPA Method 365.1, method detection limit of 0.004 mg/L), NH4-N (EPA Method 351.2, method detection limit of 0.020 mg/L), and NO3-N + NO2-N (EPA Method 353.2, method detection limit of 0.017 mg/L) and used for analysis described in Section 2.4. Unfiltered water samples were digested using the persulfate, autoclave method (APHA 4500–P–J), and then the digested samples were analyzed on the wet chemistry autoanalyzer for SRP and NO3-N + NO2-N following previously described methods to get TP and TN concentrations in the unfiltered samples. These measurements were used to obtain the concentrations of the three nutrient variables listed. The SRP values obtained from the filtered, acidified samples were used for the current analysis.
2.3 Calculations for nutrient uptake variables
Nutrient uptake length, a measure to study nutrient dynamics in a stream, is the distance a nutrient molecule travels in dissolved form before being taken up from the water column. It is calculated using the nutrient spiraling approach (Stream Solute Workshop, 1990). The nutrient uptake length, Sw, is derived from k, which is the uptake rate constant (m−1). A simple first-order rate equation was used to determine the length (m) a nutrient travels in the water column because the proportion of added nutrients generally decreases exponentially with distance and is expressed as follows:
where Cx is the diluted corrected concentration at each of the sampling locations, x is the distance downstream from the injection point, Co is the diluted corrected concentration at the most upstream sampling location below the injection point, and k is the uptake rate constant that is determined as the slope of a line representing the proportion of nutrients remaining in the water column versus distance downstream (Stream Solute Workshop, 1990). Sw is calculated as the inverse of k for each injection as follows:
Sw is corrected to the average of the background nutrient and tracer concentrations and the change in nutrient concentration with distance downstream. Variations in hydrological properties such as stream discharge affect the retention efficiency of a stream, which impacts Sw. When velocity is considered with Sw, the uptake rate coefficient, Kc (L/s), is used to account for such variation (Stream Solute Workshop, 1990). The greater the Kc, the shorter the Sw, resulting in increased nutrient processing within the stream. In cases where nutrient concentrations did not decrease after applying dilution correction, these data were not included in the analysis.
The nutrient trapping efficiency (TE%), which represents the percentage of nutrients trapped within a stream reach during the nutrient injection period, is calculated by the following
where USc is the plateau-corrected upstream concentration of the nutrient and DSc is the plateau-corrected downstream concentration of the nutrient, meaning the plateau concentrations of the upstream and downstream locations are corrected by the average of all background concentration samples. The estimation of TE% can also be used as an indicator of nutrient dynamics in streams. A similar calculation method can be used to estimate the TE% of restored stream features [e.g., engineered pool] by using the data collected from the nutrient injection experiments. The water samples taken from the upstream and downstream sections of the pools in the RES reach during the plateau were collected, corrected to the background concentration of the sampling site, and used to calculate the TE% of the pools.
2.4 Statistical analysis
The same reaches, sites, and pools were repeatedly measured throughout the study, resulting in pseudoreplication within the dataset for statistical analysis. Nutrient uptake length was calculated based on Equation 1, which used α = 0.05 for a regression analysis between background corrected nutrient concentration and distance from the injection site, with the associated p-value reported for significance. Section 3.1, In-stream nutrient retention, analyzes the difference between nutrient uptake length, discharge, and water temperature using Spearman’s ρ test. Nutrient uptake lengths were compared across reaches (n = 2) using a t-test assuming unequal variances and seasons assuming equal variances. Reported statistics were determined to be significant at α = 0.05. Section 3.2, Nutrient trapping efficiency, reports the means of measured values with corresponding standard deviations to represent error and uses a regression analysis to model the relationship between TE% (dependent variable) and pool length (independent variable) in the RES reach. Section 3.3, Background water chemistry measurements, reports the means of measured values with corresponding standard deviations to represent error. It uses t-tests to measure spatial and seasonal variation for reported variables and a regression analysis to examine the relationship between background conductivity for each reach (dependent variable) and water temperature (independent variable). Section 3.4, Conductivity analysis and anomalies, reports the means of measured values with corresponding standard deviations to represent error. It uses t-tests to measure seasonal variance of URE mean conductivity, assuming equal variance, and a regression analysis to examine the relationship between background conductivity (dependent variable), water temperature (independent variable), and discharge (independent variable). Box plots were used to understand the distribution of conductivity measurements during the injection. JMP Pro version 16.0 software was used for statistical data analysis (SAS Institute, Cary, North Carolina).
3 Results
3.1 In-stream nutrient retention
SRP uptake length was reported two of six times in the RES reach and three of six times in the URE reach (Table 5). The RES reach showed shorter SRP uptake lengths and higher uptake rate and mass transfer coefficient in June (77 m), when compared to the URE reach, which showed shorter uptake lengths and higher uptake rate and mass transfer coefficient in January (32 m) and early July (253 m) injections (Table 5). Together, there was no strong correlation between the SRP uptake length and discharge for the RES and URE reaches (ρ = 0.51, p > 0.05, n = 6) nor was there a significant relationship between SRP uptake length and water temperature (ρ = 0.21, p > 0.05, n = 6) throughout the study period. The mean SRP uptake lengths of the RES (163 m) and URE (1121 m) reaches did not differ using a t-test assuming unequal variances (t = 1.38, p > 0.05, nRES = 2, nURE = 4). No seasonal variation was found between the combined SRP uptake lengths of the RES and URE reaches throughout the study, using a t-test assuming unequal variances (t = 0.64, p > 0.05, n = 3).
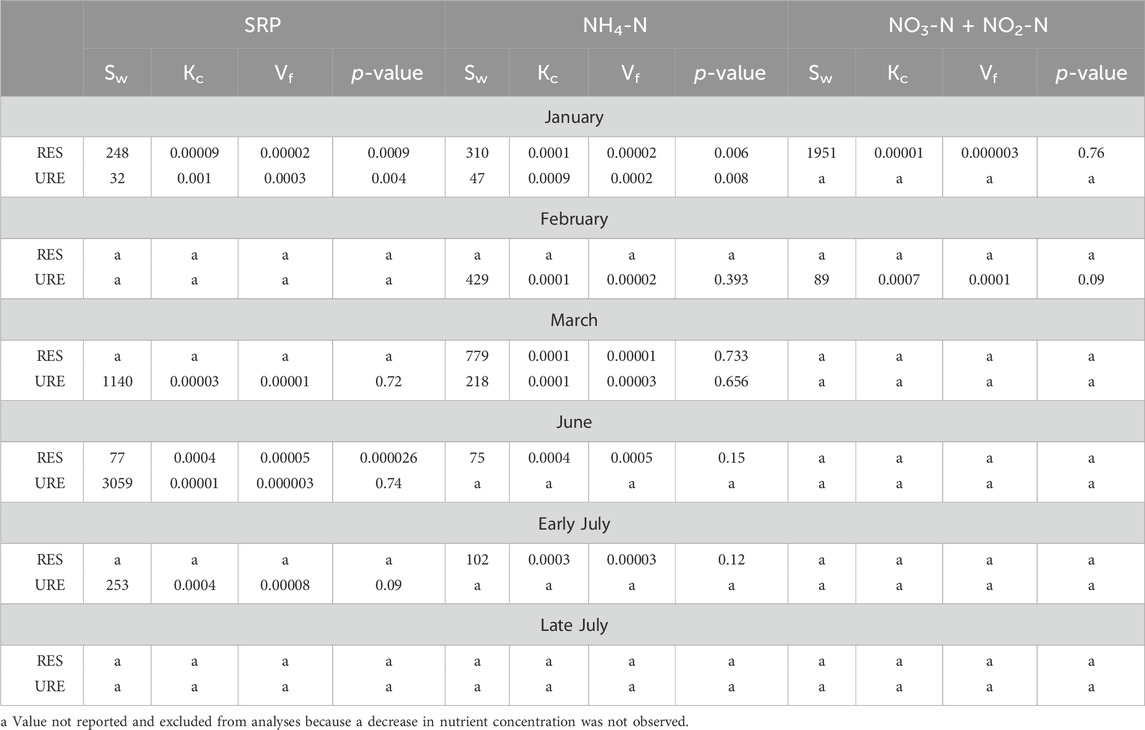
Table 5. Nutrient uptake length, Sw (m), across all sampling sites for select nutrients, followed by the nutrient uptake rate, Kc (1/s), mass transfer coefficient, Vf (m/s), and p-value for the uptake length of each nutrient.
The NH4-N uptake occurred more in the RES than in the URE reach. NH4-N uptake occurred four of six times within the RES reach, and it occurred three of six times in the URE reach (Table 5). The RES reach had the shortest NH4-N uptake length on two of six occasions in June (75 m), and early July (102 m) injections, while the URE reach had the shortest in January (47 m), February (429 m), and March (218 m) injections (Table 5). Together, the NH4-N uptake lengths for the RES and URE reaches did not correlate with water temperature (ρ = 1.0, p > 0.05, n = 7) throughout the study, nor was there a correlation between NH4-N uptake and discharge (ρ = 0.57, p > 0.05, n = 7).
The low number of samples limited the strength of these comparisons. Sample sizes were limited because results were excluded where a decrease in nutrients was not observed (Table 5) due to illicit pollutant discharge on the planned experimental date. The shortest NH4-N uptake length at the URE reach in January (47 m) may reflect premature sampling (before the plateau was observed).
The mean NH4-N uptake lengths between the RES (317 m) and URE (231 m) reaches had no statistical difference using a t-test assuming unequal variances (t = 0.84, p > 0.05, nRES = 3, nURE = 4). When the NH4-N uptake lengths were combined from the RES and URE reaches for each season, the winter NH4-N uptake lengths were longer than the summer, but the difference was not statistically significant using a t-test assuming unequal variances (t = 2.17, p > 0.05, nwinter = 5, nsummer = 2).
There were only two instances of NO3-N + NO2-N uptake with subsequent uptake rate and mass transfer coefficients calculations in January (1,951 m) in the RES reach and February (89 m) in the URE reach (Table 5). The Spearman’s ρ test could not be used to assess the relationship between nutrient uptake length, discharge, and water temperature, and a t-test could not be used to differentiate nutrient uptake length between sites and seasons, due to a lack of NO3-N + NO2-N uptake observations.
3.2 Nutrient trapping efficiency
There were two occasions of whole-stream TE% of SRP in the RES (34%
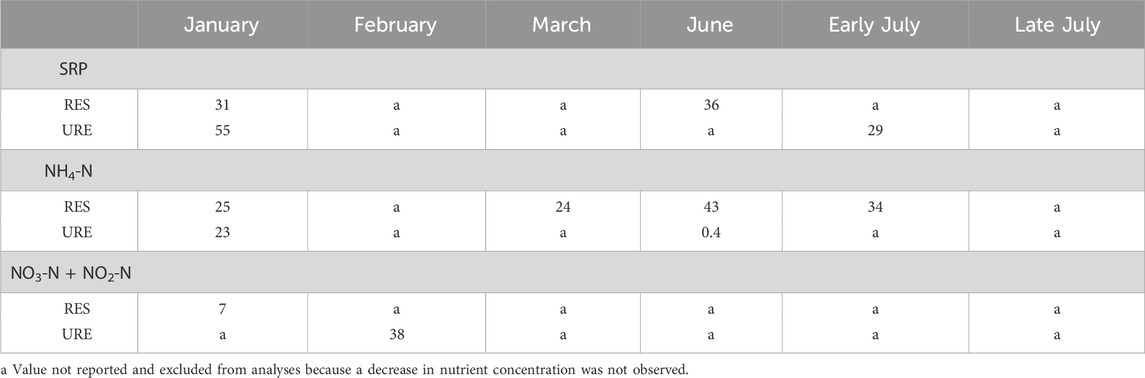
Table 6. Whole-stream trapping efficiency (TE%) of plateau soluble reactive phosphorus (SRP), ammonia (NH4), and nitrate plus nitrite nitrogen (NO3-N + NO2-N) concentrations at each site in restored (RES) and unrestored (URE) reaches of Richland Creek during injections.
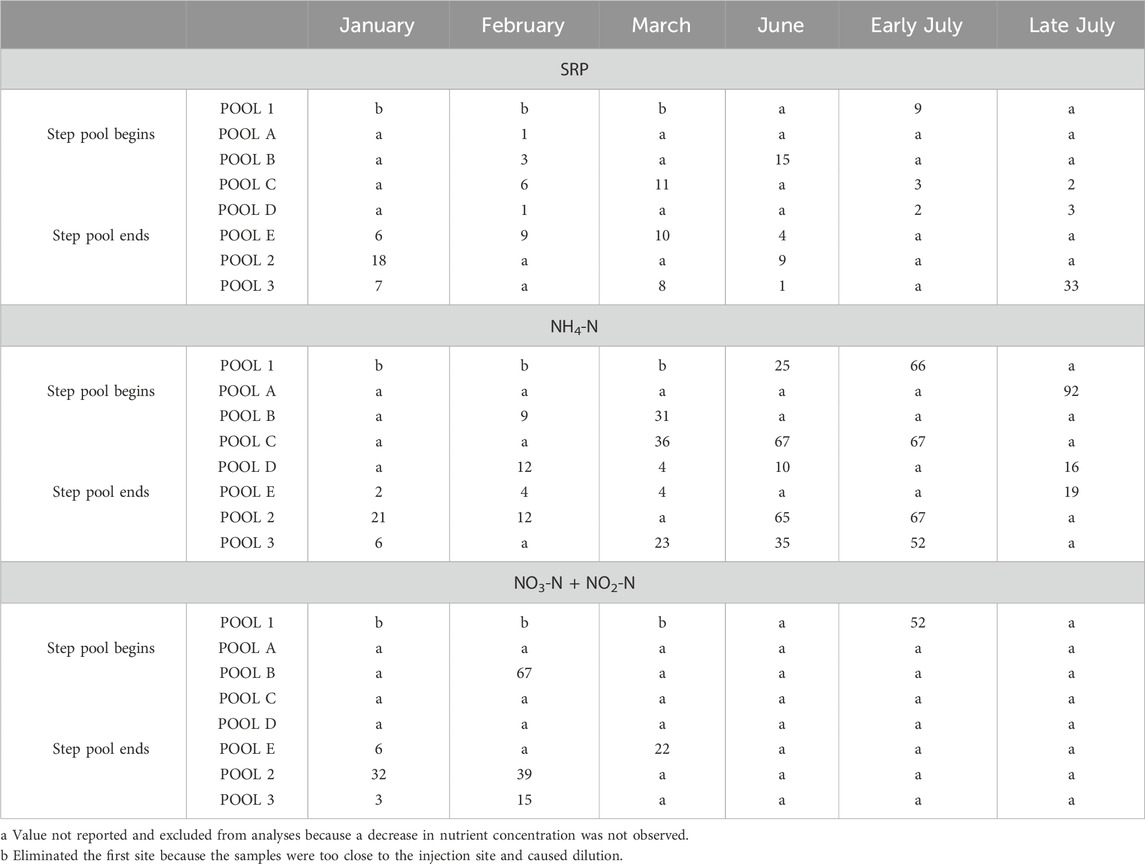
Table 7. Trapping efficiency (TE%) in pools for the RES reach during injections.
Trapping efficiency and pool length (i.e., the longitudinal distance of the pool) were compared to determine if a higher trapping efficiency could be associated with a longer pool length. The step pool and constructed pools in the RES reach showed a positive exponential response and a significant relationship between the TE% of SRP and pool length (r = 0.44, p < 0.05, n = 21), while no relationship existed between the TE% of NH4-N (r = 0.14, p > 0.05, n = 24) throughout both the winter and summer seasons (Figures 3A, B). The TE% of NO3-N + NO2-N also showed no relationship with pool length (r = 0.20, p > 0.05, n = 8) (Figure 3C). When considering all the pools in the RES reach, the highest average TE% for SRP and NH4-N was in the summer, while the highest average TE% for NO3-N + NO2-N was in the winter.
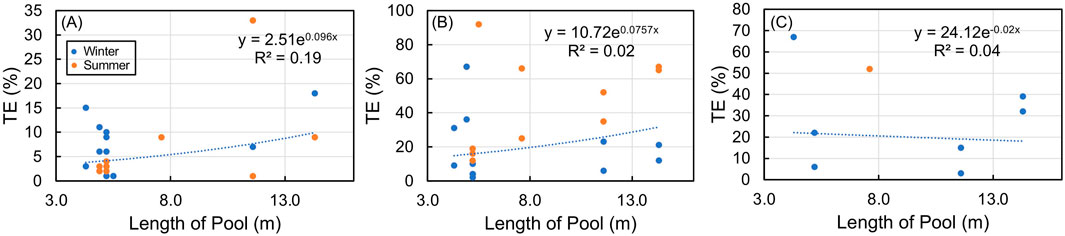
Figure 3. Whole-stream trapping efficiency (TE) in RES pools compared with each pool length for (A) soluble reactive phosphorus SRP, (B) NH4-N, and (C) NO3-N + NO2-N in the summer (orange dot) and winter (blue dot).
3.3 Background water chemistry measurements
As expected, the water temperature increased from winter (average = 13
Monthly averages of F, SO4, and Cl in both sites did not exceed the EPA National Secondary Drinking Water Regulations (NSDWRs) recommendations (F: 2.0 mg/L, SO4 and Cl: 250 mg/L) (Table 8) (Environmental Protection Agency, 2022a). Spatial differences in background concentration of NH4-N were not observed between the RES and URE reaches (Table 8). The average background concentration of NH4-N varied temporally for the RES (t = 6.41, p < 0.05, n = 3) and URE (t = 3.36, p < 0.05, n = 3) reaches, with the lowest concentrations occurring in the winter months in the RES (0.027
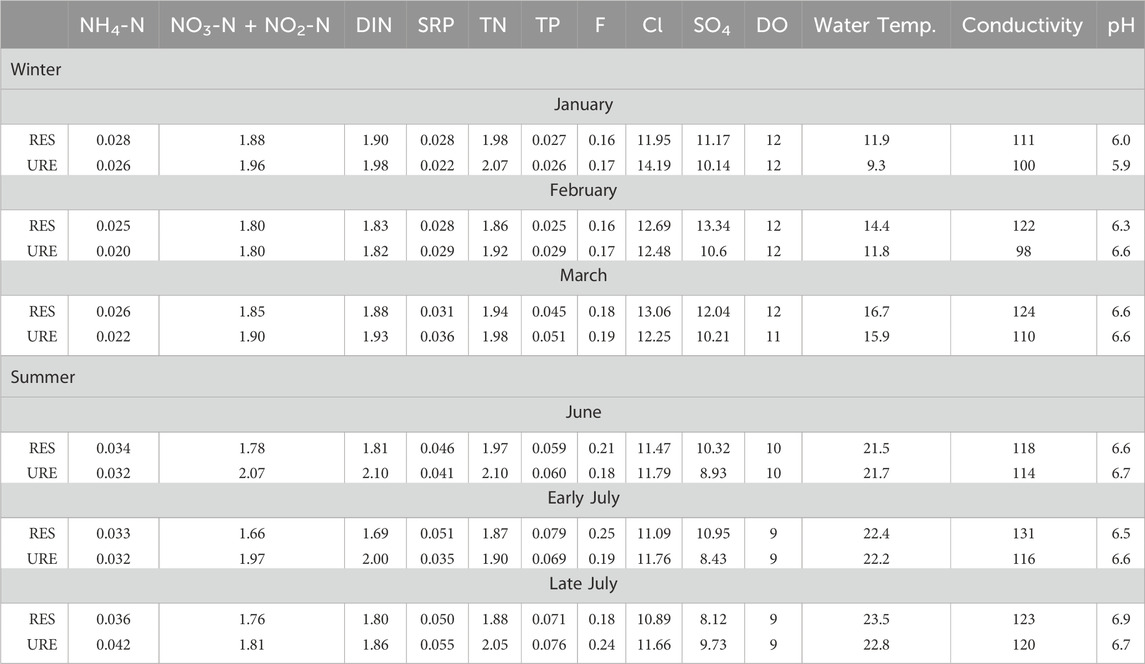
Table 8. Event average of background water chemistry characteristics of restored (RES) and unrestored (URE) reaches of Richland Creek. Parameters include NH4-N, NO3-N + NO2-N, DIN, SRP, TN, TP, F, Cl, SO4, and DO in mg/L, water temperature (°C), conductivity (μS/cm), and pH.
TP concentration did not vary between the RES and URE reaches (t = 0.07, p > 0.05, n = 6) but did vary by season (both reaches reported t = 2.13, p < 0.05, n = 3), with higher background TP concentration in the RES reach in the summer (0.07
3.4 Conductivity analysis and anomalies
Conductivity readings in the RES reach took approximately 42 min (
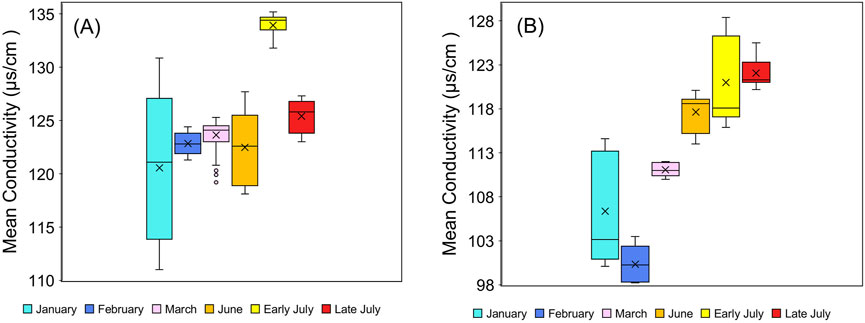
Figure 4. Boxplot of stream conductivity at (A) RES and (B) URE reaches of Richland Creek in the winter and summer seasons. The box plot shows conductivity between the upper and lower quantiles for monthly experiments. The line in the box represents the median of conductivity. The error bars show the maximum and minimum non-outliers of conductivity.
Once samples were collected after the EC plateaued, the injection was terminated, and, in general, the conductivity levels gradually returned to the initial background levels. While conductivity measurement returned to background readings during the winter experiments in the RES and URE reaches (Figure 5), conductivity behaved differently for the RES and URE reaches in the summer season (Figure 5). The conductivity measurements began to rise after terminating the injection in the RES and URE reaches in the summer months (Figure 5). In late July, the RES reach had a gradual rise (slope = 0.012) in conductivity after presumed plateau of 125 μS/cm, which reached a final conductivity of 127 μS/cm; the URE reach had a steeper rise in conductivity (slope = 0.27) after reaching a plateau of 121 μS/cm, which reached a final background conductivity of 125 μS/cm after the injection was terminated. Normally, conductivity should have returned to initial readings.
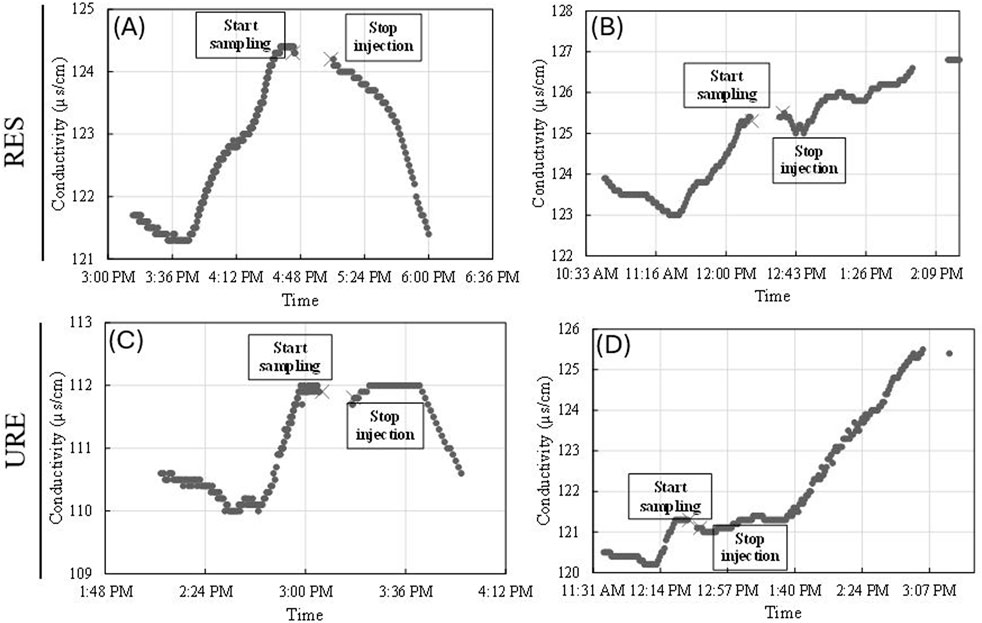
Figure 5. Conductivity curves representing (A) restored February injection, (B) restored late July injection, (C) unrestored March injection, and (D) unrestored late July injection.
4 Discussion
4.1 In-stream nutrient retention
The SRP uptake in the RES and URE reaches was responsive during some of the sampled months, even though these sites consisted of predominantly gravel material. The lack of fine sediment due to rip rap in the RES reach and bedrock in the URE reach affects P cycling and reduces the amount of P sorption possible in the stream. More than 70% of the stream sediment at both sites was gravel, while less than 30% was sand. Restoration efforts typically focus on the removal of fine sediments from the natural gravel substrate (Morgan et al., 2019). The predominant small cobble and gravel bed in the RES and URE reaches may have resulted in fewer observations of SRP uptake. The lack of reported nutrient uptake lengths among the 12 experiments was possibly due to either significantly higher background nutrient concentration, likely from additional inputs from urban land use or not injecting a sufficiently high injection concentration of nutrients compared to the background concentration during the injection experiment (Table 5, explained under “a”). The RES reach maintained the shortest SRP uptake length in June; this could be attributed to higher rates of primary production during periods of higher light availability that exert a higher demand for P (Mulholland, 2004). The URE reach may have had the shortest SRP uptake in January because the TN:TP ratio was the highest (79:1, Table 4) in this sampled month, and therefore, the system was presumed to be phosphorus-limited with P in demand. The SRP uptake lengths in the RES reach were within the same range as five low-order restored urban streams in the Piedmont region of North Carolina (McMillan et al., 2014). Other streams had similar SRP uptake length; however, they were in low-order agricultural systems with a mixture of forest and pasture land uses (Marti and Sabater, 1996; Haggard et al., 2001; Chaubey et al., 2007).
Variation in discharge, previous rainfall events, weather conditions, and export of nutrients from the watershed could all assist in the complex interaction of nutrient availability in the water column and may influence the differences in NH4-N uptake lengths for each site. The NH4-N uptake in the RES reach was marked on more occasions than in the URE reach (Table 5), likely due to increased travel time attributable to transient storage and pools over the stream length. NH4-N uptake may have been limited in the URE reach due to a lack of transient storage area, stream channelization, or disconnection to in-channel and riparian vegetation, all of which likely contribute to a decline in NH4-N retention in small drainage streams (Bukaveckas, 2007; Le et al., 2018). These uptake lengths were within the range of other reported NH4-N uptake length values in agricultural systems [e.g., forested and pasture land use] (Haggard et al., 2001; Simon and Benfield, 2002; Chaubey et al., 2007).
NO3-N + NO2-N was the dominant form of nitrogen for both sites (Table 5) and contributed to the high TN:TP ratio in the winter season (Table 2). When considering this high ratio, nitrogen was not limited during the winter sampling period. The discharge was high in January, which may have contributed to the detectable transport of this nutrient. A shorter uptake length is expected in this relatively slow-moving urban stream because other studies have documented longer nutrient uptake lengths with increasing discharge (Lautz and Siegel, 2007; Valett et al., 1996). However, the data were not consistent with expectations. Results from a previous study showed no retention of NO3-N + NO2-N and increased NO3-N + NO2-N concentration downstream of injection because of nitrification of injected NH4-N (Chaubey et al., 2007).
4.2 Nutrient trapping efficiency
The overall mean TE% for all pools for SRP and NH4-N was greater in the summer than in the winter, while the mean TE% for all pools for NO3-N + NO2-N was greater in the winter. Biotic activities are generally dominant during summer months. Pools play a crucial role in nutrient retention, with biotic activities in these areas aiding in the trapping and retention of nutrients. Higher TE% for NH4-N may have been a result of restoration efforts in the RES reach. These TE% values could potentially be used for designing stream restoration projects and for nutrient crediting in such initiatives. Future research should investigate whether pool lengths exceeding 25 m are necessary to enhance the uptake of NH4+-N and NO3−-N + NO2−-N in urban headwater streams. To the best of the authors’ knowledge, no previous studies have assessed nutrient TE% in different features within a restored site, particularly those with features like pools and step pools. The methodology and results obtained for pool length can also be applied when designing pools for restoration purposes.
4.3 Background water chemistry measurements
Observed discharges from stormwater pipes from winter to summer sampling dates in the RES reach (Table 2) may indicate that ecological processes that influence stream conductivity are less influenced by temperature. Inputs of ions through these stormwater pipes in the highly urban area of the RES and URE reaches may have impacted stream conductivity, which is a good indicator of human activity (O’Brien and Wehr, 2010; Wu et al., 2015; Köse et al., 2014). The higher background concentration of NH4-N in the summer was most likely due to increased temperatures stimulating ammonification in water along with other co-occurring ecological processes (Racchetti et al., 2011). This could also be a result of impaired water quality from nitrogen enrichment from the surrounding urban watershed (Dodds and Smith, 2016). Visual observations indicated the presence of periphyton mats in the water column and on rip rap during the summer sampling period. Bacterially mediated reactions are sensitive to seasonal changes in stream water temperature, which affect the nitrate availability in the water column. The relationship between water temperature and nitrification within stream ecosystems is a well-researched topic. Studies show that temperature has a significant positive correlation with nitrate loss, meaning higher temperatures create more denitrification reactions within a stream system (Hill, 1988; Rasmussen et al., 2011). Processes involved in nitrate loss could be a consequence of a hydrologically disconnected floodplain, a lack of riparian area, or a result of the constant stormwater pipe discharge from upstream; however, Wolf et al. (2013) found that hydrological connectivity increases nitrate inputs. Additionally, excess TN and TP loads are common in developed areas, where stormwater runoff and soil-bound phosphorus are carried off impervious surfaces (Carpenter et al., 1998), potentially impacting nutrient cycling in stream systems.
The Redfield ratio is a well-established principle in ecology that describes the stoichiometric proportion of TN to TP in aquatic ecosystems, where a ratio of 16:1 is typically observed. This ratio is central to the principle of nutrient limitation, which states that the element in shortest supply relative to demand will limit biological productivity. However, the stoichiometric proportion of TN to TP in an urban stream can be highly variable due to increased nutrient inputs from anthropogenic sources, which can lead to an alteration of the typical Redfield ratio. A P-limited system is typical for surface waters. The RES and URE reaches exceeded the biological need for nitrogen for each sampled event (Table 5). This is common for urban streams because wastewater inputs and stormwater runoff have increased the downstream N exported in streams in recent years, which has influenced N demands (Reisinger et al., 2016). The lower ratio in the summer than winter in the RES and URE reaches could be due to the utilization of nutrients due to planktonic demand. Higher temperatures create a higher biological demand for nutrients. However, there is a higher concentration of TP in the water column, yet the TN:TP ratio shows that there is a demand for phosphorus. These unparalleled relationships could reflect the complex process during the growth and decay of algae when transitioning from summer to winter seasons.
4.4 Conductivity analysis and anomalies
The RES reach took the longest time to reach a plateau during early and late July (1 h 31 min and 1 h 30 min), most likely due to the combined effects of low discharge (Table 2), less rainfall (Table 3), stream restoration features such as riffles, pools, step pools, and higher temperatures in the summer month (Table 4). Conductivity is closely related to water temperature, and during the URE sampling period, March showed higher conductivity than other winter months. This is likely because the water temperature in March was seven degrees higher than in January and four degrees higher than in February (Table 5). The summer months showed a significant increase in mean conductivity (Figure 4), likely due to higher temperatures and lower discharge rates, which concentrated salts in the water column (Hayashi et al., 2012).
Diurnal fluctuation in conductivity has been documented in small or first-order streams in connection with enhanced photosynthetic processes, salt concentration via evaporation/evapotranspiration (evaporitic enrichment), or daily discharge variations from wastewater treatment plants during daylight hours (Hayashi et al., 2012; Calles, 1982). The elevated conductivity of the studied urban stream could be explained by these studies; however, the increase in conductivity over time in summer requires further examination, including evaluation of the influence of temperature on conductivity in urban environments. Additionally, the influence of groundwater discharge is believed to be greater during the dry season (summer) in perennial river systems (Le Maitre and Colvin, 2018). The RES and URE reaches experienced the lowest average precipitation in the summer (Table 3), making this period a dry season; however, the influence of groundwater on conductivity cannot be confirmed, only hypothesized.
5 Conclusion
The RES and URE urban streams retained SRP, although their streambed was predominantly small cobble and gravel. SRP retention likely occurred because Richland Creek is a P-limited system, reflected in the TN:TP ratio, with the slow-moving waters characteristic of a first-order watershed. In general, the summer results clearly indicated greater SRP and NH4-N retention in the RES reach than in the URE reach, highlighting the effectiveness of restoration on nutrient retention. Significant retention of NO3-N + NO2-N was not observed in either the RES or the URE reaches, indicating that these sites may be a source of downstream NO3-N + NO2-N transport.
These whole-stream nutrient (e.g., SRP and NH4-N) TE% experiments revealed that this stream traps more SRP and NH4-N during the summer than winter. The RES reach was more effective than the URE reach when compared for nutrient TE%, suggesting that restoration has positive impacts on nutrient retention. The nutrient TE% in engineered pools at the RES reach indicated that SRP and NH4-N uptake were more effective in the summer. Additionally, engineered pools in the RES reach were more efficient at assimilating NH4-N than the other nutrients.
While the current study provides some guidance, initial data, and assessment of the method to quantify the effectiveness of stream restoration on nutrient dynamics, nutrient retention, whole-stream nutrient TE%, and nutrient TE% in engineered pools within streams, additional datasets in multiple restoration settings across different regions are required to make regulatory and policy recommendations. Additional research in multiple stream restoration settings [e.g., across different types and sizes] with analysis and interpretational data would be beneficial to creating such a regulatory practice. To assess the efficacy of stream restoration on nutrient dynamics, it is essential to account for the influence of periphyton, microbial activities, microhabitats, and microbiomes. The results from this study could be included when designing stream restoration features and nutrient reduction designs that could be linked to stream restoration credits. Therefore, conducting experiments during the summer, when these processes are most active, is likely to yield critical insights into their efficacy. When conducting nutrient injection studies to understand the efficacy of nutrient retention in stream restoration, it is important to ensure that the reach length adheres to the principles outlined in the Stream Solute Workshop (1990).
Data availability statement
The raw data supporting the conclusion of this article will be made available by the authors, without undue reservation. Should a manuscript be developed based on this data, the authors and the data collectors request appropriate acknowledgment and authorship.
Author contributions
EJ: Conceptualization, Data curation, Formal analysis, Investigation, Methodology, Resources, Software, Visualization, Writing – original draft, and Writing – review and editing. DS: Conceptualization, Data curation, Formal analysis, Funding acquisition, Investigation, Methodology, Project administration, Resources, Software, Supervision, Validation, Visualization, and Writing – review and editing. CS: Formal analysis, Funding acquisition, Investigation, Methodology, Resources, Software, Supervision, Validation, Visualization, and Writing – review and editing. JP: Formal analysis, Funding acquisition, Investigation, Methodology, Project administration, Resources, Supervision, and Writing – review and editing. DP: Data curation, Formal analysis, Investigation, Methodology, Resources, Software, Supervision, Validation, Visualization, and Writing – review and editing. SW: Data curation, Formal analysis, Investigation, Methodology, Resources, Software, Supervision, Validation, Visualization, and Writing – review and editing. BH: Conceptualization, Data curation, Formal analysis, Investigation, Methodology, Resources, Software, Validation, Visualization, and Writing – review and editing.
Funding
The author(s) declare that financial support was received for the research and/or publication of this article. The water quality analysis was supported by the Arkansas Water Resources Center through 104B base funding and USDA Hatch funding. Funding and support were provided by CS, JP, DP, BH, and DS.
Acknowledgments
The authors would like to express their gratitude to Mr. Paul Dow, City Engineer, City of Greenville, for granting access to the sites, designs, plans, and history of the sites. The authors would also like to thank Michael Masters, shop technician, Department of Agricultural Sciences, Clemson University, for assisting in delivering the hardware required for the project. Our appreciation also extends to Ibrahim Busari, Morolake Fatunmbi, Meredith Brock, and Collin Kane for their assistance during the fieldwork.
Conflict of interest
The authors declare that the research was conducted in the absence of any commercial or financial relationships that could be construed as a potential conflict of interest.
Generative AI statement
The author(s) declare that no Generative AI was used in the creation of this manuscript.
Publisher’s note
All claims expressed in this article are solely those of the authors and do not necessarily represent those of their affiliated organizations, or those of the publisher, the editors and the reviewers. Any product that may be evaluated in this article, or claim that may be made by its manufacturer, is not guaranteed or endorsed by the publisher.
References
Accuweather Inc (2023). Accuweather Inc. Available online at: https://www.accuweather.com/en/us/greenville/29601/weather-forecast/330681?city=greenville (Accessed April 13, 2023).
Advancing Standards Transforming Markets (2017). Standard Test Methods for Particle-Size Distribution (Gradation) of Soils Using Sieve Analysis. West Conshohocken, PA. Available online at: https://www.astm.org/d6913-04r09e01.html.
Allan, J. D. (2004). Landscapes and riverscapes: the influence of land use on stream ecosystems. Annu. Rev. Ecol. Evol. Syst. 35, 257–284. doi:10.1146/annurev.ecolsys.35.120202.110122
AWRC (2023). Water Quality Lab: Certification and Quality Assurance. Available online at: https://awrc.uada.edu/water-quality-lab/certification-and-quality-assurance/.
Beechie, T. J., Sear, D. A., Olden, J. D., Pess, G. R., Buffington, J. M., Moir, H., et al. (2010). Process-based principles for restoring river ecosystems. BioScience 60 (3), 209–222. doi:10.1525/bio.2010.60.3.7
Bernhardt, E. S., Band, L. E., Walsh, C. J., and Berke, P. E. (2008). Understanding, managing, and minimizing urban impacts on surface water nitrogen loading. Ann. N. Y. Acad. Sci. 1134 (1), 61–96. doi:10.1196/annals.1439.014
Bernhardt, E. S., Palmer, M. A., Allan, J. D., Alexander, G., Barnas, K., Brooks, S., et al. (2005). Synthesizing U.S. River restoration efforts. Science 308 (5722), 636–637. doi:10.1126/science.1109769
Blaszczak, J. R., Delesantro, J. M., Urban, D. L., Doyle, M. W., and Bernhardt, E. S. (2019). Scoured or suffocated: urban stream ecosystems oscillate between hydrologic and dissolved oxygen extremes. Limnol. Oceanogr. 64 (3), 877–894. doi:10.1002/lno.11081
Bledsoe, B. P., and Watson, C. C. (2001). Effects of urbanization on channel instability. J. Am. Water Resour. Assoc. 37 (2), 255–270. doi:10.1111/j.1752-1688.2001.tb00966.x
Brown, L. R., Cuffney, T. F., Coles, J. F., Fitzpatrick, F., McMahon, G., Steuer, J., et al. (2009). Urban streams across the USA: lessons learned from studies in 9 metropolitan areas. J. North Am. Benthol. Soc. 28 (4), 1051–1069. doi:10.1899/08-153.1
Bukaveckas, P. A. (2007). Effects of channel restoration on water velocity, transient storage, and nutrient uptake in a channelized stream. Environ. Sci. Technol. 41 (5), 1570–1576. doi:10.1021/es061618x
Calles, U. M. (1982). Diurnal variations in electrical conductivity of water in a small stream. Nord. Hydrol. 13, 157–164. doi:10.2166/nh.1982.0013
Caraco, N. F., and Cole, J. J. (1999). Human impact on nitrate export: An analysis using major world rivers. Ambio, 28 (2), 167–170. doi:10.2166/nh.1982.0013
Carpenter, S., Caraco, N., Correll, D., Howarth, R., Sharpley, A., and Smith, V. (1998). Nonpoint pollution of surface waters with phosphorus and nitrogen. Ecol. Appl. 8 (3), 559–568. doi:10.2307/2641247
Chaubey, I., Sahoo, D., Haggard, B. E., Matlock, A. D., and Costello, T. A. (2007). Nutrient retention, nutrient limitation, and sediment-nutrient interactions in a pasture-dominated stream. Am. Soc. Agric. Biol. Eng. 50 (1), 35–44. doi:10.13031/2013.22409
Cole, J. J., Peierls, B. L., Caraco, N. F., and Pace, M. L. (1993). “Nitrogen loading of rivers as a human-driven process,” in Humans as Components of Ecosystems (New York, NY: Springer), 141–157. doi:10.1007/978-1-4612-0905-8_12
Craig, L. S., Palmer, M. A., Richardson, D. C., Filoso, S., Bernhardt, E. S., Bledsoe, B. P., et al. (2008). Stream restoration strategies for reducing river nitrogen loads. Front. Ecol. Environ. 6 (10), 529–538. doi:10.1890/070080
Dodds, W. K., and Smith, V. H. (2016). Nitrogen, phosphorus, and eutrophication in streams. Inland Waters 6 (2), 155–164. doi:10.5268/IW-6.2.909
Dyer, J., Mercer, A., and Raczyński, K. (2022). Identifying spatial patterns of hydrologic drought over the southeast US using retrospective national water model simulations. Water 14 (10), 1525. doi:10.3390/w14101525
Enironmental Protection Agency (2022a). Drinking Water Regulations and Contaminants. Available online at: https://www.epa.gov/sdwa/drinking-water-regulations-and-contaminants (Accessed April 13, 2023).
Ensign, S. H., and Doyle, M. W. (2006). Nutrient spiraling in streams and river networks. J. Geophys. Res. Biogeosciences 111 (G4). doi:10.1029/2005JG000114
Environmental Protection Agency (2022b). How’s My Waterway? Informing the Conversation About Your Waters. Available online at: https://www.epa.gov/waterdata/hows-my-waterway (Accessed April 13, 2023).
Environmental Protection Agency (2023). Deposited and bedded sediment. Available online at: https://www.epa.gov/caddis/sediments (Accessed April 12, 2023).
Haggard, B. E., Stanley, E. H., and Storm, D. E. (2005). Nutrient retention in a point-source-enriched stream. J. North Am. Benthol. Soc. 24 (1), 29–47. doi:10.1899/0887-3593(2005)024<0029:NRIAPS>2.0.CO;2
Haggard, B. E., Storm, D. E., Tejral, R. D., Popova, Y. A., Keyworth, V. G., and Stanley, E. H. (2001). Stream nutrient retention in three northeastern Oklahoma agricultural catchments. Trans. ASAE 44 (3), 597–605. doi:10.13031/2013.6120
Hayashi, M., Vogt, T., Mächler, L., and Schirmer, M. (2012). Diurnal fluctuations of electrical conductivity in a pre-alpine river: effects of photosynthesis and groundwater exchange. J. Hydrology 450–451, 93–104. doi:10.1016/j.jhydrol.2012.05.020
Hill, A. R. (1988). Factors influencing nitrate depletion in a rural stream. Hydrobiologia 160, 111–122. doi:10.1007/BF00015474
Howarth, R. W., Billen, G., Swaney, D., Townsend, A., Jaworski, N., Lajtha, K., et al. (1996). “Regional nitrogen budgets and riverine N andamp; P fluxes for the drainages to the North Atlantic Ocean: natural and human influences,” in Nitrogen Cycling in the North Atlantic Ocean and its Watersheds (Netherlands: Springer), 75–139. doi:10.1007/978-94-009-1776-7_3
Jordan, E. (2023). Nutrient dynamics in restored and unrestored urban streams: a study in the Southern Piedmont Ecoregion of South Carolina. Master’s thesis. South Carolina, SC: Clemson University.
Kaushal, S. S., Duan, S., Doody, T. R., Haq, S., Smith, R. M., Newcomer, J., et al. (2017). Human-accelerated weathering increases salinization, major ions, and alkalinization in fresh water across land use. Appl. Geochem. 83, 121–135. doi:10.1016/j.apgeochem.2017.02.006
Klocker, C. A., Kaushal, S. S., Groffman, P. M., Mayer, P. M., and Morgan, R. P. (2009). Nitrogen uptake and denitrification in restored and unrestored streams in urban Maryland, USA. Aquat. Sci. 71 (4), 411–424. doi:10.1007/s00027-009-0118-y
Köse, E., Tokatli, C., and Çiçek, A. (2014). Monitoring stream water quality: a statistical evaluation. Pol. J. Environ. Stud. 23 (5), 1637–1647.
Kriech, A. J., and Osborn, L. V. (2022). Review of the impact of stormwater and leaching from pavements on the environment. J. Environ. Manag. 319, 115687. doi:10.1016/j.jenvman.2022.115687
Lammers, R. W., and Bledsoe, B. P. (2017). What role does stream restoration play in nutrient management? Crit. Rev. Environ. Sci. Technol. 47 (6), 335–371. doi:10.1080/10643389.2017.1318618
Lautz, L. K., and Siegel, D. I. (2007). The effect of transient storage on nitrate uptake lengths in streams: an inter-site comparison. Hydrol. Process. 21 (26), 3533–3548. doi:10.1002/hyp.6569
Le, A., Kasahara, T., and Vudhivanich, V. (2018). Seasonal variation and retention of ammonium in small agricultural streams in Central Thailand. Environments 5 (7), 78. doi:10.3390/environments5070078
le Maitre, D. C., and Colvin, C. A. (2018). Assessment of the contribution of groundwater discharges to rivers using monthly flow statistics and flow seasonality. Water SA 34 (5), 549. doi:10.4314/wsa.v34i5.180652
Liao, H., Sarver, E., and Krometis, L.-A. H. (2018). Interactive effects of water quality, physical habitat, and watershed anthropogenic activities on stream ecosystem health. Water Res. 130, 69–78. doi:10.1016/j.watres.2017.11.065
Lundquist, J. D., and Cayan, D. R. (2002). Seasonal and spatial patterns in diurnal cycles in streamflow in the western United States. J. Hydrometeorol. 3 (5), 591–603. doi:10.1175/1525-7541(2002)003<0591:SASPID>2.0.CO;2
Manning, D. W. P., Rosemond, A. D., Benstead, J. P., Bumpers, P. M., and Kominoski, J. S. (2020). Transport of N and P in U.S. streams and rivers differs with land use and between dissolved and particulate forms. Ecol. Appl. 30 (6), e02130. doi:10.1002/eap.2130
Marsh-McBirney Inc (1990). Flow-Mate 200. Available online at: https://www.fieldenvironmental.com/assets/files/Manuals/Marsh%20McBirney%20Flo-Mate%20Manual.pdf (Accessed December 3, 2021).
Marti, E., and Sabater, F. (1996). High variability in temporal and spatial nutrient retention in Mediterranean streams. Ecology 77 (3), 854–869. doi:10.2307/2265506
McMillan, S. K., Tuttle, A. K., Jennings, G. D., and Gardner, A. (2014). Influence of restoration age and riparian vegetation on reach-scale nutrient retention in restored urban streams. JAWRA J. Am. Water Resour. Assoc. 50 (3), 626–638. doi:10.1111/jawr.12205
Meyer, J. L., McDowell, W. H., Bott, T. L., Elwood, J. W., Ishizaki, C., Melack, J. M., et al. (2019). Elemental dynamics in streams. Journal of the North American Benthological Society. 7 (4), 410–432.
Miserendino, M. L., Casaux, R., Archangelsky, M., Di Prinzio, C. Y., Brand, C., and Kutschker, A. M. (2011). Assessing land-use effects on water quality, in-stream habitat, riparian ecosystems and biodiversity in Patagonian northwest streams. Sci. Total Environ. 409, 612–624. doi:10.1016/j.scitotenv.2010.10.034
Morgan, J. A., Royer, T. V., and White, J. R. (2019). Fine sediment removal influences biogeochemical processes in a gravel-bottomed stream. Environ. Manag. 64 (3), 258–271. doi:10.1007/s00267-019-01187-2
Mulholland, P. J. (2004). The importance of in-stream uptake for regulating stream concentrations and outputs of N and P from a forested watershed: evidence from long-term chemistry records for Walker Branch Watershed. Biogeochemistry 70 (3), 403–426. doi:10.1007/s10533-004-0364-y
National Oceanic and Atmospheric Administration (2020). U.S. Climate Normals Quick Access. Available online at: https://www.ncei.noaa.gov/access/us-climate-normals/#dataset=normals-annualseasonalandtimeframe=30andlocation=SCandstation=USC00383735 (Accessed April 13, 2023).
Newbold, J. D., Elwood, J. W., O’Neill, R. V., and Sheldon, A. L. (1983). Phosphorus dynamics in a woodland stream ecosystem: a study of nutrient spiralling. Ecology 64 (5), 1249–1265. doi:10.2307/1937833
Newcomer Johnson, T., Kaushal, S., Mayer, P., Smith, R., and Sivirichi, G. (2016). Nutrient retention in restored streams and rivers: a global review and synthesis. Water 8 (4), 116. doi:10.3390/w8040116
Nina, F. C., and Jonathan, J. C. (1999). Human impact on nitrate export: an analysis using major world rivers. AMBIO 28 (2), 167–170.
O’Brien, P. J., and Wehr, J. D. (2010). Periphyton biomass and ecological stoichiometry in streams within an urban to rural land-use gradient. Hydrobiologia 657 (1), 89–105. doi:10.1007/s10750-009-9984-5
Palmer, M. A., Hondula, K. L., and Koch, B. J. (2014). Ecological restoration of streams and rivers: shifting strategies and shifting goals. Annu. Rev. Ecol. Evol. Syst. 45 (1), 247–269. doi:10.1146/annurev-ecolsys-120213-091935
Paul, M. J., and Meyer, J. L. (2001). Streams in the urban landscape. Annu. Rev. Ecol. Syst. 32 (1), 333–365. doi:10.1146/annurev.ecolsys.32.081501.114040
Racchetti, E., Bartoli, M., Soana, E., Longhi, D., Christian, R. R., Pinardi, M., et al. (2011). Influence of hydrological connectivity of riverine wetlands on nitrogen removal via denitrification. Biogeochemistry 103 (1–3), 335–354. doi:10.1007/s10533-010-9477-7
Rasmussen, J. J., Baattrup-Pedersen, A., Riis, T., and Friberg, N. (2011). Stream ecosystem properties and processes along a temperature gradient. Aquat. Ecol. 45, 231–242. doi:10.1007/s10452-010-9349-1
Reisinger, A. J., Groffman, P. M., and Rosi-Marshall, E. J. (2016). Nitrogen-cycling process rates across urban ecosystems. FEMS Microbiol. Ecol. 92 (12), fiw198. doi:10.1093/femsec/fiw198
Roberts, B. J., Mulholland, P. J., and Houser, J. N. (2007). Effects of upland disturbance and instream restoration on hydrodynamics and ammonium uptake in headwater streams. J. N. Am. Benthol. Soc. 1 (26), 38–53. doi:10.1899/0887-3593(2007)26[38:eoudai]2.0.co;2
Rosgen, D. L. (2007). “Rosgen geomorphic channel design,”in National Engineering Handbook Part 654 (210-VINEH). Editors J. Bernard, J. F. Fripp, and K. R. Robinson (Washington, D.C.: United States Department of Agriculture, Natural Resources Conservation Service), Chap. 11, 1–76.
Russell, K. L., Vietz, G. J., and Fletcher, T. D. (2020). How urban stormwater regimes drive geomorphic degradation of receiving streams. Prog. Phys. Geogr. Earth Environ. 44 (5), 746–778. doi:10.1177/0309133319893927
Sanchez, G. M., Terando, A., Smith, J. W., García, A. M., Wagner, C. R., and Meentemeyer, R. K. (2020). Forecasting water demand across a rapidly urbanizing region. Sci. Total Environ. 730, 139050. doi:10.1016/j.scitotenv.2020.139050
Simon, S. K., and Benfield, E. F. (2002). Ammonium retention and whole-stream metabolism in cave streams. Hydrobiologia 482, 31–39. doi:10.1023/a:1021257822591
Stranko, S. A., Hilderbrand, R. H., and Palmer, M. A. (2012). Comparing the fish and benthic macroinvertebrate diversity of restored urban streams to reference streams. Restor. Ecol. 20 (6), 747–755. doi:10.1111/j.1526-100X.2011.00824.x
Stream Solute Workshop (1990). Concepts and methods for assessing solute dynamics in stream ecosystems. J. North Am. Benthol. Soc. 9 (2), 95–119. doi:10.2307/1467445
Thompson, J., Pelc, C. E., Brogan, W. R., and Jordan, T. E. (2018). The multiscale effects of stream restoration on water quality. Ecol. Eng. 124, 7–18. doi:10.1016/j.ecoleng.2018.09.016
Tranmer, A. W., Caamaño, D., and Arteaga, A. E. (2022). Urban stream syndrome: quantifying topographic variation along an urban-rural gradient. J. Environ. Manag. 317, 115413. doi:10.1016/j.jenvman.2022.115413
Turnipseed, P., and Sauer, V. (2010). Discharge Measurements at Gaging Stations: U.S. Geological Survey Techniques and Methods book 3. United States Geological Survey (Reston, Virginia: USGS). Available online at: https://pubs.usgs.gov/tm/tm3-a8/tm3a8.pdf.
United States Geological Survey (2019). NLCD 2019 Land Cover (CONUS). Available online at: https://www.mrlc.gov/data/nlcd-2019-land-cover-conus (Accessed December 10, 2021).
Valett, H. M., Morrice, J. A., Dahm, C. N., and Campana, M. E. (1996). Parent lithology, surface-groundwater exchange, and nitrate retention in headwater streams. Limnol. Oceanogr. 41 (2), 333–345. doi:10.4319/lo.1996.41.2.0333
Walsh, C. J., Roy, A. H., Feminella, J. W., Cottingham, P. D., Groffman, P. M., and Morgan, R. P. (2005). The urban stream syndrome: current knowledge and the search for a cure. J. North Am. Benthol. Soc. 24 (3), 706–723. doi:10.1899/04-028.1
Williams, M. R., Bhatt, G., Filoso, S., and Yactayo, G. (2017). Stream restoration performance and its contribution to the chesapeake bay TMDL: challenges posed by climate change in urban areas. Estuaries Coasts 40 (5), 1227–1246. doi:10.1007/s12237-017-0226-1
Williams, M. R., and Filoso, S. (2023). Changes in hydrology and pollutant loads from stream restoration in an urban headwater catchment. J. Hydrology 618, 129164. doi:10.1016/j.jhydrol.2023.129164
Wolf, K. L., Noe, G. B., and Ahn, C. (2013). Hydrologic connectivity to streams increases nitrogen and phosphorus inputs and cycling in soils of created and natural floodplain wetlands. J. Environ. Qual. 42 (4), 1245–1255. doi:10.2134/jeq2012.0466
Wolman, M. G. (1967). A cycle of sedimentation and erosion in urban river channels. Geogr. Ann. Ser. A, Phys. Geogr. 49 (2–4), 385–395. doi:10.1080/04353676.1967.11879766
Wu, J., Stewart, T. W., Thompson, J. R., Kolka, R. K., and Franz, K. J. (2015). Watershed features and stream water quality: Gaining insight through path analysis in a Midwest urban landscape, U.S.A. Landsc. Urban Plan. 143, 219–229. doi:10.1016/j.landurbplan.2015.08.001
Keywords: nutrient cycling, nitrogen, phosphorus, uptake length, stream restoration, trapping efficiency
Citation: Jordan EN, Sahoo D, Sawyer CB, Pike JW, Park DM, White SA and Haggard BE (2025) Nutrient dynamics in restored and unrestored urban streams in the Piedmont ecoregion of South Carolina. Front. Environ. Sci. 13:1549218. doi: 10.3389/fenvs.2025.1549218
Received: 20 December 2024; Accepted: 28 April 2025;
Published: 17 June 2025.
Edited by:
Jana Levison, University of Guelph, CanadaReviewed by:
Pradeep Goel, Ontario Ministry of the Environment and Climate Change, CanadaPeter Smiley, Agricultural Research Service (USDA), United States
Copyright © 2025 Jordan, Sahoo, Sawyer, Pike, Park, White and Haggard. This is an open-access article distributed under the terms of the Creative Commons Attribution License (CC BY). The use, distribution or reproduction in other forums is permitted, provided the original author(s) and the copyright owner(s) are credited and that the original publication in this journal is cited, in accordance with accepted academic practice. No use, distribution or reproduction is permitted which does not comply with these terms.
*Correspondence: Debabrata Sahoo, ZHNhaG9vQGNsZW1zb24uZWR1