 Zhimin Song
 Maryam Khaksari2
 Erik A. Lilleskov
 Evan S. Kane
 Paul V. Doskey
- 1Department of Civil, Environmental, and Geospatial Engineering, Michigan Technological University, Houghton, MI, United States
- 2Department of Chemistry, Michigan Technological University, Houghton, MI, United States
- 3USDA Forest Service, Northern Research Station, Houghton, MI, United States
- 4College of Forest Resources and Environmental Science, Michigan Technological University, Houghton, MI, United States
- 5Atmospheric Sciences Program, Michigan Technological University, Houghton, MI, United States
Climate change may transform peatlands from net carbon (C) sinks to C sources, which could result in a positive feedback to global warming. Warmer temperatures might lower water tables, increase the abundance of shrubs, slow Sphagnum and sedge growth and further accelerate the decomposition of dissolved organic matter (DOM) with a concomitant release of C from the surface. Studies in which vascular plant functional groups (PFGs) in peatlands have been manipulated to mimic the potential effects of a warming climate on DOM are scarce. In the subject study, seasonal effects of PFGs on the molecular composition of DOM of peat porewater were investigated in manipulated plots of a poor fen in Nestoria, Michigan, United States. The organic molecular composition of the peat porewater exhibited strong interactions with PFG and season. Monomeric substances (e.g., monosaccharides and amino acids), which are found in root exudates and are also the products of decomposition of polymeric substances, were least abundant early in the growing season and increased in abundance late in the season. High levels of DOC and proteinaceous substances and an unlikely abundance of total phenolic substances in sedge plots with Sphagnum were attributed (1) to rapid decomposition of labile compounds in the oxygen-rich microenvironment surrounding sedge roots and preservation of more recalcitrant substances or (2) to contributions of lignin-like substances by Sphagnum. Tannin- and lignin-like compounds in the Ericaceae plots with Sphagnum were attributed to inputs of the woody biomass. The refractory organic substances apparently persisted due to a combination of rhizosphere anoxia and suppression of free-living saprotroph activity by the Ericoid mycorrhizal fungi. Through a novel analytic approach, which included organic compound class analysis, determination of spectral indices, and molecular analysis by ESI-UHR-MS, we observed indirect evidence of the complexation of proteinaceous substances by tannin-like substances and the apparent reaction of phenolic moieties of lignin-like substances with amino sugars. A synergistic effect between sedge and Ericaceae was likely responsible for rapid decomposition of DOM in plots with Sphagnum in which vascular PFGs were unmanipulated. Observing the effects of vascular PFGs on seasonal variations of the molecular composition of DOM will improve predictions of the short- and long-term storage of C in peatlands in a changing climate.
1 Introduction
Peatlands are wetland ecosystems in which the rate of production of organic matter exceeds the rate of decomposition. The carbon (C)-rich ecosystems comprise 3%–5% of the Earth’s land surface and contain approximately 30% of global soil C (Gorham, 1991; Dahl and Zoltai, 1997; Blodau, 2002; Trettin et al., 2006; Meingast et al., 2014). Recent estimates indicate total northern peat carbon stocks are 500 ± 100 Pg C (Yu et al., 2021). A large amount of stored C in peatlands is sensitive to variations in the climate system (Bridgham et al., 2008), which regulates the global C balance (Trettin et al., 2006; Tarnocai et al., 2009).
Increases in temperature and alterations of the hydrology in peatlands that are attributed to climate change may enhance organic matter (OM) decomposition rates, increase C losses as carbon dioxide (CO2) and dissolved organic carbon (DOC) (Rouse et al., 1997; Dieleman et al., 2016), and release inorganic nitrogen (N) and amino acids (AAs) (Laine et al., 2013; Scarpelli, 2016). Decomposition of OM is regulated by temperature, moisture, and aeration that affect redox potential, pH, enzyme activity (Schnecker et al., 2014; Limpens et al., 2008), and OM availability or activity. Biodegradability of OM in peatlands is important to the internal cycling of C, N, and phosphorus (P) (Tfaily et al., 2013) and is related to the composition of OM inputs. The molecular composition of OM in peatlands influences microbial activity and regulates pH, mineral diagenesis, and the mobility of heavy metals (Reddy and DeLaune, 2008; Veverica et al., 2016).
Variations in climate can drive changes in the relative abundance of plant functional groups (PFGs) in fens, which in turn can affect OM decomposition (Bragazza, 2006; Breeuwer et al., 2009; Jassey et al., 2013). Sedges, ericaceous shrubs, and Sphagnum mosses are the dominant PFGs in poor fens. Shrubs often increase in abundance as water tables fall (Munir et al., 2015) and Sphagnum growth is slowed as temperatures increase (Walker et al., 2015). Sedges thrive in wetter conditions, and thus, abundance of sedges might increase in peatlands as water tables rise. Root exudate composition and quantity, litter quality, rhizosphere molecular oxygen (O2) availability, nutrient acquisition pathways, and root symbiotic relationships are regulated by PFG type (De Deyn et al., 2008; Bridgham et al., 2008; Romanowicz et al., 2015). Sedges are perennial graminoids with deep root structures, which allow the plants to extract water and nutrients from deep zones of the peat that are unavailable to other PFGs (Steed et al., 2002; Wieder and Vitt, 2006; Albano et al., 2021). Root and leaf production by sedges occurs earlier in the growing season than the production by ericaceous shrubs (Sloan et al., 2016). Specialized structures (i.e., aerenchyma) in sedges transport O2 via diffusion from the atmosphere deep into the anoxic peat, which (1) influences the composition of microbial populations and enzyme activities (Flessa and Fischer, 1992) and (2) accelerates the decomposition of DOM. Ericaceous shrubs are shallow-rooted and lack aerenchyma. Ericoid mycorrhizal (ERM) fungi associated with the roots of Ericaceae produce a complex mixture of extracellular enzymes (EEs), including proteases, phosphatases, phenol oxidases, chitinases and cellulases (Cairney and Burke, 1998a; Cairney and Burke, 1998b). The EEs process the complex mixture of OM in peat and release nutrients for uptake by plants and the microbial population (Read et al., 2004). The phenology of peatland vegetation also alters the composition of the microbial community and leads to distinct seasonal patterns of enzyme activities that regulate decomposition of OM (Kaiser et al., 2010).
The concentration and molecular composition of dissolved OM (DOM) in peatlands vary seasonally and are controlled by the production, consumption, and transport of DOM (Singh et al., 2014). Plant litter, microbial biomass, and root exudates are typical sources of DOM (Kalbitz et al., 2000). The DOM is an important C source for microorganisms and contains organically bound nutrients such as N, P, and sulfur (S) (Marschner and Kalbitz, 2003). Nutrient and substrate availability are affected by biotic and abiotic transformations of DOM. Processes regulating the concentration of DOM include increasing OM decomposition during the warm spring and summer months, autumn leaf fall, microbial production (Buckeridge et al., 2013) and turnover (Schmidt et al., 2007), and microbial mineralization of OM. Seasonal variations in the levels and composition of DOM have been observed in a variety of ecosystems (Brooks et al., 2007; Fellman et al., 2009; O'Donnell et al., 2010; Porcal et al., 2013; Wilson et al., 2013). The most labile, protein-rich, and biodegradable DOC (BDOC) was observed during spring runoff in wetland and bog watersheds in Alaska and the lowest levels of BDOC were found in the summer months (Fellman et al., 2009). Concentrations of DOM with high aromaticity and a high degree of humification were greatest in a catchment during autumn (Catalán et al., 2013). High levels of DOM in autumn were attributed to leaf fall that supplied a fresh input of labile DOM. Kaiser et al. (2001) observed seasonal variations in the composition of DOM in forest soils from several sites. Lignin-derived phenols, carbohydrates, and amino sugars were highest in summer and autumn and neutral carbohydrates and amino sugars were dominant in winter and spring. However, seasonal variations in the molecular composition of DOM in peatland plots dominated by various PFGs have not been investigated.
Here we describe the seasonal diagenesis of DOM in a poor fen in replicated vascular PFG treatments that had been manipulated over a 6-year period to contain sedge and Ericaceae plots in a Sphagnum matrix. Porewater was collected monthly immediately after spring snowmelt into the fall season. Analyses of the bulk OM, compound classes, and molecular composition of the dissolved phase of porewater were performed using a novel combination of wet chemical techniques, ultra high performance liquid chromatography (UHPLC), spectral indices, and electrospray ionization, ultra-high resolution mass spectrometry (ESI-UHR-MS). The following hypotheses were examined in the subject investigation: (1) availability of O2 in the rhizosphere of sedge accelerates decomposition of labile DOM that is characteristic of root exudates while also promoting accumulation of recalcitrant DOM like lignin and tannin substances, (2) lignin- and tannin-like compounds, which are characteristic of woody biomass, are preserved by the anoxic conditions of the Ericaceae rhizosphere, and (3) the degree of humification of DOM increases with progression of the growing season.
2 Material and methods
2.1 Site description
The study was conducted in an extensive poor fen in Nestoria, Michigan, United States (Meingast et al., 2014). The pH of the fen porewater was ∼4. Vegetation in the peatland included sedge (Carex spp.), ericoid shrubs (Kalmia polifolia, Chamaedaphne calyculata, Rhododendron groenlandicum, Andromeda glaucophylla, Vaccinium spp.) and Sphagnum mosses (S. magellanicum, S. angustifolium, and S. fuscum). The study sites included three blocks with each block containing three plots. Blocks were separated by ∼20–40 m to minimize effects of advection of aqueous-phase substrates between plant communities. Plots were 1 m2 with a 50 cm wide similarly manipulated, buffer strip. Plant communities had been removed or left intact over a 6-year period starting in 2011 to create the following three types of plots: (1) Unmanipulated (U) – sedges, Ericaceae, and Sphagnum moss were left intact, (2) Sedge (S) – sedges and Sphagnum moss were left intact and Ericaceae were removed, and (3) Ericaceae (E) – Ericaceae and Sphagnum moss were left intact and sedges were removed.
2.2 Sample collection
Level loggers in wells constructed of perforated polyvinylchloride (PVC) pipe were used to measure the depth of the water table (Kane et al., 2014). Samples of porewater were collected from piezometers constructed from PVC pipe with Teflon inner tubes. The piezometers had 10-cm-slotted sections, which were located at depths of 0–20 cm and 20–40 cm (Romanowicz et al., 2015). Nitex nylon mesh (37 µm) was used to form a water-permeable barrier between each section and the adjacent peat.
A total of 108 porewater samples were collected for the investigation. Sampling was conducted once a month during the snow-free season from May to October in 2017 from 3 plots at two depths within three PFG blocks. Samples for analysis of oxidation-reduction potential (ORP) and pH; total soluble iron (FeT) and manganese (MnT); and total DOC (TDOC), total dissolved N (TDN) and dissolved inorganic N [nitrate (NO3−) and ammonium (NH4+)], and organic molecular species were stored in 60-mL amber vials (VWR, Radnor, PA), 15-mL polypropylene (PP) conical centrifuge tubes (VWR international, Batavia, IL), 40-mL amber volatile organic analysis (VOA) vials (Thermo Fisher Scientific, Waltham, MI), and 4-mL amber screw top vials, respectively. The amber vials and PP centrifuge tubes were cleaned with an aqueous solution of Alconox and rinsed with distilled water in preparation for sample collection. The VOA vials were combusted at 550°C, rinsed with distilled water, dried at 105°C, flushed with high-purity compressed N2 (Superior Water and Welding, Chassel, MI), and evacuated in preparation for sampling. Glass fiber filters (0.45-μm; VWR international, Batavia, IL) were cleaned before use by flushing with 10 mL of MilliQ water followed by autoclaving. All samples were filtered in the field with the exception of 2, 20-mL aliquots, which were used for analysis of ORP and pH. Samples with the exception of ORP, which was measured in the field, were placed in a cooler that was chilled with ice packs and transported to the laboratory, where they were immediately stored at 4°C.
2.3 Sample analysis
The ORP was determined in the field by injecting a 20-mL aliquot into a sealed, flow-through cell containing a Hach ORP probe (IntelliCALMTC301; Hach Company, Loveland, CO) (Romanowicz et al., 2015). The probe was calibrated with an ampoule of Light’s solution. All electrode potential (Eh) values were normalized to pH 7 (Eh 7) according to pH-Eh relationships for Quinhydrone (Bier, 2009; Walker and Bier, 2009). The pH was measured in the laboratory using an Accumet™ Model 25 pH meter (Fisher Scientific International Inc., Pittsburgh, PA). For measurements of TDOC and TDN, 20-mL aliquots were acidified to ∼ pH 2 with concentrated HCl and analyzed on a TOCV analyzer with TDN module (Shimadzu Scientific Instruments, Columbia, MD) (Hribljan et al., 2014). Nitrate and NH4+ were determined on ICS-2100 and ICS-1100 ion chromatographic systems (Thermo Scientific, Waltham, MA), respectively, which were run in parallel. Inductively coupled plasma-optical emission spectrometry (ICP-OES; PerkinElmer Optima 7000DV, PerkinElmer Corporation, Waltham, Ma) was used to measure FeT and MnT.
Total phenolics (TPHs) were analyzed by adapting a Hach method to a microplate technique (Romanowicz et al., 2015). The method measures all hydroxylated aromatic species, e.g., tannin, lignin, phenol, cresols, etc. In each microplate well, 83 µL of sample and 166 µL of MilliQ water were added to achieve a 1:3 dilution. To eliminate interference from Fe(II), 10 µL of TanniVer reagent and 20 µL of 0.1 g mL-1 sodium pyrophosphate solution were added to each microplate well. The plates were shaken for 30 s after adding 50 µL of a sodium carbonate solution (Hach Company, Loveland, CO) and after a 25-min incubation period the absorbance at 700 nm was read on a SpectraMax M2 plate reader (Molecular Devices, Sunnyvale, California). The TPHs were quantified with aqueous standards of tannic acid (J.T.Baker, Inc., Philipsburg, NJ).
Monosaccharides (MCHOs) and polysaccharides (PCHOs) were measured by the 2,4,6-tripyridyl-s-triazine (TPTZ) spectrophotometric method (Myklestad et al., 1997). For measurement of MCHOs, 0.1 mL of sample, 0.9 mL of MilliQ water, and 1 mL of potassium ferricyanide solution (0.7 mM) were mixed in a pre-combusted, screw cap test tube (Fisher Scientific International Inc., Pittsburgh, PA) using a Vortex mixer (Fisher Scientific International Inc.). The mixture was heated at 100 °C for 10 min in an incubator (Hach Company) and 1 mL of ferric chloride solution (2 mM) and 2 mL of TPTZ solution (2.5 mM) were added immediately. The sample was transferred to a 10 mm disposable cuvette after 30 min and the absorbance at 595 nm was measured with a UV-Visible spectrophotometer (Hach DR 5000, Hach Company). The MCHOs were quantified with aqueous standards of D-glucose. Total dissolved saccharides (TDCHOs) were determined by the TPTZ spectrophotometric method following hydrolysis of a 4-mL sample with 4 mL of 0.1 M HCl in a 5 mL flame-sealed, amber glass ampoule (VWR International) at 100°C for 20 h. The concentration of PCHOs was determined by subtracting the concentration of MCHOs in the sample from the TDCHOs measurement. The MCHO and PCHO concentrations were corrected for interference by Fe(II).
Proteinaceous species were determined following hydrolysis to amino acids (AAs; Keil and Kirchman, 1991). Equal volumes (0.5 mL) of sample and 12 N HCl (Fisher Scientific International Inc.) were transferred to a 2-mL amber ampoule (VWR International), which was sealed under vacuum and heated at 110 °C for 20 h. The hydrolysate was dried under vacuum in a desiccator to remove the acid, redissolved in 1 mL of MilliQ water, and filtered with a 0.2-µm cellulose acetate membrane filter (VWR International) in preparation for analysis. The AAs in the hydrolysate and the filtered porewater sample [i.e., free AAs (FAAs)] were determined by an on-line derivatization technique using an UHPLC with a fluorescence detector (Dionex Ultimate 3,000; Dionex, Sunnyvale, CA). The derivatization reagent was a mixture of 1 mL of o-phthalaldehyde (OPA) reagent (Sigma-Aldrich, St. Louis, MO) and 2 µL of 3-mercaptopropionic acid (MPA) reagent (Sigma-Aldrich). Standards and samples were mixed on-line with the derivatizing reagent prior to injection into the UHPLC. The AAs were separated by gradient elution at 2 mL min-1 through a C-18 analytical column (Zorbax Eclipse AAA, 3.5 μm, 4.6 × 150 mm; Agilent Technologies, Santa Clara, CA) using two eluents, i.e., eluent A (borate buffer, pH 7.8) and eluent B (45:45:10 by volume of acetonitrile, methanol, and water) (Dorresteijn et al., 1996; Kutlán et al., 2002; Scarpelli, 2016). The AAs were quantified with an aqueous mixed standard containing aspartate, glutamate, serine, histidine, glycine, threonine, arginine, alanine, tyrosine, valine, methionine, phenylalanine, isoleucine, leucine, lysine, proline, and cysteine. The level of FAAs in the filtered porewater sample was subtracted from the amount of AAs in the hydrolysate to obtain the concentration of proteinaceous species in the sample. Dissolved organic nitrogen (DON) species other than proteinaceous species and AAs were estimated by subtracting levels of the proteinaceous species, amino acids, and inorganic nitrogen (NO3− + NH4+) from the TDN concentration.
Molecular formulas for individual organic species composing several classes of organic compounds were determined by ESI-UHR-MS (Orbitrap Elite Hybrid Ion Trap Mass Spectrometer, Thermo Scientific). Samples were acidified to pH 2.0 with HCl and desalted by passing 10 mL through 1-mL Oasis HLB solid-phase extraction cartridges containing 30 mg of sorbent (Waters Corporation, Milford, MA). The cartridges were pre-conditioned with 1 mL of HPLC-grade methanol and 1 mL of MilliQ water. Cartridges containing sorbed analytes were rinsed with MilliQ water and dried, the species were eluted with 1 mL of methanol/water 90/10 (v/v), and the eluents were stored at 4 °C prior to analysis. Desalted samples were introduced by direct infusion at 5 μL min-1 to the ESI-UHR-MS and analyzed in negative ion mode. The heater and capillary temperatures were 80 °C and 265 °C, respectively, and the sheath and auxiliary gas flow rates were 10 arb and five arb, respectively. The spray voltage was set to 2.4 kV and broadband mass spectra were collected at 100–800 m/z at a resolution of 240,0000. An average of 100 full scans were obtained for each mass spectrum. The instrument was externally calibrated in negative ion mode with the standard negative ion calibration mixture (0.001% Alfa Aesar™ Ultramark™ 1,621, 29 μg sodium dodecyl sulfate, and 54 μg sodium taurocholate in a 10-mL solution of 50% acetonitrile/50% methanol/24% water/1% acetic acid; Thermo Scientific). Mass accuracy was greater than 3 ppm.
Sierra Analytics Composer64 Software (Sierra Analytics, Modesto, CA, United States) was used to calculate all possible molecular formulas having the empirical formula C2-200H4-400O1-40N0-3S0-1. The software calculator used the Kendrick mass analysis to differentiate homologous ion series based on the difference in CH2 increments. The de novo cutoff was set to 500 Da with a minimum abundance of 0.05%. Data were visualized using the van Krevelen diagram (Hedges, 1990; Grannas et al., 2006; Ohno et al., 2014). The y- and x-axes of a 2-dimensional van Krevelen diagram represent the hydrogen (H)/C and O/C atomic ratios in the molecular formulas, respectively. Due to the similarities of molecular formulas of various classes of organic substances, signals for the molecular formulas are found in clusters in specific regions of the van Krevelen diagram. The clusters represent several classes of organic compounds (i.e., unsaturated hydrocarbons, condensed aromatics, lipids, carbohydrates, amino sugars, proteins, tannins, and lignin) (Kim et al., 2003; Guigue et al., 2016). The nominal oxidation state of carbon (NOSC) and aromaticity index (AI) were calculated from Equation 1 (Lv et al., 2016) and Equation 2 (Guigue et al., 2016), respectively, as follows:
where C, H, N, O, and S are the number of carbon, hydrogen, nitrogen, oxygen, and sulfur atoms, respectively, in the molecular formula.
Fluorescence and absorbance spectra of the samples were also used to characterize the DOM (Coble et al., 2016; Veverica et al., 2016). Raman spectra were collected simultaneously in a 1-cm quartz cuvette using an AqualogVR (Horiba Instruments, Piscataway, NJ). The spectral data were normalized to a MilliQ water blank. Specific UV absorptivity at 254 nm (SUVA254), which is an indicator of the degree of aromaticity (Teixeira et al., 2011), was calculated by dividing the absorbance at 254 nm by the DOC concentration (mg C L-1). The index, E2/E3, which is inversely related to average molecular size (De Haan, 1972; De Haan and De Boer, 1987), is the ratio between the absorbance at 254 nm and the absorbance at 365 nm. The humification index (HIX), which is an indicator of the degree of DOM humification, is operationally defined as the area under the emission spectra from 435 to 480 nm divided by the area under the fluorescence spectra (excitation λ = 254 nm) from 300 to 345 and 435–480 nm (Hansen et al., 2016). The A/T index, which increases with the fraction of recalcitrant DOM (Hansen et al., 2016), is operationally defined as the ratio of the peak of the emission at 450 nm from the excitation at 260 nm (A) to the peak of the emission at 304 nm from the excitation at 275 nm (T).
2.4 Statistical analysis
Indices of porewater DOM quality (i.e., PCHOs, MCHOs, TPHs, proteinaceous substances, TDOC, TDN, and molecular formula data) and potential lability (i.e., SUVA254, E2/E3, HIX, and A/T) were compared among the three plot types. Variations in DOM quality and potential lability with date of the year (DOY) were investigated. Interactions of plot type and DOY with DOM quality and lability were also evaluated. Single response variable and indicator analyses were used to examine impacts of the plot type and DOY on the labile DOM and recalcitrant DOM. Multiple response variables analysis examines the significance of plot type and DOY on the molecular speciation of the DOM and the correlation between the molecular speciation of the DOM and potential lability index.
2.4.1 Single response variable analyses
To account for repeated measures, a mixed model using JMP pro 13.2.1 (SAS Institute Inc., Cary, NC) was run with the following response variables: pH, ORP, temperature, depth of the water table, MnT, FeT, TDOC, TDN, PCHOs, MCHOs, TPHs, proteinaceous substances, SUVA254, E2/E3, HIX, and A/T. The mixed model included the following fixed factors: plot type (S, E, U), sampling depth (20 cm, 40 cm), DOY of the sample collection (130, 160, 188, 216, 260, 292), all two and three-way interactions, and sampling block. Individual plot nested within the plot type was included as a random effect. Probability (p) values less than 0.05 were considered statistically significant. Significant differences were determined using Tukey’s HSD test. Porewater properties with the exception of depth of the water table and ORP were Box-Cox transformed to normalize distributions. A value of 0.01 was added to concentrations of PCHOs to eliminate zero values.
2.4.2 Multiple response variables analyses
Matrices of DOM formulas derived from mass spectra and relative abundances of the formula signal using distance-based permutation matrices’ analysis of variance (PERMANOVA) statistical models visualized with a non-metric multidimensional scaling (nMDS) technique with Bray-Cutis similarity were used to evaluate relationships between DOM molecular composition and fixed factors. Matrices were fourth-root transformed prior to application of PERMANOVA statistical models and the nMDS technique. The PERMANOVA models included plot type, sampling depth, DOY, all two- and three-way interactions, and plot nested with plot type and depth. Type II sums of squares was used for the PERMANOVA statistical models. The PERMANOVA statistical models and nMDS technique were conducted in Primer 6.1.15 (PRIMER-E, Plymouth, UK).
2.4.3 Indicator analyses
Indicator substance analysis was used to identify the molecular formulas that produced the strongest patterns in the datasets. A Monte Carlo analysis of indicator substances was used to determine the significance of observed molecular formulas of maximum indicator values that elicited responses. Indicator substances were identified from the ESI-UHR-MS intensity values of the molecular formulas for the following three scenarios (1) plot type for all the DOY, p < 0.01; (2) DOY for all the plot types, p < 0.001; and (3) plot type for specific DOY, p < 0.01. Indicator analyses were run in PC-ORD 6.20 (Gleneden Beach, Oregon).
3 Results
3.1 Physical and chemical properties
The temperature and the depth of the water table varied significantly with DOY during the field experiment (p < 0.0001). The depth of water table was lowest in August on DOY 216 (Figure 1a) when the highest mean temperature for all plot types and depths was also observed (Figure 1b). Temperatures were generally higher from May to August than those observed in September and October. Mean temperatures at depth for all plot types were higher at 20 cm than at 40 cm (p = 0.0067) (Supplementary Figure S1a). Effects of depth, DOY, and plot type × DOY interactions on pH were significant (p < 0.0001, p < 0.0001, and p = 0.0103, respectively, Supplementary Table S1). Mean pH values for all plots and depths were ∼4 and slightly lower at a depth of 40 cm (Supplementary Figure S1b). Maxima in pH values occurred on DOY 160 and DOY 188 when the mean pH values for all plots and depths were 4.2–4.3 (S1c). Sedge plots exhibited slightly lower values of pH throughout the growing season. Values of ORP were significantly affected by plot type × DOY interactions (p = 0.0473) (Figure 1c; Supplementary Table S1). The sedge plots exhibited higher ORP values than the ORP values in Ericaceae plots. The highest ORP values on most DOY were recorded for the unmanipulated plots (Figure 1c).
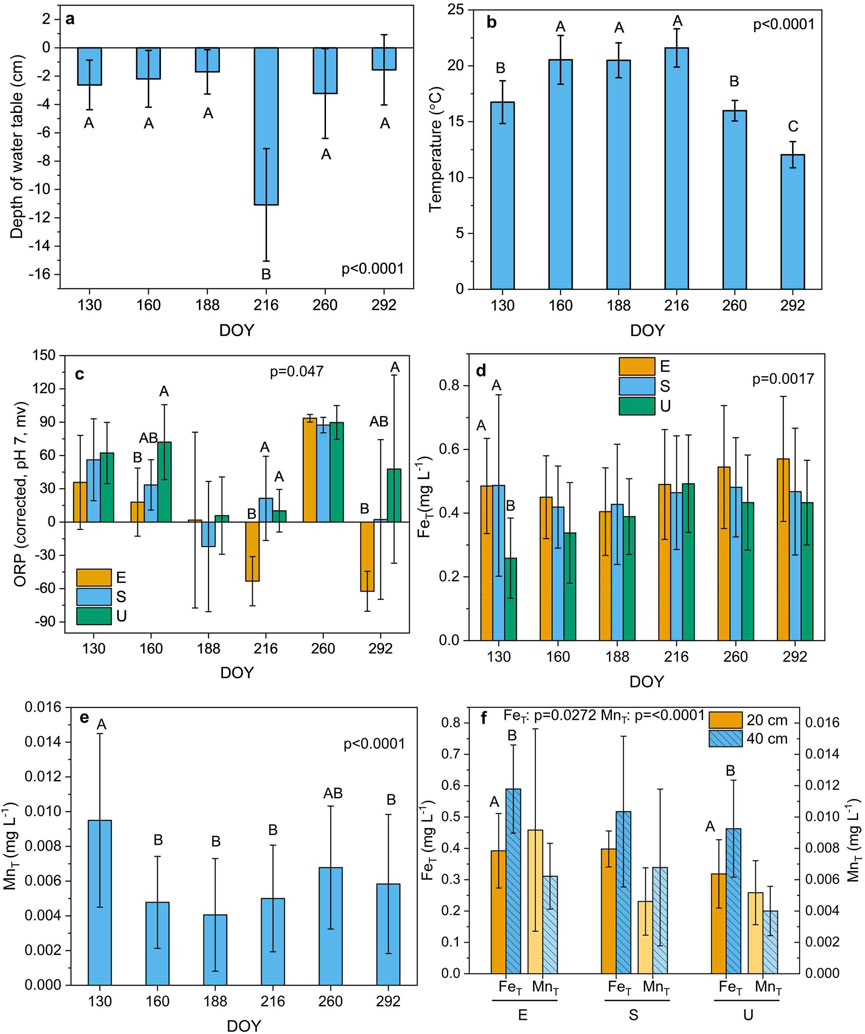
Figure 1. Seasonal variation of the depth of the water table (a), temperature (b), oxidation-reduction potential (ORP) and the concentration of total dissolved Fe [with plot type (E; Ericaceae, S; Sedge, U; Unmanipulated) interaction] (c, d), respectively, total dissolved Mn (e), and the levels of total dissolved Fe and Mn (with interaction between plot type and depth) (f). [The data are presented as the mean ± standard deviation. Different letters above bars denote significant differences with day of year (DOY) (a, b, e), plot type (c, d), and depth (f) (Tukey’s HSD test between subjects) (n = 108 samples)].
Effects of depth and plot type × DOY interactions on the concentration of FeT were significant (p < 0.0017 and p = 0.0.0017, respectively, Supplementary Table S1). Concentrations of FeT and MnT were significantly affected by plot type × depth interactions (p = 0.0272 and p < 0.0001, respectively, Supplementary Table S1) and DOY (p = 0.0002 and p < 0.0001, respectively, Supplementary Table S1). Levels of MnT in porewater were higher and levels of FeT were slightly higher in the Ericaceae plots than concentrations in the sedge plots and unmanipulated plots, which in general exhibited the lowest levels of FeT and MnT (Figures 1d, e). Levels of FeT were highest at a depth of 40 cm for all plot types (Figure 1f). Unmanipulated and Ericaceae plots exhibited higher MnT concentrations at depths of 20 cm than the levels at depths of 40 cm.
3.2 Composition of dissolved organic matter by compound class and spectral characteristics
Levels of TDOC and TDN were significantly affected by plot type, depth, DOY, and sampling location and by plot type × DOY interactions (Supplementary Table S1). Plot type × depth interactions also affected TDOC concentrations (Supplementary Table S1). Concentrations of TDOC in porewater generally increased from DOY 130 (May) to DOY 292 (October) with the highest levels occurring on DOY 260 (September) (Figure 2a). Levels of TDN in porewater increased during the growing season, attaining a maximum in October (Figure 2b). Unmanipulated plots exhibited the lowest TDOC and TDN concentrations during the field experiment (p < 0.05, Figures 2a, b). Concentrations of TDOC and TDN in sedge plots were higher than the levels in Ericaceae plots (p < 0.05, Figures 2a, b). Levels of TDOC and TDN were highest at a depth of 40 cm in all plot types (p < 0.05, Figure 2c; Supplementary Figure S1a).
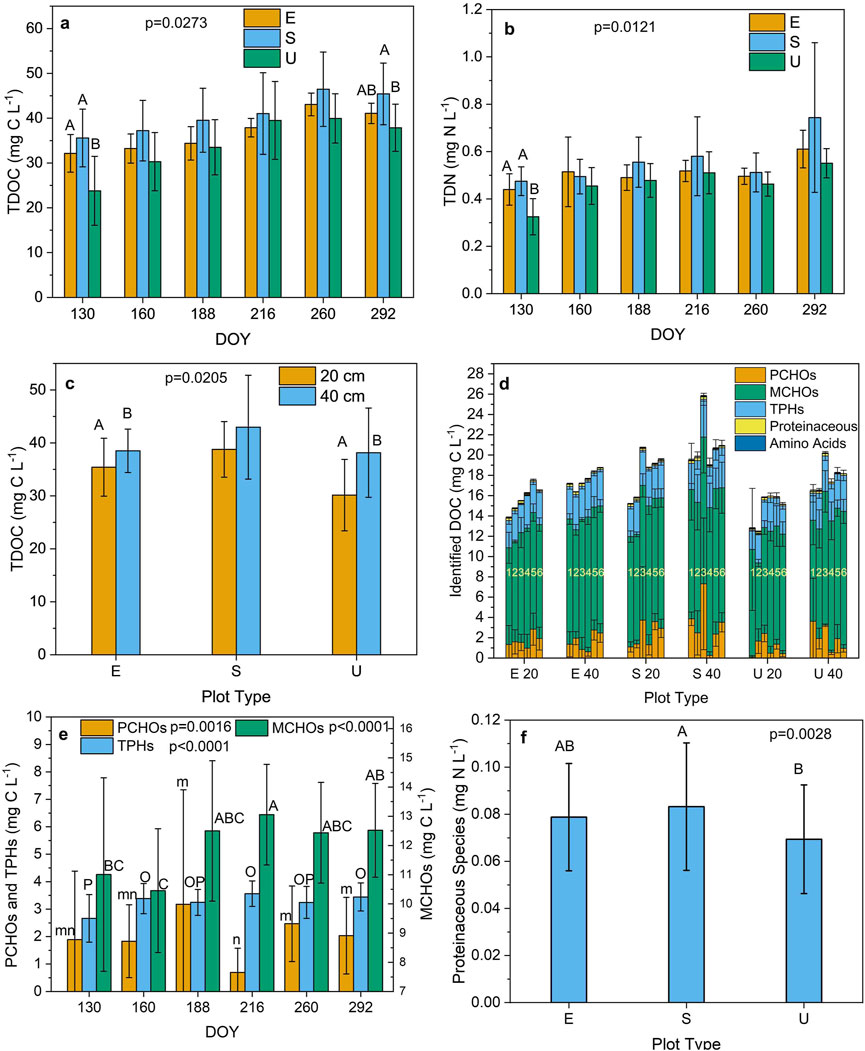
Figure 2. Seasonal variation of the concentrations of total dissolved organic carbon (TDOC) and total dissolved nitrogen (TDN) [with plot type (E; Ericaceae, S; Sedge, U; Unmanipulated) interaction] (a, b), respectively, variation of the level of TDOC (with interaction between plot type and sampling depth) (c), variation of organic compound classes (with interaction between plot type and sampling depth) (d), seasonal variation of the concentrations of monosaccharides (MCHOs), polysaccharides (PCHOs) and total phenolics (TPHs) (e), and variation of the concentration of proteinaceous substances (with plot type interaction) (f). [The data are presented as the mean ± standard deviation. Different letters denote significant differences with plot type (a, b, f), day of year (DOY) (e), and depth (c) (Tukey’s HSD test between subjects) (n = 108 samples)].
Levels of the MCHOs were significantly affected by depth and DOY, the PCHOs varied significantly with DOY, and the TPHs were significantly affected by plot type, depth, DOY, and sampling location (Supplementary Table S1). Unidentified classes of organic compounds typically comprised the largest fraction of the TDOC (Supplementary Figure S1b). The MCHOs were the largest fraction of the identified organic compound classes (Figure 2d). Concentrations of MCHOs and TPHs were highest at a depth of 40 cm for all plot types (p < 0.05, Supplementary Figures S2c, S2d). Levels of the MCHOs and TPHs were highest on DOY 216 (August, p < 0.05, Figure 2e) when concentrations of the PCHOs were lowest (Figure 2e). Levels of TPHs were higher in the sedge plots than concentrations in the Ericaceae and unmanipulated plots (Supplementary Figure S2e). Unmanipulated plots exhibited the lowest levels of TPHs (Supplementary Figure S2e). Unidentified organic N substances comprised the largest fraction of the TDN (Supplementary Figure S2f). The level of proteinaceous substances varied significantly with plot type, DOY, and sampling location (Supplementary Table S1). Sedge plots exhibited slightly higher levels (p = 0.0477) of proteinaceous substances than the other plot types (Figure 2f).
The SUVA254 indices varied significantly with plot type and DOY (p = 0.0006 and p < 0.0001, respectively, Supplementary Table S2). Lowest values of SUVA254 were observed for Ericaceae plots (p < 0.05, Supplementary Figure S3a). Significant plot type × DOY interactions occurred for the E2/E3 and HIX indices (p = 0.0139 and p = 0.0050, respectively, Supplementary Table S2). The E2/E3 indices were also significantly affected by depth (p = 0.0005) and DOY (p < 0.0001) and the HIX indices varied significantly with DOY (p < 0.0001) and sampling location (p = 0.0156). Unmanipulated plots exhibited the highest values of the HIX and E2/E3 indices from DOY 216 (August) to DOY 292 (October) (p < 0.0001 and p < 0.0001, respectively, Supplementary Table S2; Figures 3a, b). All indices exhibited significant seasonal variations (p < 0.0001). Values of the E2/E3 and SUVA254 indices diminished with season (p < 0.05, Figures 3b, c), HIX indices were lowest on DOY 130 (May, Figure 3a), and the E2/E3 indices were higher at a depth 40 cm (Supplementary Figure S3b). The lowest and highest values of A/T were observed on DOY 130 (May) and on DOY 260 (September), respectively (Figure 3d).
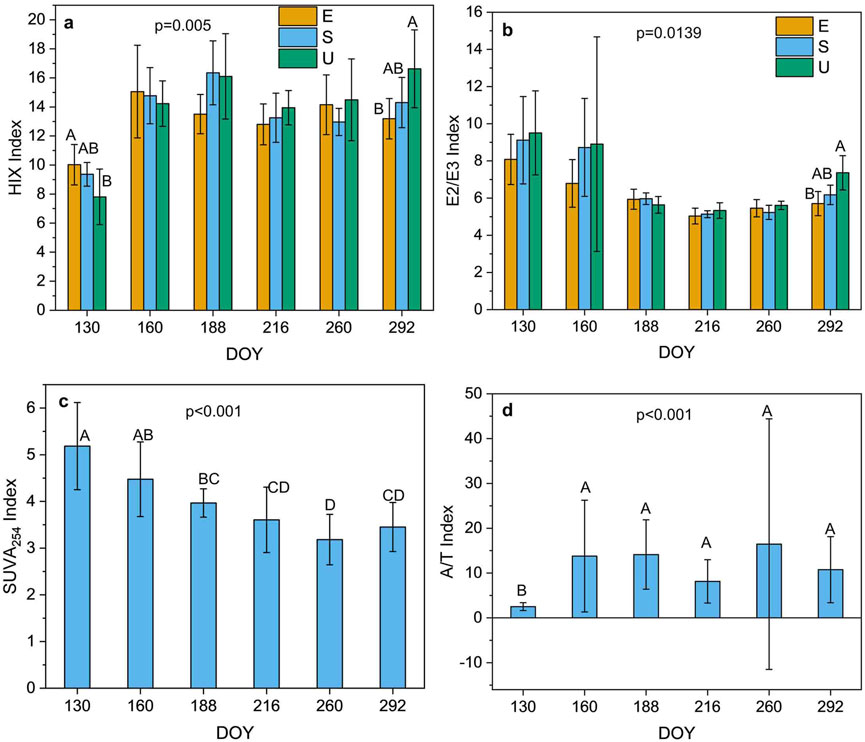
Figure 3. Seasonal variation of the HIX and E2/E3 indices [with plot type (E; Ericaceae, S; Sedge, U; Unmanipulated) interaction] (a, b), respectively, and the SUVA254 and A/T indices (c, d), respectively [The data are presented as the mean ± standard deviation. Different letters denote significant differences with plot type (a, b), and day of year (DOY) (c, d) (Tukey’s HSD test between subjects) (n = 108 samples)].
3.3 Molecular composition of dissolved organic matter
The O/C and H/C atomic ratios of various classes of naturally occurring organic compounds are presented in Supplementary Table S3. Seasonal variations for all compounds containing only C, H, and O atoms (e.g., C8H12O) were negligible; however, compounds containing S and N (e.g., C10H10N2O5S) varied significantly. The molecular composition of the DOM was significantly influenced by plot type and DOY (p = 0.002 and p = 0.001, respectively) and the interaction between plot type and DOY (p = 0.001; Table 1). There were also significant interactions between plot type, DOY, and depth (p = 0.04; Table 1).
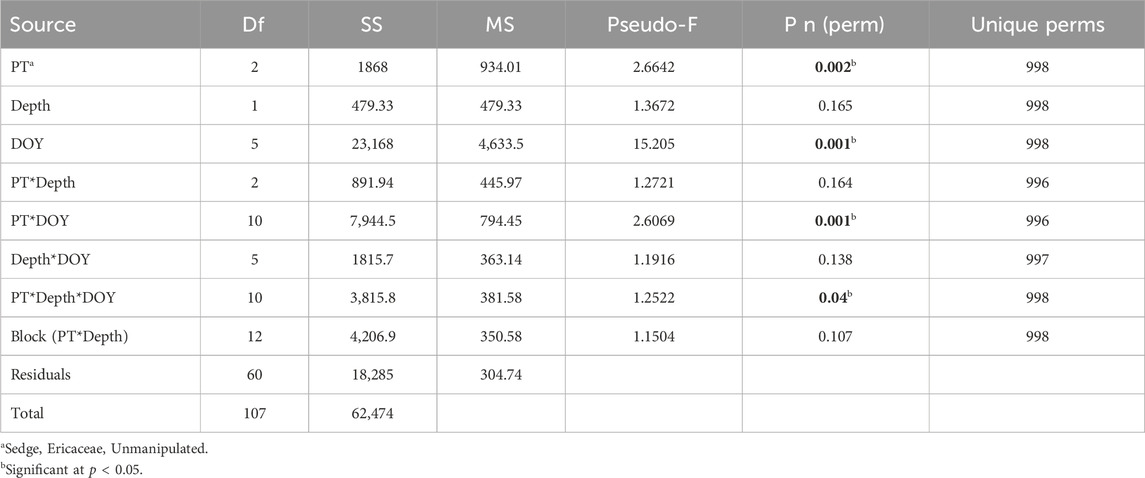
Table 1. Summary of results of all the molecular formulae from the distance-based permutation matrices’ analysis of variance (PERMANOVA) for all plot types (PTs), sampling depths, and day of the year (DOY) (Main test).
Results of the nMDS analysis indicated that small values on axis one represented the late season and large values on axis two represented the early season (Supplementary Figure S4). Proteinaceous substances, SUVA254 and E2/E3 indices, and temperature were positively correlated with the early season and FeT, TDOC, TPHs, TDN, MCHOs, water table, and the HIX index were positively correlated with the late season. Statistical analyses of the molecular data were used to identify the indicators for all DOY, the DOY indicators for all plot types, and the plot type indicators for all DOY. An analysis of plot type indicators for all DOY indicated that the number of indicators were similar for the Ericaceae and sedge plots (Figure 4a).
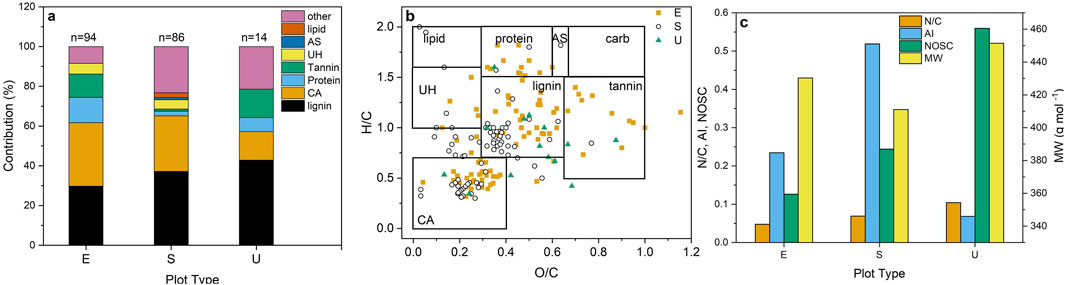
Figure 4. Contributions of the classes of organic compounds (lipid; lipid-like substances, protein; proteinaceous substances, AS; amino sugars, carb; carbohydrates, UH; unsaturated hydrocarbons, lignin; lignin-like substances, tannin; tannin-like substances, CA; condensed aromatics) to the plot type (E; Ericaceae, S; Sedge, U; Unmanipulated) indicators for all day of year (DOY) (n = number of indicators) (a), van Krevelen diagram of plot type indicators for the three plot types (b), and variation of the average values of the ratio of nitrogen to carbon atoms (N/C), aromaticity index (AI), nominal oxidation state of carbon (NOSC), and molecular weight (MW) of the organic substances with plot type (c). (Data represents a composite of the 20 cm and 40 cm sampling depths) (n = 108 samples).
Unmanipulated plots exhibited the fewest number of condensed aromatic- and lignin-like compounds (Figures 4a, b). Lipid-like compounds were only observed in the sedge plots and more tannin-like indicators were found in Ericaceae plots. The molecular analysis indicated contributions by proteinaceous substances were greatest for the Ericaceae plots, which is contrary to results of the compound class analysis that indicated proteinaceous substances were more abundant in sedge plots. The software that calculates molecular formulas constrains peptides to those substances having 1–3 N atoms; however, the compound class analysis for proteinaceous substances also measures polypeptides. The O/C ratios of lignin-like compounds in Ericaceae plots were higher and the N/C ratios were lower than the ratios in sedge plots (Figures 4b, c). The lowest average molecular weight (MW) and the highest AI of the plot-type indicators were found for the sedge plots (Figure 4c). The unmanipulated plots exhibited the highest values of the N/C atomic ratio and the NOSC (Figure 4c).
An analysis of DOY indicators for all plot types indicated that there were more indicators on DOY 160, 260, and 292 (Figure 5a). Approximately 75% of the indicators that were observed on DOY 292 were tannin- and lignin-like substances. The contribution of lignin-like compounds to the DOM increased through the season (Figures 5a, b). The highest contribution by the lignin-like compounds on DOY 260 was consistent with highest average MW of the DOY indicators (Figure 5c). Values of AI and NOSC generally increased with season and the trends were similar (Figure 5c). The highest average values of the AI occurred on DOY 160 when contributions by the condensed aromatics were highest. The average MW also increased with season (Figure 5c). Contributions of the lipids and average values of the N/C atomic ratio were highest on DOY 130 (Figures 5a, c).
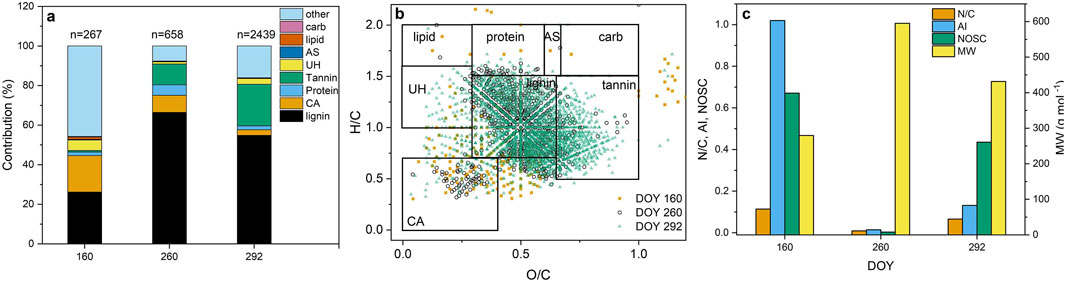
Figure 5. Contributions of the classes of organic compounds (lipid; lipid-like substances, protein; proteinaceous substances, AS; amino sugars, carb; carbohydrates, UH; unsaturated hydrocarbons, lignin; lignin-like substances, tannin; tannin-like substances, CA; condensed aromatics) to the day of the year (DOY) indicators for all plot types (n = number of DOY indicators) (a), van Krevelen diagram showing the seasonal variation of the DOY indicators (b), and variation of the average values of the ratio of nitrogen to carbon (N/C) atoms, aromaticity index (AI), nominal oxidation state of carbon (NOSC), and molecular weight (MW) of the organic substances with PFG treatment (c). (Data represents a composite of the 20 cm and 40 cm sampling depths) (Sampling dates having <100 DOY indicators are not shown) (n = 108 samples).
Differences in molecular formulas between plot type by DOY were significant (p = 0.001), with the exception of DOY 292 (Tables 1; Supplementary Table S4). On DOY 188, there was also a significant difference between the two sampling depths (p = 0.047; Tables 1; Supplementary Table S4). There were more than 100 DOY indicators for DOY 160, 260, and 292 (Figure 5) and more than 100 plot-type indicators for DOY 130, 216, and 260 (Figure 6).
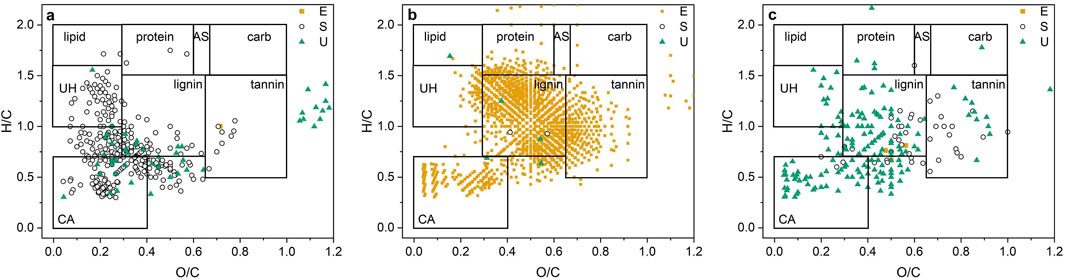
Figure 6. Van Krevelen diagrams of the classes of organic compounds (lipid; lipid-like substances, protein; proteinaceous substances, AS; amino sugars, carb; carbohydrates, UH; unsaturated hydrocarbons, lignin; lignin-like substances, tannin; tannin-like substances, CA; condensed aromatics) showing the plot type (E; Ericaceae, S; Sedge, U; Unmanipulated) indicators for day of the year (DOY) 130 (p = 0.015) (a), DOY 216 (p = 0.003) (b), and DOY 260 (p = 0.007) (c) (Sampling dates having <100 plot type indicators are not shown) (n = 108 samples).
The composition of plot-type indicators and spectral indices are presented for DOY 130, 160, 216, and 260, and for each depth on DOY 188 in Supplementary Figures S6, 7. In general, more indicators were found in sedge plots early in the growing season and in Ericaceae and unmanipulated plots late in the season (Supplementary Figure S6). More plot-type indicators with low O/C were observed on DOY 130 in the sedge plots than in the Ericaceae and unmanipulated plots (Figure 6a). Contributions of condensed aromatics, unsaturated hydrocarbons, and lignin were greater in the sedge plots than in the unmanipulated plots (Supplementary Figure S6a); however, values of the AI and NOSC were greatest in the unmanipulated plots (Supplementary Figure S7a). Molecular formulas for substances with O/C atomic ratios greater than those of carbohydrates and tannin-like substances were observed on DOY 130 and DOY 216 (Figure 6a).
Sedge plots exhibited the greatest number of DOY indicators on DOY 160 (Supplementary Figure S6b). Contributions by the lignin-like and condensed aromatic substances were greater than 50% in the sedge plots (Supplementary Figure S6b). The indicator substances in the sedge plots exhibited the highest value of the AI (Supplementary Figure S7b). Tannin- and lignin-like substances contributed about 60% of the indicators for the Ericaceae plots on DOY 160 (Supplementary Figure S6b) and NOSC and MW values were also high (Supplementary Figure S7b).
All three plot types on DOY 188 exhibited unique plot-type indicators at sampling depths of 20 and 40 cm, respectively (Supplementary Figures S6c, S6d, S8a, S8b). Indicators for the sedge and unmanipulated plots at a depth of 20 cm were characteristic of lignin- and tannin-like substances. Contributions of unsaturated hydrocarbons, tannin-, and lignin like indicators for the Ericaceae plots at a depth of 40 cm were each about 20% (Supplementary Figure S6d). Indicators in the sedge plots exhibited higher AI and MWs than the unmanipulated plots at a depth of 20 cm (Supplementary Figure S7c). The unmanipulated plots exhibited higher NOSC than the sedge plots at a depth of 20 cm. The AI value of the indicators for the Ericaceae plots was high at a depth of 40 cm and more than twice the value of AI for the sedge-only plot at a depth of 20 cm (Supplementary Figure S7d).
Approximately 1,600 plot-type indicators were observed in the Ericaceae plots on DOY 216 (Supplementary Figure S6e). Contributions were greatest for the lignin- and tannin-like substances with a smaller contribution by condensed aromatic substances. The H/C vs. O/C ratios were characteristic of lignin- and tannin-like substances and condensed aromatic indicator substances (Figure 6b). Values of the MW for indicator substances in the Ericaceae plots were the highest for all plots during the growing season (Supplementary Figure S7e). The sedge plots exhibited the highest values of the NOSC and AI (Supplementary Figure S7e).
The number of DOY and plot-type indicators were 658 and 210, respectively, on DOY 260 (Figure 5a; Supplementary Figure S6f). Unmanipulated plots exhibited the most indicator substances and contributions of unsaturated hydrocarbons, condensed aromatics, and lignin-like substances were about 20%, 10%, and 25%, respectively (Supplementary Figure S6f). Contributions of tannin- and lignin-like substances and condensed aromatics were about 50% in the sedge plots and lignin-like substances contributed nearly 70% of the indicator substances in the Ericaceae plots (Supplementary Figure S6f). Plot-type indicators in the unmanipulated plots had lower O/C atomic ratios and average values of MW and NOSC than indicators in Ericaceae and sedge plots (Figure 6c; Supplementary Figure S7f). Sedge plots exhibited the highest NOSC values and N/C atomic ratios (Supplementary Figure S7f).
Approximately 2400 DOY indicators were observed on DOY 292 (Figure 5a). Contributions of lignin-like substances were 20%, 60%, and 50% in the Ericaceae, sedge, and unmanipulated plots, respectively (Supplementary Figure S6g). Tannin-like substances comprised 60%, 20%, and were negligible, respectively, in the Ericaceae, sedge, and unmanipulated plots. Values of the MW for all three plot types were similar and values of the NOSC were highest in the Ericaceae and unmanipulated plots (Supplementary Figure S8g).
4 Discussion
The vascular plant functional group (PFG) treatments affected abiotic conditions and the molecular biogeochemistry of porewater DOM. The effects varied over the course of the growing season and were related to plant physiology and phenology; however, these vegetation properties were not measured directly. The following includes a discussion of the extent to which the results support or do not support the hypotheses, the emergence of new insights and perspectives, and implications for the diagenesis of porewater DOM in a poor fen.
4.1 Plant functional group effects
The aerenchymatous tissue of sedge facilitated oxygenation of the porewater, which affected the chemical microenvironment of the sedge and unmanipulated plots. The relatively low pH (4.03–4.3) of the poor fen ecosystem is due to the acidic nature of precipitation inputs, exudation of organic acids by vegetation, and poor buffering by groundwater inputs (Heldt, 2005; Reddy and DeLaune, 2008). Microbial respiration increases acidity, which may have been responsible for the lower pH values observed in the sedge plots (Supplementary Figure S1c). Ericaceae plots exhibited lower oxidation-reduction potential (ORP) values than the sedge plots (Figure 1b), which is consistent with the absence of aerenchyma in ericaceous shrubs and consumption of O2 via root respiration. Total dissolved iron and manganese (FeT and MnT) were lower in the sedge and unmanipulated plots than the Ericaceae plots (Figure 1c). Oxidized forms of Fe and Mn [i.e., Fe(III) and Mn(IV)] are less soluble than the reduced forms [i.e., Fe(II) and Mn(II)] (Reddy and DeLaune, 2008). Higher ORP values in the sedge and unmanipulated plots are consistent with the presence of insoluble Fe(III) and Mn(IV) substances, whereas soluble Fe(II) and Mn(II) substances are more likely to be present in the more reducing conditions of the Ericaceae plots. Consumption of O2 by root respiration in the Ericaceae plots would help to maintain reducing conditions and create acidity. Values of pH were less than 4.3 throughout the growing season, and thus, contributions of soluble complexes of Fe(II) to the FeT concentration were expected to be large.
Sedge plots exhibited the highest levels of proteinaceous substances and the largest contributions by lipid-like compounds (Figures 2f, 4a, respectively). Bacterial biomass in the O2-rich microenvironment surrounding sedge roots might have been elevated, which produced higher levels of water-soluble proteins and lipids. Proteins, which are a principal constituent of bacteria, are the enzymes bacteria use to degrade N-, S-, and P-containing organic matter (OM) to acquire nutrients (Bragazza et al., 2015). Bacterial lipids are shorter in C-chain length than the lipids in plants, and thus, are expected to be more water-soluble (Sundh et al., 1997; Stumpf, 2014).
Shrubs like Ericaceae are composed of more woody biomass than sedge and the chemical substances associated with woody biomass (e.g., phenolic compounds like various lignin and tannin substances) are more abundant in Ericaceae than in graminoids like sedge (Read et al., 2004). However, unexpected observations in the sedge plots included the following: (1) high levels of total phenolics (TPHs) (Supplementary Figure S2e), (2) large Aromatic Indices (AIs) of the substances (Supplementary Figure S8), and (3) large contributions of lignin-like and condensed aromatic substances to the plot-type indicators (Figure 4). Mycorrhizal fungi, which are responsible for lignin degradation in most terrestrial soils, are typically low or absent in sedges (Muthukumar et al., 2004); however, mycorrhizal associations in Carex have been observed and are influenced by environmental conditions and edaphic factors (Miller et al., 1999). Most bacteria lack the ligase enzymes that are responsible for degrading lignin to aromatic monomers, which might explain accumulation of lignin-like substances in the sedge plots. However, Sphagnum moss, which was left intact in all the plots, might have contributed lignin-like phenolics to the DOM of the sedge plots. The cell walls of Sphagnum species are composed of lignin-like phenolics (Bengtsson et al., 2018) and polysaccharides (Turetsky et al., 2008), like sphagnan (Hájek et al., 2011).
The average molecular weights (MWs) of chemical substances in sedge plots were smaller than the average values in Ericaceae plots (Figure 4c), which suggests contributions of polymeric degradation products of lignin-like substances with high aromatic character to the chemical substances were large in the sedge plots. Activities of enzymes like lyases, which may have been facilitated by oxygenation of the sedge rhizosphere by aerenchyma, likely resulted in the removal of hydroxy, methoxy, and carboxylic acid functionalities from lignin- and tannin-like substances with a concomitant production of low molecular weight, condensed aromatic substances. The degradation process might explain the low O/C atomic ratios of molecular substances in the sedge plots relative to Ericaceae plots (Figure 4b). Sedge plots exhibited the highest concentrations of total dissolved organic carbon (TDOC) and total dissolved nitrogen (TDN) throughout the season (Figures 2a, b). Possible explanations include the following: (1) woody shrub litter is composed of more recalcitrant, lignin- and tannin-like OM than sedge litter, (2) the sedge plots lack sufficient saprotrophic activity to fully degrade macromolecular lignin- and tannin-like substances (Cairney and Burke, 1998b; Lamit et al., 2017) or, (3) sedge produces more root exudates containing low-molecular weight phenolic compounds (Dakora and Phillips, 2002; Carvalhais et al., 2011). However, rates of production of root exudates by some species of Ericaceae are greater than the rates of exudate production for some species of sedge (Proctor and He, 2017).
The data indicated there were larger contributions of tannin-like compounds to the molecular substances in Ericaceae plots than in sedge plots (Figure 4), which is in agreement with ericaceous shrubs having more woody biomass than sedge and a lack of aerenchyma to facilitate oxygenation of the Ericaceae rhizosphere. However, concentrations of the TPHs (Supplementary Figure S2e), values of the aromaticity spectral index (SUVA254) (Supplementary Figure S3a) and the AIs (Figure 4c), and contributions of lignin to the molecular substances in the Ericaceae plots (Figure 4a) were lower than the levels and values in the sedge plots. The OM produced by ericaceous shrubs is rich in phenolic compounds (Read et al., 2004). Anoxic conditions of the Ericaceae rhizosphere likely suppressed fungal decomposition of the DOM and the free-living saprotroph activity (Jaatinen et al., 2007; Peltoniemi et al., 2009; Lin et al., 2012), which would allow tannin- and lignin-like substances to accumulate. Moreover, many of the phenolic compounds are highly toxic to fungi and are known to inhibit microbial decomposition of DOM (Hodgkins et al., 2014), which would allow lignin- and tannin-like substances to accumulate. In addition, ericoid mycorrhizal (ERM) fungi associated with the roots of Ericaceae lack the class II peroxidases that are capable of degrading lignin and complex humic substances (Cairney and Burke, 1998a; Cairney and Burke, 1998b). The lack of accumulation of lignin-like substances in the Ericaceae plots was unexpected; however, it is possible (1) lignin-like substances are part of a supramolecular association that are removed from the dissolved phase and partition to the particle phase (Piccolo and Conte, 2000; Gerke, 2018) or (2) the spectral, chemical, and molecular analyses are incorrectly identifying macromolecular, lignin-like substances.
Unmanipulated plots exhibited the highest values of ORP on two of the three dates (Figure 1c) and the lowest concentrations of TDOC on two dates (Figure 2a) and TDN on one date (Figure 2b), which suggests sedge played a role in transporting O2 into both the sedge and Ericaceae rhizospheres of the unmanipulated plots. Oxygenation of the rhizosphere apparently stimulated bacterial and fungal decomposition of the OM. The ERM fungi assist the Ericaceae with nutrient acquisition via the decomposition of OM (Perotto et al., 2018). Ericaceous shrubs acquire N to meet nutritional requirements and bacteria require N to synthesize enzymes, which likely reduced levels of TDN. Concentrations of the TPHs were lower (Supplementary Figure S2e) and values of the SUVA254, humification (HIX), and molecular size (E2/E3) indices were generally larger for the unmanipulated plots than the sedge and Ericaceae plots (Supplementary Figures S3a, 3a, 3b, respectively). The trend indicates a larger contribution by low-molecular-weight substances, particularly aromatic compounds, and a high degree of humification of the OM. High values of the SUVA254 might indicate more extensive decomposition of macromolecular aromatic substances like lignin and accumulation of low-molecular-weight aromatic compounds (Hribljan et al., 2014). Other low-molecular-weight substances likely include lipids and degradation products of macromolecular peptides and tannin-like substances. Large HIX indices indicated an advanced state of humification, which involves the formation of supramolecular associations of the low-molecular weight substances (Piccolo and Conte, 2000; Gerke, 2018).
Ericaceae and sedge roots, which typically extend to about 20 cm and 40 cm, respectively, influenced the composition of DOM and FeT and MnT concentrations at those depths. Iron and Mn are important cofactors in lignin modifying enzymes (LMEs). Concentrations of TDOC, TDN, monosaccharides (MCHOs), TPHs in porewater at a sampling depth of 40 cm were higher (Figure 2c and Supplementary Figures S2a, S2c, S2d, respectively) and the E2/E3 indices were greater (Supplementary Figure S3b) than the levels and indices at 20 cm for all plot types. Low values of the E2/E3 indices indicate chemical substances of smaller molecular size. Warmer temperatures at 20 cm likely accelerated decomposition of macromolecular organic substances, which produced smaller molecules like MCHOs. Sedges have deep root systems that transport O2 deep into the fen; however, root and microbial activity is also expected to be high in shallow depths of the fen due to O2 intrusion from the atmosphere. The TDOC and TDN appeared to accumulate in deeper zones of the fen where O2 availability is low.
There were significant interactions between plot type, depth, and day of the year (DOY) for the TDOC concentrations (Table 1). Differences in TDOC levels with depth were greatest for the unmanipulated plots. Concentrations of FeT were lower at depths of 20 cm than that at 40 cm (Figure 1f), which could be due to sequestration of Fe by LMEs (Janusz et al., 2017). Unlike the trends exhibited by FeT, the MnT concentrations in Ericaceae and unmanipulated plots were higher at 20 cm than 40 cm (Figure 1e). Manganese is also present in LMEs, and thus, low levels of Mn at 20 cm were also expected. Diffusion of O2 to Ericaceae roots, which typically reach depths of about 20 cm, might have modified the redox chemistry of the rhizosphere. Uptake of O2 via competition between microbes and roots would reduce Mn(IV) substances to more soluble Mn(II) substances. In addition, contributions of soluble Fe(II) and Mn(II) to FeT and MnT in the acidic conditions of the Ericaceae rhizosphere would be high. Variations in ORP due to changes in depth of the water table might also affect MnT levels. Manganese would be present as more soluble Mn(II) substances when the water table is high and ORP is low. As the water table is lowered, conditions might become more oxidizing and produce less soluble Mn(IV) substances.
Ericaceae plots exhibited plot-type indicators at 40 cm on DOY 188 that were unique from the plot-type indicators of sedge and unmanipulated plots (Supplementary Figure S8c). Sedge roots extend down to depths below 40 cm, transporting O2 deep into the rhizosphere of the sedge and unmanipulated plots, which likely accelerated microbial decomposition of the DOM. Plot-type indicators at a depth of 20 cm in unmanipulated plots have lower MW and AI and higher NOSC and N/C atomic ratios than the sedge plots (Supplementary Figure S7c. The ERM fungi associated with Ericaceae roots at a depth of 20 cm and the increased O2 availability provided by sedge roots likely enhanced enzyme activities and microbial decomposition of the DOM in the unmanipulated plots.
4.2 Seasonal effects
Seasonal changes in the concentrations and composition of the DOM were related to peatland hydrology and plant phenology. Ericaceous shrubs were expected to affect the molecular composition of DOM later in the growing season than sedges. Evergreen shrubs form all or most of their leaves in late July unlike sedges, which form their leaves in early June (Leppälä et al., 2008; Sloan et al., 2016). Root production in woody species like ericaceous shrubs reach peak levels after maximum leaf production unlike leaf and root production in graminoids, which occur synchronously (Sloan et al., 2016).
Levels of TDOC, MCHOs, and TPHs were lowest on DOY 130 (Figures 2a, e, respectively) and are consistent with dilution of porewater levels by snowmelt in spring. Concentrations of TDOC in snowmelt water are typically lower than TDOC levels in peatland porewater in spring (Anneli et al., 2008), and thus, snowmelt water would dilute concentrations of chemical constituents in porewater following spring thaw. Levels of MCHOs on DOY 160 (Figure 2e) were unchanged from the concentrations on DOY 130. Plants require mineral nutrients and carbohydrates to grow stems and leaf sheaths early in the growing season (Silvan et al., 2004), which might explain the low levels of MCHOs on DOY 160. Exudation of DOM from plant roots also contributes to the TDOC. The steady increase in TDOC levels during the growing season might indicate a steady increase in fine root production during the growing season with a concomitant release of DOM. Exudation rates are greater from immature roots than the exudation rates from mature and senior roots of some species of Ericaceae and sedge (Proctor and He, 2017). Fine root growth for trees and shrubs in a bog were variable and sometimes exhibited unimodal and bimodal growth distributions (Iversen et al., 2018).
Interactions between depth and DOY affected molecular composition of DOM and were significant on DOY 188 (Supplementary Table S4), which coincides with the period of root development in evergreen shrubs. The TDOC levels increased after DOY 188 and reached a maximum on DOY 260 (Figure 2a) and Ericaceae plots exhibited the greatest number of PFG indicators on DOY 216 (Supplementary Figure S6f). Interactions were significant between PFG and DOY for the E2/E3 and HIX indices (Supplementary Table S2). Trends of the E2/E3 and HIX indices for sedge and Ericaceae plots early in the growing season (i.e., DOY 130 and 160) were directly opposite the trends later in the growing season (i.e., DOY 188 and 216). Higher values of the HIX indices and lower values of the E2/E3 indices for Ericaceae plots compared to sedge plots early in the growing season (Figures 3a, b, respectively) suggest a higher molecular weight and degree of humification of the DOM in Ericaceae plots. The plot-type indicators for the Ericaceae plots during the early growing season on DOY 130 and 160 were composed of compounds of high molecular weight and tannin-like compounds with a smaller contribution of lignin-like substances (Supplementary Figures S6a, S6b). However, the HIX and E2/E3 indices indicate a low degree of humification and an abundance of small molecular-size substances, respectively, for the Ericaceae plots early in the growing season. Contributions of lignin- and tannin-like substances to the plot-type indicators for the Ericaceae plots on DOY 216 were large (Supplementary Figure S6e) and the average molecular weight of the plot-type indicators was the highest observed (Supplementary Figure S8e). The molecular data represents the small fraction of the DOM that is amenable to analysis by electrospray ionization, ultra-high resolution mass spectrometry (ESI-UHR-MS) and is inconsistent with the spectral data, which represents the bulk DOM and contains macromolecular substances that are removed by sample cleanup prior to analysis by ESI-UHR-MS.
Photosynthetic efficiency of Ericaceae reaches a maximum in late July when plants form all or most of their leaves. There is a concomitant production of labile carbohydrates that are transported to roots, which makes the labile substances available to ERM fungi. Elevated levels of ERM fungal activity may suppress saprotroph activity and decrease DOM decomposition. The ERM fungi lack the class II peroxidases, which are capable of degrading lignin and complex humic substances. Thus, more lignin would accumulate in Ericaceae plots, which is consistent with the molecular data.
Unmanipulated plots exhibited the highest degree of humification late in the growing season (DOY 260) when the plants began to senesce. The HIX indices for unmanipulated and Ericaceae plots on DOY 260 were similar and greater than the HIX indices for sedge plots (Figure 3a). Contributions of lignin-like substances and amino sugars to the plot-type indicators were larger in unmanipulated plots than the contributions in the sedge plots (Supplementary Figure S6f). Ericaceae plots exhibited the highest contribution of lignin-like substances to the plot-type indicators; however, the number of plot-type indicators was very small (n = 3). Reaction of amino sugars, polypeptides, and amino acids with the phenolic moieties of lignin produces humic substances. The HIX indices of the bulk DOM in unmanipulated plots indicate a high degree of humification and the molecular data indicates precursors to humic substances like amino sugars and lignin-like substances were present. Contributions of tannin-like and proteinaceous substances to the plot-type indicators in unmanipulated plots were greater than the contributions in Ericaceae plots (Supplementary Figure S6f). Tannin-like compounds complex with proteinaceous substances to produce macromolecular substances during humification (Kraus et al., 2003), which is consistent with the molecular data and HIX indices.
Microbial transformations of DOM are expected to accelerate during the summer as rising porewater temperatures (Figure 1b) increase enzyme activities (Kane et al., 2014; Wilson et al., 2016). Concentrations of MCHOs (Figure 2e) and TPHs (Figure 2e) increased from DOY 188 to DOY 216 and levels of polysaccharides (PCHOs) decreased (Figure 2e). The trends might be explained (1) by depolymerization of the PCHOs via enzymatic hydrolysis of glycosidic bonds, which produces MCHOs and (2) by dehydration of PCHOs and MCHOs, which produces TPHs (Tan, 2003). Microbial decomposition of fallen leaves and a reduction in the consumption of available nutrients by plants late in the growing season leads to allocation of N-, P-, and S-carbon compounds to belowground OM (Olsrud and Christensen, 2004). The processes likely contributed to rising TDOC and TDN levels and increases in the N/C atomic ratio, which was observed late in the growing season.
Aromaticity of the DOM (i.e., SUVA254 index; Figure 3a) decreased during the growing season with a concomitant increase in molecular size (i.e., E2/E3 index; Figure 3b). The degree of humification (i.e., HIX; Figure 3a) increased considerably after DOY 130 and was relatively constant afterwards. The trend suggests that aromatic compounds with small molecular sizes like monomeric phenolic substances are abundant early in the growing season and polymeric substances with more alicyclic character are abundant late in the growing season. Aromatic DOM with a large molecular size has been observed in a bog (Broder et al., 2017) and in a peat manipulation experiment (Kane et al., 2019), which is contrary to observations from the subject study. However, seasonal trends in AIs of the DOY indicators were different than the trends in SUVA254. The AIs increased sharply after DOY 130 to a maximum value, diminished sharply after DOY 160 and then increased throughout the rest of the season (Figure 5c; Supplementary Figure S5c). The SUVA254 represents the concentration of aromatic substances in the bulk porewater, which likely includes macromolecular aromatic substances that are removed by the sample cleanup procedures in preparation for analysis by ESI-UHR-MS. In addition, the AI represents the aromaticity of the DOY indicators, i.e., the small fraction of DOM amenable to analysis by ESI-UHR-MS in the negative ion mode. The ESI-UHR-MS analysis is restricted to organic substances with masses less than 500 Da and proton donating substances, i.e., compounds having carboxylic acid and alcohol functionalities. Results from the molecular analysis are contrary to the spectral analysis of bulk porewater and suggests that some polymeric OM with aromatic character might be forming in porewater during the growing season. Seasonal variations in the SUVA254 indices were directly opposite to trends in concentrations of the TPHs, which include hydroxylated aromatic compounds like tannin, lignin, phenols, and cresols. However, some of the phenolic substances might be multifunctional with carboxylic acid moieties that are not quantified by the TPH analytical procedure.
Trends in the MW of the DOY indicators (Figure 5c) were similar to trends in the E2/E3 indices; however, changes of SUVA254 did not agree with changes of the AI (Figure 3b). The HIX index was low on DOY130. The low MW of the DOY indicators and the degree of humification suggest low molecular weight, monomeric substances are present, which is consistent with a melting snowpack in spring that flushes low molecular weight, water-soluble compounds into porewater. The large contribution of lipids (Supplementary Figure S5a) on DOY 130 might come from lysing microbial cells. Values of HIX indices after DOY 130 were relatively invariable, which indicates a constant degree of humification after spring.
Smallest values of the A/T indices, which are indicative of a small proportion of degraded material, most likely high molecular weight, polymeric substances in the bulk DOM, were found on DOY 130 (Figure 3d). Largest values of the A/T indices were observed on DOY 260, which is indicative of a large proportion of degraded material, most likely low molecular weight, monomeric substances. The trends in A/T indices are directly opposite the variations in MW of the DOY indicators, which indicate an increase in MW throughout the growing season. Large values of A/T indices late in the season might indicate that root exudates, which are composed of low molecular weight compounds, contribute to the DOM. However, seasonal trends in the A/T indices do not agree with variations in the HIX indices, which are more similar to the trends in the MW of DOY indicator substances. The discrepancies are likely due to spectral analysis of the bulk porewater versus molecular analysis of a small fraction of the DOM by ESI-UHR-MS.
5 Conclusion
New insights and perspectives on the effects of sedge and Ericaceae in a Sphagnum matrix on the molecular biogeochemistry of porewater DOM in a poor fen were made possible by a novel analytic approach that included organic compound class analysis, determination of spectral indices, and molecular analysis by ESI-UHR-MS. An intercomparison of results from the bulk analysis of porewater, which was used to determine spectral indices and compound classes, with results from the fraction of the DOM that was amenable to molecular analysis by ESI-UHR-MS revealed discrepancies in interpretation that would result if the techniques were not used together. Bulk analysis of the DOM includes macromolecular organic substances that are removed by sample cleanup in preparation for analysis by ESI-UHR-MS, which is restricted to detection of substances with masses less than 500 Da. However, ESI-UHR-MS analysis was particularly useful in identifying, e.g., aromatic substances typical of plant exudates, lignin-like substances and amino sugars that are precursors to humic substances, and tannin-like substances that are likely important in complexing proteinaceous substances.
Strong seasonal variations of DOM composition and interactions between DOY and PFG were observed. The composition of the DOM was regulated on a seasonal time scale by fresh inputs from sedge and Ericaceae, microbial decomposition of labile OM, and accumulation of refractory organic compounds. There appeared to be some evidence of the early stages of humification on the seasonal time scale, i.e., reaction of phenolic moieties of lignin substances with amino sugars and complexation of proteinaceous substances by tannin-like compounds. Concentrations of TDOC were a minimum in May when melting snow flushed DOM characterized by a low average MW and high aromaticity through the poor fen. Late in the season unique molecular substances were likely contributed by root exudates and leaf fall that produced DOM with little aromaticity. Contributions of tannin- and lignin-like compounds to the plot-type indicators in the Ericaceae plots were high and likely attributed to inputs of the woody biomass of Ericaceae. Refractory compounds that persisted in the Ericaceae rhizosphere may arise from a combination of anoxia and suppression of free-living saprotroph activity by the ERM fungi. Sedge plots exhibited the highest concentrations of TDOC and proteinaceous substances throughout the field experiment. The abundance of TPHs in sedge plots may be attributed (1) to rapid decomposition of labile compounds in the O2-rich microenvironment surrounding sedge roots, which allowed more refractory compounds like lignin and tannin to accumulate or (2) to contributions of polyphenolics to the DOM by Sphagnum.
Variations in the temperature and hydrology of peatlands with concomitant changes in various PFGs are expected in a warming climate. Observations of the relationship between PFGs and seasonal variations of the molecular composition of DOM are necessary to predict the accumulation of OM in peatlands as the climate changes. The subject investigation provided some evidence of humification on a seasonal time scale, which will act to sequester C in peatlands. However, year-to-year observations of DOM behavior will be required to understand effects of climate change on long- and short-term storage of C in peatlands.
Data availability statement
The raw data supporting the conclusions of this article will be made available by the authors, without undue reservation.
Author contributions
ZS: Data curation, Formal Analysis, Investigation, Methodology, Validation, Writing – original draft. MK: Formal Analysis, Methodology, Writing – review and editing. EL: Resources, Supervision, Writing – review and editing. EK: Resources, Supervision, Writing – review and editing. PD: Conceptualization, Funding acquisition, Project administration, Supervision, Writing – review and editing.
Funding
The author(s) declare that financial support was received for the research and/or publication of this article. Funding for the study was provided in part by the McIntire Stennis Grant 1001685 from the USDA National Institute of Food and Agriculture, The National Science Foundation (DEB-1146149), and in-kind support from the USDA Forest Service, Northern Research Station. Zhimin Song was supported in part through teaching assistantships and a finishing fellowship from the Department of Civil, Environmental, and Geospatial Engineering and the Graduate School, respectively, at Michigan Technological University.
Conflict of interest
The authors declare that the research was conducted in the absence of any commercial or financial relationships that could be construed as a potential conflict of interest.
The author(s) declared that they were an editorial board member of Frontiers, at the time of submission. This had no impact on the peer review process and the final decision.
Generative AI statement
The author(s) declare that no Generative AI was used in the creation of this manuscript.
Publisher’s note
All claims expressed in this article are solely those of the authors and do not necessarily represent those of their affiliated organizations, or those of the publisher, the editors and the reviewers. Any product that may be evaluated in this article, or claim that may be made by its manufacturer, is not guaranteed or endorsed by the publisher.
Supplementary material
The Supplementary Material for this article can be found online at: https://www.frontiersin.org/articles/10.3389/fenvs.2025.1549320/full#supplementary-material
References
Albano, L. J., Turetsky, M. R., Mack, M. C., and Kane, E. S. (2021). Deep roots of Carex aquatilis have greater ammonium uptake capacity than shallow roots in peatlands following permafrost thaw. Plant Soil 465, 261–272. doi:10.1007/s11104-021-04978-x
Anneli, Å., Ishi, B., Martin, B., Kevin, B., Mats, J., and Hjalmar, L. (2008). Dissolved organic carbon characteristics in boreal streams in a forest-wetland gradient during the transition between winter and summer. J. Geophys. Res. Biogeosciences 113. doi:10.1029/2007jg000674
Bengtsson, F., Rydin, H., and Hájek, T. (2018). Biochemical determinants of litter quality in 15 species of Sphagnum. Plant Soil 425, 161–176. doi:10.1007/s11104-018-3579-8
Bier, A. W. (2009). Introduction to oxidation reduction potential measurement. Lit. No. 2072, Hach, Loveland, CO.
Blodau, C. (2002). Carbon cycling in peatlands — a review of processes and controls. Environ. Rev. 10, 111–134. doi:10.1139/a02-004
Bragazza, L. (2006). A decade of plant species changes on a mire in the Italian Alps: vegetation-controlled or climate-driven mechanisms? Clim. Change 77, 415–429. doi:10.1007/s10584-005-9034-x
Bragazza, L., Bardgett, R. D., Mitchell, E. A., and Buttler, A. (2015). Linking soil microbial communities to vascular plant abundance along a climate gradient. New Phytol. 205, 1175–1182. doi:10.1111/nph.13116
Breeuwer, A., Robroek, B. J., Limpens, J., Heijmans, M. M., Schouten, M. G., and Berendse, F. (2009). Decreased summer water table depth affects peatland vegetation. Basic Appl. Ecol. 10, 330–339. doi:10.1016/j.baae.2008.05.005
Bridgham, S. D., Pastor, J., Dewey, B., Weltzin, J. F., and Updegraff, K. (2008). Rapid carbon response of peatlands to climate change. Ecology 89, 3041–3048. doi:10.1890/08-0279.1
Broder, T., Knorr, K.-H., and Biester, H. (2017). Changes in dissolved organic matter quality in a peatland and forest headwater stream as a function of seasonality and hydrologic conditions. Hydrology Earth Syst. Sci. 21, 2035–2051. doi:10.5194/hess-21-2035-2017
Brooks, P. D., Haas, P. A., and Huth, A. K. (2007). Seasonal variability in the concentration and flux of organic matter and inorganic nitrogen in a semiarid catchment, San Pedro River, Arizona. J. Geophys. Res. Biogeosciences 112, n/a. doi:10.1029/2006jg000275
Buckeridge, K. M., Banerjee, S., Siciliano, S. D., and Grogan, P. (2013). The seasonal pattern of soil microbial community structure in mesic low arctic tundra. Soil Biol. and Biochem. 65, 338–347. doi:10.1016/j.soilbio.2013.06.012
Cairney, J., and Burke, R. (1998a). Do ecto-and ericoid mycorrhizal fungi produce peroxidase activity? Mycorrhiza 8, 61–65. doi:10.1007/s005720050213
Cairney, J., and Burke, R. (1998b). Extracellular enzyme activities of the ericoid mycorrhizal endophyte Hymenoscyphus ericae (Read) Korf and Kernan: their likely roles in decomposition of dead plant tissue in soil. Plant Soil 205, 181–192.
Carvalhais, L. C., Dennis, P. G., Fedoseyenko, D., Hajirezaei, M. R., Borriss, R., and von Wirén, N. (2011). Root exudation of sugars, amino acids, and organic acids by maize as affected by nitrogen, phosphorus, potassium, and iron deficiency. J. Plant Nutr. Soil Sci. 174, 3–11. doi:10.1002/jpln.201000085
Catalán, N., Obrador, B., Alomar, C., and Pretus, J. L. (2013). Seasonality and landscape factors drive dissolved organic matter properties in Mediterranean ephemeral washes. Biogeochemistry 112, 261–274. doi:10.1007/s10533-012-9723-2
Coble, A. A., Marcarelli, A. M., Kane, E. S., Toczydlowski, D., and Stottlemyer, R. (2016). Temporal patterns of dissolved organic matter biodegradability are similar across three rivers of varying size. J. Geophys. Res. Biogeosciences 121, 1617–1631. doi:10.1002/2015jg003218
Dahl, T. E., and Zoltai, S. C. (1997). Forested northern wetlands of North America. Boca Raton, FL, USA: Lewis Publishers.
Dakora, F. D., and Phillips, D. A. (2002). “Root exudates as mediators of mineral acquisition in low-nutrient environments,” in Food security in nutrient-stressed environments: exploiting plants’ genetic capabilities, 201–213.
De Deyn, G. B., Cornelissen, J. H., and Bardgett, R. D. (2008). Plant functional traits and soil carbon sequestration in contrasting biomes. Ecol. Lett. 11, 516–531. doi:10.1111/j.1461-0248.2008.01164.x
De Haan, H. (1972). Molecule-size distribution of soluble hunic compounds from different natural waters. Freshw. Biol. 2, 235–241. doi:10.1111/j.1365-2427.1972.tb00052.x
De Haan, H., and de Boer, T. (1987). Applicability of light absorbance and fluorescence as measures of concentration and molecular size of dissolved organic carbon in humic Lake Tjeukemeer. Water Res. 21, 731–734. doi:10.1016/0043-1354(87)90086-8
Dieleman, C. M., Lindo, Z., McLaughlin, J. W., Craig, A. E., and Branfireun, B. A. (2016). Climate change effects on peatland decomposition and porewater dissolved organic carbon biogeochemistry. Biogeochemistry 128, 385–396. doi:10.1007/s10533-016-0214-8
Dorresteijn, R. C., Berwald, L. G., Zomer, G., De Gooijer, C. D., Wieten, G., and Beuvery, E. C. (1996). Determination of amino acids using o-phthalaldehyde-2-mercaptoethanol derivatization effect of reaction conditions. J. Chromatogr. A 724, 159–167. doi:10.1016/0021-9673(95)00927-2
Fellman, J. B., Hood, E., D’Amore, D. V., Edwards, R. T., and White, D. (2009). Seasonal changes in the chemical quality and biodegradability of dissolved organic matter exported from soils to streams in coastal temperate rainforest watersheds. Biogeochemistry 95, 277–293. doi:10.1007/s10533-009-9336-6
Flessa, H., and Fischer, W. (1992). Plant-induced changes in the redox potentials of rice rhizospheres. Plant Soil 143, 55–60. doi:10.1007/bf00009128
Gerke, J. (2018). Concepts and misconceptions of humic substances as the stable part of soil organic matter: a review. Agronomy 8, 76. doi:10.3390/agronomy8050076
Gorham, E. (1991). Northern peatlands: role in the carbon cycle and probable responses to climatic warming. Ecol. Appl. 1, 182–195. doi:10.2307/1941811
Grannas, A. M., Hockaday, W. C., Hatcher, P. G., Thompson, L. G., and Mosley-Thompson, E. (2006). New revelations on the nature of organic matter in ice cores. J. Geophys. Res. Atmos. 111, n/a. doi:10.1029/2005jd006251
Guigue, J., Harir, M., Mathieu, O., Lucio, M., Ranjard, L., Lévêque, J., et al. (2016). Ultrahigh-resolution FT-ICR mass spectrometry for molecular characterisation of pressurised hot water-extractable organic matter in soils. Biogeochemistry 128, 307–326. doi:10.1007/s10533-016-0209-5
Hájek, T., Balance, S., Limpens, J., Zijlstra, M., and Verhoeven, J. T. A. (2011). Cell-wall polysaccharides play an important role in decay resistance of Sphagnum and actively depressed decomposition in vitro. Biogeochemistry 103, 45–57. doi:10.1007/s10533-010-9444-3
Hansen, A. M., Kraus, T. E. C., Pellerin, B. A., Fleck, J. A., Downing, B. D., and Bergamaschi, B. A. (2016). Optical properties of dissolved organic matter (DOM): effects of biological and photolytic degradation. Limnol. Oceanogr. 61, 1015–1032. doi:10.1002/lno.10270
Hedges, J. (1990). Compositional indicators of organic acid sources and reactions in natural environments. In Organic acids in aquatic ecosystems. [E. M. Perdue, E. T. Gjessing, and W. Glaze] 43–63. Wiley Interscience, New York.
Hodgkins, S. B., Tfaily, M. M., McCalley, C. K., Logan, T. A., Crill, P. M., Saleska, S. R., et al. (2014). Changes in peat chemistry associated with permafrost thaw increase greenhouse gas production. Proc. Natl. Acad. Sci. 111, 5819–5824. doi:10.1073/pnas.1314641111
Hribljan, J. A., Kane, E. S., Pypker, T. G., and Chimner, R. A. (2014). The effect of long-term water table manipulations on dissolved organic carbon dynamics in a poor fen peatland. J. Geophys. Research-Biogeosciences 119, 577–595. doi:10.1002/2013jg002527
Iversen, C. M., Childs, J., Norby, R. J., Ontl, T. A., Kolka, R. K., Brice, D. J., et al. (2018). Fine-root growth in a forested bog is seasonally dynamic, but shallowly distributed in nutrient-poor peat. Plant Soil 424, 123–143. doi:10.1007/s11104-017-3231-z
Jaatinen, K., Fritze, H., Laine, J., and Laiho, R. (2007). Effects of short-and long-term water-level drawdown on the populations and activity of aerobic decomposers in a boreal peatland. Glob. Change Biol. 13, 491–510. doi:10.1111/j.1365-2486.2006.01312.x
Janusz, G., Pawlik, A., Sulej, J., Świderska-Burek, U., Jarosz-Wilkołazka, A., and Paszczyński, A. (2017). Lignin degradation: microorganisms, enzymes involved, genomes analysis and evolution. FEMS Microbiol. Rev. 41, 941–962. doi:10.1093/femsre/fux049
Jassey, V. E., Chiapusio, G., Binet, P., Buttler, A., Laggoun-Défarge, F., DeLarue, F., et al. (2013). Above-and belowground linkages in Sphagnum peatland: climate warming affects plant-microbial interactions. Glob. Change Biol. 19, 811–823. doi:10.1111/gcb.12075
Kaiser, C., Koranda, M., Kitzler, B., Fuchslueger, L., Schnecker, J., Schweiger, P., et al. (2010). Belowground carbon allocation by trees drives seasonal patterns of extracellular enzyme activities by altering microbial community composition in a beech forest soil. New Phytol. 187, 843–858. doi:10.1111/j.1469-8137.2010.03321.x
Kaiser, K., Guggenberger, G., Haumaier, L., and Zech, W. (2001). Seasonal variations in the chemical composition of dissolved organic matter in organic forest floor layer leachates of old-growth Scots pine (Pinus sylvestris L.) and European beech (Fagus sylvatica L.) stands in northeastern Bavaria, Germany. Biogeochemistry 55, 103–143.
Kalbitz, K., Solinger, S., Park, J.-H., Michalzik, B., and Matzner, E. (2000). Controls on the dynamics of dissolved organic matter in soils: a review. Soil Sci. 165, 277–304. doi:10.1097/00010694-200004000-00001
Kane, E. S., Mazzoleni, L. R., Kratz, C. J., Hribljan, J. A., Johnson, C. P., Pypker, T. G., et al. (2014). Peat porewater dissolved organic carbon concentration and lability increase with warming: a field temperature manipulation experiment in a poor-fen. Biogeochemistry 119, 161–178. doi:10.1007/s10533-014-9955-4
Kane, E., Veverica, T., Tfaily, M., Lilleskov, E., Meingast, K., Kolka, R. K., et al. (2019). Reduction-oxidation potential and dissolved organic matter composition in northern peat soil: interactive controls of water table position and plant functional groups. J. Geophys. Res. Biogeosciences 124, 3600–3617. doi:10.1029/2019jg005339
Keil, R. G., and Kirchman, D. L. (1991). Dissolved combined amino acids in marine waters as determined by a vapor-phase hydrolysis method. Mar. Chem. 33, 243–259. doi:10.1016/0304-4203(91)90070-d
Kim, S., Kramer, R. W., and Hatcher, P. G. (2003). Graphical method for analysis of ultrahigh-resolution broadband mass spectra of natural organic matter, the van Krevelen diagram. Anal. Chem. 75, 5336–5344. doi:10.1021/ac034415p
Kraus, T. E., Dahlgren, R. A., and Zasoski, R. J. (2003). Tannins in nutrient dynamics of forest ecosystems-a review. Plant Soil 256, 41–66. doi:10.1023/a:1026206511084
Kutlán, D., Presits, P., and Molnár-Perl, I. (2002). Behavior and characteristics of amine derivatives obtained with o-phthaldialdehyde/3-mercaptopropionic acid and with o-phthaldialdehyde/N-acetyl-l-cysteine reagents. J. Chromatogr. A 949, 235–248. doi:10.1016/s0021-9673(01)01610-7
Laine, M. P., Strömmer, R., and Arvola, L. (2013). Nitrogen release in pristine and drained peat profiles in response to water table fluctuations: a mesocosm experiment. Appl. Environ. Soil Sci. 2013, 694368. doi:10.1155/2013/694368
Lamit, L. J., Romanowicz, K. J., Potvin, L. R., Rivers, A. R., Singh, K., Lennon, J. T., et al. (2017). Patterns and drivers of fungal community depth stratification in Sphagnum peat. FEMS Microbiol. Ecol. 93, fix082. doi:10.1093/femsec/fix082
Leppälä, M., Kukko-Oja, K., Laine, J., and Tuittila, E.-S. (2008). Seasonal dynamics of CO2 exchange during primary succession of boreal mires as controlled by phenology of plants. Ecoscience 15, 460–471. doi:10.2980/15-4-3142
Limpens, J., Berendse, F., Blodau, C., Canadell, J. G., Freeman, C., Holden, J., et al. (2008). Peatlands and the carbon cycle: from local processes to global implications – a synthesis. Biogeosciences 5, 1475–1491. doi:10.5194/bg-5-1475-2008
Lin, X., Green, S., Tfaily, M., Prakash, O., Konstantinidis, K., Corbett, J., et al. (2012). Microbial community structure and activity linked to contrasting biogeochemical gradients in bog and fen environments of the Glacial Lake Agassiz Peatland. Appl. Environ. Microbiol. 78, 7023–7031. doi:10.1128/aem.01750-12
Lv, J. T., Zhang, S. Z., Luo, L., and Cao, D. (2016). Solid-phase extraction-stepwise elution (SPE-SE) procedure for isolation of dissolved organic matter prior to ESI-FT-ICR-MS analysis. Anal. Chim. Acta 948, 55–61. doi:10.1016/j.aca.2016.10.038
Marschner, B., and Kalbitz, K. (2003). Controls of bioavailability and biodegradability of dissolved organic matter in soils. Geoderma 113, 211–235. doi:10.1016/s0016-7061(02)00362-2
Meingast, K. M., Falkowski, M. J., Kane, E. S., Potvin, L. R., Benscoter, B. W., Smith, A. M. S., et al. (2014). Spectral detection of near-surface moisture content and water-table position in northern peatland ecosystems. Remote Sens. Environ. 152, 536–546. doi:10.1016/j.rse.2014.07.014
Miller, R. M., Smith, C. I., Jastrow, J. D., and Bever, J. D. (1999). Mycorrhizal status of the genus Carex (Cyperaceae). Am. J. Bot. 86, 547–553. doi:10.2307/2656816
Munir, T., Perkins, M., Kaing, E., and Strack, M. (2015). Carbon dioxide flux and net primary production of a boreal treed bog: responses to warming and water-table-lowering simulations of climate change. Biogeosciences 12, 1091–1111. doi:10.5194/bg-12-1091-2015
Muthukumar, T., Udaiyan, K., and Shanmughavel, P. (2004). Mycorrhiza in sedges—an overview. Mycorrhiza 14, 65–77. doi:10.1007/s00572-004-0296-3
Myklestad, S. M., Skånøy, E., and Hestmann, S. (1997). A sensitive and rapid method for analysis of dissolved mono- and polysaccharides in seawater. Mar. Chem. 56, 279–286. doi:10.1016/s0304-4203(96)00074-6
O'Donnell, J. A., Aiken, G. R., Kane, E. S., and Jones, J. B. (2010). Source water controls on the character and origin of dissolved organic matter in streams of the Yukon River basin, Alaska. J. Geophys. Res. Biogeosciences 115, n/a. doi:10.1029/2009jg001153
Ohno, T., Parr, T. B., Gruselle, M. C., Fernandez, I. J., Sleighter, R. L., and Hatcher, P. G. (2014). Molecular composition and biodegradability of soil organic matter: a case study comparing two new England forest types. Environ. Sci. Technol. 48, 7229–7236. doi:10.1021/es405570c
Olsrud, M., and Christensen, T. R. (2004). Carbon cycling in subarctic tundra; seasonal variation in ecosystem partitioning based on in situ 14C pulse-labelling. Soil Biol. Biochem. 36, 245–253. doi:10.1016/j.soilbio.2003.08.026
Peltoniemi, K., Fritze, H., and Laiho, R. (2009). Response of fungal and actinobacterial communities to water-level drawdown in boreal peatland sites. Soil Biol. Biochem. 41, 1902–1914. doi:10.1016/j.soilbio.2009.06.018
Perotto, S., Daghino, S., and Martino, E. (2018). Ericoid mycorrhizal fungi and their genomes: another side to the mycorrhizal symbiosis? New Phytol. 220, 1141–1147. doi:10.1111/nph.15218
Piccolo, A., and Conte, P. (2000). Molecular size of humic substances. Supramolecular associations versus macromolecular polymers. Adv. Environ. Res. 3, 508–521.
Porcal, P., Dillon, P. J., and Molot, L. A. (2013). Seasonal changes in photochemical properties of dissolved organic matter in small boreal streams. Biogeosciences 10, 5533–5543. doi:10.5194/bg-10-5533-2013
Proctor, C., and He, Y. (2017). Quantifying root extracts and exudates of sedge and shrub in relation to root morphology. Soil Biol. Biochem. 114, 168–180. doi:10.1016/j.soilbio.2017.07.006
Read, D. J., Leake, J. R., and Perez-Moreno, J. (2004). Mycorrhizal fungi as drivers of ecosystem processes in heathland and boreal forest biomes. Can. J. Bot. 82, 1243–1263. doi:10.1139/b04-123
Reddy, K. R., and Delaune, R. D. (2008). Biogeochemistry of wetlands: science and applications. Boca Raton: CRC Press.
Romanowicz, K. J., Kane, E. S., Potvin, L. R., Daniels, A. L., Kolka, R. K., and Lilleskov, E. A. (2015). Understanding drivers of peatland extracellular enzyme activity in the PEATcosm experiment: mixed evidence for enzymic latch hypothesis. Plant Soil 397, 371–386. doi:10.1007/s11104-015-2746-4
Rouse, W. R., Douglas, M. S. V., Hecky, R. E., Hershey, A. E., Kling, G. W., Lesack, L., et al. (1997). Effects of climate change on the freshwaters of arctic and subarctic north America. Hydrol. Process. 11, 873–902. doi:10.1002/(sici)1099-1085(19970630)11:8<873::aid-hyp510>3.0.co;2-6
Scarpelli, T. (2016). The role of amino acids in the nitrogen cycle of peatlands. Houghton, MI: Michigan Technological University. Open Access Master's Thesis.
Schmidt, S., Costello, E., Nemergut, D., Cleveland, C. C., Reed, S., Weintraub, M., et al. (2007). Biogeochemical consequences of rapid microbial turnover and seasonal succession in soil. Ecology 88, 1379–1385. doi:10.1890/06-0164
Schnecker, J., Wild, B., Hofhansl, F., Eloy Alves, R. J., Bárta, J., Čapek, P., et al. (2014). Effects of soil organic matter properties and microbial community composition on enzyme activities in cryoturbated arctic soils. PLoS ONE 9, e94076. doi:10.1371/journal.pone.0094076
Silvan, N., Tuittila, E. S., Vasander, H., and Laine, J. (2004). Eriophorum vaginatum plays a major role in nutrient immobilisation in boreal peatlands. Ann. Bot. Fenn. 41, 189–199.
Singh, S., Inamdar, S., Mitchell, M., and McHale, P. (2014). Seasonal pattern of dissolved organic matter (DOM) in watershed sources: influence of hydrologic flow paths and autumn leaf fall. Biogeochemistry 118, 321–337. doi:10.1007/s10533-013-9934-1
Sloan, V. L., Fletcher, B. J., and Phoenix, G. K. (2016). Contrasting synchrony in root and leaf phenology across multiple sub-Arctic plant communities. J. Ecol. 104, 239–248. doi:10.1111/1365-2745.12506
Steed, J. E., DeWald, L. E., and Kolb, T. E. (2002). Physiological and growth responses of riparian sedge transplants to groundwater depth. Int. J. Plant Sci. 163, 925–936. doi:10.1086/342634
Stumpf, P. K. (2014). Lipids: structure and function: the biochemistry of plants. New York: Elsevier.
Sundh, I., Nilsson, M., and Borga, P. (1997). Variation in microbial community structure in two boreal peatlands as determined by analysis of phospholipid fatty acid profiles. Appl. Environ. Microbiol. 63, 1476–1482. doi:10.1128/aem.63.4.1476-1482.1997
Tarnocai, C., Canadell, J. G., Schuur, E. A. G., Kuhry, P., Mazhitova, G., and Zimov, S. (2009). Soil organic carbon pools in the northern circumpolar permafrost region. Glob. Biogeochem. Cycles 23, GB2023. doi:10.1029/2008gb003327
Teixeira, M. C., Azevedo, J. C. R. D., and Pagioro, T. A. (2011). Spatial and seasonal distribution of chromophoric dissolved organic matter in the Upper Paraná River floodplain environments (Brazil). Acta Limnol. Bras. 23, 333–343. doi:10.1590/s2179-975x2012005000011
Tfaily, M. M., Hamdan, R., Corbett, J. E., Chanton, J. P., Glaser, P. H., and Cooper, W. T. (2013). Investigating dissolved organic matter decomposition in northern peatlands using complimentary analytical techniques. Geochimica Cosmochimica Acta 112, 116–129. doi:10.1016/j.gca.2013.03.002
Trettin, C., Laiho, R., Minkkinen, K., and Laine, J. (2006). Influence of climate change factors on carbon dynamics in northern forested peatlands. Can. J. Soil Sci. 86, 269–280. doi:10.4141/s05-089
Turetsky, M. R., Crow, S. E., Evans, R. J., Vitt, D. H., and Wieder, R. K. (2008). Trade-offs in resource allocation among moss species control decomposition in boreal peatlands. J. Ecol. 96, 1297–1305. doi:10.1111/j.1365-2745.2008.01438.x
Veverica, T. J., Kane, E. S., Marcarelli, A. M., and Green, S. A. (2016). Ionic liquid extraction unveils previously occluded humic-bound iron in peat soil pore water. Soil Sci. Soc. Am. J. 80, 771–782. doi:10.2136/sssaj2015.10.0377
Walker, D., and Bier, A. W. (2009). Oxidation reduction potential: Understanding a challenging measurement. Lit. No. 2070, Hach, Loveland, CO.
Walker, T. N., Ward, S. E., Ostle, N. J., and Bardgett, R. D. (2015). Contrasting growth responses of dominant peatland plants to warming and vegetation composition. Oecologia 178, 141–151. doi:10.1007/s00442-015-3254-1
Wilson, H. F., Saiers, J. E., Raymond, P. A., and Sobczak, W. V. (2013). Hydrologic drivers and seasonality of dissolved organic carbon concentration, nitrogen content, bioavailability, and export in a forested new England stream. Ecosystems 16, 604–616. doi:10.1007/s10021-013-9635-6
Wilson, R., Hopple, A., Tfaily, M., Sebestyen, S., Schadt, C., Pfeifer-Meister, L., et al. (2016). Stability of peatland carbon to rising temperatures. Nat. Commun. 7, 13723. doi:10.1038/ncomms13723
Keywords: porewater, sedge, ericaceae, dissolved organic matter, molecular biogeochemistry
Citation: Song Z, Khaksari M, Lilleskov EA, Kane ES and Doskey PV (2025) Seasonal effects of plant functional groups on molecular biogeochemistry of dissolved organic matter in porewater of a poor fen. Front. Environ. Sci. 13:1549320. doi: 10.3389/fenvs.2025.1549320
Received: 20 December 2024; Accepted: 17 March 2025;
Published: 07 April 2025.
Edited by:
Wei He, China University of Geosciences, ChinaReviewed by:
Zhao-Jun Bu, Northeast Normal University, ChinaZachary E. Kayler, University of Idaho, United States
Musong Chen, Nanjing Institute of Geography and Limnology (CAS), China
Copyright © 2025 Song, Khaksari, Lilleskov, Kane and Doskey. This is an open-access article distributed under the terms of the Creative Commons Attribution License (CC BY). The use, distribution or reproduction in other forums is permitted, provided the original author(s) and the copyright owner(s) are credited and that the original publication in this journal is cited, in accordance with accepted academic practice. No use, distribution or reproduction is permitted which does not comply with these terms.
*Correspondence: Paul V. Doskey, cHZkb3NrZXlAbXR1LmVkdQ==