 Gamze Sart
 Yılmaz Bayar
 Funda H. Sezgin
 Marina Danilina
 Eray Karagöz6
- 1Department of Educational Sciences, Hasan Ali Yucel Faculty of Education, Istanbul University-Cerrahpaşa, Istanbul, Türkiye
- 2Department of Public Finance, Bandirma Onyedi Eylül University, Balikesir, Türkiye
- 3Department of Industrial Engineering, Istanbul University-Cerrahpasa, Istanbul, Türkiye
- 4Department of Economics, Plekhanov Russian University of Economics (PRUE), Moscow, Russia
- 5Department of Economics, Financial University under the Government of the Russian Federation, Moscow, Russia
- 6Consulta Labor and Social Security Legislation Consultancy, Istanbul, Türkiye
Environmental impairment has become one of the leading global concerns since the 1950s, and the drivers of increasing global CO2 emissions have begun to be explored extensively. This study investigates the short and long term effects of the shadow economy, life expectancy, education, and income on CO2 emissions in the BRICS countries during the 1993–2020 period, accounting for cross-sectional dependence and heterogeneity using second-generation cointegration tests, the augmented mean group (AMG) estimator, and causality tests. The results of the causality test reveal a unidirectional causality from the shadow economy, education, and income to CO2 emissions and a bidirectional causal nexus between life expectancy and CO2 emissions. The results of the AMG estimation show that the shadow economy, life expectancy, and income positively affect CO2 emissions in BRICS countries, while improvements in education negatively impact CO2 emissions. Therefore, institutional and legal arrangements to combat the shadow economy would be beneficial in decreasing CO2 emissions.
1 Introduction
Environmental pollution has become a serious threat to the global community and has a negative impact on societies’ quality of life. In this context, environmental pollution can impact climate, labor productivity, industrial production, and economic development; decrease living standards; and cause health problems (Borhan et al., 2018; Pervaiz et al., 2021). Nowadays, increases in greenhouse gas emissions have become one of the crucial causes of global health problems through environmental degradation (Zhang et al., 2018). In this regard, CO2 emissions are the most dominant greenhouse gas that harms the environment and human health (Khan et al., 2018).
The prevalent economic and health implications of increasing global CO2 emissions have led countries and international institutions to prioritize reducing CO2 emissions. Furthermore, environmental sustainability is one of the major pillars of sustainable development in the scope of the 2030 Agenda for Sustainable Development, accepted by all United Nations (UN) Member States in 2015 (UN, 2024). In this context, unveiling the drivers of CO2 emissions has become critical for formulating policies aimed at reducing CO2 emissions. The associated empirical literature has documented numerous economic, social, and institutional factors, such as income, poverty, institutions, urbanization, population, energy use, renewable energy use, technological progress, tourism, trade openness, financial development, and foreign direct investments, as the drivers of CO2 emissions, as summarized in Table 1. The empirical results have usually documented a negative effect of institutional development, technological progress, and renewable energy use on CO2 emissions but a positive effect of poverty, energy use, and tourism on CO2 emissions. In this context, high costs, insufficient infrastructure, energy storage, recyclability, and environmental awareness are the major barriers to the renewable energy transition (Tvaronavičienė, 2024; Massoud et al., 2023). On the other hand, the effects of income, urbanization, trade, financial development, and foreign direct investments on CO2 emissions have varied depending on the socio-economic development levels of the countries.
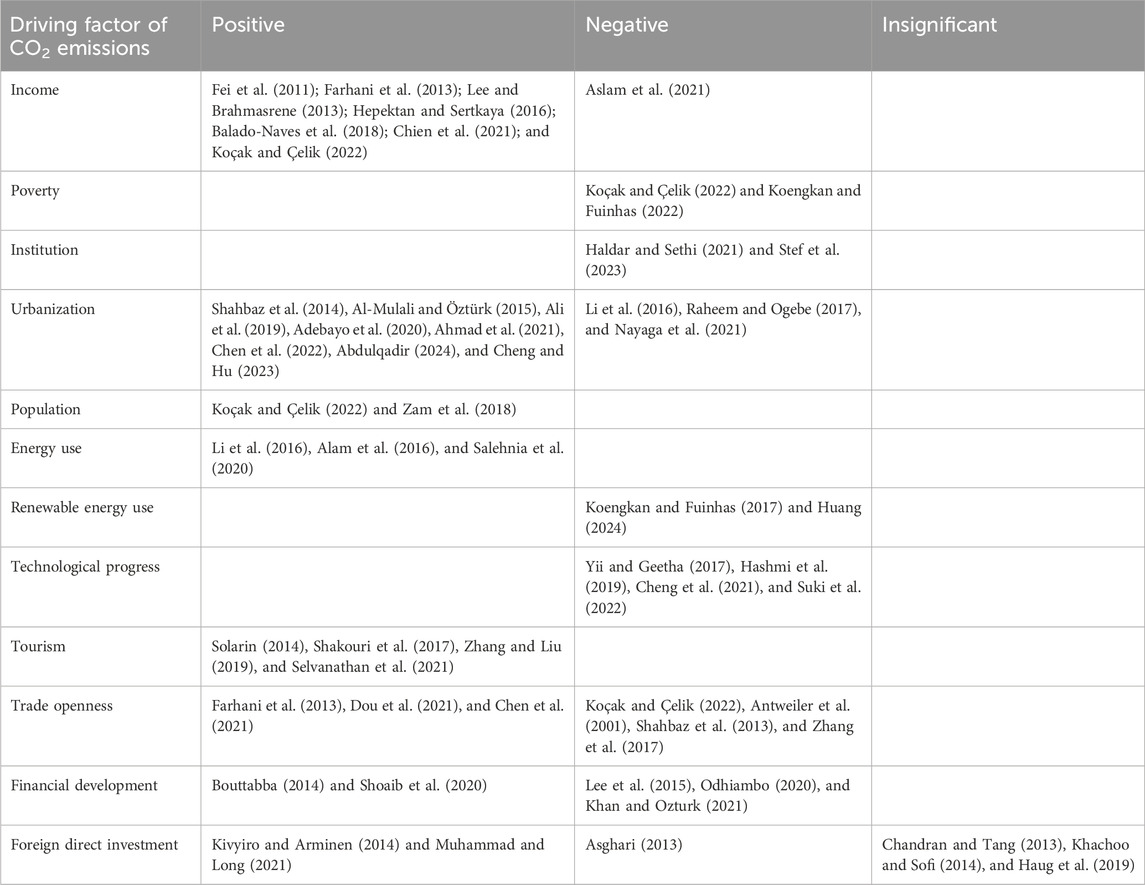
Table 1. Driving factors of CO2 emissions.
This empirical study investigates the effects of the shadow economy and human development indicators on CO2 emissions in the BRICS countries regarding the limited literature. Excessive tax burden and governmental business regulations are among the major factors underlying the shadow economy (Arsić et al., 2015). Therefore, some firms may shift to unregistered production to avoid the costs associated with environmental taxes, and in turn, increases in the shadow economy may negatively impact the environment (Chen et al., 2018). Furthermore, unregistered firms can also negatively affect the environment due to their tendencies toward non-compliance with environmental regulations (Biswas et al., 2011). However, unregistered companies usually operate on a small scale due to structural factors, including financial constraints and an unfavorable business environment (Elgin and Oztunali, 2014; Morrrisson and Mead, 1996). Therefore, unregistered companies are not expected to contribute to environmental impairment due to their small production scale and low capital intensity unlike formal companies (Antweiler et al., 2001). In conclusion, the influence of the shadow economy on CO2 emissions is unclear in theoretical terms.
In this research, human development is proxied by the Human Development Index (HDI), which is based on the life expectancy index (LIFI, a long and healthy life), education index (EDI, being knowledgeable), and the index of gross national income (GNI) per capita (standard of living) (UNDP, 2024a). In this regard, the HDI is an indicator reflecting progress in these key dimensions and highlights that people and their capabilities should be the primary measure for evaluating a country’s development rather than economic growth (Elgin and Oztunali, 2014). Therefore, this study investigates the effect of each main dimension of the HDI on CO2 emissions, differing from the extensive number of empirical studies that analyze the nexus between GDP per capita/HDI and CO2 emissions. On one hand, health and education are significant factors underlying human capital, one of the main determinants of the GNI. On the other hand, GNI is an indispensable requirement for both education and health (Kim et al., 2019).
Increases in life expectancy indicate that people affect the environment longer through consumption and production, and thus, the effect of life expectancy on the environment differs depending on countries’ socio-economic development levels. However, researchers have usually analyzed the influence of CO2 emissions on life expectancy (Matthew et al., 2020; Ibrahim, 2022), but the influence of increases in life expectancy on the environment has not been explored in the existing empirical literature.
On the other hand, education can also impact the environment because persons with relatively higher education levels usually have greater environmental awareness, are more compliant with environmental rules, and tend to adopt low-carbon lifestyles and business practices (Bano et al., 2018; Cui et al., 2024). Furthermore, education can contribute to the development of green technologies and renewable energy technologies by enhancing human capital (Teixeira and Queirós, 2016; Wang et al., 2021). Therefore, educational investments are crucial instruments in curbing CO2 emissions (Razzaq et al., 2021; Dong et al., 2024). Finally, the nexus between income and the environment has usually been examined in the context of the Environmental Kuznets Curve (EKC), which suggests that environmental impairment increases with income up to a certain threshold, after which further increases in income are associated with decreases in environmental impairment (Grossman and Krueger, 1995). Education can also affect CO2 emissions through economic growth and development in the context of the EKC hypothesis.
Based on the above view, this research aims to explore the following research questions:
Does the shadow economy increase or decrease CO2 emissions?
Does the life expectancy increase or decrease CO2 emissions?
Does education increase or decrease CO2 emissions?
Does GNI per capita increase or decrease CO2 emissions?
This research article intends to make two contributions to the associated literature. First, only a few researchers have analyzed the influence of the shadow economy on CO2 emissions, and the relationship between the shadow economy and the environment has remained inconclusive. For this reason, this research would contribute to the limited literature by investigating the nexus between two shadow economy indicators based on dynamic general equilibrium (DGE) and multiple indicators–multiple causes (MIMIC) approaches. The second contribution of this research is to examine the influence of life expectancy on CO2 emissions, in contrast to the extensive literature that focuses on the influence of environmental impairment on life expectancy.
In Section 2, the literature on the relationship between the shadow economy, human development, and CO2 emissions is outlined, and the methodological approach of the research is provided in Section 3. Section 4 includes the results of econometric tests, and discussions related to the results are introduced in Section 5.
2 Literature review
The negative worldwide effects of environmental impairment have led researchers to investigate the drivers of increasing CO2 emissions. Therefore, this study examines the interaction between the shadow economy, human development, and CO2 emissions, considering the associated literature. In this context, there have been two main views on the environmental effects of the shadow economy. One view suggests that unregistered firms negatively impact the environment by avoiding the costs of environmental taxes and non-compliance with environmental regulations (Biswas et al., 2011; Elgin and Oztunali, 2014). The other view suggests that unregistered companies are not expected to contribute to environmental degradation due to their small production scale and low capital intensity (Shahbaz et al., 2013). The different findings of the associated empirical literature presented in Table 2 also support these theoretical considerations. On one hand, Biswas et al. (2011), Dada et al. (2021), Pang et al. (2021), Ahad and Imran (2023), and Ahmad and Hussain (2024) revealed a positive interaction between the shadow economy and CO2 emissions, while Nkengfack et al. (2021), Camara (2022), Yu et al. (2022), and Silva et al. (2023) revealed a negative effect of the shadow economy on CO2 emissions. In conclusion, more empirical studies are required to clarify the nexus between the shadow economy and the environment for countries with different socio-economic characteristics.
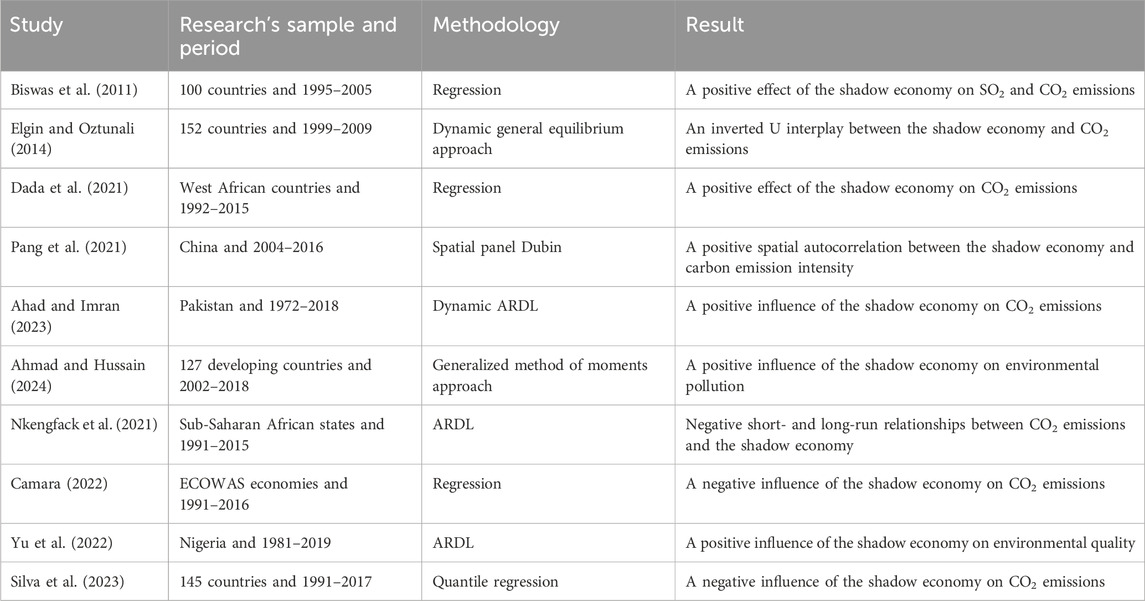
Table 2. Summary of empirical studies on the nexus between the shadow economy and the environment.
Based on the theoretical considerations and the empirical results, the first hypothesis of this research is as follows:
H1. There is a significant relationship between the shadow economy size and CO2 emissions.
The second goal of this study is to analyze the interplay between human development and CO2 emissions. In the relevant literature, on one hand, some researchers have analyzed the relationship between the human development index of UNDP (2024a) and CO2 emissions. On the other hand, some researchers have focused on the relationship between the main components of the human development index, including life expectancy, education, income, and CO2 emissions, as stated below. This research investigates the relationship between each main subcomponent of the human development index and CO2 emissions to observe the effect of HDI’s main dimensions on CO2 emissions. In this context, only Minh and Ly (2023) and Çakır (2023) analyzed the effect of human development and life expectancy on CO2 emissions in Vietnam and E-7 countries, respectively. Minh and Ly (2023) unveiled a positive effect of human development on decreases in CO2 emissions, and Çakır (2023) disclosed a bidirectional causal nexus between life expectancy and CO2 emissions in E-7 countries. Therefore, our research would be one of the first studies investigating the short- and long-term relationship between life expectancy and CO2 emissions.
On the other hand, researchers have generally focused on the effect of environmental pollution on life expectancy, and studies such as those by Ibrahim (2022), Beyene and Kotosz (2021), Osabohien et al. (2021), Bayar et al. (2023), and Saidmamatov et al. (2024) on the nexus between life expectancy and the environment have mainly unveiled a negative effect of CO2 emissions on life expectancy, while Matthew et al. (2020) revealed a positive relationship between CO2 emissions and life expectancy. In this context, Ibrahim (UNDP, 2024a) explored the relationship between fossil fuels, carbon emissions, human capital, and healthy life expectancy in selected oil-abundant African economies during the 1980–2019 period through quantile regression, augmented mean group (AMG) estimators, and common correlated effect mean group (CCEMG) estimators and discovered a negative effect of carbon emissions on life expectancy. Beyene and Kotosz (2021) also examined the effect of environmental quality on life expectancy in African countries during the 2000–2016 period using ARDL and regression approaches and disclosed a negative effect of environmental impairment on life expectancy.
Osabohien et al. (2021) explored the association between CO2 emissions and life expectancy in Nigeria between 1980 and 2017 via the ARDL approach and revealed a negative influence of CO2 emissions on life expectancy. On the other hand, Bayar et al. (2023) analyzed the empirical relationship between greenhouse gas emissions and life expectancy in the transition economies of the EU for the 2000–2017 period via causality and cointegration tests. They revealed a one-way causal relationship from greenhouse gas emissions to population health, with a negative effect observed in Romania, Lithuania, Croatia, and Bulgaria. Saidmamatov et al. (2024) also researched the influence of CO2 emissions on life expectancy in the Aral Sea Basin for the 2002–2020 period through regression and discovered a negative effect of CO2 emissions on life expectancy in the region. Finally, Matthew et al. (2020) explored the nexus between CO2 emissions and life expectancy in West Africa for the 2000–2018 period using the regression approach and discovered a positive relationship between CO2 emissions and life expectancy.
Based on the theoretical considerations and the empirical results, the second hypothesis of this research is as follows:
H2. There is a significant relationship between life expectancy and CO2 emissions.
Education is the second main component of the human development index and has the potential to impact CO2 emissions through multiple channels, such as improving environmental awareness, increasing compliance with environmental regulations, and contributing to the development of green technologies. However, education can negatively affect CO2 emissions via economic growth and development in the context of the EKC hypothesis. The related empirical literature including Kim and Go (2020), Yao et al. (2020), Demircan Çakar et al. (2021), Liu et al. (2022), and Hondroyiannis et al. (2022) indicated that improvements in education decrease CO2 emissions, while Li and Zhou (2019) and Zafar et al. (2022) discovered a positive effect of education on CO2 emissions.
Kim and Go (2020) investigated the effect of human capital on environmental performance in a panel of 72 countries using a regression approach and revealed a positive effect of education on environmental performance. Yao et al. (2020) also explored the effect of human capital on CO2 emissions in OECD members for the 1870–2014 period using the STIRPAT model and disclosed a negative effect of improvements in human capital on CO2 emissions.
Demircan Çakar et al. (2021) also examined the association between environmental impairment and human capital in 21 EU members for the 1994–2018 period through panel smooth transition regression and disclosed a positive environmental effect of improvements in human capital. Liu et al. (2022) analyzed the influence of education on CO2 emissions in the BRICS economies for the 1991–2019 period using the NARDL approach and unveiled a negative effect of education on CO2 emissions.
Hondroyiannis et al. (2022) also examined the effect of governmental education expenditures on environmental impairment in OECD economies during the 1980–2019 period using quantile regression and revealed that increases in governmental education expenditures reduced CO2 emissions. Zafar et al. (2022) researched the drivers of CO2 emissions in 22 top remittance-receiving countries across the 1986–2017 period using the Westerlund and Edgerton cointegration test and revealed a positive effect of education on CO2 emissions. Finally, Sart et al. (2022) examined the causal nexus between economic freedom, education, and CO2 emissions in the EU member states and discovered a bidirectional causality between education and CO2 emissions at the panel level; a unidirectional causality from education to CO2 emissions in Italy, the Netherlands, Poland, Portugal, Spain, and Sweden; and a unilateral causality from CO2 emissions to education in Belgium, Denmark, Ireland, and Latvia.
Based on the theoretical considerations and the empirical findings, the third hypothesis of this research is as follows:
H3. There is a significant relationship between education and CO2 emissions.
The interplay between income and the environment in the context of the EKC hypothesis has been one of the most explored issues in environmental economics. However, the related empirical literature has remained inconclusive. Within this scope, Akbostancı et al. (2009) disclosed an inverted U interaction between income and the environment proxied by CO2 emissions for Türkiye. On the other hand, Awan and Azam (2022) revealed an N interaction between income and CO2 emissions for G20 countries. Moreover, Aslam et al. (2021) revealed that GDP per capita increased CO2 emissions in the long term in China. Similarly, Georgescu et al. (2024) also disclosed a positive effect of GDP per capita on CO2 emissions in European countries. Furthermore, Fei et al. (2011), Farhani et al. (2013), Lee and Brahmasrene (2013), Hepektan and Sertkaya (2016), Balado-Naves et al. (2018), and Chien et al. (2021) unveiled a positive effect of income on CO2 emissions.
Furthermore, Wang (2018) investigated the relationship between economic growth and CO2 emissions in the top 20 emitters in the world during the 1990–2015 period using cointegration and causality tests and revealed a unilateral causality from economic growth to CO2 emissions in the developed countries and a unilateral causality from CO2 emissions to economic growth in the developing countries. Wang et al. (2020) also analyzed the causal interplay between economic factors and CO2 emissions in China during the 1997–2015 period using the VAR model and discovered a unilateral causality from GDP per capita to CO2 emissions in central and eastern provinces and a unilateral causality from CO2 emissions to GDP per capita in western provinces. Balli et al. (2020) also disclosed a unidirectional causality from GDP per capita to CO2 emissions for Turkiye.
Based on the theoretical considerations and the empirical findings, the fourth hypothesis of this research is as follows:
H4. There is a significant relationship between income and CO2 emissions.
Some researchers, such as Pîrlogea (2012), Asongu and Odhiambo (2018), Akbar et al. (2021), and Adekoya et al. (2021), have investigated the effect of CO2 emissions on overall human development and usually revealed a negative effect of CO2 emissions on human development. However, Ezako (2024) revealed a positive effect of carbon emissions on human development.
Pîrlogea (2012) examined the interplay among renewable energy and fossil fuel use, human development, energy intensity, and carbon dioxide intensity in Romania, Bulgaria, Portugal, Poland, Ireland, and the Netherlands during the 1997–2008 period using the regression approach and found that the increases in carbon emissions decreased the human development in Romania, Bulgaria, and Poland. Asongu and Odhiambo (2018) also examined the effect of CO2 emissions on human development in Sub-Saharan African states for the 2000–2012 duration via Tobit regression and revealed a negative influence of CO2 emissions on human development.
Akbar et al. (2021) analyzed the relationship among health expenditures, CO2 emissions, and human development in 33 OECD economies during the 2006–2016 period using PVAR and found a negative relationship between CO2 and human development. Adekoya et al. (2021) also examined the effect of CO2 emissions on human development in 126 countries for the 2000–2014 period using the regression approach and found a positive relationship between CO2 emissions and human development. Finally, Ezako (2024) analyzed the nexus between CO2 emissions and human development in 56 developing countries across the 2005–2019 period using cross-sectionally augmented ARDL and the augmented mean group estimator and found a positive effect of CO2 emissions on human development.
Both theoretical views and empirical findings on the nexus between the shadow economy and CO2 emissions have already remained inconclusive. Therefore, the main motivation behind this study is to analyze the interplay between different indicators of the shadow economy and CO2 emissions in the BRICS countries, which have been key drivers of the global economy in recent years. On the other hand, the HDI, rather than GDP per capita, is a more comprehensive indicator of a country’s economic development. For this reason, we also include the main dimensions of the HDI (health, education, and GNI per capita) in the empirical analyses to analyze the interplay between human development and CO2 emissions.
3 Data and methodology
This research explores the nexus between the shadow economy, human development indicators, including life expectancy, education, and gross national income per capita, and CO2 emissions in the BRICS countries. The variables of this empirical study are presented in Table 3. CO2 emissions (metric tons per capita) represent the dependent variable and are obtained from World Bank (2024). The explanatory variable of the shadow economy is proxied by the shadow economy size based on multiple indicators–multiple causes (MIMIC) and dynamic general equilibrium (DGE) approaches and calculated by Elgin et al. (2021) using the MIMIC method developed by Schneider et al. (2010). The MIMIC approach is based on structural equation models (SEMs) because SEM analyzes the relationships among unobserved variables with reference to the relationships among the observed variables using the covariance information of the observable variables (Schneider et al., 2010). In this context, the unobserved variable is associated with the observed indicator variables in a factor analytical model, and the relationships between the observed explanatory (causal) variables and the unobserved variable are determined using a structural model (Schneider et al., 2010). In summary, the MIMIC model verifies the relationships between the shadow economy (latent variable) and its causes and indicators, and the estimated parameters are then used to measure the size of the shadow economy. On the other hand, the DGE approach calculates the shadow economy size by examining how households optimize labor allocation between the formal and informal economies in every period and how this allocation varies over time (Elgin and Oztunali, 2012). Finally, human development is represented by the life expectancy index, education index, and index of GNI per capita, and the data are obtained from UNDP (2024a) [see UNDP (2024b) for methodological details] because many researchers, such as Asongu and Odhiambo (2018), Akbar et al. (2021), Adekoya et al. (2021), and Ezako (2024), have also used the human development index of UNDP (2024a) and its main components as proxies for human development.
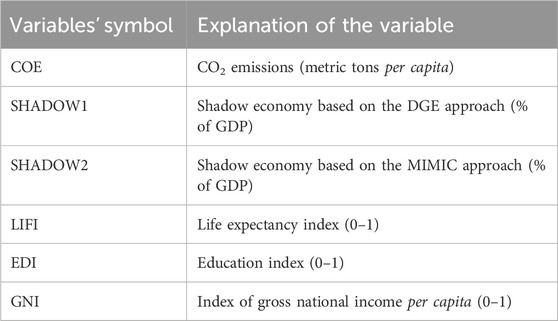
Table 3. Dataset of the research.
The influence of shadow economy indicators and components of human development on CO2 emissions is examined in the BRICS countries. The indicators of the shadow economy are available between 1993 and 2020. Therefore, econometric analyses are performed during the 1993–2020 period using STATA 17.0. Table 4 provides the summary statistics of the shadow economy and human development indicators. The arithmetic means of COE, SHADOW1, SHADOW2, LIFI, EDI, and GNI are 5.282 metric tons per capita, 26.592% of GDP, 29.088% of GDP, 0.738, 0.607, and 0.681 out of 1, respectively. However, shadow economy indicators and CO2 emissions show a remarkable variation among the BRICS countries.
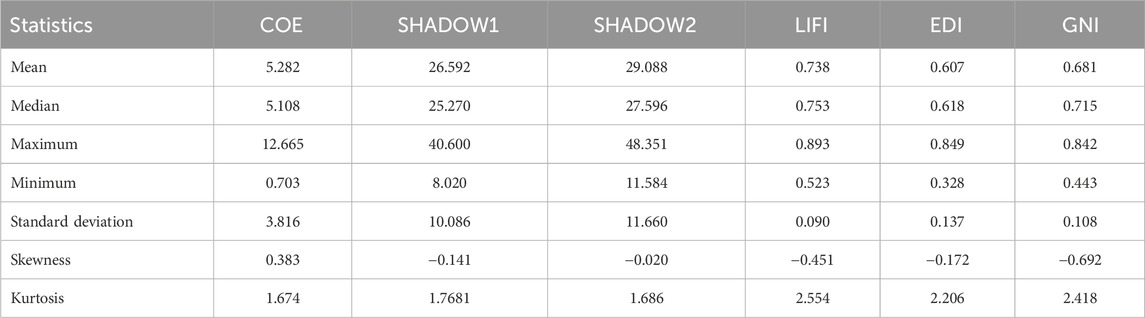
Table 4. Panel-level summary statistics in the BRICS countries (1993–2020).
The series of CO2 emissions, shadow economy, life expectancy, education, and GNI per capita are displayed in Figure 1. Figure 1 also shows a significant heterogeneity in the BRICS countries, especially in terms of CO2 emissions (metric tons per capita) and shadow economy size. In addition, the life expectancy indices of Brazil, China, India, and Russia appear to be converging, while the life expectancy index of South Africa is significantly lower than that of other BRICS countries. However, both the education index and the index of gross national income per capita of India exhibit a significant divergence from the remaining BRICS countries.
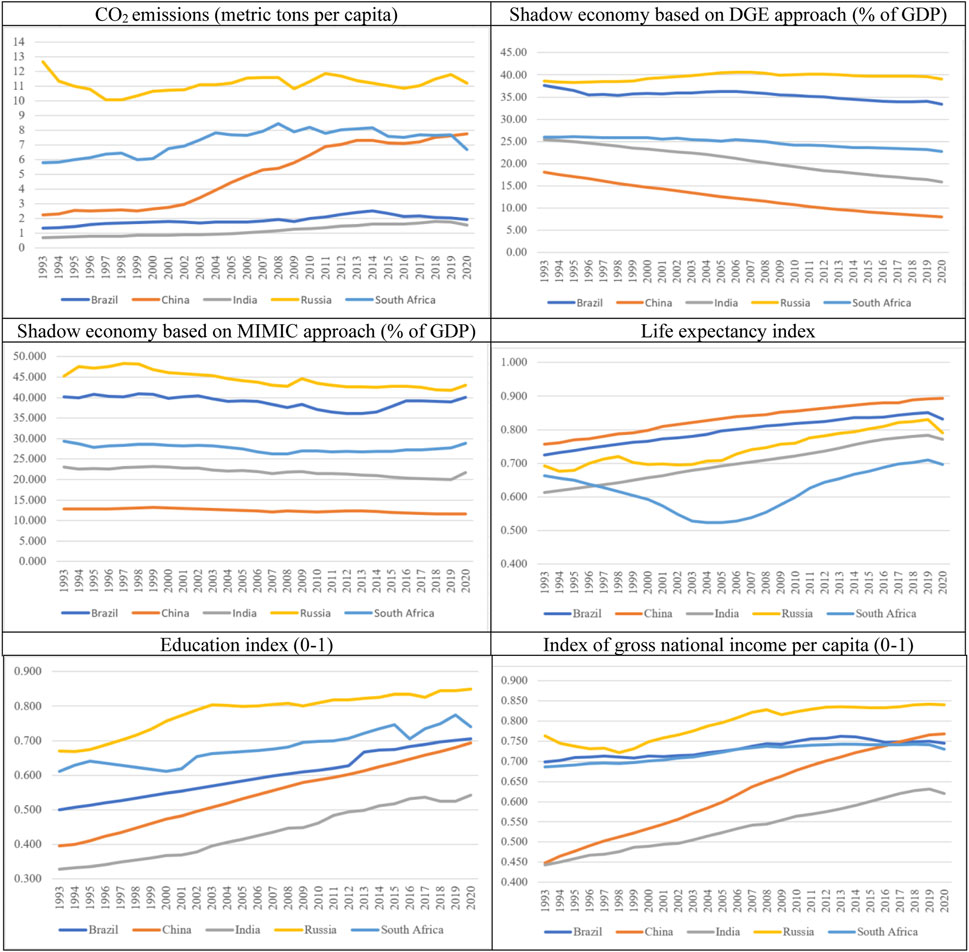
Figure 1. CO2 emissions, shadow economy, and human development indicators in the BRICS countries (1993–2020). (World Bank, 2024; Elgin et al., 2021; UNDP, 2024a)
The influence of the shadow economy and main components of human development on CO2 emissions in the BRICS countries is explored within the scope of the models introduced in Equations 1, 2, using the second-generation cointegration and causality tests. The related empirical literature has typically used econometric approaches based on regression, as depicted in the literature review section. However, this study uses causality and cointegration tests compatible with the panel dataset’s characteristics because the causality test enables us to perform a two-way analysis between variables and cointegration tests and allows us to observe whether the series under consideration move together or display a common long-term trend. Finally, the use of the AMG estimator by Eberhart and Bond (2009) allows for country-level analysis that differs from conventional regression methods. In the analyses, the explained variable is CO2 emissions per capita (COEs), and explanatory variables are shadow economy (SHADOW1 and SHADOW2) and human development indicators (LIFI, EDI, and GNI).
where i proxies BRICS countries, while t represents the years between 1993 and 2020.
The methodological approach of the study is presented in Figure 2. In this regard, tests of cross-sectional dependence (CD) and homogeneity are first performed for the specification of the appropriate unit root, cointegration, and causality tests. CD refers to a situation in which a negative or positive shock in any of the BRICS countries impacts the other countries and may cause biased and inconsistent results (Sarafidis and Wansbeek, 2010). On the other hand, homogeneity or heterogeneity of slope coefficients is another important issue in panel econometrics because assuming that the slope coefficients are homogeneous can cause country-specific differences to be ignored (Gündüz, 2017).
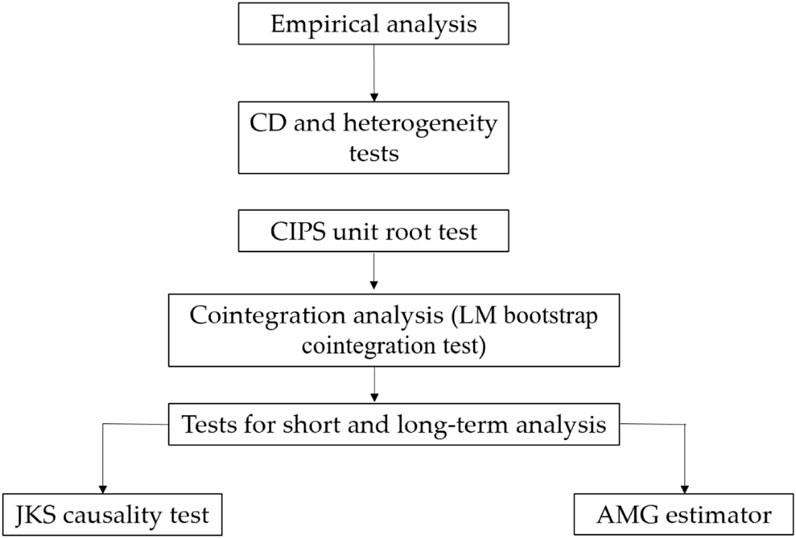
Figure 2. Methodological approach of the study.
In this context, the stationarity of the series is analyzed using the CIPS test of Pesaran (2007) due to CD among the variables. Then, the cointegration relationship among indicators of the shadow economy, human development indicators, and CO2 emissions is examined using the LM cointegration test of Westerlund and Edgerton (2007). The LM cointegration test of Westerlund and Edgerton (2007) allows for dependence both between and within the cross-sections in the cointegration equation, and the test is proven to be efficient in small datasets (Westerlund and Edgerton, 2007). In conclusion, the LM cointegration test of Westerlund and Edgerton (2007) is selected considering the presence of CD and our dataset size. The test is derived from Equation 3.
where
In Equations 3, 4, i and t represent the BRICS countries and the years of the panel, respectively.
In Equation 5,
The AMG estimator, introduced by Eberhart and Bond (2009), is used to estimate the panel and cross-sections’ cointegration coefficients. This estimator accounts for CD and heterogeneity and provides coefficients for both the panel and individual BRICS economies. The estimation using the AMG method is implemented in two stages. In the first stage, the model is estimated using the first differences of the variables, as shown in Equation 6, because non-stationary series and unobservable factors can lead to biased results when using level values in regression analysis. Thus, time-dummy variables of
where
In the second stage, the model in Equation 6 is estimated. The time-dummy variable is incorporated in the regression of each country. AMG estimations are calculated as the average of each cross-section coefficient, as shown in Equation 7 (Eberhart and Bond, 2009).
where
Finally, the causal nexus among CO2 emissions, indicators of the shadow economy, and human development indicators is analyzed using the Juodis–Karavias–Sarafidis (JKS) (Juodis et al., 2021) causality test. The JKS causality test considers heterogeneity and robustness under the subsistence of CD (Juodis et al., 2021). In addition, the JKS causality test benefits from the half-panel jackknife (HPJ) method by Dhaene and Jochmans (2015) to reduce Nickell Bias and, in turn, improves the robustness of test outcomes.
4 Empirical analysis and discussion
In this section, CD and delta tilde tests in Tables 5, 6 are performed to reveal the availability of heterogeneity and CD. The availability of CD among the series in models 1 and 2 defined in Equations 1, 2 is explored using LMadj., LM CD, and LM tests, and the results of these tests are displayed in Table 5. The probability values of these tests are lower than 5%, and in turn, the null hypothesis of CD independence is not accepted for models 1 and 2. In conclusion, CD among these series in models 1 and 2 is revealed.
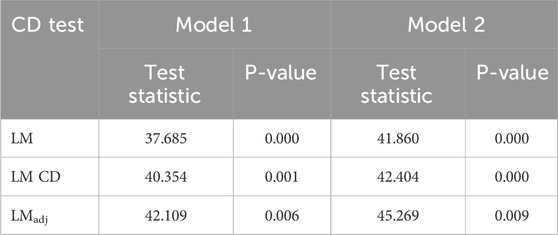
Table 5. Results of LM, LM CD, and LMadj. tests.
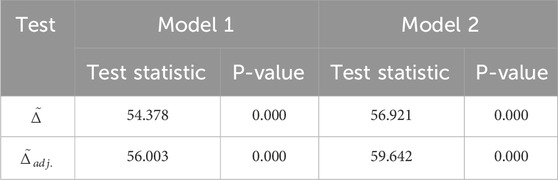
Table 6. Results of delta and adjusted delta tests.
The delta and adjusted delta tests are used to explore the availability of homogeneity in models 1 and 2, and the results of these tests are displayed in Table 6. The null hypothesis of homogeneity’s presence is rejected for models 1 and 2, and in turn, the availability of heterogeneity is specified in models 1 and 2.
The CIPS unit root test of Pesaran (2007) is performed to analyze the stationarity of COE, SHADOW1, SHADOW2, LIFI, EDI, and GNI, owing to the presence of CD in models 1 and 2, and the results of the CIPS test are exhibited in Table 7. The results in Table 7 indicate that COE, SHADOW1, SHADOW2, LIFI, EDI, and GNI are non-stationary, but the first-differenced values of these variables have become stationary. In conclusion, all series are found to be I(1). Therefore, the results of the unit root test are important for selecting the appropriate cointegration test, estimator, and causality test.
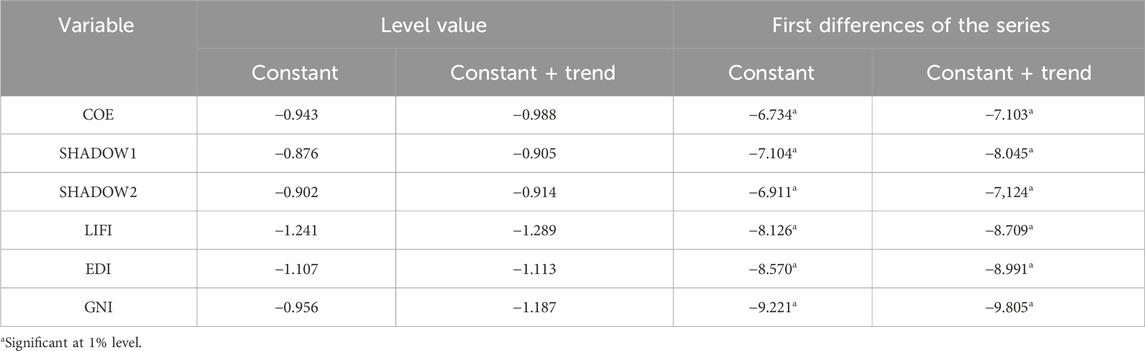
Table 7. Results of the CIPS unit root test.
The cointegration relationship among shadow economy indicators, human development indicators, and CO2 emissions is investigated using the LM cointegration test of Westerlund and Edgerton (2007). Test statistics and bootstrap and asymptotic p-values of the cointegration test are presented in Table 8. Bootstrap p-values and asymptotic p-values are different because bootstrap p-values are generated through the bootstrapping process, while asymptotic p-values are derived from the standard normal distribution (Westerlund and Edgerton, 2007). The bootstrap p-values lead us to accept the null hypothesis, which posits the existence of a long-run association among shadow economy indicators, human development indicators, and CO2 emissions. Therefore, the results of the LM bootstrap cointegration test demonstrate that COE, SHADOW1, SHADOW2, LIFI, EDI, and GNI display a common long-term trend.
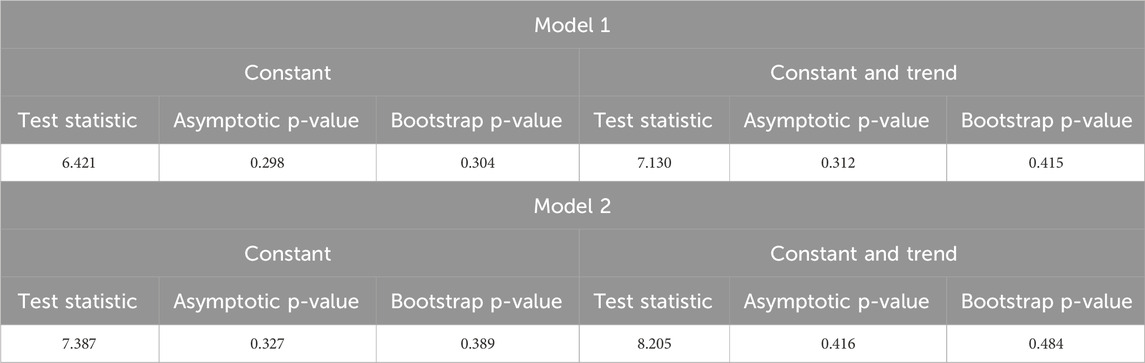
Table 8. Results of the LM bootstrap cointegration test.
The AMG estimator is used to determine the long-term panel and countries’ coefficients, and these coefficients are provided in Table 9. The coefficients show that both indicators of the shadow economy positively impact CO2 emissions across the panel and in BRICS countries, except China. On the other hand, life expectancy positively influences CO2 emissions across the panel and in all BRICS countries, except Russia. Finally, income positively impacts CO2 emissions across the panel and in all BRICS countries, while the education index negatively affects CO2 emissions across the panel and in BRICS countries.
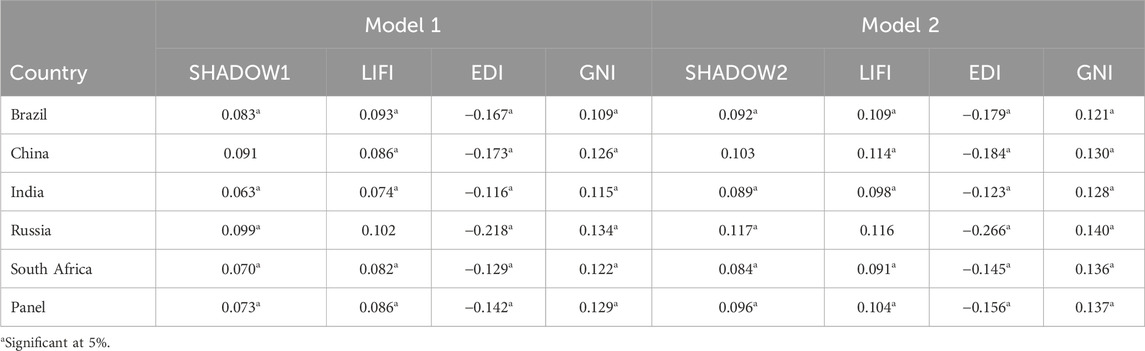
Table 9. Cointegration coefficient using the AMG estimator.
The unregistered firms can increase CO2 emissions by avoiding the costs of environmental taxes and non-compliance with environmental regulations. However, unregistered firms may not cause environmental degradation if these firms have a small production scale and low capital intensity. Therefore, the effect of the shadow economy on CO2 emissions may vary across countries. Thus, Biswas et al. (2011), Dada et al. (2021), Pang et al. (2021), Ahad and Imran (2023), and Ahmad and Hussain (2024) revealed a positive effect of the shadow economy on CO2 emissions, but Nkengfack et al. (2021), Camara (2022), Yu et al. (2022), and Silva et al. (2023) discovered a negative effect of the shadow economy on CO2 emissions. Therefore, theoretical and empirical findings overlap. Our results indicate that the shadow economy has a positive effect on CO2 emissions in Brazil, India, Russia, and South Africa, and there is no significant difference in the size of the cointegration coefficients of Brazil, India, Russia, and South Africa. Our results are compatible with the theoretical views on the nexus between the shadow economy and CO2 emissions and the results of Biswas et al. (2011), Dada et al. (2021), Pang et al. (2021), Ahad and Imran (2023), and Ahmad and Hussain (2024). However, the shadow economy does not have a significant effect on CO2 emissions in China, which experienced a remarkable decrease in the size of the shadow economy across the 1993–2020 period compared with the other BRICS countries. Furthermore, the mean values of the Environmental Policy Stringency Index of the BRICS countries over the 1993–2020 period are Brazil (0.455), South Africa (0.616), Russia (0.695), China (1.233), and India (1.534), indicating that these countries have lax environmental regulations (OECD, 2025).
Life expectancy can affect CO2 emissions by boosting production and consumption activities resulting from its increases. However, the majority of the empirical studies have focused on the effect of environmental degradation on life expectancy. Only Minh and Ly (2023) and Çakır (2023) analyzed the effects of human development and life expectancy on CO2 emissions, respectively, and Minh and Ly (2023) unveiled a positive effect of human development on decreases in CO2 emissions, while Çakır (2023) revealed a bilateral causality between life expectancy and CO2 emissions. Our results indicate that life expectancy has a positive effect on CO2 emissions in Brazil, China, India, and South Africa, and the size of these countries’ cointegration coefficients are close to each other. Our results are consistent with the theoretical considerations, considering the highly lax environmental regulations and socio-economic development levels of the BRICS countries. Furthermore, life expectancy does not have a significant effect on CO2 emissions in Russia, whose life expectancy experienced a wavy course.
Education, another dimension of human development, can affect CO2 emissions through multiple channels, including greater environmental awareness, more compliance with environmental rules, lifestyles and business practices with low-carbon trends, development of green technologies and renewable energy technologies, and economic growth and development. The results of Kim and Go (2020), Yao et al. (2020), Demircan Çakar et al. (2021), Liu et al. (2022), and Hondroyiannis et al. (2022) indicated that improvements in education decrease CO2 emissions, but Li and Zhou (2019) and Zafar et al. (2022) discovered a positive effect of education on CO2 emissions. In conclusion, the negative effect of education on CO2 emissions found in most of the empirical studies implies that its positive environmental effects outweigh the negative environmental effects. Our findings indicate that education has a negative effect on CO2 emissions in all BRICS countries, and this negative effect is relatively stronger in Russia, China, and Brazil because China and Brazil have experienced noteworthy progress in education and Russia has the highest education level among the BRICS countries. Furthermore, the mean values of renewable energy consumption (% of total final energy consumption) (as a sign of green technology development via education) in Brazil, India, and China during the 1993–2020 period were 45.472%, 41.631%, and 19.882%, respectively (World Bank, 2025). In conclusion, our findings are consistent with the related empirical literature to a great extent.
Finally, the nexus between income and the environment differs depending on the economic development levels of the countries in the context of the EKC hypothesis. The associated empirical literature has also revealed mixed results, in line with theoretical considerations. Our findings indicate that real GDP per capita has a positive effect on CO2 emissions in the BRICS countries, and the sizes of countries’ cointegration coefficients are close to each other. In particular, China and India achieved significant increases in GNI per capita across the 1993–2020 period, and Brazil, Russia, and South Africa experienced relatively lower increases in GNI per capita. However, our results show that BRICS countries have not reached the threshold economic development level for a negative relationship between income and CO2 emissions, and they also followed lax environmental regulations during the study period. Furthermore, Fei et al. (2011), Fei et al. (2011), Lee and Brahmasrene (2013), Hepektan and Sertkaya (2016), Balado-Naves et al. (2018), Chien et al. (2021), Aslam et al. (2021), and Georgescu et al. (2024) also unveiled a positive effect of income on CO2 emissions.
The causal interplay among CO2 emissions, indicators of the shadow economy, and human development is analyzed using the JKS non-causality test, and its results are presented in Table 10 and Figure 3. The results reveal a unidirectional causality from the shadow economy based on MIMIC, education, and income to the CO2 emissions and a bidirectional causal nexus between life expectancy and CO2 emissions. In other words, the shadow economy, education, and income have a significant impact on CO2 emissions, and a feedback interplay exists between life expectancy and CO2 emissions.
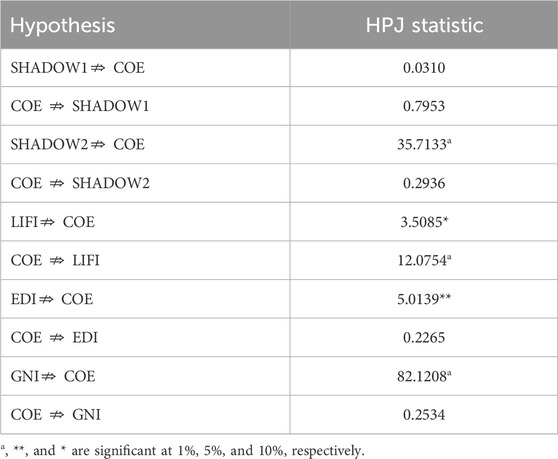
Table 10. JKS non-causality test outcomes.
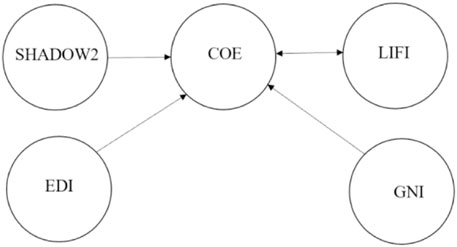
Figure 3. Results of the JKS causality test.
Our results show a significant effect of the shadow economy on CO2 emissions in accordance with the related theoretical views, but any comparison cannot be made due to the non-availability of studies investigating the causality between the shadow economy and CO2 emissions. On the other hand, a significant feedback between life expectancy and CO2 emissions in the BRICS countries is compatible with the result of Çakır (2023). In addition, our findings demonstrate that education has a significant effect on CO2 emissions, but the findings of Sart et al. (2022) indicated that the causality between education and CO2 emissions differed among the countries based on countries’ socio-economic characteristics. Finally, a significant effect of GNI per capita on CO2 emissions through the causality analysis is consistent with the results of Wang (2018), Wang et al. (2020), and Balli et al. (2020).
5 Conclusion
Global CO2 emissions have continued to increase despite environmental measures taken by international and regional institutions and countries. Therefore, priority should be globally given to curb the increases in CO2 emissions, given the negative health, economic, and social implications of CO2 emissions. This paper researches the long-term influence of the shadow economy, life expectancy, education, and income on CO2 emissions in the BRICS countries under the existence of CD and heterogeneity using the Westerlund and Edgerton’s LM cointegration test, the AMG estimator, and the JKS causality test because the BRICS countries have been drivers of the global economy in recent years, but these countries have also been among the top CO2 emitters in the world.
The limitations of this study are as follows:
The study sample includes only BRICS countries.
The study period is limited to the 1993–2020 period due to the availability of shadow economy data.
The study focused on the effect of the shadow economy and human development indicators on CO2 emissions and ignored the environmental effects of other economic, social, and political factors.
The outcomes of the causality test reveal a unidirectional causality from the shadow economy, education, and income to the CO2 emissions and a bidirectional causal nexus between life expectancy and CO2 emissions. On the other hand, the long-run coefficients by the AMG estimator demonstrate that shadow economy indicators, life expectancy, and income positively impact CO2 emissions, while the education index negatively affects CO2 emissions across the panel and in BRICS countries. Therefore, the results of causality and cointegration analyses support each other. The effect of the shadow economy on CO2 emissions is theoretically ambiguous. In this regard, the shadow economy can increase CO2 emissions through unregistered production activities and its tendency to disobey environmental rules. However, the environmental effects of the shadow economy can be negligible in the case of small-scale unregistered companies due to financial constraints and inappropriate business. In conclusion, the scale of unregistered companies and the stringency of environmental policies are key factors for the interplay between the shadow economy and CO2 emissions. Our results indicated that the shadow economy positively impacts CO2 emissions in the BRICS countries, except China, because these countries have a relatively high shadow economy and lax environmental regulations.
Based on our findings and the results of the associated literature, the following can be concluded:
The size of the shadow economy should be decreased considerably to overcome the negative environmental effects of the shadow economy using institutional and legal arrangements.
The stringency of the environmental policies and compliance of companies with environmental regulations should be improved using institutional, legal, and market-based environmental measures.
Education is found to be a significant tool to decrease CO2 emissions through improvements in environmental awareness and development of green technologies. Therefore, educational programs should be implemented to increase environmental awareness at the primary, secondary, and tertiary education levels. Furthermore, the use and development of energy-efficient and green energy technologies should be incentivized.
Our results and the related literature reveal that the scale of unregistered companies and the stringency of environmental policies are key factors for the nexus between the shadow economy and the environment. Therefore, future studies can explore the scale effects and environmental regulations on the nexus between the shadow economy and the environment.
Data availability statement
The variables of the research article are acquired from World Bank (2024), Elgin et al. (2021), and UNDP (2024a) and further inquiries can be forwarded to the corresponding author.
Author contributions
GS: Conceptualization, Data curation, Investigation, Methodology, Writing – original draft, Writing – review and editing. YB: Conceptualization, Data curation, Formal Analysis, Investigation, Methodology, Supervision, Writing – original draft, Writing – review and editing. FS: Conceptualization, Data curation, Investigation, Methodology, Writing – original draft, Writing – review and editing. MD: Conceptualization, Data curation, Investigation, Methodology, Writing – original draft, Writing – review and editing. EK: Formal Analysis, Validation, Investigation, Writing – original draft, Writing – review and editing.
Funding
The author(s) declare that no financial support was received for the research and/or publication of this article.
Conflict of interest
Author EK was employed by Consulta Labor and Social Security Legislation Consultancy.
The remaining authors declare that the research was conducted in the absence of any commercial or financial relationships that could be construed as a potential conflict of interest.
Generative AI statement
The author(s) declare that no Generative AI was used in the creation of this manuscript.
Publisher’s note
All claims expressed in this article are solely those of the authors and do not necessarily represent those of their affiliated organizations, or those of the publisher, the editors and the reviewers. Any product that may be evaluated in this article, or claim that may be made by its manufacturer, is not guaranteed or endorsed by the publisher.
References
Abdulqadir, İ. A. (2024). Urbanization, renewable energy, and carbon dioxide emissions: a pathway to achieving sustainable development goals (SDGs) in sub-Saharan Africa. Int. J. Energy Sect. Manag. 18 (2), 248–270. doi:10.1108/IJESM11-2022-0032
Adebayo, T. S., Awosusi, A. A., and Adeshola, I. (2020). Determinants of CO2 emissions in emerging markets: an empirical evidence from MINT economies. Int. J. Renew. Energy Dev. 9 (3), 411–422. doi:10.14710/ijred.2020.31321
Adekoya, O. B., Olabode, J. K., and Rafi, S. K. (2021). Renewable energy consumption, carbon emissions and human development: empirical comparison of the trajectories of world regions. Renew. Energy 179, 1836–1848. doi:10.1016/j.renene.2021.08.019
Ahad, M., and Imran, Z. A. (2023). The role of shadow economy to determine CO2 emission in Pakistan: evidence from novel dynamic simulated ARDL model and wavelet coherence analysis. Environ. Dev. Sustain. A Multidiscip. Approach Theory Pract. Sustain. Dev. 25 (4), 3043–3071. doi:10.1007/s10668-022-02164-2
Ahmad, M., Rehman, A., Shah, S. A. A., Solangi, Y. A., Chandio, A. A., and Jabeen, G. (2021). Stylized heterogeneous dynamic links among healthcare expenditures, land urbanization, and CO2 emissions across economic development levels. Sci. Total Environ. 753, 142228. doi:10.1016/j.scitotenv.2020.142228
Ahmad, W., and Hussain, B. (2024). Shadow economy and environmental pollution nexus in developing countries: what is the role of corruption? Int. Econ. J. 38 (2), 293–311. doi:10.1080/10168737.2024.2331463
Akbar, M., Hussain, A., Akbar, A., and Ullah, I. (2021). The dynamic association between healthcare spending, CO2 emissions, and human development index in OECD countries: evidence from panel VAR model. Environ. Dev. Sustain 23, 10470–10489. doi:10.1007/s10668-020-01066-5
Akbostancı, E., Türüt-Aşık, S., and Tunç, G. İ. (2009). The relationship between income and environment in Turkey: is there an environmental Kuznets curve? Energy Policy 37 (3), 861–867. doi:10.1016/j.enpol.2008.09.088
Alam, M. M., Murad, M. W., Noman, A. H. M., and Ozturk, I. (2016). Relationships among carbon emissions, economic growth, energy consumption and population growth: testing Environmental Kuznets Curve hypothesis for Brazil, China, India and Indonesia. Ecol. Indic. 70, 466–479. doi:10.1016/j.ecolind.2016.06.043
Ali, R., Bakhsh, K., and Yasin, M. A. (2019). Impact of urbanization on CO2 emissions in emerging economy: evidence from Pakistan. Sustain. Cities Soc. 48, 101553. doi:10.1016/j.scs.2019.101553
Al-Mulali, U., and Öztürk, I. (2015). The effect of energy consumption, urbanisation, trade openness, industrial output, and the political stability on the environmental degradation in the MENA (Middle East and North Africa) region. Energy 84, 382–389. doi:10.1016/j.energy.2015.03.004
Antweiler, W., Copeland, B. R., and Taylor, M. S. (2001). Is free trade good for the environment? Am. Econ. Rev. 91 (4), 877–908. doi:10.1257/aer.91.4.877
Arsić, M., Arandarenko, M., Radulović, B., Ranđelović, S., and Janković, I. (2015). “Causes of the shadow economy,” in Formalizing the shadow economy in Serbia. Contributions to economics. Editors G. Krstić, and F. Schneider (Cham: Springer). doi:10.1007/978-3-319-13437-6_4
Asghari, M. (2013). Does FDI promote MENA region’s environment quality? Pollution halo or pollution haven hypothesis. Int. J. Sci. Res. Environ. Sci. 1 (6), 92–100. doi:10.12983/ijsres-2013-p092-100
Aslam, B., Hu, J., Shahab, S., Ahmad, A., Saleem, M., Shah, S. S. A., et al. (2021). The nexus of industrialization, GDP per capita and CO2 emission in China. Environ. Technol. and Innovation 23, 101674. doi:10.1016/j.eti.2021.101674
Asongu, S. A., and Odhiambo, N. M. (2018). Environmental degradation and inclusive human development in sub-Saharan Africa. Sustain. Dev. 27 (1), 25–34. doi:10.1002/sd.1858
Awan, A. M., and Azam, M. (2022). Evaluating the impact of GDP per capita on environmental degradation for G-20 economies: does N-shaped environmental Kuznets curve exist? Environ. Dev. Sustain. 24 (9), 11103–11126. doi:10.1007/s10668-021-01899-8
Balado-Naves, R., Baños-Pino, J. F., and Mayor, M. (2018). Do countries influence neighbouring pollution? a spatial analysis of the EKC for CO2 emissions. Energy Policy 123, 266–279. doi:10.1016/j.enpol.2018.08.059
Balli, E., Nugent, J. B., Coskun, N., and Sigeze, C. (2020). The relationship between energy consumption, CO2 emissions, and economic growth in Turkey: evidence from Fourier approximation. Environ. Sci. Pollut. Res. 27, 44148–44164. doi:10.1007/s11356-020-10254-9
Bano, S., Zhao, Y., Ahmad, A., Wang, S., and Liu, Y. (2018). Identifying the impacts of human capital on carbon emissions in Pakistan. J. Clean. Prod. 183, 1082–1092. doi:10.1016/j.jclepro.2018.02.008
Bayar, Y., Gavriletea, M. D., Estes, J., and Oana Pintea, M. (2023). Impact of banking sector development and environment on population health: evidence from EU transition countries. Econ. Research-Ekonomska Istraživanja 36 (1), 2076140. doi:10.1080/1331677X.2022.2076140
Beyene, S. D., and Kotosz, B. (2021). Empirical evidence for the impact of environmental quality on life expectancy in african countries. J. Health Pollut. 11, 210312. doi:10.5696/2156-9614-11.29.210312
Biswas, A. K., Farzanegan, M. R., and Thum, M. (2011). Pollution, shadow economy and corruption: theory and evidence. Ecol. Econ. 75, 114–125. doi:10.1016/j.ecolecon.2012.01.007
Borhan, H., Ahmed, E. M., and Hitam, M. (2018). CO2, quality of life and economic growth in ASEAN 8. J. Asian Behav. Stud. 3 (6), 55–63. doi:10.21834/jabs.v3i6.237
Bouttabba, M. A. (2014). The impact of financial development, income, energy and trade on carbon emissions: evidence from the Indian economy. Econ. Model. 40, 33–41. doi:10.1016/j.econmod.2014.03.005
Çakır, N. Z. (2023). E-7 ülkelerinde doğumda beklenen yaşam süresi ile karbondioksit emisyonu arasındaki i̇lişkinin panel nedensellik analizi. 19 Mayıs Sos. Bilim. Derg. 4 (3), 102–111. doi:10.52835/19maysbd.1336133
Camara, M. (2022). The impact of the shadow economy on economic growth and CO2 emissions: evidence from ECOWAS countries. Environ. Sci. Pollut. Res. Int. 29 (43), 65739–65754. doi:10.1007/s11356-022-20360-5
Chandran, V. G. R., and Tang, C. F. (2013). The impacts of transport energy consumption, foreign direct investment and income on CO2 emissions in ASEAN-5 economies. Renew. Sustain. Energy Rev. 24, 445–453. doi:10.1016/j.rser.2013.03.054
Chen, F., Jiang, G., and Kitila, G. M. (2021). Trade openness and CO2 emissions: the heterogeneous and mediating effects for the belt and road countries. Sustainability 13, 1958. doi:10.3390/su13041958
Chen, F., Liu, A., Lu, X., Zhe, R., Tong, J., and Akram, R. (2022). Evaluation of the effects of urbanization on carbon emissions: the transformative role of government effectiveness. Front. Energy Res. 10, 848800. doi:10.3389/fenrg.2022.848800
Chen, H., Hao, Y., Li, J., and Song, X. (2018). The impact of environmental regulation, shadow economy, and corruption on environmental quality: theory and empirical evidence from China. J. Clean. Prod. 195, 200–214. doi:10.1016/j.jclepro.2018.05.206
Cheng, C., Ren, X., Dong, K., Dong, X., and Wang, Z. (2021). How does technological innovation mitigate CO2 emissions in OECD countries? heterogeneous analysis using panel quantile regression. J. Environ. Manag. 280, 111818–11. doi:10.1016/j.jenvman.2020.111818
Cheng, Z., and Hu, X. (2023). The effects of urbanization and urban sprawl on CO2 emissions in China. Environ. Dev. Sustain. 25 (2), 1792–1808. doi:10.1007/s10668-022-02123-x
Chien, F., Ajaz, T., Andlib, Z., Chau, K. Y., Ahmad, P., and Sharif, A. (2021). The role of technology innovation, renewable energy and globalization in reducing environmental degradation in Pakistan: a step towards sustainable environment. Renew. Energy 177, 308–317. doi:10.1016/j.renene.2021.05.101
Cui, Y., Zhong, C., Cao, J., Guo, M., and Zhang, M. (2024). Spatial effect of carbon neutrality target on high-quality economic development—channel analysis based on total factor productivity. Plos One 19 (1), e0295426. doi:10.1371/journal.pone.0295426
Dada, J. T., Ajide, F. M., and Adeiza, A. (2021). Shadow economy and environmental pollution in west african countries: the role of institutions. Glob. J. Emerg. Mark. Econ. 14, 366–389. doi:10.1177/09749101211049038
Demircan Çakar, N., Gedikli, A., Erdoğan, S., and Yıldırım, D. Ç. (2021). Exploring the nexus between human capital and environmental degradation: the case of EU countries. J. Environ. Manag. 295, 113057. doi:10.1016/j.jenvman.2021.113057
Dhaene, G., and Jochmans, K. (2015). Split-panel Jackknife estimation of fixed-effect models. Rev. Econ. Stud. 82 (3), 991–1030. doi:10.1093/restud/rdv007
Dong, Y., Gao, J., Qiu, J., Cui, Y., and Guo, M. (2024). The dynamic spatial effects of education investment on carbon emissions: heterogeneous analysis based on north-south differences in China. Front. Environ. Sci. 12, 1432457. doi:10.3389/fenvs.2024.1432457
Dou, Y., Zhao, J., Malik, M. N., and ve Dong, K. (2021). Assessing the impact of trade openness on CO2 emissions: evidence from China-Japan-ROK FTA countries. J. Environ. Manag. 296, 113241. doi:10.1016/j.jenvman.2021.113241
Eberhart, M., and Bond, S. R. (2009). “Cross-sectional dependence in non-stationary panel models: a novel estimator,” in Proceedings of the 5th Nordic Econometric Meetings, Lund 2009.
Elgin, C., Kose, M. A., Ohnsorge, F., and Yu, S. (2021). Understanding informality in “CERP discussion paper 16497” (London: Centre for Economic Policy Research). Available online at: https://www.worldbank.org/en/research/brief/informal-economy-database (Accessed August 16 2024).
Elgin, C., and Oztunali, O. (2012). Shadow economies around the world: model based estimates. Istanbul: Bogazici University, Department of Economics. Working Paper No. 2012/05.
Elgin, C., and Oztunali, O. (2014). Pollution and informal economy. Econ. Syst. 38 (3), 333–349. doi:10.1016/j.ecosys.2013.11.002
Ezako, J. T. (2024). The nexus between human development, official development assistance, carbon emissions, and governance in developing countries for the realization of sustainable development goals. Cogent Econ. and Finance 12 (1). doi:10.1080/23322039.2024.2330452
Farhani, S., Shahbaz, M., and Arouri, M. (2013). Panel analysis of CO2 emissions, GDP, energy consumption, trade openness and urbanization for mena countries. Germany: University Library of Munich, 49258.
Fei, L., Dong, S., Xue, L., Liang, Q., and Yang, W. (2011). Energy consumption-economic growth relationship and carbon dioxide emissions in China. Energy Policy 39 (2), 568–574. doi:10.1016/j.enpol.2010.10.025
Georgescu, I. A., Oprea, S. V., and Bâra, A. (2024). Investigating the relationship between macroeconomic indicators, renewables and pollution across diverse regions in the globalization era. Appl. Energy 363, 123077. doi:10.1016/j.apenergy.2024.123077
Grossman, G., and Krueger, A. (1995). Economic growth and the environment. Q. J. Econ. 110, 353–377. doi:10.2307/2118443
Gündüz, H. I. (2017). Testing for slope homogeneity in dynamic panels using the wild bootstrap ∆ ̃_(adj.) test. Ekonom. ve İstatistik 26, 53–59.
Haldar, A., and Sethi, N. (2021). Effect of institutional quality and renewable energy consumption on CO2 emissions−an empirical investigation for developing countries. Environ. Sci. Pollut. Res. 28, 15485–15503. doi:10.1007/s11356-020-11532-2
Hashmi, R., and Alam, K. (2019). Dynamic relationship among environmental regulation, innovation, CO2 emissions, population, and economic growth in OECD countries: a panel investigation. J. Clean. Prod. 231, 1100–1109. doi:10.1016/j.jclepro.2019.05.325
Haug, A. A., and Ucal, M. (2019). The role of trade and FDI for CO2 emissions in Turkey: nonlinear relationships. Energy Econ. 81, 297–307. doi:10.1016/j.eneco.2019.04.006
Hepektan, E., and Sertkaya, Y. (2016). Türkiye’de elektrik tüketimi, kişi başına GSYIH, CO2 emisyonu ve petrol tüketimi ilişkisi. Yalova Sos. Bilim. Derg. 6 (12), 163–182. doi:10.17828/yalovasosbil.288662
Hondroyiannis, G., Papapetrou, E., and Tsalaporta, P. (2022). New insights on the contribution of human capital to environmental degradation: evidence from heterogeneous and cross-correlated countries. Energy Econ. 116 (C), 106416. doi:10.1016/j.eneco.2022.106416
Huang, X. (2024). The multidimensional relationship between renewable energy deployment and carbon dioxide emissions in high-income nations. npj Clim. Action 3, 107. doi:10.1038/s44168-024-00191-5
Ibrahim, R. L. (2022). Beyond COP26: can income level moderate fossil fuels, carbon healthy life expectancy in Africa? Environ. Sci. Pollut. Res. 29 (58), 87568–87582. doi:10.1007/s11356-022-21872-w
Juodis, A., Karavias, Y., and Sarafidis, V. (2021). A homogeneous approach to testing for granger non-causality in heterogeneous panels. Empir. Econ. 60 (1), 93–112. doi:10.1007/s00181-020-01970-9
Khachoo, Q., and Sofi, I. (2014). The emissions, growth, energy use and FDI nexus: evidence from BRICSAM. Int. J. IT, Eng. Appl. Sci. Res. 3 (8), 1–9.
Khan, M., and Ozturk, I. (2021). Examining the direct and indirect effects of financial development on CO2 emissions for 88 developing countries. J. Environ. Manag. 293, 112812. doi:10.1016/j.jenvman.2021.112812
Khan, N., Baloch, M. A., Saud, S., and Fatima, T. (2018). The effect of ICT on CO2 emissions in emerging economies: does the level of income matters?. Environ. Sci. Pollut. Res. 25, 22850–22860. doi:10.1007/s11356-018-2379-2
Kim, D., and Go, S. (2020). Human capital and environmental sustainability. Sustainability 12 (11), 4736. doi:10.3390/su12114736
Kim, D.-H., Wu, Y.-C., and Lin, S.-C. (2019). Education, health, and economic development. Macroecon. Dyn. 23 (2), 837–869. doi:10.1017/S1365100517000050
Kivyiro, P., and Arminen, H. (2014). Carbon dioxide emissions, energy consumption, economic growth, and foreign direct investment: causality analysis for sub-saharan Africa. Energy 74, 595–606. doi:10.1016/j.energy.2014.07.025
Koçak, E., and Çelik, B. (2022). The nexus between access to energy, poverty reduction and PM2.5 in Sub-Saharan Africa: new evidence from the generalized method of moments estimators. Sci. Total Environ. 25, 154377. doi:10.1016/j.scitotenv.2022.154377
Koengkan, M., and Fuinhas, J. A. (2017). The negative impact of renewable energy consumption on carbon dioxide emissions: an empirical evidence from South American countries. Rev. Bras. Energias Renov. 6, 893–914. doi:10.5380/rber.v6i5.49252
Koengkan, M., and Fuinhas, J. A. (2022). Does the obesity problem increase environmental degradation? Macroeconomic and social evidence from the European countries. Economies 10 (6), 131. doi:10.3390/economies10060131
Lee, J. M., Chen, K. H., and Cho, C. H. (2015). The relationship between CO2 emissions and financial development: evidence from OECD countries. Singap. Econ. Rev. 60, 1550117. doi:10.1142/S0217590815501179
Lee, J. W., and Brahmasrene, T. (2013). Investigating the influence of tourism on economic growth and carbon emissions: evidence from panel analysis of the European Union. Tour. Manag. 38, 69–76. doi:10.1016/j.tourman.2013.02.016
Li, S., and Zhou, C. (2019). What are the impacts of demographic structure on CO2 emissions? A regional analysis in China via heterogeneous panel estimates. Sci. Total Environ. 650, 2021–2031. doi:10.1016/j.scitotenv.2018.09.304
Li, T., Wang, Y., and Zhao, D. (2016). Environmental Kuznets curve in China: new evidence from dynamic panel analysis. Energy Policy 91, 138–147. doi:10.1016/j.enpol.2016.01.002
Liu, Y., Sohail, M. T., Khan, A., and Majeed, M. T. (2022). Environmental benefit of clean energy consumption: can BRICS economies achieve environmental sustainability through human capital? Environ. Sci. Pollut. Res. 29 (5), 6766–6776. doi:10.1007/s11356-021-16167-5
Massoud, M., Vega, G., Subburaj, A., and Partheepan, J. (2023). Review on recycling energy resources and sustainability. Heliyon 9 (4), e15107. doi:10.1016/j.heliyon.2023.e15107
Matthew, O. A., Owolabi, O. A., Osabohien, R., Urhie, E., Ogunbiyi, T., Olawande, T. I., et al. (2020). Carbon emissions, agricultural output and life expectancy in West Africa. Int. J. Energy Econ. Policy 10 (3), 489–496. doi:10.32479/ijeep.9177
Minh, N. H., and Ly, D. K. (2023). Impact of human development on CO2 emissions in Vietnam. Hue Univ. J. Sci. Econ. Dev. 132, 53–66. doi:10.26459/hueunijed.v132i5B.7130
Morrrisson, C., and Mead, D. (1996). “Pour une nouvelle définition du secteur informel,”. N°3, 3–26. doi:10.3406/recod.1996.944Rev. d'économie Du. développement
Muhammad, S., and Long, X. (2021). Rule of law and CO2 emissions: a comparative analysis across 65 belt and road initiative (bri) countries. J. Clean. Prod. 279, 123539. doi:10.1016/j.jclepro.2020.123539
Nayaga, P., Poku, F. A., Dramani, J. B., and Takyi, P. O. (2021). The threshold effect of electricity consumption and urbanization on carbon dioxide emissions in Ghana. Manag. Environ. Qual. An Int. J. 33 (3), 586–604. doi:10.1108/meq-09-2021-0229
Nkengfack, H., Kaffo Fotio, H., and Totouom, A. (2021). How does the shadow economy affect environmental quality in sub-saharan Africa? Evidence from heterogeneous panel estimations. J. Knowl. Econ. 12 (4), 1635–1651. doi:10.1007/s13132-020-00685-7
Odhiambo, N. M. (2020). Financial development, income inequality, and carbon emissions in Sub-Saharan African countries: a panel data analysis. Energy Explor. and Exploitation 38 (5), 1914–1931. doi:10.1177/0144598720941999
OECD (2025). Environmental policy stringency index. Available online at: https://stats.oecd.org/Index.aspx?DataSetCode=EPS (Accessed March 15 2025).
Osabohien, R., Aderemi, T. A., Akindele, D. B., and Jolayemi, L. B. (2021). Carbon emissions and life expectancy in Nigeria. Int. J. Energy Econ. Policy 11 (1), 497–501.
Pang, J., Li, N., Mu, H., and Zhang, M. (2021). Empirical analysis of the interplay between shadow economy and pollution: with panel data across the provinces of China. J. Clean. Prod. 285, 124864. doi:10.1016/j.jclepro.2020.124864
Pervaiz, R., Faisal, F., Rahman, S. U., Chander, R., and Ali, A. (2021). Do health expenditure and human development index matter in the carbon emission function for ensuring sustainable development? Evidence from the heterogeneous panel. Air Qual. Atmos. and Health 14 (11), 1773–1784. doi:10.1007/s11869-021-01052-4
Pesaran, M. H. (2007). A simple panel unit root test in the presence of cross-section dependence. J. Appl. Econom. 22, 265–312. doi:10.1002/jae.951
Pîrlogea, C. (2012). The human development relies on energy. Panel data Evid. Procedia Econ. Finan. 3, 496–501. doi:10.1016/S2212-5671(12)00186-4
Raheem, I. D., and Ogebe, J. O. (2017). CO2 emissions, urbanization and industrialization: evidence from a direct and indirect heterogeneous panel analysis. Manag. Environ. Qual. An Int. J. 28 (6), 851–867. doi:10.1108/MEQ-09-2015-0177
Razzaq, A., Sharif, A., Najmi, A., Tseng, M. L., and Lim, M. K. (2021). Dynamic and causality interrelationships from municipal solid waste recycling to economic growth, carbon emissions and energy efficiency using a novel bootstrapping autoregressive distributed lag. Resour. Conservation Recycl. 166, 105372. doi:10.1016/j.resconrec.2020.105372
Saidmamatov, O., Saidmamatov, O., Sobirov, Y., Marty, P., Ruzmetov, D., Berdiyorov, T., et al. (2024). Nexus between life expectancy, CO2 emissions, economic development, water, and agriculture in Aral Sea Basin: empirical assessment. Sustainability 16 (7), 2647. doi:10.3390/su16072647
Salehnia, N., Alavijeh, N. K., and Salehnia, N. (2020). Testing porter and pollution haven hypothesis via economic variables and CO2 emissions: a cross-country review with panel quantile regression method. Environ. Sci. Pollut. Res. 27 (25), 31527–31542. doi:10.1007/s11356-020-09302-1
Sarafidis, V., and Wansbeek, T. (2010). Cross-sectional dependence in panel data analysis. MPRA Paper No. 20815. Germany: University Library of Munich. Available online at: https://mpra.ub.uni-muenchen.de/20815/ (Accessed March 16 2025).
Sart, G., Bayar, Y., Danilina, M., and Sezgin, F. H. (2022). Economic freedom, education and CO2 emissions: a causality analysis for EU member states. Int. J. Environ. Res. Public Health 19, 8061. doi:10.3390/ijerph19138061
Schneider, F., Buehn, A., and Montenegro, C. E. (2010). Shadow economies all over the world: new estimates for 162 countries from 1999 to 2007. Policy Research Working Paper 5356. Washington, DC: World Bank.
Selvanathan, E. A., Jayasinghe, M., and Selvanathan, S. (2021). Dynamic modelling of inter-relationship between tourism, energy consumption, CO2 emissions and economic growth in South Asia. Int. J. Tour. Res. 23 (4), 597–610. doi:10.1002/jtr.2429
Shahbaz, M., Hye, O. M. A., Tiwari, A. K., and Leitao, N. C. (2013). Economic growth, energy consumption, financial development, international trade and CO2 emissions in Indonesia. Renew. Sustain. Energy Rev. 25, 109–121. doi:10.1016/j.rser.2013.04.009
Shahbaz, M., Sbia, R., Hamdi, H., and Ozturk, I. (2014). Economic growth, electricity consumption, urbanization and environmental degradation relationship in United Arab Emirates. Ecol. Indic. 45, 622–631. doi:10.1016/j.ecolind.2014.05.022
Shakouri, B., Yazdi, S. K., and Ghorchebigi, E. (2017). Does tourism development promote CO2 emissions? Anatolia 28 (3), 444–452. doi:10.1080/13032917.2017.1335648
Shoaib, H. M., Rafique, M. Z., Nadeem, A. M., and Huang, S. (2020). Impact of financial development on CO2 emissions: a comparative analysis of developing countries (D8) and developed countries (G8). Environ. Sci. Pollut. Res. 27 (11), 12461–12475. doi:10.1007/s11356-019-06680-z
Silva, N., Fuinhas, J. A., and Shirazi, M. (2023). On the link between shadow economy and carbon dioxide emissions: an analysis of homogeneous groups of countries. Environ. Sci. Pollut. Res. 30, 114336–114357. doi:10.1007/s11356-023-30385-z
Solarin, S. A. (2014). Tourist arrivals and macroeconomic determinants of CO2 emissions in Malaysia. Anatolia 25 (2), 228–241. doi:10.1080/13032917.2013.868364
Stef, N., Başağaoğlu, H., Chakraborty, D., and Jabeur, S. B. (2023). Does institutional quality affect CO2 emissions? Evidence from explainable artificial intelligence models. Energy Econ. 124, 106822. doi:10.1016/j.eneco.2023.106822
Suki, N. M., Sharif, A., Afshan, S., and Jermsittiparsert, K. (2022). The role of technology innovation and renewable energy in reducing environmental degradation in Malaysia: a step towards sustainable environment. Renew. Energy 182, 245–253. doi:10.1016/j.renene.2021.10.007
Teixeira, A. A. C., and Queirós, A. S. S. (2016). Economic growth, human capital and structural change: a dynamic panel data analysis. Res. Policy 45 (8), 1636–1648. doi:10.1016/j.respol.2016.04.006
Tvaronavičienė, M. (2024). The transition towards renewable energy: the challenge of sustainable resource management for a circular economy. Energies 17 (17), 4242. doi:10.3390/en17174242
UN (2024). The 17 goals. Available online at: https://sdgs.un.org/goals (Accessed August 10 2024).
UNDP (2024a). Hum. Dev. Index (HDI). Available online at: https://hdr.undp.org/data-center/human-development-index#/indicies/HDI (Accessed August 15 2024).
UNDP (2024b). HDR technical notes. Available online at: https://hdr.undp.org/sites/default/files/2023-24_HDR/hdr2023-24_technical_notes.pdf (Accessed August 16 2024).
Wang, M. (2018). A granger causality analysis between the GDP and CO2 emissions of major emitters and implications for international climate governance. Chin. J. Urban Environ. Stud. 6 (1), 1850004. doi:10.1142/S2345748118500045
Wang, M. L., Wang, W., Du, S. Y., Li, C. F., and He, Z. (2020). Causal relationships between carbon dioxide emissions and economic factors: evidence from China. Sustain. Dev. 28 (1), 73–82. doi:10.1002/sd.1966
Wang, Z., Bui, Q., Zhang, B., Nawarathna, C. L. K., and Mombeuil, C. (2021). The nexus between renewable energy consumption and human development in BRICS countries: the moderating role of public debt. Renew. Energy 165, 381–390. doi:10.1016/j.renene.2020.10.144
Westerlund, J., and Edgerton, D. L. (2007). A panel bootstrap cointegration test. Eco Lett. 97, 185–190. doi:10.1016/j.econlet.2007.03.003
World Bank (2024). CO2 emissions (metric tons per capita). Available online at: https://data.worldbank.org/indicator/EN.ATM.CO2E.PC (Accessed August 16, 2024).
World Bank (2025). Renewable energy consumption (% of total final energy consumption). Available online at: https://data.worldbank.org/indicator/EG.FEC.RNEW.ZS (Accessed March 15 2025).
Yao, Y., Ivanovski, K., Inekwe, J., and Smyth, R. (2020). Human capital and CO2 emissions in the long run. Energy Econ. 91, 104907. doi:10.1016/j.eneco.2020.104907
Yii, K. J., and Geetha, J. (2017). The nexus between technology innovation and CO2 emissions in Malaysia: evidence from Granger causality test. Energy Procedia 105, 3118–3124. doi:10.1016/j.egypro.2017.03.654
Yu, Y., Chukwuma Onwe, J., Jahanger, A., Adebayo, T. S., Hossain, M. E., and David, A. (2022). Linking shadow economy and CO2 emissions in Nigeria: exploring the role of financial development and stock market performance. Fresh insight from the novel dynamic ARDL simulation and spectral causality approach. Front. Environ. Sci. 10, 983729. doi:10.3389/fenvs.2022.983729
Zafar, M. W., Saleem, M. M., Destek, M. A., and Caglar, A. E. (2022). The dynamic linkage between remittances, export diversification, education, renewable energy consumption, economic growth, and 2 emissions in top remittance-receiving countries. Sustain. Dev. 30, 165–175. doi:10.1002/sd.2236
Zambrano-Monserrate, M. A., Silva-Zambrano, C. A., Davalos-Penafiel, J. L., Zambrano-Monserrate, A., and Ruano, M. A. (2018). Testing environmental Kuznets curve hypothesis in Peru: the role of renewable electricity, petroleum and dry natural gas. Renew. Sustain. Energy Rev. 82, 4170–4178. doi:10.1016/j.rser.2017.11.005
Zhang, S., and Liu, X. (2019). The roles of international tourism and renewable energy in environment: new evidence from Asian countries. Renew. Energy 139, 385–394. doi:10.1016/j.renene.2019.02.046
Zhang, S., Liu, X., and Bae, J. (2017). Does trade openness affect CO2 emissions: evidence from ten newly industrialized countries? Environ. Sci. Pollut. Res. 24, 17616–17625. doi:10.1007/s11356-017-9392-8
Keywords: shadow economy, life expectancy, education, income, CO2 emissions, cointegration test, causality test
Citation: Sart G, Bayar Y, Sezgin FH, Danilina M and Karagöz E (2025) The effect of shadow economy, life expectancy, education, and income on CO2 emissions: an analysis of BRICS countries. Front. Environ. Sci. 13:1550389. doi: 10.3389/fenvs.2025.1550389
Received: 23 December 2024; Accepted: 05 June 2025;
Published: 30 June 2025.
Edited by:
Faik Bilgili, Erciyes University, TürkiyeReviewed by:
Ridwan Ibrahim, University of Lagos, NigeriaSuleyman Yurtkuran, Trabzon University, Türkiye
Bekir Çelik, Nuh Naci Yazgan University, Türkiye
Copyright © 2025 Sart, Bayar, Sezgin, Danilina and Karagöz. This is an open-access article distributed under the terms of the Creative Commons Attribution License (CC BY). The use, distribution or reproduction in other forums is permitted, provided the original author(s) and the copyright owner(s) are credited and that the original publication in this journal is cited, in accordance with accepted academic practice. No use, distribution or reproduction is permitted which does not comply with these terms.
*Correspondence: Yılmaz Bayar, eWlsbWF6YmF5YXJAeWFob28uY29t