 Yuanyuan Fu1,2
 Jichao Sun1,2*
- 1Key Laboratory of Groundwater Conservation of MWR, China University of Geosciences, Beijing, China
- 2School of Water Resource and Environment, China University of Geosciences, Beijing, China
Based on daily precipitation data from 11 stations in Harbin City from 1962 to 2020, various statistical methods, including linear regression, moving averages, anomaly analysis, Mann-Kendall (M-K) mutation test, and Morlet wavelet analysis, were applied to examine annual and seasonal precipitation trends, mutations, and periodicities. The results reveal an increasing trend in annual precipitation, with significant increase during all seasons, particularly in summer, which contributes the most to total annual precipitation. Monthly precipitation shows significant variation, with July being the wettest and January the driest. Multiple abrupt changes were identified in both annual and seasonal precipitation, with the most significant mutations occurring in 1963, 1979, and 2018. Periodic analysis indicates that the main periodicity in annual precipitation occurs at 32–52 years, with seasonal variations peaking at different scales. Spring and winter show the highest periodic intensity at 45–64 years, while summer and autumn are most strongly influenced by cycles at 32–52 years. Precipitation periodicity shortens from north to south and east to west. Precipitation also shows a strong positive correlation with vegetation indices. These findings provide valuable insights for water resource management and agricultural planning in the region, offering a scientific basis for developing strategies to address seasonal and long-term precipitation fluctuations.
1 Introduction
As a key component of meteorological elements, precipitation has significant impacts on water resource balance, agricultural production, and economic and social development in various regions due to its inter annual variability and spatial distribution characteristics (Zheng et al., 2024; Liu et al., 2024). Precipitation is not only a vital source of surface and groundwater resources but also a key driver of ecosystem functioning. Its variability affects the swelling characteristics of expansive soils (Shao et al., 2020; Sun et al., 2007; Zhang and Sun, 2024; Sun et al., 2009; Sun and Huang, 2022), further influencing the stability of urban water supply systems, the rational allocation of agricultural irrigation water, and the balance of natural ecosystems, with profound impacts on regional geological stability and ecosystem functions. However, due to the significant uncertainty in the pattern and regional distribution of precipitation changes, analyzing and revealing the characteristics of regional precipitation changes has become one of the important topics in current global climate change research (Zheng et al., 2017; Jiang et al., 2008).
In recent years, with the complex changes in the global climate system, the distribution and variation patterns of precipitation in different regions have shown significant spatiotemporal differences (Zhang et al., 2009; Liu et al., 2005). Some studies have shown that while the overall trend of average precipitation in China is not significant, regional precipitation exhibits considerable inter-annual fluctuations and seasonal distribution differences, particularly in the northern regions (Zhang and Sun, 2023; Wang et al., 2014; Wang et al., 2011; He et al., 2024). These findings suggest that precipitation in these areas is highly variable, influencing both water resources and agricultural systems (Zhang et al., 2024; Yang et al., 2023).
Harbin, located in Heilongjiang Province, China, is an important agricultural production base in the country. Its precipitation changes directly affect the growth cycle and yield of crops, especially during drought seasons. Additionally, the variability in precipitation in Harbin also plays a critical role in the stability of the urban water supply system. Changes in precipitation may lead to shortages or surpluses of water resources, affecting the balance and sustainability of the city’s water supply (Liang et al., 2023). Some studies have explored the impact of precipitation on crop growth in similar regions (Zhao F. et al., 2019; Jiang et al., 2015; Fang et al., 2012), and other researchers have analyzed the spatial distribution of precipitation from May to October in Harbin, with a general increasing trend in annual precipitation (Cui, 2014; Zhang et al., 2018). However, there is still a significant lack of research specifically addressing the inter-annual and seasonal precipitation patterns in Harbin and further analysis of its spatiotemporal distribution.
Therefore, this study focuses on Harbin City, which has not been extensively studied in terms of precipitation variation, filling a gap in the existing literature. This research aims to analyze the inter-annual and seasonal precipitation trends, revealing the spatial distribution patterns of precipitation and their impacts on regional water resources and agriculture. We hypothesize that precipitation variability in Harbin significantly affects water resource availability and agricultural productivity, with different seasonal and inter-annual patterns influencing regional systems in distinct ways. By utilizing advanced methods such as Morlet wavelet analysis and the M-K mutation test, this study provides new perspectives on understanding precipitation trends in northeastern China and offers valuable scientific support for future climate adaptation strategies and water resource management.
2 Material and methods
2.1 Study areas
Harbin (125°42′E−130°10′E, 44°04′N-46°40′N) is located in the northeastern plain of China, in the southern part of Heilongjiang Province (Figure 1). The city covers an area of approximately 53,840 square kilometers, including nine urban districts, seven counties, and two county-level cities, with a population of 9.515 million. It is the political, economic, and cultural center of northern Northeast China (Cui, 2014). Harbin has a temperate continental monsoon climate, with distinct seasons: long and cold winters, and relatively short summers. The average annual precipitation is 582 mm, with the main precipitation period occurring from June to September, accounting for 60% of the annual rainfall. The precipitation distribution in Harbin exhibits clear seasonal and interannual variations, and these spatiotemporal changes provide a basis for exploring the local climate, ecology, and water resource management.
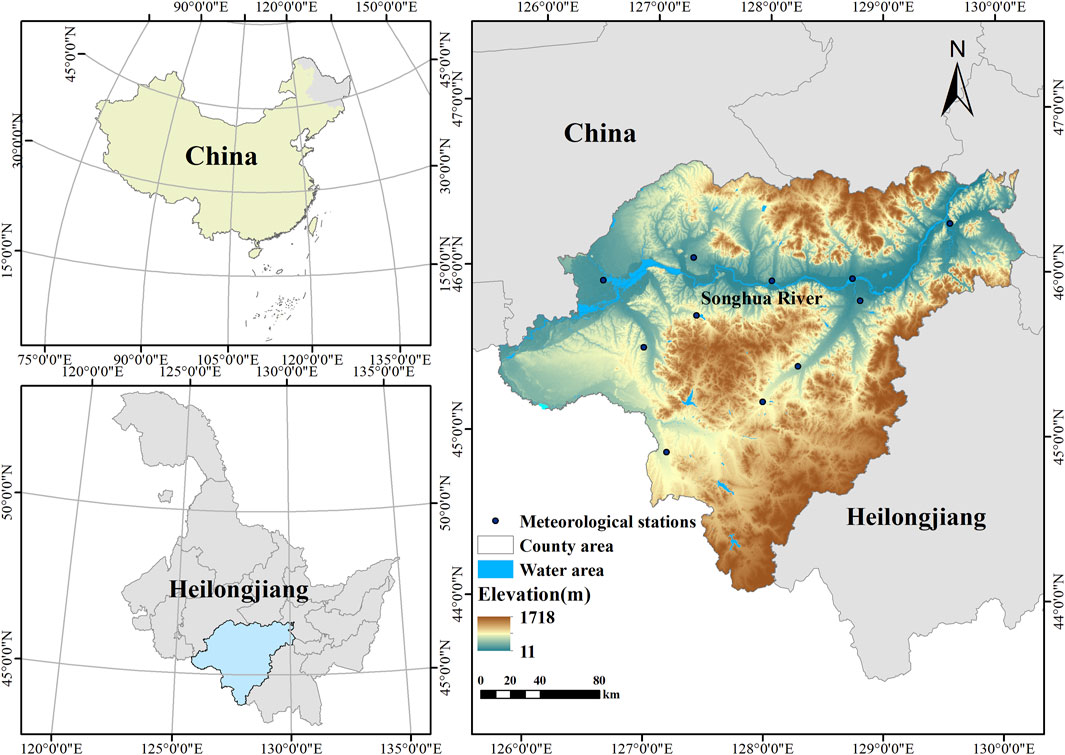
Figure 1. Harbin map and distribution of meteorological stations, Review Number: GS (2020) 4619.
2.2 Data source
The precipitation data used in this study were provided by the National Meteorological Science Data Center (www.data.cma.cn) and have undergone rigorous quality control, covering daily precipitation records from 11 ground meteorological observation stations in Harbin (Table 1), spanning from 1962 to 2020. These data are considered to accurately reflect true climatic conditions, unaffected by non-climatic factors. They have been widely used in previous studies (Zheng et al., 2024; Zheng et al., 2017), further confirming their reliability and suitability for climatic analysis. Prior to data analysis, anomalous values were removed, and preliminary quality control was conducted to ensure the accuracy and reliability of the data. To ensure the homogeneity of the data, all selected stations are part of the national meteorological observation network, and the data collection methods have remained consistent throughout the study period. For the very few missing data points, the average of the adjacent 2 days’ data was used for interpolation. The seasons were classified according to meteorological standards, with spring defined as March to May, summer as June to August, autumn as September to November, and winter as December to February of the following year.
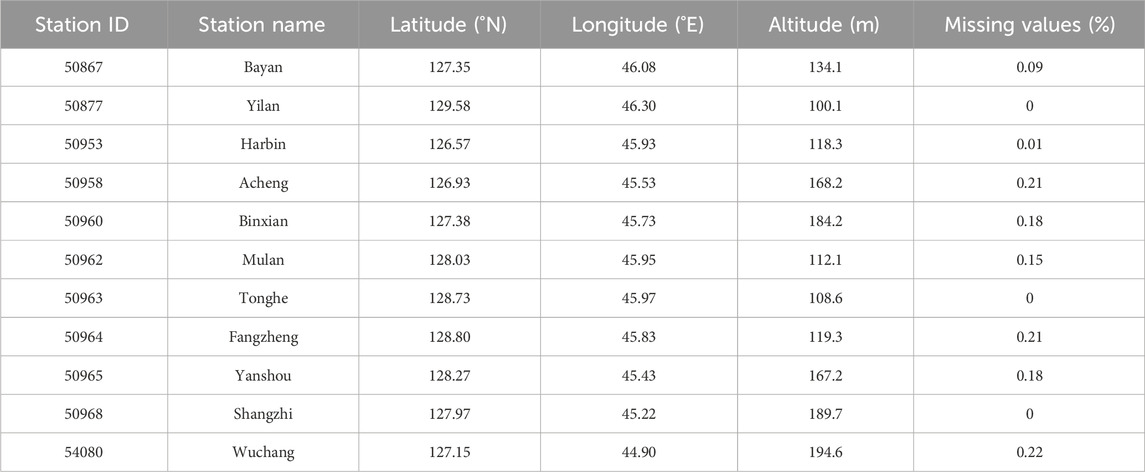
Table 1. Main characteristics of meteorological stations.
2.3 Research method
2.3.1 Linear regression method
The linear regression method is a commonly used approach to determine the trend of climate factors in long-term time series (An et al., 2024; Ma et al., 2023; Zhao E. et al., 2019). The formulas (Equations 1, 2) are as follows:
In the formula: P is precipitation; a is the linear trend; b is a constant; a1 is the precipitation slope rate per 5 years. If a1 is negative, it means that precipitation decreases with time. If a1 is positive, it means that precipitation increases with time.
2.3.2 Cumulative anomaly method
Anomaly refers to the difference between a specific value at a given location and its long-term average. Cumulative anomaly is the sum of anomalies at each time point over a period, which is used to quantify the deviation of precipitation from the long-term average and estimate the approximate timing of abrupt changes in the precipitation sequence (Gao et al., 2017; Che et al., 2014). The formulas (Equations 3, 4) are as follows:
In the formula: Xi is the time series;
2.3.3 M-K mutation test method
The M-K mutation test is a non-parametric statistical test method, commonly used for mutation analysis in hydrological time series (Li et al., 2023; Zhao et al., 2020; Tang, 2019; Gu et al., 2023). The significance level refers to the probability of committing an error when rejecting the null hypothesis in hypothesis testing. It is typically set at 0.05, meaning there is a 5% chance of incorrectly rejecting the null hypothesis. In this method, the significance level is used to determine whether the mutation is statistically significant, ensuring the reliability of the test results. The formulas (Equations 5-9) are as follows:
In the formula: Sk is the cumulative value of the number of values at the time i greater than the number of values at time j; ri is an order statistic; UFk is the forward sequence statistic; UBk is the backward sequence statistic; E (Sk) is the mean value of Sk; var (Sk) is the variance of Sk; β is the skewness; the median is the median function.
2.3.4 Morlet wavelet analysis
Morlet wavelet analysis is an effective method for examining the evolutionary characteristics of meteorological elements across multiple time scales. It is commonly used to analyze the periodic variations of meteorological elements at different time scales (Li et al., 2022; An, 2024; Duan et al., 2018). The formulas (Equations 10-13) are as follows:
In the formula: φa,b(t) is the scaling function; t is the time variable; a is the scale factor; b is the translational factor; Wf(a, b) is the wavelet transform coefficient; f(t) is the signal to be analyzed; Var(a) is the wavelet variance.
3 Results
3.1 Precipitation trend
3.1.1 Annual precipitation trend changes
The inter annual variation of annual precipitation in Harbin City in the past 60 years is significant, with the highest precipitation reaching 873.33 mm (2019) and the lowest being 393.58 mm (2001). The average annual precipitation is 582.01 mm. Overall, the precipitation in Harbin City in the past 60 years has shown a significant increasing trend, with an increase of 11.87 mm/10 a (Figure 2a). The number of dry years is 31 a, and the number of wet years is 28 a. The ratio of dry years to wet years is about 1.1, evenly distributed above and below the zero line. In the past 59 years, the annual precipitation in Harbin has undergone five main changes, namely: an increasing trend in precipitation from 1962 to 1965, 1979–1994, and 2011–2020; The precipitation showed a decreasing trend from 1965 to 1979 and from 1994 to 2011. The precipitation from 1962 to 2020 generally showed an alternating pattern of “abundant dry abundant”, with a period of about 15 years (Figure 2b).
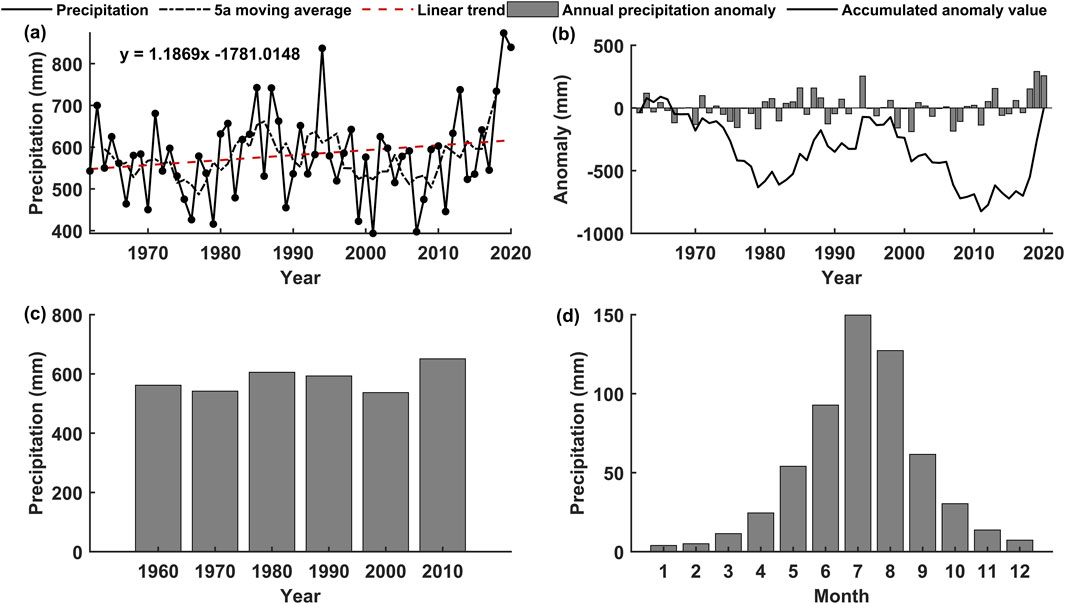
Figure 2. Precipitation changes in Harbin. (a) Interannual variation; (b) Interannual variation of anomaly values; (c) Decadal changes; (d) Monthly average change.
There is an interdecadal variation in the annual precipitation of Harbin City: the precipitation in the 1980 s, 1990 s, and recent years was higher than usual, while the precipitation in the 1960 s, 1970 s, and 2000 s was lower. In the past 10 years, the precipitation has been the highest, with an average of 650.79 mm. In the 2000 s, the precipitation was the lowest, with an average of 537.02 mm (Figure 2c). The precipitation in Harbin varies greatly from month to month, with a range of 3.94–149.73 mm. Among them, July has the highest precipitation, at 149.73 mm, accounting for 25.74% of the total annual precipitation, while January has the lowest precipitation, at 3.94 mm, accounting for 0.68% of the total annual precipitation. The former is about 38 times higher than the latter (Figure 2d).
3.1.2 Seasonal precipitation trend changes
The precipitation in Harbin City shows a significant increasing trend in spring and winter, with the spring precipitation showing the most prominent increase, at a rate of 6.30 mm/10 a and an annual variation range of 37.81–161.72 mm. Precipitation has undergone three main phases: a normal period from 1965 to 1983, followed by a transition from a fluctuating “dry” period (1983–2006) to a “wet” period (2006–2020) (Figures 3a, 4a). The winter precipitation rate of increase is slower, with an increase of only 2.10 mm/10 a and an annual variation range of 2.99–38.92 mm. The magnitude of precipitation changes between high and low levels has decreased, showing an overall offsetting of positive and negative anomalies (Figures 3d, 4d).
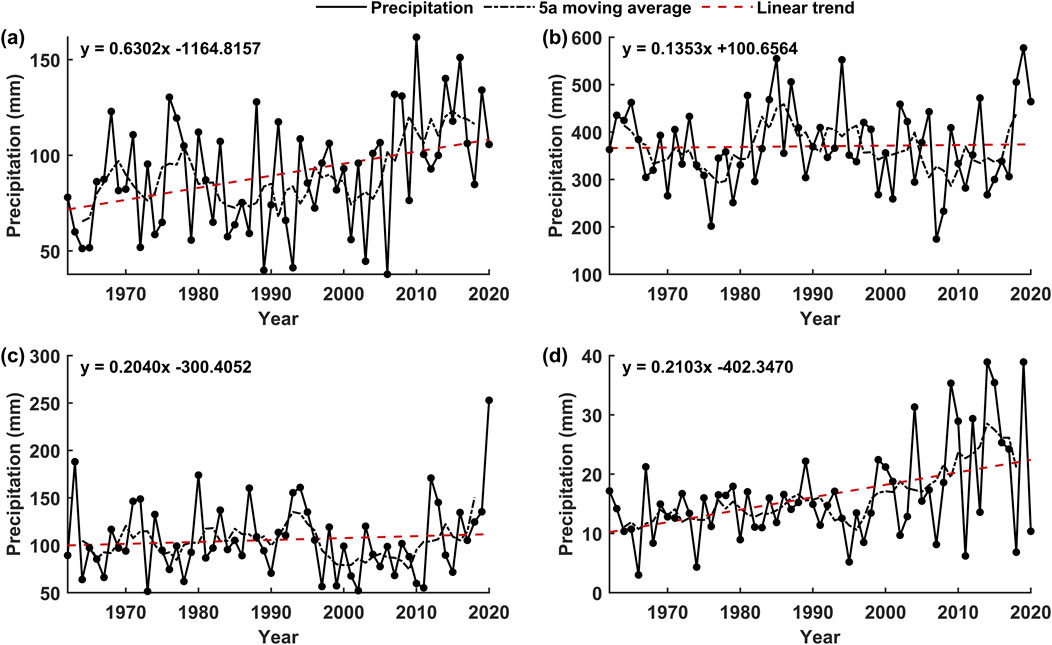
Figure 3. Inter annual variation of seasonal precipitation in Harbin. (a) Spring; (b) Summer; (c) Autumn; (d) Winter.
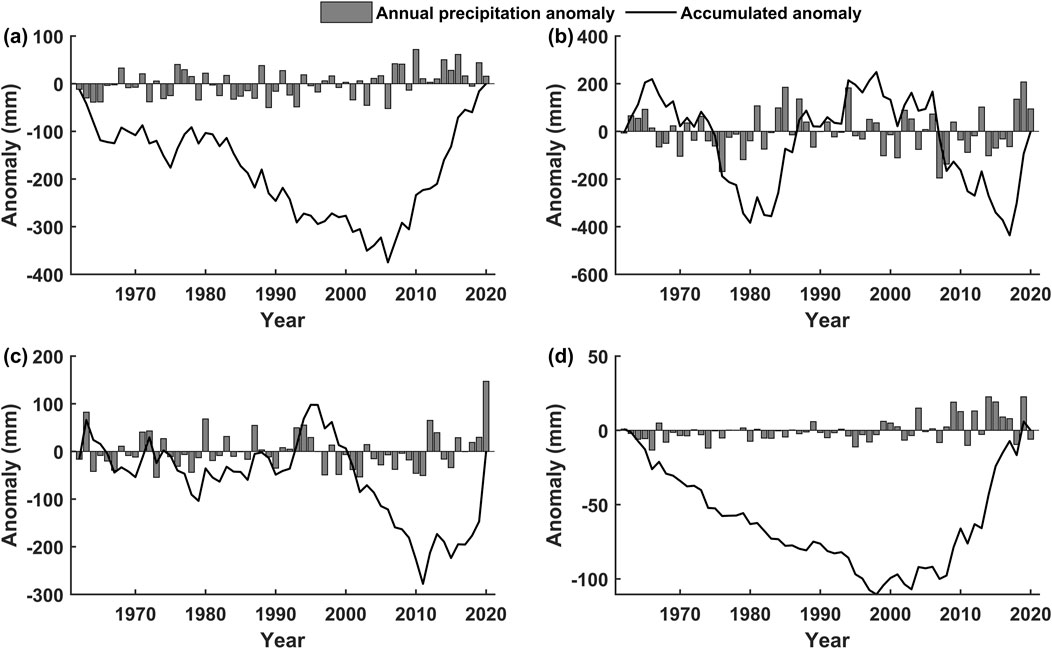
Figure 4. Inter annual variation of seasonal anomaly values in Harbin. (a) Spring; (b) Summer; (c) Autumn; (d) Winter.
In contrast, summer and autumn precipitation showed no significant increasing trends, with an increase of 1.35 mm/10 a and 2.04 mm/10 a, respectively. The summer precipitation shows an annual variation range of 174.35–577.34 mm, with an increasing amplitude of precipitation anomalies. These seasonal changes show clear stage transitions, with summer precipitation generally displaying an alternating “wet-dry-wet” pattern from 1962 to 2020 (Figures 3b, 4b). Similarly, autumn precipitation, with an annual variation range of 51.39–252.86 mm, followed a similar alternating “wet-dry-wet” pattern, transitioning from a normal period (1962–1995) to a fluctuating “dry” period (1995–2011) and then to a “wet” period (2011–2020) (Figures 3c, 4c).
The average precipitation for each season is as follows: spring (89.95 mm), summer (370.07 mm), autumn (105.76 mm), and winter (16.31 mm), which account for 15.45%, 63.58%, 18.17%, and 2.80% of the average annual precipitation, respectively. This highlights that summer and autumn contribute the most to annual precipitation, while winter contributes the least.
3.2 Precipitation mutations
3.2.1 Annual precipitation mutation
M-K test is used for change-point analysis, a method particularly suitable for identifying change points in time series, especially for data with long-term fluctuations. U F represents the forward sequence statistic, calculated by examining the sequence of data points from the beginning to the end of the time series. U B represents the backward sequence statistic, calculated by examining the sequence from the end to the beginning of the time series. The intersection of both UF and UB indicates the change year in annual precipitation. To further enhance the objectivity of the results, cumulative anomaly analysis of precipitation was combined as an auxiliary tool to help confirm the change years of precipitation in different periods (Figure 2b). Based on this combined approach, M-K analysis was performed on the annual precipitation in Harbin City from 1962 to 2020, and the specific year of a sudden change in precipitation was preliminarily determined based on the intersection position of the graph (Figure 5).
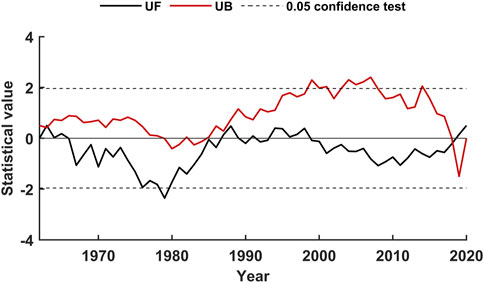
Figure 5. M-K mutation detection of annual precipitation in Harbin.
The analysis indicates that the precipitation trend in Harbin over the past 60 years exhibits a distinct periodic variation pattern. Specifically, before 1966, the precipitation showed an increasing trend; from 1966 to 1987, precipitation continuously declined, reaching its lowest point in 1979; from 1987 to 1999, precipitation showed a fluctuating increasing trend; from 1999 to 2018, precipitation declined; and since 2018, there has been a noticeable increasing trend in precipitation. By analyzing the intersection of the U F curve and the U B curve, 1963 and 2018 were initially selected as turning points. Combining this with the cumulative anomaly curve, a significant shift in precipitation is evident, which led to abrupt changes in precipitation in 1963, 1979, and 2018.
3.2.2 Seasonal precipitation mutation
Based on the seasonal precipitation change analysis (Figure 6) and cumulative precipitation anomaly analysis (Figure 4), the following conclusions can be drawn: Before 1966, spring precipitation showed a decreasing trend; from 1987 to 2007, it showed a fluctuating increasing trend; from 1966 to 1987 and from 2007 to 2020, precipitation increased, with 2020 surpassing the 0.05 significance level threshold, showing a significant increasing trend.
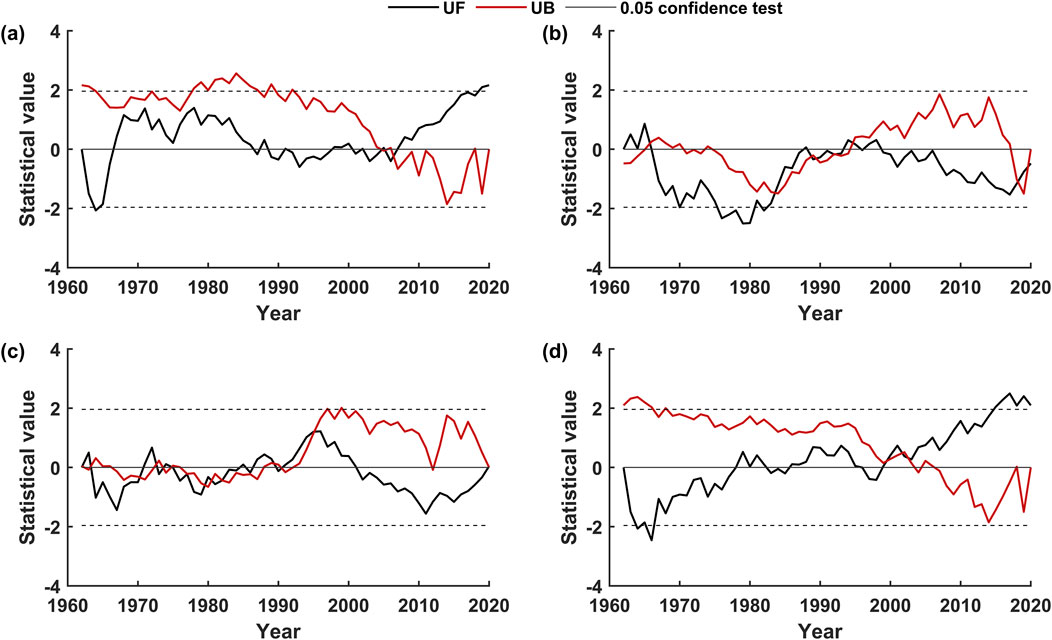
Figure 6. M-K mutation detection of seasonal precipitation in Harbin. (a) Spring; (b) Summer; (c) Autumn; (d) Winter.
According to the intersection points of the U F and U B curves and the cumulative anomaly curve analysis, a sharp change in spring precipitation occurred in 2006. From 1962 to 1966 and from 1993 to 1998, summer precipitation showed an increasing trend; from 1966 to 1993 and from 1998 to 2020, it showed a decreasing trend. Combining multiple intersection points of the U F and U B curves and the cumulative anomaly curve, summer precipitation experienced abrupt changes in 1966, 1983, and 2018. Autumn precipitation fluctuated downward before 1985, increased from 1985 to 2001, and showed a significant downward trend after 2018. Multiple intersection points of the U F and U B curves within the critical line, along with the cumulative anomaly curve, indicate abrupt changes in autumn precipitation in 1963, 1979, 1995, and 2019. Winter precipitation showed a decreasing trend from 1962 to 1978; a fluctuating increase from 1978 to 1999, and an increasing trend after 1999. From 2015 to 2020, it exceeded the 0.05 significance level threshold, showing a significant increase. The intersection points of the U F and U B curves and the cumulative anomaly curve indicate an abrupt change in winter precipitation in 2003.
3.3 Precipitation cycle
3.3.1 Annual precipitation cycle
When the real part of the wavelet is positive, it indicates a high precipitation period, while when the wavelet is negative, it corresponds to a shorter water storage period. By summarizing the distribution of positive and negative values of the real part and combining them with the time scale, we can determine whether precipitation occurs based on the multi-time scale characteristics (Figure 7a). The modulus of the wavelet coefficient determines the energy density distribution of precipitation during different periods. The larger the modulus, the more pronounced the periodic variation (Figure 7b). The wavelet variance illustrates the distribution of energy in precipitation time fluctuations (Figure 7c).
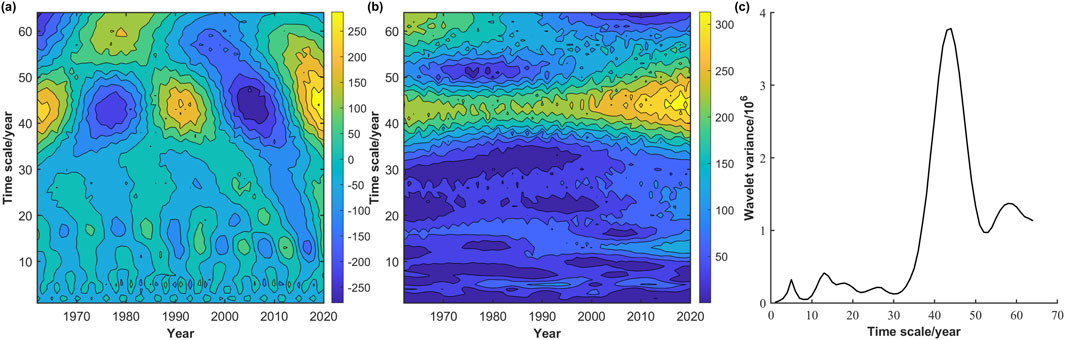
Figure 7. Periodic analysis of annual precipitation. (a) Wavelet real part map; (b) Wavelet coefficient map; (c) Wavelet variance plot.
There are three types of periodic variations in the annual precipitation evolution process in Harbin City: 2–7 a, 10–20 a, and 32–52 a scales (Figures 7a,b). Among them, the energy oscillation at the scale of 32–52 a is the strongest, and the precipitation periodicity is the most significant, running through the entire time domain, showing two cycles of “more rain less rain”; The energy oscillations at the scale of 10–20 a are relatively weak, with five cycles of “less rain more rain”. These results indicate that shorter time scales exhibit weaker periodic fluctuations, while longer time scales represent more pronounced, stable cycles. In the annual precipitation wavelet variance plot (Figure 7c), there are four peaks with corresponding time scales of 5 a, 13 a, 44 a, and 58 a. Among them, the maximum peak corresponds to the scale of 44 a, indicating that the oscillation period around 44 a is the strongest, which is the first main period of annual precipitation change. The scale of 58 a corresponds to the second peak, which is the second main period of precipitation change, and the others are sub periods.
3.3.2 Seasonal precipitation cycle
Through Morlet wavelet analysis, the periodic variation characteristics of precipitation in spring, summer, autumn, and winter in Harbin City over the past 60 a were systematically studied using wavelet real part contour maps, wavelet coefficient modulus contour maps, and wavelet variance maps (Table 2).
Table 2. Seasonal precipitation cycle in Harbin.
Spring precipitation shows periodic variations on four scales: 3–6 a, 10–16 a, 22–36 a, and 45–64 a (Figures 8a–c), among which the periodic variation at the 45–64 a scale is the most pronounced. The wavelet variance diagram reveals four periodic peaks for spring precipitation: 55 a, 4 a, 29 a, and 16 a. Among these, 55 a represents the first primary cycle with the most significant oscillation, while 4 a, 29 a, and 16 a correspond to the second, third, and fourth primary cycles, respectively, exhibiting multi-scale periodic characteristics.
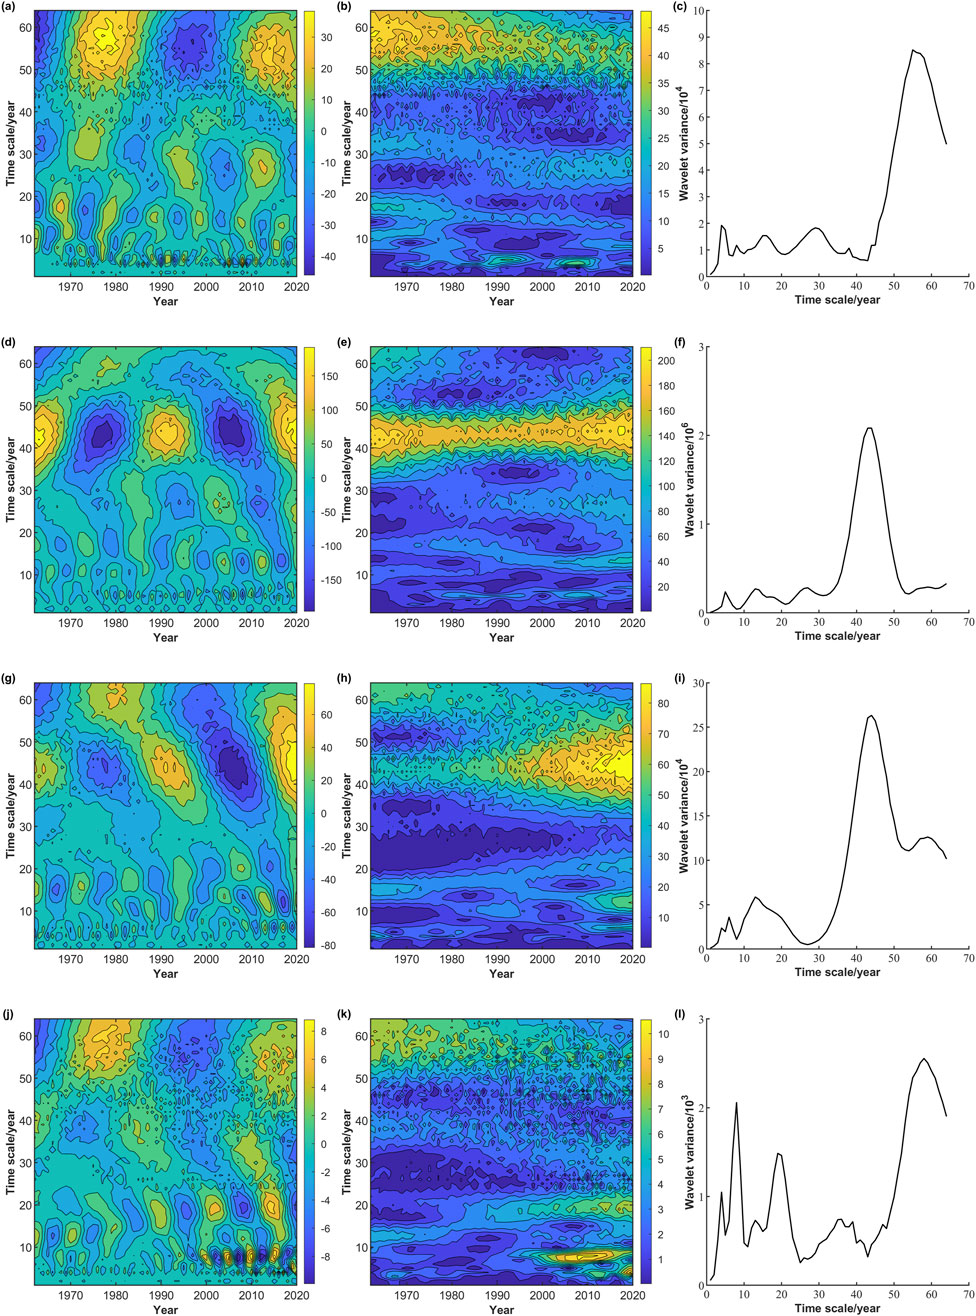
Figure 8. Wavelet real part map, Wavelet coefficient map, and Wavelet variance map. (a–c) Spring; (d–f) Summer; (g–i) Autumn; (j–l) Winter
Summer precipitation primarily exhibits periodic variations on three scales: 4–8 a, 10–16 a, and 32–52 a (Figures 8d–f). The 32–52 a scale shows clear alternations between positive and negative phases, reflecting a “more–less” cyclical pattern and forming four oscillation centers in 1964 a, 1978 a, 1992 a, and 2006 a. The wavelet variance diagram indicates four peaks for summer precipitation: 5 a, 13 a, 27 a, and 44 a. Among these, 44 a is the first primary cycle with the most significant periodicity, while 27 a represents the second primary cycle, and the remaining peaks correspond to secondary cycles.
Autumn precipitation exhibits periodic variations on four scales: 5–8 a, 10–24 a, 32–52 a, and 54–64 a (Figures 8g–i). On the 32–52 a scale, autumn precipitation alternates in a “more–less–more–less–more” pattern, with oscillation centers located at 1965 a, 1979 a, 1992 a, and 2007 a. Wavelet variance analysis shows four periodic peaks for autumn precipitation: 6 a, 13 a, 44 a, and 59 a. Among these, 44 a represents the first primary cycle, while 59 a corresponds to the second primary cycle. The oscillations are significant and sustained over a long period.
Winter precipitation exhibits periodic variations on five scales: 3–5 a, 5–10 a, 10–24 a, 28–42 a, and 45–64 a (Figures 8j–l). The periodic variation at the 45–64 a scale is particularly prominent, displaying a “less–more” alternating cyclical pattern. The wavelet variance diagram identifies five peaks for winter precipitation: 4 a, 8 a, 19 a, 36 a, and 58 a. Among these, 58 a represents the first primary cycle with the strongest oscillation intensity, while 8 a corresponds to the second primary cycle, and the other peaks are secondary cycles.
3.3.3 Spatiotemporal variations of precipitation cycle
From north to south and from east to west, the spatial patterns of precipitation across cities transition from long cycles to short cycles (Figures 9, 10), with the periodic variation showing an overall trend of shortening cycles (Table 3).
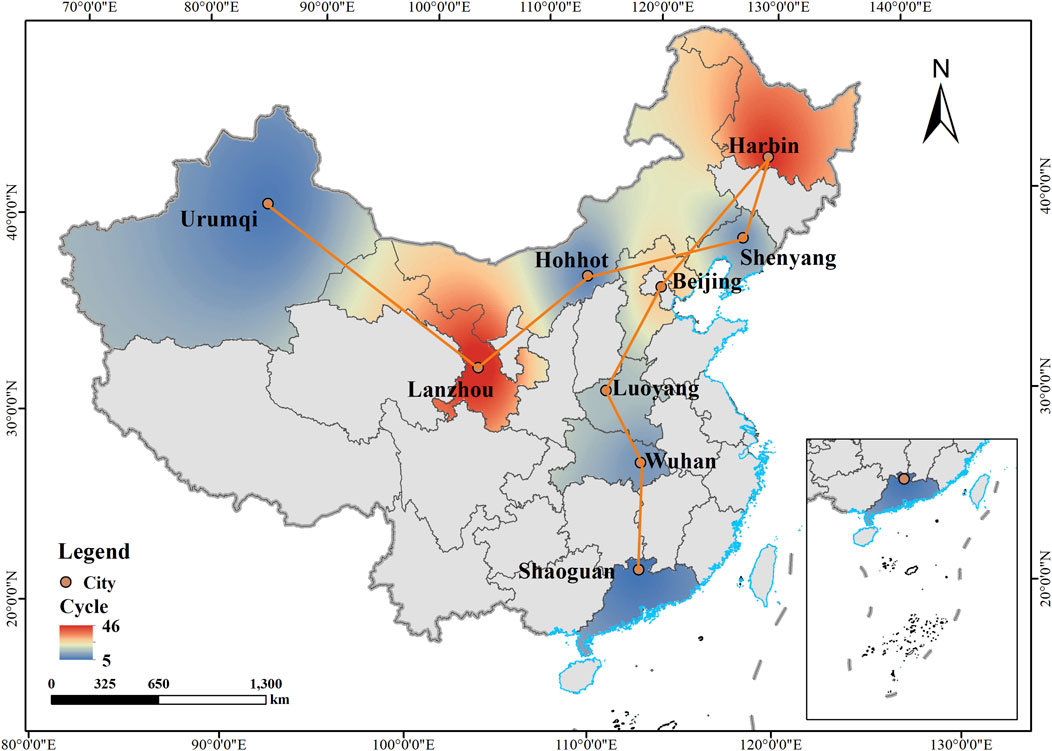
Figure 9. Spatiotemporal distribution map of national periodic evolution.
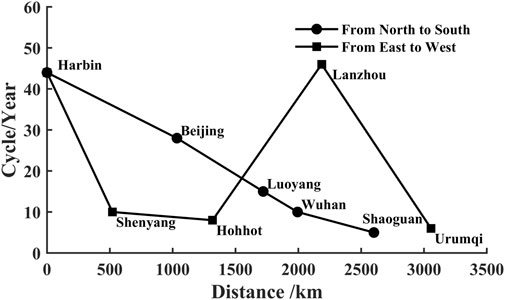
Figure 10. Line chart of national periodic spatiotemporal evolution.
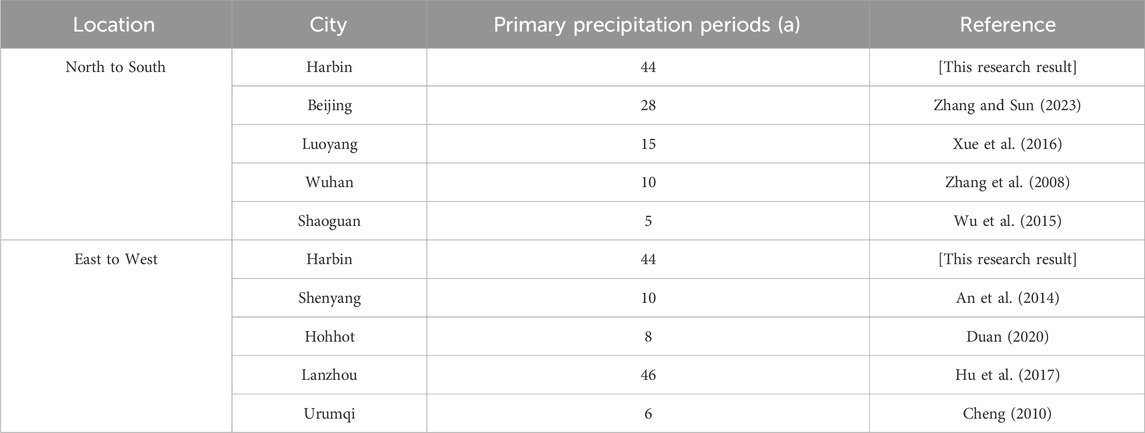
Table 3. Comparison of precipitation cycle changes in typical cities.
Northern cities like Harbin and Beijing are dominated by long-period cycles in their annual precipitation patterns. For example, Harbin’s precipitation exhibits a 44-year cycle, while Beijing follows a 28-year cycle (Zhang and Sun, 2023). These long-period characteristics indicate that northern regions’ precipitation is influenced more by long-term climate oscillations. As latitude decreases, cities like Luoyang and Wuhan show medium- and short-period precipitation cycles. Luoyang experiences a 15-year cycle (Xue et al., 2016), while Wuhan has a 10-year cycle (Zhang et al., 2008). In southern cities like Shaoguan, short-period cycles become more prominent, with a primary cycle of 5 years (Wu et al., 2015), marked by greater fluctuations and active periodic changes. This pattern suggests that as latitude decreases, the timescale of the climate system’s influence on precipitation shortens, leading to shorter cycles in the south and longer ones in the north. Southern regions exhibit higher-frequency precipitation changes, while northern regions show low-frequency, long-period oscillations, indicating a more stable and regular climate pattern.
The periodic variation in precipitation across cities from east to west demonstrates significant spatial patterns influenced by changes in latitude, topography, and humidity levels, with an overall trend of shortening periods. However, Lanzhou exhibits an “anomalous” characteristic. In the eastern region, cities such as Harbin and Shenyang are dominated by long and stable precipitation cycles. Harbin’s precipitation is characterized by a primary cycle of 44 a, while Shenyang is mainly influenced by a 10 a cycle (An et al., 2014). As the geographical location shifts toward the central and western regions, the periodic variation in precipitation in Hohhot tends toward medium- and short-period cycles, with more frequent fluctuations. Its primary cycle is 8 a (Duan, 2020), indicating that regional precipitation is more influenced by periodic changes. However, moving further west to Lanzhou, precipitation is dominated by long cycles of 46 a (Hu et al., 2017), exhibiting an “anomalous” characteristic that runs counter to the overall trend. This anomaly may be attributed to Lanzhou’s location in the transitional zone between arid and semi-arid regions of northwest China, where it is strongly affected by the long-term oscillations of the westerlies and the modulation of local topography. In Urumqi, precipitation periodicity is centered around cycles of 6 a (Cheng, 2010), with significantly enhanced periodic fluctuations, reflecting the high-frequency characteristics of precipitation in arid regions. This pattern of precipitation periodicity from east to west indicates an overall trend of shortening periods, with notable variations based on regional climatic and topographical influences.
3.3.4 Correlation between precipitation and vegetation indices
The Normalized Difference Vegetation Index (NDVI) reflects the relative changes in vegetation coverage, showing significant dynamic changes in 2000, 2010, and 2020. These changes are closely related to fluctuations in precipitation (Figure 11).
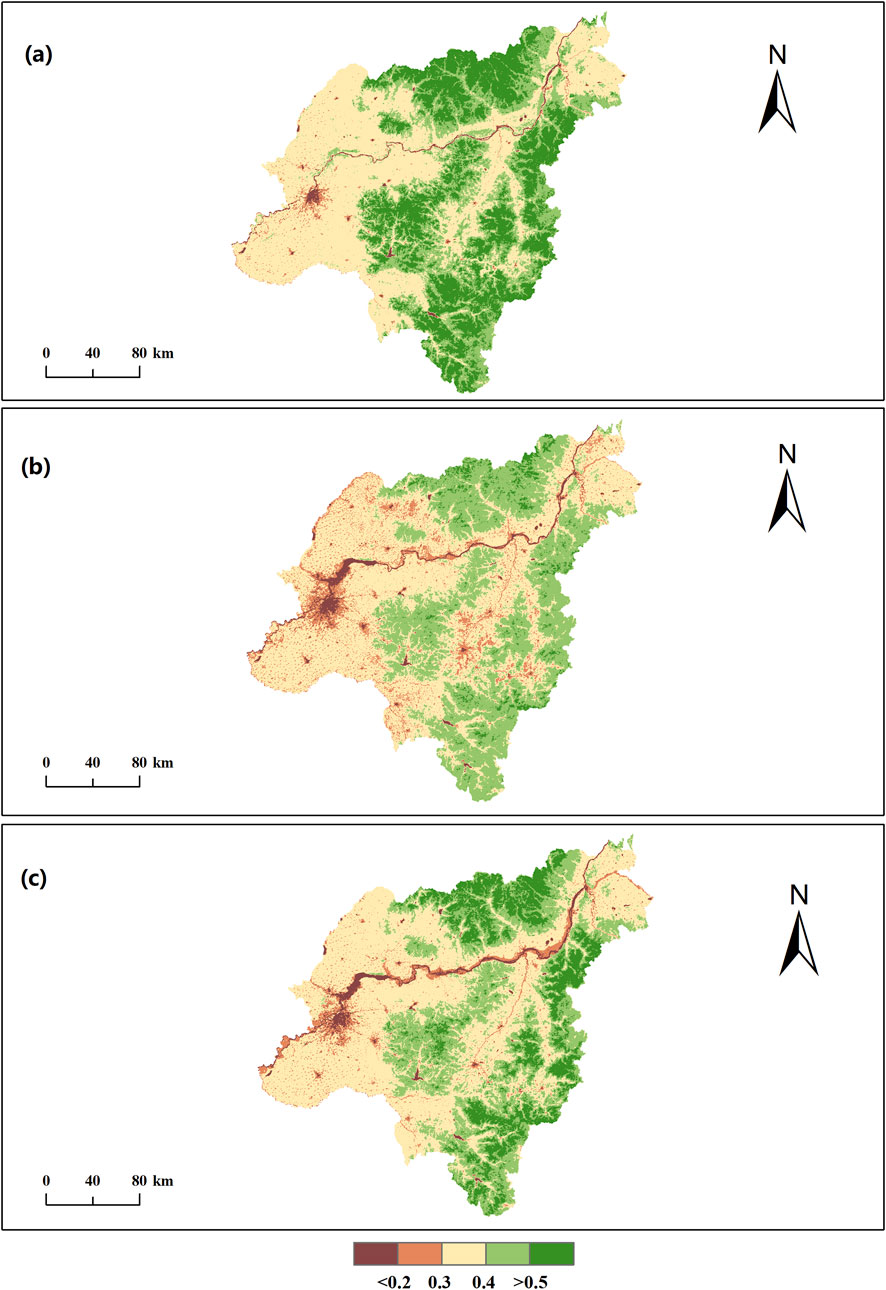
Figure 11. Spatial change trends of vegetation in Harbin over a decade. (a) 2000; (b) 2010; (c) 2020.
In 2000 and 2020, higher precipitation levels provided sufficient water resources for vegetation growth, resulting in a significant improvement in vegetation coverage. However, in 2010, a significant decrease in precipitation led to insufficient water supply, causing a notable decline in vegetation coverage. This further highlights the critical regulatory role of precipitation in vegetation dynamics.
The spatial distribution map of the correlation between precipitation and vegetation indices reflects the magnitude and direction of the correlation coefficient through the color bar, revealing the differences in the response characteristics of NDVI to precipitation across different regions (Figure 12). Overall, most regions exhibit a significant positive correlation, indicating that increased precipitation can effectively promote vegetation growth, with NDVI values rising accordingly. This positive correlation is particularly evident in sparsely vegetated areas, possibly because these regions are more sensitive to water availability. Increased precipitation directly improves water supply conditions, thereby promoting the expansion and growth of vegetation cover. However, there are very few regions showing a negative correlation, which may suggest that precipitation, in most cases, has a positive effect on vegetation growth. Additionally, the few areas with negative correlations might be associated with localized excessive soil moisture, poor soil drainage capacity, or vegetation’s limited tolerance to excess water. Further analysis incorporating other ecological and environmental data is required to fully understand these patterns.
Figure 12. Partial correlation analysis of precipitation and vegetation indices.
4 Discussion
During the study period, precipitation in Harbin exhibited significant trends and variations at both the annual and seasonal scales, consistent with the overall precipitation trends in northeastern China, which found a widespread increase in precipitation across the region (Liu et al., 2005). The linear slope rates for annual and seasonal precipitation all showed an upward trend, with summer contributing the most to the total annual precipitation, followed by autumn and spring, while winter contributed the least. Harbin’s seasonal precipitation trends are particularly notable, with the largest increase in spring precipitation at 0.63 mm/a and the smallest increase in winter precipitation at 0.21 mm/a. Summer and autumn contribute the most to annual precipitation, with summer being the wettest season. Similar trends have been observed in other cities in northeastern China, such as Shenyang, which reported a pronounced seasonal concentration of precipitation, with summer and autumn accounting for the majority of the annual total, especially summer (An et al., 2014). These seasonal variations highlight the importance of summer and autumn precipitation in shaping the overall precipitation trend in Harbin, with profound implications for agricultural production and water resource management. The observed increase in precipitation, particularly during the summer and autumn, is likely to affect agricultural productivity, especially for crops sensitive to seasonal changes in precipitation. Water resource management strategies must also adapt to these changes, taking into account the dominant role of these seasons in driving annual precipitation variations to ensure efficient water distribution.
The mutation analysis revealed significant changes in both annual and seasonal precipitation, with multiple shifts in precipitation trends throughout the study period. The most prominent impact on annual precipitation occurred in the summer. Similar mutations in precipitation patterns have been reported in other studies. One such study found that precipitation in Shaanxi Province experienced significant mutations at several time points, with a clear decreasing trend in annual precipitation. The primary mutation occurred in 1990, reflecting a decrease in annual precipitation, while a significant increase in summer precipitation was observed in 1977 (Wang et al., 2014). Similarly, another study indicated that precipitation mutations in Beijing primarily occurred in the summer and autumn, with the mutation points revealing seasonal characteristics of precipitation changes (Zhang and Sun, 2023). The cumulative anomaly analysis further supports these findings, indicating clear transitions between wet and dry periods over time. The periodic analysis revealed three primary periodic changes in annual precipitation, with the strongest intensity observed at the 32–52 a scale. Seasonal periodic changes were found at different time scales, with the highest periodic intensity observed in spring and winter at 45–64 a, and in summer and autumn at 32–52 a. These findings highlight the long-term variability of precipitation patterns in Harbin and emphasize the need for adaptive strategies to address potential changes in precipitation frequency and intensity. Given the observed long-term variability and periodicity of precipitation, it is important to develop flexible and responsive water management and agricultural strategies to mitigate the potential impacts of these changes.
The significant increasing trend in precipitation observed in Harbin, particularly in spring, and the substantial contribution of summer and autumn to the total annual precipitation, have important implications for water resource planning. Given the observed increase in precipitation anomalies, especially in summer and autumn, infrastructure for water storage, flood management, and irrigation needs to be upgraded to accommodate potential changes in precipitation patterns. Understanding the periodic nature of precipitation changes is crucial for long-term planning and for more accurate predictions of water availability. Furthermore, the regional patterns of precipitation changes in Harbin can offer valuable insights for cities in northeastern China, such as Shenyang and Changchun, that share similar climatic conditions. The observed wet-dry cycles may also be present in other cities in the region, and understanding these regional patterns can assist in developing broader climate adaptation strategies. Future research should expand the scope of analysis to include other climatic factors, such as temperature and humidity, to more comprehensively evaluate the regional climate system and its impact on precipitation changes.
5 Conclusion
Through the above analysis of the spatiotemporal characteristics of precipitation in Harbin City from 1962 to 2020, the following main results can be summarized.
(1) Over the past 60 years, Harbin City has experienced an increasing trend in annual precipitation, with an average increase of 11.87 mm per decade. The precipitation pattern has alternated in a “wet-dry-wet” cycle, with each cycle lasting approximately 15 years. During dry periods, it is necessary to implement effective measures to ensure a stable water supply and maintain crop yields. In contrast, during wet periods, especially during the summer precipitation peak, it is crucial to enhance water storage capacity and irrigation management. Precipitation is unevenly distributed throughout the year, with July receiving the most rainfall and January the least. Adaptive water resource management measures, such as water storage during wet periods and enhanced irrigation systems during dry spells, will help stabilize agricultural production and mitigate the risks associated with fluctuating precipitation.
(2) M-K mutation analysis and the cumulative anomaly method revealed significant mutations in annual precipitation in 1963, 1979, and 2018. The 1963 mutation marked a shift from fluctuating increases to a decline, while the 1979 mutation signified the transition from a dry to a wet period. The 2018 mutation reflected an increase in summer precipitation, significantly impacting annual precipitation. Since 1966, spring precipitation has shown an upward trend, with a mutation in 2006. Summer precipitation changed notably in 1966, 1983, and 2018. Autumn precipitation showed mutations in 1963, 1979, 1995, and 2019, while winter precipitation has increased significantly since 2014, exceeding the 0.05 significance level in 2020.
(3) Periodic analysis shows that the annual precipitation and seasonal precipitation in Harbin city exhibit multi-scale periodicity. The main periods of annual precipitation are 44 a and 58 a. In spring, it is 55 a and 4 a; In summer, it is between 44 a and 27 a; In autumn, it is 44 a and 59 a; In winter, it is 58 a and 8 a. Overall, the oscillations at scales 45–64 a and 32–52 a are the most significant, with clear main period characteristics and distinct periodic variation patterns.
(4) Precipitation periodicity shows a general shortening trend from north to south and east to west. From north to south, cycles transition from long periods in northern regions to shorter, high-frequency cycles in southern regions, reflecting the decreasing influence of large-scale climate oscillations and increasing localized variability. From east to west, while the overall trend aligns with a shortening of cycles, the variation is more influenced by regional climatic systems and topographic factors, leading to greater complexity in periodic patterns. In most areas of Harbin, precipitation shows a significant positive correlation with vegetation indices, highlighting its critical role in promoting vegetation growth and enhancing vegetation health.
(5) The observed trends and periodic variations in precipitation have important implications for water resource planning, agricultural productivity, urban services, and risk management. The increasing trend in annual and seasonal precipitation, especially during summer and autumn, highlights the necessity of improving water storage infrastructure and developing efficient flood control systems to mitigate potential urban flooding and agricultural waterlogging. Given that summer is the peak season for rainfall and contributes the most to annual precipitation, timely and targeted water resource allocation strategies are crucial to ensure agricultural stability and reduce the risks associated with precipitation extremes. The mutation points and oscillatory patterns in precipitation also suggest the need for flexible, adaptive management approaches capable of responding to abrupt climatic shifts. Moreover, the spatial heterogeneity in precipitation periodicity observed across Harbin underscores the importance of localized strategies in infrastructure design and urban planning. These findings can serve as a reference for other northeastern Chinese cities, such as Shenyang and Changchun, which face similar climatic dynamics, to develop broader regional strategies for climate resilience and sustainable development.
Data availability statement
The original contributions presented in the study are included in the article/supplementary material, further inquiries can be directed to the corresponding author.
Author contributions
YF: Writing – original draft. JS: Writing – original draft.
Funding
The author(s) declare that no financial support was received for the research and/or publication of this article.
Conflict of interest
The authors declare that the research was conducted in the absence of any commercial or financial relationships that could be construed as a potential conflict of interest.
Generative AI statement
The author(s) declare that no Generative AI was used in the creation of this manuscript.
Publisher’s note
All claims expressed in this article are solely those of the authors and do not necessarily represent those of their affiliated organizations, or those of the publisher, the editors and the reviewers. Any product that may be evaluated in this article, or claim that may be made by its manufacturer, is not guaranteed or endorsed by the publisher.
References
An, M., Li, C., Peng, Y., and Shi, H. (2024). Analysis of precipitation trend changes in the chishui section of the chishui river over a long period of time. New Era Ecol. Civiliz. (3), 96–100.
An, X., Meng, P., and Liao, G. (2014). Analysis on precipitation sequence trend and cycles in Shenyang. Chin. Agric. Sci. Bull. (26), 184–189. doi:10.11924/j.issn.1000-6850.2013-2976
An, Y. (2024). Analysis of the spatial-temporal evolution patterns of rainfall in the liaohe river basin from 1957 to 2022. Water Conservancy Constr. Manag. (4), 64–70. doi:10.16616/j.cnki.11-4446/TV.2024.04.10
Che, X., Wang, Z., Wang, W., Zhou, Z., Zhang, M., and Du, J. (2014). Analysis of characteristics of precipitation changes about 53 Years in qingyang, gansu Province. Chin. Agric. Sci. Bull. (8), 217–222. doi:10.11924/j.issn.1000-6850.2013-1432
Cheng, P. (2010). Characteristics of precipitation in the Urumqi region over the past 50 years. Arid. Land Geogr. 33 (4), 580–587. doi:10.3724/SP.J.1187.2010.00580
Cui, L. (2014). Analysis of precipitation variation in Harbin over the past 50 years. Water Conservancy Sci. Technol. Econ. (2), 101–102. doi:10.3969/j.issn.1006-7175.2014.02.040
Duan, N., Yang, G., and You, J. (2018). Temporal and spatial evolution of precipitation in wuzhishan city in recent 60 years. South-to-North Water Transfers Water Sci. and Technol. 16 (6), 60–79. doi:10.13476/j.cnki.nsbdqk.2018.0154
Duan, X. (2020). Analysis of the characteristics of precipitation trend change in Hohhot from 1970 to 2015. J. Green Sci. Technol. (14), 21–24. doi:10.16663/j.cnki.lskj.2020.14.005
Fang, L., Chen, L., Qin, X., and Wan, L. (2012). Analysis on variation characteristics of agricultural climate resources during the crop growing season over the last 50 Years in Heilongjiang Province. Chin. J. Agrometeorology (3), 340–347. doi:10.3969/j.issn.1000-6362.2012.03.004
Gao, Y., Wang, J., and Feng, Z. (2017). Variation trend and response relationship of temperature, precipitation and runoff in baiyangdian lake basin. Chin. J. Eco-Agriculture. 25 (4), 467–477. doi:10.13930/j.cnki.cjea.160784
Gu, X., Zhang, P., Zhang, W., Liu, Y., Jiang, P., Wang, S., et al. (2023). A study of drought and flood cycles in Xinyang, China, using the wavelet transform and M-K test. Atmosphere 14, 1196. doi:10.3390/atmos14081196
He, L. Y., Hao, L. S., and Cheng, S. J. (2024). Temporal and spatial characteristics and intraseasonal variations of summer precipitation contribution rates in the haihe river basin. J. Glob. Change Data and Discov. 2, 155–162. doi:10.3974/geodp.2024.02.05
Hu, J., Liu, W., Chang, Z., and Zhang, J. (2017). Study on variation characteristics of precipitation in Lanzhou from 1951 to 2015. Water Resour. Hydropower Eng. 48 (4), 8–12. doi:10.13928/j.cnki.wrahe.2017.04.002
Jiang, L., Chen, K., Liu, D., Lü, J., Wang, L., Gong, L., et al. (2015). Analyses of abnormal rainfall and its influence on crop production during the main flood season of Heilongjiang Province in 2013. Meteorol. Mon. (1), 105–112. doi:10.7519/j.issn.1000-0526.2015.01.013
Jiang, T., Kundzewicz, Z. W., and Su, B. (2008). Changes in monthly precipitation and flood hazard in the yangtze river basin, China. Int. J. Climatol. A J. R. Meteorological Soc. 28 (11), 1471–1481. doi:10.1002/joc.1635
Li, X., Du, J., Hu, X., Qiu, Y., and Liu, H. (2023). Trend analysis of precipitation evolution based on multiple trend analysis methods. Water Resour. Power (10), 14–18. doi:10.20040/j.cnki.1000-7709.2023.20230812
Li, X. D., Wang, Y. Q., Liu, W., Xu, J. J., and Qu, S. M. (2022). Temporal and spatial evolution characteristics of precipitation in typical region of the headwaters of three rivers from 1967 to 2019. J. Yangtze River Sci. Res. Inst. 39 (1), 16. doi:10.11988/ckyyb.20200971
Liang, Q., Li, S., Sun, X., and Zhang, M. (2023). Analysis on characteristics of precipitation distribution in shenzhen city based on cloud model. Water Power (11), 41–47. doi:10.3969/j.issn.0559-9342.2023.11.009
Liu, B., Xu, M., Henderson, M., and Qi, Y. (2005). Observed trends of precipitation amount, frequency, and intensity in China, 1960–2000. J. Geophys. Res. Atmos. 110 (D8). doi:10.1029/2004jd004864
Liu, J., Zhao, Y., and Liu, W. (2024). Impact of climate extremes on agricultural water scarcity and the spatial scale effect. Front. Agric. Sci. Eng. 11 (4), 515–526. doi:10.15302/J-FASE-2024574
Ma, D., Hui, Y., Zhao, J., Wang, B., and Yu, Y. (2023). Spatiotemporal characteristics of rainfall erosivity in Shanxi Province in recent 60 years. Res. Soil Water Conservation 24 (6), 48–31. doi:10.13869/j.cnki.rswc.2023.06.023
Shao, B., Sun, J., Zhu, Y., Wang, T., Liu, J., and Chen, C. (2020). Research on gliding distance estimation of loess landslide based on multiple regression: a case study of Tianshui region, Gansu Province. Geol. Bull. China 39 (12), 1993–2003. doi:10.12097/j.issn.1671-2552.2020.12.013
Sun, J., and Huang, Y. (2022). Modeling the simultaneous effects of particle size and porosity in simulating geo-materials. Materials. 15 (4), 1576. doi:10.3390/ma15041576
Sun, J., Wang, G., Dong, X., Zhang, Y., and Chen, L. (2007). Expansive model and black analysis of expansive soils. Rock Soil Mech. 28 (10), 2055–2059. doi:10.16285/j.rsm.2007.10.030
Sun, J., Wang, G., and Sun, Q. (2009). Crack spacing of unsaturated soils under critical state conditions. Chin. Sci. Bull. 54 (9), 1311–1314. doi:10.1360/csb2009-54-9-1311
Tang, J. (2019). Analysis of precipitation characteristics in tianshan mountain area over the past 55 Years based on MK test. Gansu Water Resour. Hydropower Technol. 1, 5–8. doi:10.19645/j.issn2095-0144.2019.01.002
Wang, T., Cui, X., Yang, Q., and Yu, D. (2014). Characteristics of inter-annual and seasonal changes of temperature and precipitation over Shaanxi Province. Chin. Agric. Sci. Bull. 30 (33), 248–255. doi:10.11924/j.issn.1000-6850.2014-0678
Wang, T., Tao, H., and Yang, Q. (2011). Characteristics of inter-annual and seasonal changes in temperature and precipitation over the nantong region during the period 1960-2007. Resour. Sci. (11), 70–79.
Wu, X., Zhu, R., and Xiong, Y. (2015). “Analysis of the characteristics of drought and flood in shaoguan city from 1956 to 2013”. Guangdong Meteorology, 30–33.
Xue, J., Su, L., Yang, K., and Hu, H. (2016). Temporal and spatial variation characteristics analysis of rainfall in Luoyang city. Water Resour. Power 34 (11), 13–16. doi:10.20040/j.cnki.1000-7709.2016.11.004
Yang, S., Wang, J., Dou, Y., Luan, Q., and Kuang, W. (2023). Spatio-temporal evolution of urbanization and its relationship with regional climate change in Beijing over the past century. Acta Geogr. Sin. (3), 620–639. doi:10.11821/dlxb202303008
Zhang, C., and Sun, J. (2023). Analysis of temporal evolution characteristics of precipitation in beijing. Int. J. Ground Sediment and Water 18, 1141–1157. doi:10.5281/zenodo.7861989
Zhang, Q., Xu, C. Y., Zhang, Z., Chen, Y. D., and Liu, C. L. (2009). Spatial and temporal variability of precipitation over China, 1951-2005. Theor. Appl. Climatol. 95, 53–68. doi:10.1007/s00704-007-0375-4
Zhang, W., Wang, X., and Wang, B. (2024). Spatiotemporal pattern and influencing factors of the ecosystem services in the tabu river basin. Ecol. Environ. Sci. 33 (7), 1142. doi:10.16258/j.cnki.1674-5906.2024.07.015
Zhang, X., Song, L., and Wang, Y. (2018). Analysis of hourly precipitation characteristics in Harbin from 2014 to 2017. Meteorol. Disaster Prev. 25 (3), 6–9. doi:10.3969/j.issn.1006-5229.2018.03.002
Zhang, Y., Qin, J., and Chen, Z. (2008). Analysis on the change characteristics of precipitation in the latest 56 Years in wuhan. Torrential Rain Disasters (3), 253–257. doi:10.3969/j.issn.1004-9045.2008.03.010
Zhang, Z., and Sun, J. (2024). Regional landslide susceptibility assessment and model adaptability research. Remote Sens. 16 (13), 2305. doi:10.3390/rs16132305
Zhao, E., Pang, Y., Jiang, D., and Lu, J. (2019b). Study on characteristics of precipitation series in zhumadian city during 1958-2011. J. China Hydrology (4), 90–96.
Zhao, F., Wang, R., Tian, B., Zhao, H., Lin, W., and Li, X. (2019a). Evolution characteristics of precipitation use efficiency potentiality of maize in dry farming area of Heilongjiang Province. Res. Soil Water Conservation (2), 345–351. doi:10.13869/j.cnki.rswc.a.02.049
Zhao, S., Fan, W., and Yu, N. (2020). Analysis of annual precipitation in the Dongzhi Tableland based on wavelet and MK tests. J. Hebei Univ. Technol. 37, 7–12. doi:10.19797/j.cnki.1000-0852.2019.04.017
Zheng, M., Liu, R., Yang, X., Liu, K., and Zhang, S. (2024). Spatiotemporal variation of precipitation in Hubei Province from 2000 to 2019. J. Yangtze River Sci. Res. Inst. 41 (6), 36–41. doi:10.11988/ckyyb.20230076
Keywords: precipitation analysis, Morlet wavelet analysis, M-K mutation test, climate variability, long-term trends
Citation: Fu Y and Sun J (2025) Spatiotemporal characteristics of precipitation in Harbin City, China, from 1962 to 2020. Front. Environ. Sci. 13:1550421. doi: 10.3389/fenvs.2025.1550421
Received: 23 December 2024; Accepted: 07 April 2025;
Published: 22 April 2025.
Edited by:
Diana Francis, Khalifa University, United Arab EmiratesReviewed by:
Ahmed Kenawy, Mansoura University, EgyptHafeez Noor, Shanxi Agricultural University, China
Xinchen Gu, China Institute of Water Resources and Hydropower Research, China
Copyright © 2025 Fu and Sun. This is an open-access article distributed under the terms of the Creative Commons Attribution License (CC BY). The use, distribution or reproduction in other forums is permitted, provided the original author(s) and the copyright owner(s) are credited and that the original publication in this journal is cited, in accordance with accepted academic practice. No use, distribution or reproduction is permitted which does not comply with these terms.
*Correspondence: Jichao Sun, c3VuamNAY3VnYi5lZHUuY24=