 Xin Zhang
 Chenxi Liu2
- 1Lanzhou Regional Climate Center, Gansu Meteorological Bureau, Lanzho, China
- 2Electronic Information School, Wuhan University, Wuhan, China
Introduction: In the context of global warming, terrestrial ecosystem carbon sequestration is critical for mitigating climate change. However, quantitative estimation of vegetation carbon sinks in arid/semi-arid regions remains a key challenge for understanding global carbon cycling. This study aims to (1) quantify the spatio-temporal dynamics of vegetation carbon sinks in Northwest China (2000–2023) and (2) reveal their responses to climate drivers.
Methods: In this study, by using a multi-source remote sensing dataset of long time series, vegetation Net ecosystem productivity (NEP) in northwestern China (NWC) from 2000 to 2023 was estimated. Based on the NEPs, the spatio-temporal characteristics of vegetation carbon sinks were quantitatively investigated, revealing the spatio-temporal differences in NEP among different underlying surface types. Furthermore, the response relationship between vegetation NEP and climate change was deeply explored by using partial correlation analysis.
Results: (1) From 2000 to 2023, the Northwest China has served as a carbon sink, with an average carbon sequestration of 217.26 g C·m−2·a−1 and a stable upward trend. Spatially, the regions of carbon sink exhibited a distinct zonal pattern along the China’s dry and wet climate boundary. (2) Over the 24-year period, the dynamic changes in NEP have mainly been characterized by low to moderate fluctuations, NEP in most areas of Northwest China showed an increasing trend, and future NEP is predicted to continue increasing. indicating more stable for NEP. The carbon sequestration capacity differs significantly across different land cover types, but it is increasing about total amount, especially in most areas of the Northwest, and this trend is expected to continue in the future. (3) Climate analysis shows that the temperature and precipitation are generally positively correlated with vegetation carbon sinks, while solar radiation is a negatively correlated with carbon sinks in most areas.
Discussion: The research findings provide important references for vegetation restoration and protection, as well as achieving the goals of “carbon peaking” and “carbon neutrality”. Moreover, it offers scientific insights for studying vegetation carbon sinks in terrestrial ecosystems in mid to high latitude regions globally.
1 Introduction
The global climate change caused by the increase in carbon emissions is a significant challenge facing humanity in the 21st century. The continuous rise of CO2 concentration has led to the continuous rise of the global average temperature, which has led to a series of climate and environmental problems, seriously threatening the survival and development of mankind (Fernández-Martínez et al., 2018; Zhang et al., 2019). The Sixth Assessment Report by the Intergovernmental Panel on Climate Change (IPCC) (Lee et al., 2023) emphasizes that global warming has made extreme weather events such as high temperature, drought, rainstorm and flood more frequent. In response to the issue of climate change, particularly global warming, enhancing carbon sinks in terrestrial ecosystems has become the focus of research (Yang Y. et al., 2022).
As an important component of terrestrial ecosystems, vegetation plays a crucial role in regulating the global carbon balance (Piao et al., 2022; Wang et al., 2022). Plants absorb atmospheric CO2 through photosynthesis, and release CO2 through their own respiration (autotrophic respiration) and the decomposition of organic matter in the soil and litter layer (heterotrophic respiration) (Tao et al., 2001). Based on vegetation carbon balance, ecosystems can be categorized as either carbon sources or carbon sinks. The former indicates that CO2 emissions exceed absorption, resulting in a net release, while the latter represents a net absorption state (Piao et al., 2022).
In recent years, quantitative assessments of regional carbon sources/sinks have gradually adopted four main methods: plot inventory method (Tang et al., 2018), eddy covariance method (Yun et al., 2021), atmospheric inversion method (Wang et al., 2020), and remote sensing technology (Yang Y. et al., 2022). Remote sensing technology has strong spatial-temporal continuity and low cost. It usually uses net ecosystem productivity (NEP) to quantitatively describe the carbon source/sink ability of vegetation ecosystem (Chen et al., 2019; He et al., 2021). NEP is the difference between Net Primary Productivity (NPP) of vegetation and soil heterotrophic respiration (Rh). It represents the net absorption or net storage of carbon in vegetation ecosystems (Zheng et al., 2024). The estimation results from remote sensing technology are relatively close to the actual values, making it capable of accurately representing the carbon status of the study area (Wei et al., 2022). Most existing studies have focused on forests (Zhao et al., 2023), grasslands (Fernández-Martínez et al., 2018), or analyzed only a single vegetation type (Xu et al., 2023), land use type (Song et al., 2024), lacking comprehensive research on the entire ecosystem. Moreover, existing research on regional carbon sinks mostly focuses on small regional scales (Lyu et al., 2023; Liu et al., 2023), or uses provinces as units (Yang and Chen, 2022; Wei et al., 2022), with limited studies on large-scale natural geographical areas.
The northwest of China (NWC) consists mainly of arid and semi-arid zones, and also contains humid and semi-humid zones, with complex climatic conditions. The complexity of climate change and the fragility of ecosystems hinder the quantitative assessment of carbon balance and the exploration of influencing factors. Currently, there have been numerous studies analyzing vegetation coverage changes and vegetation NPP in the surrounding areas of the Northwest, providing a basic understanding of vegetation growth in this region (Gong et al., 2024). However, there is relatively little research further exploring vegetation carbon sinks. Therefore, studying the relationship between the carbon sink patterns of terrestrial ecosystems and climate factors in the Northwest, and accurately assessing the vegetation carbon pool and its dynamic changes in this region, will help in understanding the feedback relationship between climate change and vegetation in arid and semi-arid areas, and promote the increase of carbon sinks and reduction of carbon sources in vegetation.
In this study, the vegetation NEP in Northwest China from 2000 to 2023 has been estimated by integrating long-time-series multi-source remote sensing data and ground-based observational data. It identifies vegetation carbon source areas and carbon sink areas, explores the spatiotemporal variation characteristics of vegetation carbon sources/sinks, and refines the spatiotemporal differences of NEP across different land cover types. Furthermore, it examines the response relationship between vegetation NEP and climate factors. The results provide important references for vegetation restoration and conservation, as well as for achieving “carbon peak” and “carbon neutrality” goals. Additionally, it offers scientific insights for studying vegetation carbon sinks in terrestrial ecosystems in mid- to high-latitude regions globally.
2 Materials and methods
2.1 Study area
The Northwestern region of China, located in the hinterland of the Eurasian continent and the northern part of the Qinghai-Tibet Plateau, covers approximately 3.079 million square kilometers, accounting for about 32% of China’s land area (Figure 1). Its administrative divisions from east to west include Shaanxi Province, Gansu Province, Ningxia Hui Autonomous Region, Qinghai Province, and Xinjiang Uygur Autonomous Region. The NWC comprises several mountain systems, such as the Altai Mountains, Tianshan Mountains, Kunlun Mountains, Karakoram Mountains, Altun Mountains, Qilian Mountains, and Helan Mountains. It also includes diverse landforms such as the Hexi Corridor, Junggar Basin, Tarim River Basin, Turpan Basin, Taklimakan Desert, Gobi Desert, and other basins and deserts (including the Taklimakan Desert, the world’s second-largest mobile desert). The region also includes a variety of complex terrain, such as Hexi Corridor, Junggar Basin, Tarim River basin, Turpan Basin, Taklimakan Desert and so on.
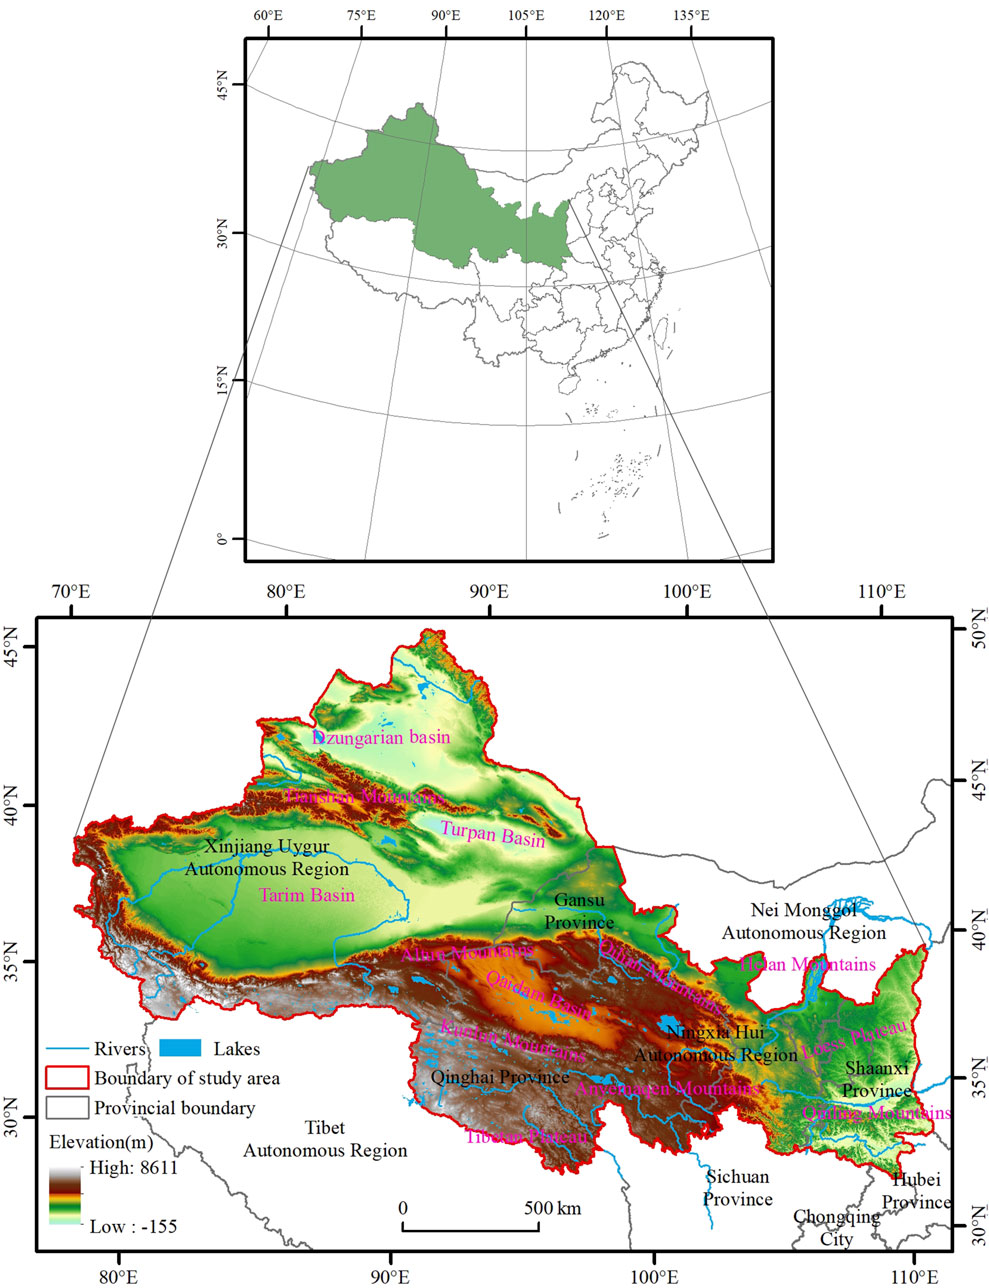
Figure 1. Location of the study area.
The NWC is deeply inland with precipitation of less than 600 mm, high variability in precipitation, and frequent droughts. It is one of the main areas sensitive to climate change and ecologically fragile areas in China, greatly affected by climate change (Zhang et al., 2023b; Jia et al., 2019). Over the past three decades, the Northwestern region has exhibited characteristics of rising temperatures and increasing precipitation, indicating a trend towards “warmth and humidity” phenomenon (Li et al., 2021).
2.2 Data sources and processing
NPP data (MOD17A3HGF) data were obtained from the NASA EOSDIS Land Processes Distributed Active Archive Center (https://www.usgs.gov/), with a spatial resolution of 500 m and a temporal interval of 1 year. This product has been widely recognized by international scholars for its high accuracy and continuous sequence length. Existing studies have already applied it to vegetation growth research in Northwest China, demonstrating high precision and adaptability in the study area.
Land cover type data were selected from the MODIS product (MCD12Q1) (https://www.usgs.gov/), which was generated at 500 m according to the International Geosphere-Biosphere Programme (IGBP) Global Vegetation Classification Scheme. In this study, it was reclassified into seven categories: forest, grassland, cropland, wetland, urban and built-up areas, water, and barren for the period from 2000 to 2022, with data for 2023 not yet released. The Digital Elevation Model (DEM) data were obtained from the Data Center for Resources and Environmental Sciences, Chinese Academy of Sciences (https://www.resdc.cn/), with a spatial resolution of 500 m. The vector boundaries of China’s arid and humid regions were provided by the Map Network (http://map.ps123.net/china/11468.html). These boundaries were imported into ArcGIS and manually vectorized after geometric correction.
Temperature, precipitation, and solar radiation data were obtained from the Tianqing system of the China Meteorological Administration. The study area includes 350 stations.
2.3 Data processing
Data preprocessing primarily concerns the preprocessing of remote sensing data and ground-based meteorological data, detailed as follows:
2.3.1 NPP data preprocessing
MOD17A3HGF data, with a spatial resolution of 500 m, undergoes projection transformation, mosaicking, clipping, and resampling using the MODIS Reprojection Tool. Through spatial overlay analysis with the MCD12Q1 land cover classification product (based on the IGBP classification scheme), the analysis shows that invalid-value pixels exhibit significant spatial coupling in barren, water, and urban and built-up areas, demonstrating strong spatial consistency. To maintain spatiotemporal continuity in the study area, eliminate the impact of invalid values in barren and other regions on subsequent spatiotemporal analysis, and enhance the spatial consistency of NEP estimation results, invalid-value areas are masked.
2.3.2 Meteorological data preprocessing
Temperature, precipitation, and solar radiation data from 350 benchmark meteorological stations in the study area undergo quality-checking, with missing data and outliers (e.g., unrealistic temperature, precipitation, or solar radiation values) being flagged. Kriging interpolation is applied for data reconstruction of these missing and outlier values. Then, quality-controlled daily data are aggregated (for precipitation) or averaged (for temperature and solar radiation) to create an annual series. Subsequently, ANUSPLIN-based spatial interpolation is conducted with a digital elevation model introduced as a covariate. A statistical relationship between meteorological elements and geographical parameters is established through thin-plate splines, generating annual climate-element raster datasets at a 500 m spatial resolution.
2.3.3 Data spatiotemporal consistency processing
Multi-source data, including preprocessed NPP data, meteorological data (annual temperature, precipitation, and solar radiation), and land cover type data, are spatially and temporally matched, then integrated to ensure consistent spatiotemporal resolution.
2.4 Methods
This study estimates soil heterotrophic respiration (Rh) using multi-source data such as NPP data, temperature data, and precipitation data. By calculating the difference between NPP and Rh, vegetation NEP in Northwest China from 2000 to 2023 is obtained, identifying the vegetation carbon source and sink areas in Northwest China. The linear trend of NEP is estimated using the combined method of Theil-Sen Median trend analysis and Mann-Kendall test. The stability and sustainability of NEP are assessed based on the coefficient of variation (Cv) and Hurst index. Furthermore, the differences in vegetation carbon sinks across different land cover types are refined. Finally, partial correlation analysis is conducted to deeply evaluate the relationship between climate factors (temperature, precipitation, and solar radiation) and NEP.
2.4.1 Vegetation net ecosystem productivity
NEP is an important indicator for estimating regional vegetation carbon sources and sinks. Without considering other natural and anthropogenic factors, vegetation carbon sinks can be represented by the difference between NPP and soil microbial respiration carbon emissions (Equation 1):
where NEP represents the Net Ecosystem Productivity, NPP represents the Net Primary Productivity of vegetation, and Rh represents the soil microbial respiration. When NEP > 0, it indicates that the carbon fixed by vegetation is greater than the carbon emitted by soil, indicating a carbon sink; otherwise, it is a carbon source.
Soil microbial respiration is related to the number and species of microorganisms in soil, plant root exudates, temperature and precipitation. Among all factors affecting soil microbial respiration, temperature and precipitation are the two most important factors. Pei et al. (2009) established a fitting equation for precipitation, temperature, and carbon emissions based on extensive experimental data to estimate regional soil microbial respiration. This formula has relatively low data requirements and a simple model structure. Importantly, the geographic characteristics of the study area are closely related to the Northwestern region of China, reducing the instability of the model and the uncertainty of the data. Moreover, this method has been successfully applied and validated in arid ecosystems in China (Wei et al., 2022; Lyu et al., 2023). Soil microbial respiration (Equation 2):
here, T represents temperature (°C), and R represents precipitation (mm).
2.4.2 Trend analysis
The Theil-Sen Median trend analysis combined with the Mann-Kendall test is a robust statistical method for analyzing long time series data (Theil, 1992; Sen, 1968; Hoaglin et al., 2000). It has been widely applied in the analysis of long time series in meteorology, hydrology, vegetation, and other fields (Jiang et al., 2015; Gocic and Trajkovic, 2013). The Theil-Sen Median trend analysis reflects whether the element shows an increasing or decreasing trend when the slope is greater than 0 or less than 0, respectively. The Mann-Kendall test is used to determine the significance of the trend, where a Z value greater than 1.64, 1.96, and 2.58 indicates passing the significance test at the 90%, 95%, and 99% confidence levels, respectively. Due to space limitations, please refer to reference (Gocic and Trajkovic, 2013) for the specific formulas. The detailed classification is provided in Table 1.
Table 1. Mann-Kendall test trend categories.
2.4.3 Stability analysis
The stability of NEP in the Northwestern region from 2000 to 2023 was measured by the pixel-based coefficient of variation (Cv) (Milich and Weiss, 2010). The coefficient of variation (Equation 3):
where σ represents the standard deviation, and x represents the mean value. The coefficient of variation reflects the degree of data dispersion. A smaller Cv value indicates a more concentrated data distribution and higher stability over time, while a larger value indicates greater fluctuations over time and lower stability.
2.4.4 Sustainability analysis
The Hurst exponent, denoted as H, characterizes the persistence or anti-persistence features of a time series, providing insights into possible future trends of the sequence (Edwin, 1951). This study used R/S analysis to estimate the Hurst index and analyze the persistence characteristics of NEP. Please refer to the literature for the basic principle (Tong et al., 2018).
The Hurst exponent ranges between 0 and 1. If 0.5 < H < 1, it indicates a persistent sequence with long-term correlations. For vegetation carbon source-sink dynamics, the Hurst index can characterize the inertial features of NEP change trends. If 0.5 < H < 1, the NEP series in Northwest China from 2000 to 2023 exhibits a persistent pattern, indicating that the future trends are likely to continue in the same direction as past trends, with stronger persistence as H approaches 1. If H = 0.5, the NEP time series is random, and future changes are independent of past trends. If 0 < H < 0.5, it indicates anti-persistence, with lower H values implying stronger anti-persistence.
2.4.5 Partial correlation analysis
In this study, partial correlation analysis is employed to examine the relationships between NEP in the northwest region and climate factors such as temperature, precipitation, and solar radiation. Partial correlation analysis refers to analyzing the linear correlation between two variables while controlling for the influence of other variables (Venna et al., 2021) (Equation 4).
where Rwx,y, Rwz,y, and Rxz,y represent the first-order partial correlation coefficients between variables w and x, variables w and z, and variables x and z, respectively.
3 Results
3.1 Interannual variability
Using the vegetation net ecosystem productivity model, this study estimated the NEP in the northwest region from 2000 to 2023, and its temporal characteristics are depicted in Figure 2. The mean NEP in NWC ranged from 169.82 to 246.63 g C·m−2·a−1 during the period of 2000–2023, with an average of 217.26 g C·m−2·a−1 over the 24 years. The annual average NEP for Xinjiang, Qinghai, Gansu, Ningxia, and Shaanxi were 155.26, 137.40, 335.79, 175.88, and 431.75 g C·m−2·a−1. Overall, the northwest region acts as a carbon sink.

Figure 2. Temporal change trend of NEP in NWC from 2000 to 2023.
The NEP values in the northwest region exhibit a stable increasing trend (Figure 2). The rate of increase of vegetation carbon sink capacity was as follows: Shaanxi (7.218 g C·m−2·a−1) > Gansu (4.969 g C·m−2·a−1) >Ningxia (3.825 g C·m−2·a−1) > Xinjiang (1.767 g C·m−2·a−1) > Qinghai (1.459 g C·m−2·a−1). Except for Ningxia and Gansu, which show considerable fluctuations in vegetation carbon sink capacity, other provinces demonstrate steady increases.
3.2 Spatiotemporal pattern
3.2.1 Temporal change trends
The spatial distribution of average carbon sources and sinks in Northwest China from 2000 to 2023 exhibits distinct zonal characteristics (Figure 3a). NEP shows a pattern of being higher in the east and south, and lower in the west and north, with plains and mountains having higher values, and plateaus and basins having lower values. The vegetation carbon sink capacity displays a high-low-high trend from southeast to northwest. The carbon source areas (NEP < 0) account for about 0.28% of the study area. These areas are mainly distributed around the edges of the Taklamakan Desert, Gashun Gobi, and Kumtag Desert. These regions are characterized by proximity to deserts, poor soil conditions, harsh natural environments, and low vegetation cover. The low carbon sink areas (0 ≤ NEP < 200) account for approximately 56.34% of the study area and are mainly distributed on both sides of the 200 mm isohyet. In Northwest China, the low carbon sink areas in the eastern part are located north of the 200 mm isohyet, the central low carbon sink areas are south of the 200 mm isohyet, and the low carbon sink areas in the northwest of Xinjiang are east of this line. The medium carbon sink areas (200 ≤ NEP < 400) are concentrated north of the 400 mm isohyet in the eastern part of Northwest China. The high carbon sink areas (NEP ≥ 400) are relatively scarce and concentrated, mainly located south of the 400 mm isohyet in the Qinling region, where abundant precipitation and favorable temperatures support vegetation growth.
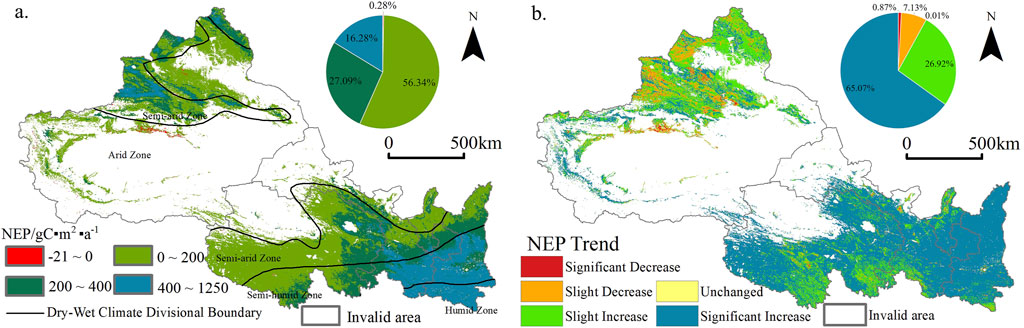
Figure 3. Spatial distribution and variations of NEP: (a) Average NEP spatial distribution; and (b) NEP trends during 2000–2023.
3.2.2 Spatiotemporal change trends
The NEP data has passed the autocorrelation test and meets the requirements for trend analysis. Through trend analysis and significance testing (Figure 3b), the spatiotemporal variation trend of NEP from 2000 to 2023 mainly shows an increase. The areas with increasing and decreasing NEP trends account for 91.99% and 8.00%, respectively, with 65.07% and 0.87% of the regions exhibiting significant increases or decreases. In the eastern part of Northwest China, which includes the high and medium carbon sink areas, the vegetation carbon sink capacity has significantly strengthened. The areas with decreasing NEP are fewer, accounting for about 8.00% of the total area, mainly concentrated around the Tianshan Mountains and scattered around the main urban areas.
3.2.3 Spatiotemporal change trends
This study calculated the coefficient of variation for NEP in the NWC over a 24-year period, and visualized it using the natural breaks method (Figure 4). The proportions of low, lower, medium, higher, and high fluctuation areas of vegetation NEP account for 37.11%, 34.96%, 22.34%, 4.22%, and 1.37%, respectively. The overall distribution pattern is characterized by a large head and small tail, coexistence of high and low fluctuations, with low fluctuations being predominant. The average coefficient of variation for NEP in the northwest region from 2000 to 2023 is 0.19, indicating relatively small overall changes. There are obvious spatial differences in NEP stability. High fluctuation areas are predominantly located on the northern side of the Tianshan Mountains and the northern part of the Tarim Basin. Medium fluctuation areas are largely found in the northeastern part of the NWC. Low fluctuation areas are situated in the southern part of the NEC, where vegetation NEP is relatively stable.
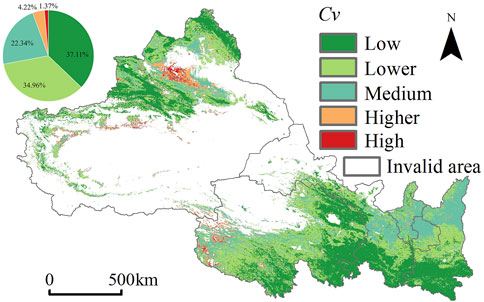
Figure 4. Spatial distribution of variation coefficient of NEP.
3.2.4 Different vegetation carbon source/sink changes by land cover type
This study calculates the land cover transition matrix based on the land cover type maps of the years 2000, 2011, and 2022. Here, we visualize it using a Sankey diagram (Cuba, 2015). The Sankey diagram in Figure 5 illustrates the continuity and changes in land cover types in the NWC during the two time periods (2000–2011, 2011–2022). The stacked bar chart represents the relative quantities of each land cover type in 2000, 2011, and 2022. The height of each component in the stacked bars is proportional to the relative abundance of the land cover categories represented in the study area (Sinha et al., 2020).
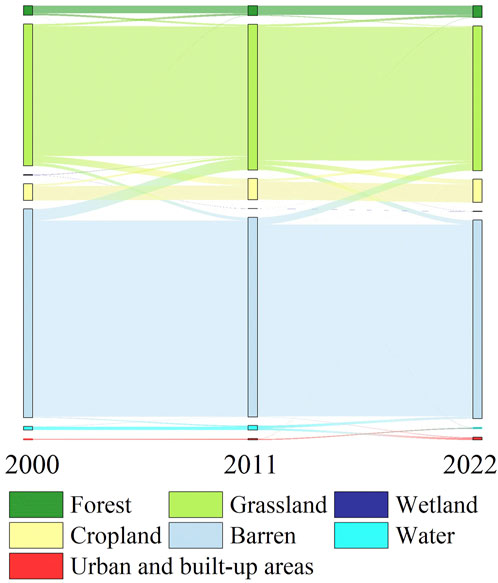
Figure 5. The land cover type transition Sankey diagram in the NWC.
In 2022, the land cover types in the northwest region mainly comprised barren, grassland, and cropland, accounting for 51.98%, 37.81%, and 6.09% of the total area. Urban and built-up areas occupied a smaller area, accounting for only 0.31%. From 2000 to 2022, forest, grassland, cropland, urban and built-up areas showed an expanding trend, increasing by 0.58%, 0.66%, 1.77%, and 0.01%. However, the areas of barren, water and wetlands decreased by 2.66%, 0.29% and 0.07%. Most land did not undergo changes in land cover type during 2000–2022, with only 7.76% of land changing between 2000 and 2011, and 4.18% changing between 2011 and 2022.
Based on the average NEP changes for different land cover types from 2000 to 2022 (excluding water and barren), it can be observed that all land cover types function as carbon sinks, with only some land cover types at the desert edges acting as carbon sources. The carbon sink areas are ranked as follows: forest > cropland > wetland > grassland > urban and built-up areas. The vegetation carbon sink shows a steady upward trend (Figure 6), with the rate of increase in vegetation carbon sink capacity as follows: forest (8.5469 g C·m−2·a−1) > wetland (3.4486 g C·m−2·a−1) > urban and built-up areas (2.7333 g C·m−2·a−1) > cropland (1.9699 g C·m−2·a−1) > grassland (1.7324 g C·m−2·a−1). It is noteworthy that, unlike the significant fluctuations in the average NEP of forests, the average NEP of grassland and cropland shows relatively stable interannual fluctuations during the study period.
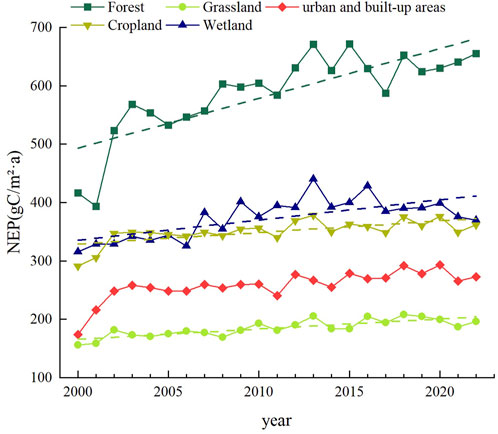
Figure 6. The change trend in average NEP for different land cover types.
3.3 NEP sustainability trends
The above results mainly explains the “pattern-process” of NEP in NWC over 24 years, and the future trends are still uncertain. Therefore, this study calculated the Hurst index of NEP in the study area. Anti-sustainability accounts for 84.91% of the total area, while sustainability accounts for 14.59%, indicating that the same direction characteristics of NEP changes in the NWC are stronger than the reverse characteristics.
By overlaying the spatial trend of vegetation NEP (Figure 3b) with the Hurst index calculation results, we obtained the persistence distribution of NEP changes from 2000 to 2023 (Figure 7). In the NWC, the areas with continuous increase, and decrease then increase account for 78.43% and 1.27% of the study area, respectively. The area where NEP first increases and then decreases accounts for 6.73% of the region, with a very scattered distribution. It is relatively concentrated in key ecological areas around the Tianshan Mountains, the northern part of the Qilian Mountains, and the Tanggula Mountains. Preventive measures should be taken to prevent these areas from developing a trend towards degradation. In the future, the NEP in Northwest China is expected to continue increasing, but key ecological areas still require close attention.
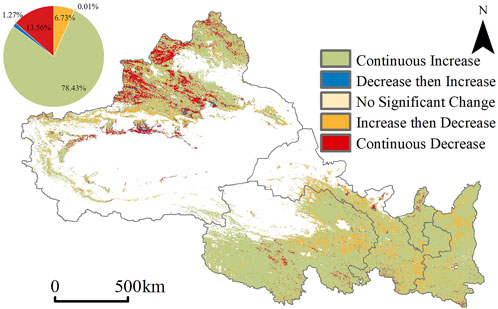
Figure 7. Spatial Characteristics of NEP based on trend variation and Hurst index.
3.4 The relationship between vegetation carbon sink and climate factors
Vegetation growth is primarily influenced by climate change and human factors (Yang et al., 2022). In Section 3.2.4, it is noted that over 90% of the land in the study area did not undergo land cover type changes, so this study mainly investigates the impact of climate factors on vegetation changes in Northwest China. Precipitation, temperature, and radiation are key factors affecting vegetation growth, and their interplay imposes complex and varied constraints on vegetation activity (Zhao et al., 2018). To understand the reasons behind the variation in vegetation NEP in the northwest region, we analyzed the correlation between NEP and temperature, precipitation, and solar radiation. To understand the reasons for the changes in NEP in Northwest China, we analyzed the correlations between NEP and temperature, precipitation, and solar radiation.
From 2000 to 2023, the annual average temperature, precipitation, and solar radiation in the northwest region showed a fluctuating increasing trend (Figures 8a–c). The phenomenon of “warming and humidification” gradually became apparent, with increases in annual average temperature, precipitation, and solar radiation of 0.04°C, 0.03 mm, and 5.47 MJ/m2. Spatially, the multi-year average temperature exhibited an “Ω” shaped increasing trend from southwest to northeast, while precipitation showed a decreasing trend from southeast to northwest, and solar radiation exhibited a pattern of high in the middle and low on the periphery. Overall, the eastern region had better thermal and hydrological conditions compared to the western region.
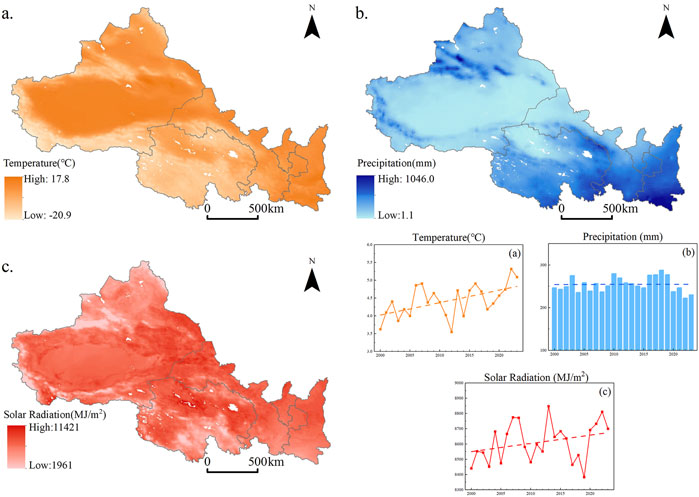
Figure 8. Variation of the annual temperature (a), precipitation (b), solar radiation (c) and spatial distribution of the temperature (a), precipitation (b), solar radiation (c) in the NWC.
All data meet the assumptions of residual normality and homoscedasticity for partial correlation analysis. Figure 9a shows that a large area of the study region exhibits a positive correlation with temperature, with positively correlated areas accounting for 78.54% and negatively correlated areas accounting for 21.45%. The temperature and NEP changes are significantly negatively correlated (P < 0.0369, n = 24) on both sides of the Tianshan Mountains and in the border areas of Shaanxi, Gansu, and Ningxia, indicating that rising temperatures may hinder net ecosystem productivity. The areas in Northwest China where NEP is significantly correlated with temperature account for 12.89%. The regions with a significant (P < 0.0495, n = 24) positive correlation account for 12.61%, mainly distributed in the Tianshan Mountains, Qilian Mountains, Animaqing Mountains, Tanggula Mountains, and Qinling Mountains. It is noteworthy that in the carbon source areas, NEP is negatively correlated with temperature, meaning that as temperature increases, NEP decreases, and carbon release increases.
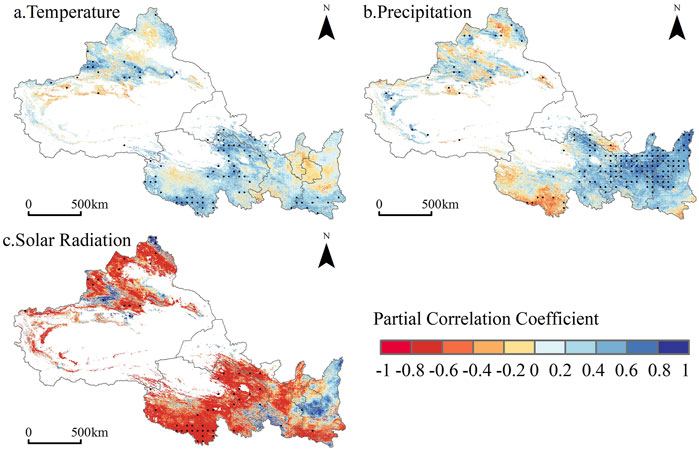
Figure 9. Spatial distribution of partial correlation coefficients between NEP and Temperature (a), Precipitation (b), and Solar Radiation (c) in NWC from 2000 to 2023 (Note: Black dots mark pixels with a significant trend (P < 0.0495)).
NEP shows a positive correlation with precipitation (Figure 9b), with positively correlated areas covering 75.20% and negatively correlated areas covering 24.80%. Areas with a significant positive correlation (P < 0.0493, n = 24) account for 24.61%, mainly distributed in northern Shaanxi, Ningxia, central Gansu, and parts of eastern Qinghai. Areas with a significant negative correlation (P < 0.0436, n = 24) account for 1.74%, mainly located in southern Qinghai. In the carbon source areas, NEP is negatively correlated with precipitation, meaning that as precipitation increases, NEP decreases, and carbon release increases. Therefore, overall, an increase in precipitation positively impacts the net ecosystem productivity in Northwest China, with only a few areas showing a negative correlation with precipitation.
The partial correlation distribution between NEP and solar radiation is shown in Figure 9c. The areas with positive and negative correlations cover 42.07% and 57.93%, respectively. Areas with a significant positive correlation (P < 0.0313, n = 24) account for 2.26%, scattered in northern Xinjiang, southeastern and southwestern Gansu. Areas with a significant negative correlation (P < 0.0414, n = 24) account for 5.95%, scattered in central Xinjiang, southern Qinghai, and near the Qilian Mountains. In the carbon source areas, NEP is negatively correlated with solar radiation, meaning that as radiation increases, NEP decreases, and carbon release increases. Therefore, the overall impact of radiation on NEP shows a negative correlation.
4 Discussion
4.1 Spatiotemporal dynamics of NEP
This study estimated NEP using the widely employed method of subtracting soil respiration from NPP, as commonly utilized in previous research (Cao et al., 2023; Jiang et al., 2015). The average NEP was 217.26 g C·m−2·a−1 from 2000 to 2023, and the average NEP values for Xinjiang, Qinghai, Gansu, Ningxia, and Shaanxi were 155.26, 137.40, 335.79, 175.88, and 428.44 g C·m−2·a−1. These values are not significantly different from previous studies on NEP estimates (Lyu et al., 2023; Cao et al., 2023). The majority of the Northwest region exhibits a significant upward trend in vegetation NEP, particularly in the eastern areas. This aligns with previous studies on the spatiotemporal evolution and future trends of vegetation NEP or NPP (Yuan et al., 2023; Zuo et al., 2023).
The distribution of carbon sinks in the Northwest shows a distinct zonal pattern, which largely coincides with the boundaries of arid and humid zones. This indicates that climate exerts a significant controlling influence on carbon sink distribution. The land cover in humid regions is predominantly forest, which has strong carbon sink capacity, making the vegetation carbon sink capacity in these regions the highest. Arid regions, dominated by grasslands and deserts, have sparse or no vegetation, leading to low carbon sequestration capacity. Areas with medium to high fluctuations in vegetation NEP stability account for 27.93% of the total area, likely reflecting the ecological fragility of the region.
Additionally, this study explored the NEP changes across different land cover types in the Northwest. Since the beginning of this century, the types of land cover in the region have not undergone significant changes. There are notable differences in NEP values and rates of change across different land cover types, with forests showing the highest NEP values and rates of change, consistent with previous research findings (Lyu et al., 2023). It is worth noting that the carbon sink capacity of croplands ranks second only to that of forests, while grasslands have the lowest carbon sink capacity. Furthermore, the so-called “cropland carbon sink hotspots” may be linked to agricultural irrigation in arid regions (Zeng et al., 2023). As for grasslands, their carbon sink capacity is the lowest, likely due to the impacts of grazing pressure (Li et al., 2020).
4.2 Impact of climate change on vegetation carbon sink
Climate factors have played a major driving role in the changes of vegetation carbon sinks (Jiao et al., 2024). As shown in Section 3.2.4, more than 90% of the land in the study area did not experience changes in land cover types, indicating that human activities have had minimal impact on the Northwest region. Among meteorological factors, heat and water are the primary controlling factors that determine the zonal distribution of vegetation growth (Niu et al., 2015). Partial correlation analysis results show that NEP has a stronger positive correlation with precipitation than with temperature, while NEP’s significant relationship with solar radiation is weak and shows a negative correlation. Water and heat conditions, especially water availability, are key factors limiting the improvement of vegetation carbon sink capacity. This observation is generally consistent with previous research (Li et al., 2020; Liu et al., 2024).
Under the background of “warming and wetting” in the Northwest, the increase in temperature can accelerate the greening of vegetation and extend the growing period (Piao et al., 2007; Wang et al., 2023), which is beneficial for the ecosystem’s carbon absorption. Particularly, the alpine vegetation systems in high-altitude areas are more sensitive to these changes. However, under the stress of high temperatures, photosynthesis in vegetation can be weakened or even halted, while respiration increases, which can adversely affect the carbon sequestration capacity of vegetation (Salvucci and Crafts-Brandner, 2004). Precipitation, as a crucial water source for the arid and semi-arid regions of the Northwest, is the primary factor influencing changes in vegetation carbon sources and sinks (Zhang et al., 2023a). Since the beginning of this century, precipitation in the Northwest has shown an increasing trend, helping to store moisture in the soil and alleviate poor vegetation growth caused by water scarcity. The Northwest region is a high-energy solar radiation area (Yao et al., 2023); however, excessive infrared or ultraviolet radiation inhibits vegetation growth, negatively affecting carbon sinks.
4.3 Conservation of key ecological areas
Although most areas are projected to show a sustained increase in NEP, key ecological regions such as the Tianshan, Qilian, and Tanggula Mountains may face significant impacts from climate fluctuations and anti-persistent changes. Given the fragility of these ecosystems, rising temperatures and altered precipitation patterns could intensify soil erosion, vegetation degradation, and water scarcity, thereby weakening their carbon sink function and potentially triggering a shift from carbon sinks to carbon sources.
To ensure the stability of the carbon sink function in these ecologically vulnerable areas, we recommend the following measures:
1. Long-term ecological monitoring of these regions should be strengthened, comprehensive ecological environment databases should be established, and the dynamic impacts on vegetation growth, carbon stock changes, and climatic factors should be tracked in real-time.
2. Ecological restoration projects, such as the Three-North Shelter Forest program, should be promoted, and local governments and farmers should be encouraged to participate in forest restoration and grassland protection through ecological compensation mechanisms (Zuo et al., 2023).
3. Community engagement should be prioritized by valuing the interaction between ecological protection and local communities, encouraging green agriculture and sustainable grazing management, reducing anthropogenic pressures, and enhancing ecosystem resilience.
5 Conclusion and prospects
5.1 Main conclusion
This study utilized NEP as an evaluation metric to identify carbon source and sink areas in the northwestern China, analyzing the spatiotemporal characteristics and future trends of vegetation carbon source/sink dynamics. Additionally, an in-depth analysis was conducted to explore the impact of climate change on NEP, providing valuable insights into the contribution of climate to NEP. Our findings include:
1. Carbon Sink Characteristics: From 2000 to 2023, the northwestern region of China functioned as a carbon sink, with the average carbon sink capacity of 217.26 g C·m−2·a−1, showing a consistent increase. The spatial distribution of carbon sinks exhibits distinct zonal characteristics, showing a “high-low-high” pattern from southeast to northwest along the boundary of dry and wet zones.
2. Spatiotemporal Dynamics: Over the 24-year period, most areas in the northwest region have shown an increasing trend in NEP. The dynamic changes of most vegetation NEP in the study area are characterized by low to moderate fluctuations and high stability. In the future, the NEP in Northwest China is expected to continue increasing. Across the region, land cover types remained largely unchanged, and nearly all acted as carbon sinks. The carbon sequestration capacity is specifically manifested as: forest > cropland > wetland > grassland > urban and built-up areas.
3. Climate Influence: Climate factors played a primary driving role in the changes of vegetation carbon source/sink in the NWC from 2000 to 2023. During this period, there was a fluctuating increasing trend in the annual average temperature, precipitation, and solar radiation in the region, indicating a gradual transition towards warmer and wetter conditions. Temperature has a positive effect on the vegetation carbon sink in 78.54% of the area, promoting carbon sequestration, while precipitation positively influences the vegetation carbon sink in 75.20% of the area. Conversely, solar radiation hindered carbon sequestration in 57.93% of the area.
5.2 Research limitations and prospects
Although this study has revealed the spatiotemporal dynamics of vegetation carbon sources and sinks in Northwest China, the following limitations still need attention:
1. Uncertainty in NEP estimation: Although the current soil respiration model has been widely verified, the parameterization based on single-year experimental data may introduce errors. In future research, it is necessary to integrate multi-source observation data (such as long-term fixed station monitoring data, isotope tracing technology, etc.) to improve the characterization accuracy of respiratory processes.
2. Limitation of research time scale: Due to data availability constraints, the study period (2000–2023) cannot fully capture the century-scale evolution patterns of vegetation carbon sinks. Subsequent research should consider combining paleoecological records with model simulation methods to systematically expand the time dimension analysis.
3. Complexity of multi-factor coupling mechanism: While this study focuses on the impact of climatic factors on NEP, the interactions between changing CO2 concentrations, extreme climatic events, and human activities (such as grazing intensity regulation and urban expansion processes) have not been quantified. Future research urgently needs to develop multi-factor coupling models. By systematically analyzing the weight differences between natural and anthropogenic factors, the understanding of carbon cycle mechanisms can be deepened.
Data availability statement
The raw data supporting the conclusions of this article will be made available by the authors, without undue reservation.
Author contributions
XZ: Conceptualization, Data curation, Formal Analysis, Methodology, Software, Supervision, Writing – original draft, Writing – review and editing. CL: Conceptualization, Software, Writing – review and editing. YJ: Funding acquisition, Supervision, Visualization, Writing – review and editing.
Funding
The author(s) declare that financial support was received for the research and/or publication of this article. The Gansu Basic Research Innovation Group, “Cryosphere disaster and pastoral habitat quality and safety in Gansu Province” (23JRRA567), The Innovation and Development Special Project of China Meteorological Administration, “Research on the Ecological Benefit Evaluation Method of Artificial Precipitation (Snow) in Typical Areas of Northwest China” (CXFZ2025J036), and Project supported by the Program of the State Key Laboratory of Cryospheric Science and Frozen Soil Engineering, Chinese Academy of Sciences, “Ecological environment vulnerability assessment and driving force analysis of the Qilian Mountains cryosphere” (CSFSE-KF-2402).
Conflict of interest
The authors declare that the research was conducted in the absence of any commercial or financial relationships that could be construed as a potential conflict of interest.
Generative AI statement
The author(s) declare that no Generative AI was used in the creation of this manuscript.
Publisher’s note
All claims expressed in this article are solely those of the authors and do not necessarily represent those of their affiliated organizations, or those of the publisher, the editors and the reviewers. Any product that may be evaluated in this article, or claim that may be made by its manufacturer, is not guaranteed or endorsed by the publisher.
References
Cao, S., He, Y., Zhang, L., Sun, Q., Zhang, Y., Li, H., et al. (2023). Spatiotemporal dynamics of vegetation net ecosystem productivity and its response to drought in Northwest China. GIScience and Remote Sens. 60 (1). doi:10.1080/15481603.2023.2194597
Chen, J. M., Ju, W., Ciais, P., Viovy, N., Liu, R., Yang, J., et al. (2019). Vegetation structural change since 1981 significantly enhanced the terrestrial carbon sink. Nat. Commun. 10 (1), 4259. doi:10.1038/s41467-019-12257-8
Cuba, N. (2015). Research note: Sankey diagrams for visualizing land cover dynamics. Landsc. Urban Plan. 139, 163–167. doi:10.1016/j.landurbplan.2015.03.010
Edwin, H. H. (1951). Long-term storage capacity of reservoirs. Trans. Am. Soc. Civ. Eng. 116 (2), 770–799. doi:10.1061/taceat.0006518
Fernández-Martínez, M., Sardans, J., Chevallier, F., Ciais, P., Obersteiner, M., Vicca, S., et al. (2018). Global trends in carbon sinks and their relationships with CO2 and temperature. Nat. Clim. Change 9 (1), 73–79. doi:10.1038/s41558-018-0367-7
Gocic, M., and Trajkovic, S. (2013). Analysis of changes in meteorological variables using Mann-Kendall and Sen's slope estimator statistical tests in Serbia. Glob. Planet. Change 100, 172–182. doi:10.1016/j.gloplacha.2012.10.014
Gong, H., Wang, G., Wang, X., Kuang, Z., and Cheng, T. (2024). Trajectories of terrestrial vegetation productivity and its driving factors in China's drylands. Geophys. Res. Lett. 51 (20), e2024GL111391. doi:10.1029/2024gl111391
He, Q., Ju, W., Dai, S., He, W., Song, L., Wang, S., et al. (2021). Drought risk of global terrestrial gross primary productivity over the last 40 Years detected by a remote sensing-driven process model. J. Geophys. Res. Biogeosciences 126 (6), 53–61. doi:10.1029/2020jg005944
Hoaglin, D. C., Mosteller, F., and Tukey, J. W. (2000). Understanding robust and exploratory data analysis. New York: Wiley-Interscience.
Jia, J., Liu, H., and Lin, Z. (2019). Multi-time scale changes of vegetation NPP in six provinces of northwest China and their responses to climate change (in Chinese). Acta Ecol. Sin. 39 (14), 5058–5069. doi:10.5846/stxb201808241810
Jiang, W., Yuan, L., Wang, W., Cao, R., Zhang, Y., and Shen, W. (2015). Spatio-temporal analysis of vegetation variation in the yellow River Basin. Ecol. Indic. 51, 117–126. doi:10.1016/j.ecolind.2014.07.031
Jiao, K., Liu, Z., Wang, W., Yu, K., McGrath, M. J., and Xu, W. (2024). Carbon cycle responses to climate change across China's terrestrial ecosystem: sensitivity and driving process. Sci. Total Environ. 915, 170053. doi:10.1016/j.scitotenv.2024.170053
Lee, H., Calvin, K., Dasgupta, D., and Krinner, G. (2023). Climate change 2023: synthesis Report. Geneva: Intergovernmental Panel on Climate Change.
Li, M., Sun, H., and Su, Z. (2021). Research progress in dry/wet climate variation in Northwest China (in Chinese). Geogr. Res. 40 (4), 1180–1194. doi:10.11821/dlyj020200328
Li, Z., Chen, Y., Zhang, Q., and Li, Y. (2020). Spatial patterns of vegetation carbon sinks and sources under water constraint in Central Asia. J. Hydrology 590, 125355. doi:10.1016/j.jhydrol.2020.125355
Liu, C., Shi, S., Wang, T., Gong, W., Xu, L., Shi, Z., et al. (2023). Analysis of net primary productivity variation and quantitative assessment of driving forces-A case study of the yangtze River Basin. Plants (Basel) 12 (19), 3412. doi:10.3390/plants12193412
Liu, W., Jiang, L., Liu, B., and Liu, R. (2024). Spatio⁃temporal evolution characteristics and driving factors analysis of vegetation carbon sources/sinks in China(in Chinese). Acta Ecol. Sin. 44 (4), 1456–1467. doi:10.20103/j.stxb.202303090445
Lyu, J., Fu, X., Lu, C., Zhang, Y., Luo, P., Guo, P., et al. (2023). Quantitative assessment of spatiotemporal dynamics in vegetation NPP, NEP and carbon sink capacity in the Weihe River Basin from 2001 to 2020. J. Clean. Prod. 428, 139384. doi:10.1016/j.jclepro.2023.139384
Milich, L., and Weiss, E. (2010). GAC NDVI interannual coefficient of variation (CoV) images: ground truth sampling of the Sahel along north-south transects. Int. J. Remote Sens. 21 (2), 235–260. doi:10.1080/014311600210812
Niu, C., Lou, A., Sun, R., and Li, Q. (2015). Foundations in ecology. Beijing: Higher Education Press.
Pei, Z., Ouyang, H., Zhou, C., and Xu, X. (2009). Carbon balance in an alpine steppe in the Qinghai-Tibet plateau. J. Integr. Plant Biol. 51 (5), 521–526. doi:10.1111/j.1744-7909.2009.00813.x
Piao, S., Fang, J., Ciais, P., Peylin, P., Huang, Y., Sitch, S., et al. (2022). Perspectives on the role of terrestrial ecosystems in the ‘carbon neutrality’ strategy. Sci. China Earth Sci. 65, 1178–1186. doi:10.1007/s11430-022-9926-6
Piao, S., Friedlingstein, P., Ciais, P., Viovy, N., and Demarty, J. (2007). Growing season extension and its impact on terrestrial carbon cycle in the Northern Hemisphere over the past 2 decades. Glob. Biogeochem. Cycles 21 (3), GB3018. doi:10.1029/2006gb002888
Salvucci, M. E., and Crafts-Brandner, S. J. (2004). Inhibition of photosynthesis by heat stress: the activation state of Rubisco as a limiting factor in photosynthesis. Physiol. Plant 120 (2), 179–186. doi:10.1111/j.0031-9317.2004.0173.x
Sen, P. K. (1968). Estimates of the regression coefficient based on kendall's tau. J. Am. Stat. Assoc. 63, 1379–1389. doi:10.2307/2285891
Sinha, R. K., Eldho, T. I., and Subimal, G. (2020). Assessing the impacts of land cover and climate on runoff and sediment yield of a river basin. Hydrological Sci. J. 65 (12), 2097–2115. doi:10.1080/02626667.2020.1791336
Song, S., Kong, M., Su, M., and Ma, Y. (2024). Study on carbon sink of cropland and influencing factors: a multiscale analysis based on geographical weighted regression model. J. Clean. Prod. 447, 141455. doi:10.1016/j.jclepro.2024.141455
Tang, X., Zhao, X., Bai, Y., Tang, Z., Wang, W., Zhao, Y., et al. (2018). Carbon pools in China's terrestrial ecosystems: new estimates based on an intensive field survey. Proc. Natl. Acad. Sci. U. S. A. 115 (16), 4021–4026. doi:10.1073/pnas.1700291115
Tao, B., Ge, Q., Li, K., and Shao, X. (2001). Progress in the studies on carbon cycle in terrestrial ecosystem (in Chinese). Geogr. Res. 5, 564–575. doi:10.11821/yj2001050006
Theil, H. (1992). A rank-invariant method of linear and polynomial regression analysis. Proc. K. Ned. Akad. Wet. 53, 1397–1412.
Tong, S., Lai, Q., Zhang, J., Bao, Y., Lusi, A., Ma, Q., et al. (2018). Spatiotemporal drought variability on the Mongolian Plateau from 1980-2014 based on the SPEI-PM, intensity analysis and Hurst exponent. Sci. Total Environ. 615, 1557–1565. doi:10.1016/j.scitotenv.2017.09.121
Venna, S. R., Katragadda, S., Raghavan, V., and Gottumukkala, R. (2021). River stage forecasting using enhanced partial correlation graph. Water Resour. Manag. 35 (12), 4111–4126. doi:10.1007/s11269-021-02933-0
Wang, G., Peng, W., Zhang, L., and Zhang, J. (2023). Quantifying the impacts of natural and human factors on changes in NPP using an optimal parameters-based geographical detector. Ecol. Indic. 155, 111018. doi:10.1016/j.ecolind.2023.111018
Wang, S., Zhang, Y., Ju, W., Chen, J. M., Ciais, P., Cescatti, A., et al. (2020). Recent global decline of CO2 fertilization effects on vegetation photosynthesis. Science 370, 1295–1300. doi:10.1126/science.abb7772
Wang, Y., Wang, X., Wang, K., Chevallier, F., Zhu, D., Lian, J., et al. (2022). The size of the land carbon sink in China. Nature 603, E7–E9. doi:10.1038/s41586-021-04255-y
Wei, X., Yang, J., Luo, P., Lin, L., Lin, K., and Guan, J. (2022). Assessment of the variation and influencing factors of vegetation NPP and carbon sink capacity under different natural conditions. Ecol. Indic. 138, 108834. doi:10.1016/j.ecolind.2022.108834
Xu, T., Zhang, A., Xu, X., and Jia, G. (2023). Synchronized slowdown of climate warming and carbon sink enhancement over deciduous broadleaf forests based on FLUXNET analysis. Ecol. Indic. 155, 111042. doi:10.1016/j.ecolind.2023.111042
Yang, H., and Chen, W. (2022). Spatio-temporal pattern of urban vegetation carbon sink and driving mechanisms of human activities in Huaibei, China. Environ. Sci. Pollut. Res. Int. 29 (21), 31957–31971. doi:10.1007/s11356-022-18512-8
Yang, S., Liu, J., Wang, C., Zhang, T., Dong, X., and Liu, Y. (2022). Vegetation dynamics influenced by climate change and human activities in the Hanjiang River Basin, central China. Ecol. Indic. 145, 109586. doi:10.1016/j.ecolind.2022.109586
Yang, Y., Shi, Y., Sun, W., Chang, J., Zhu, J., Chen, L., et al. (2022). Terrestrial carbon sinks in China and around the world and their contribution to carbon neutrality. Sci. China Life Sci. 65, 861–895. doi:10.1007/s11427-021-2045-5
Yao, Y., Zheng, S., Dong, H., and Shi, J. (2023). Anomaly temporal-spatial distribution of solar radiation in Northwest China(in Chinese). Arid Zone Res. 40 (6), 863–873. doi:10.13866/j.azr.2023.06.02
Yuan, Z., Jiang, Q., and Yin, J. (2023). Impact of climate change and land use change on ecosystem net primary productivity in the Yangtze River and Yellow River Source Region, China. Watershed Ecol. Environ. 5, 125–133. doi:10.1016/j.wsee.2023.04.001
Yun, H., Tang, J., D’Imperio, L., Wang, X., Qu, Y., Liu, L., et al. (2021). Warming and increased respiration have transformed an alpine steppe ecosystem on the Tibetan plateau from a carbon dioxide sink into a source. J. Geophys. Res. Biogeosciences 127 (1), 1–15. doi:10.1029/2021jg006406
Zeng, J., Zhou, T., Wang, Q., Xu, Y., Lin, Q., Zhang, Y., et al. (2023). Spatial patterns of China's carbon sinks estimated from the fusion of remote sensing and field-observed net primary productivity and heterotrophic respiration. Ecol. Inf. 76, 102152. doi:10.1016/j.ecoinf.2023.102152
Zhang, D., Zhao, Y., and Wu, J. (2023a). Assessment of carbon balance attribution and carbon storage potential in China's terrestrial ecosystem. Resour. Conservation Recycl. 189, 106748. doi:10.1016/j.resconrec.2022.106748
Zhang, J., Liu, M., Zhang, M., Yang, J., Cao, R., and Malhi, S. S. (2019). Changes of vegetation carbon sequestration in the tableland of Loess Plateau and its influencing factors. Environ. Sci. Pollut. Res. Int. 26 (22), 22160–22172. doi:10.1007/s11356-019-05561-9
Zhang, Q., Yang, J., Wang, P., Yu, H., Yue, P., Liu, X., et al. (2023b). Progress and prospect on climate warming and humidification in Northwest China. Chin. Sci. Bull. 68, 1814–1828. doi:10.1360/tb-2022-0643
Zhao, F., Xu, B., Yang, X., Xia, L., Jin, Y., Li, J., et al. (2018). Modelling and analysis of net primary productivity and its response mechanism to climate factors in temperate grassland, northern China. Int. J. Remote Sens. 40 (5-6), 2259–2277. doi:10.1080/01431161.2018.1516322
Zhao, N., Wang, K., and Yuan, Y. (2023). Toward the carbon neutrality: forest carbon sinks and its spatial spillover effect in China. Ecol. Econ. 209, 107837. doi:10.1016/j.ecolecon.2023.107837
Zheng, B., Wu, S., Liu, Z., Wu, H., Li, Z., Ye, R., et al. (2024). Downscaling estimation of NEP in the ecologically-oriented county based on multi-source remote sensing data. Ecol. Indic. 160, 111818. doi:10.1016/j.ecolind.2024.111818
Keywords: vegetation carbon, net ecosystem productivity, spatiotemporal dynamics, multisource remote sensing, northwest China
Citation: Zhang X, Liu C and Jiang Y (2025) Spatiotemporal dynamics of terrestrial vegetation carbon sinks and its response to climate change in northwest China. Front. Environ. Sci. 13:1550501. doi: 10.3389/fenvs.2025.1550501
Received: 23 December 2024; Accepted: 20 May 2025;
Published: 03 June 2025.
Edited by:
Jason G. Su, University of California, Berkeley, United StatesReviewed by:
Guoyin Wang, Fudan University, ChinaEahsan Shahriary, University of California, Berkeley, United States
Copyright © 2025 Zhang, Liu and Jiang. This is an open-access article distributed under the terms of the Creative Commons Attribution License (CC BY). The use, distribution or reproduction in other forums is permitted, provided the original author(s) and the copyright owner(s) are credited and that the original publication in this journal is cited, in accordance with accepted academic practice. No use, distribution or reproduction is permitted which does not comply with these terms.
*Correspondence: Youyan Jiang, amlhbmd5b3V5YW4xOTgxQDE2My5jb20=