 Renato Oliveira Silva Junior1,2*
 Wilson Nascimento Junior1,3
 Adayana Maria Queiroz Melo1,2Helena Pereira Almeida1,2
 Marcio Sousa Silva1,2Francisco Souza Oliveira4
 Aline Maria Meiguins De Lima4
- 1Vale Technological Institute (ITV), Belém, Brazil
- 2Researcher in the Environmental Geology and Water Resources Group, Belém, Brazil
- 3Researcher of the Socioeconomics Group, Belém, Brazil
- 4Institute of Geosciences, Federal University of Pará, Belem, Brazil
In this study, we evaluate the water sustainability of the Itacaiúnas River watershed (IRW) in the eastern Amazon using an adapted water sustainability index (WSI). This basin stands out for its intense mineral and agricultural activities across its extent. The index was adapted from the methodology proposed by Chavez and Alipaz (2007), which uses a weighted average to combine different indicators, with weights defined based on the coefficient of variation of the indicators that make up the WSI. This study’s approach integrates the environmental (E) dimension, represented by forest fragmentation; the hydrological (H) dimension, associated with hydrological variability; the social (S) dimension, related to the social progress index; and the public policy (PP) dimension, which considers the pressure from the user sectors. The calculated WSI was 0.37, indicating low water sustainability, which reflected deforestation, forest fragmentation, hydrological variability, and social disparities among the municipalities that comprise the IRW. The environmental dimension demonstrated an increase in forest fragmentation in the territory between 2008 and 2022. The hydrological analysis revealed low water availability during dry periods, which was associated with climatic seasonality, insufficient hydrometeorological data, and climate change. In the social dimension, mining municipalities had the most significant social indicator, but the economic benefit of the activity did not extend to all municipalities in the basin. The public policy dimension indicated high demand, mainly for mining, agriculture, and human supply. The results highlight the need for strategic actions, such as expanding hydrological monitoring, environmental restoration, and strengthening water resource management.
1 Introduction
The geographical territory and that defined by the watershed oppose and complement each other in approaches to land use and the use of natural resources, including water. The main opposition lies in the confrontation between the boundaries of administrative units (such as municipalities and states) and that defined by the water unit (river basin). The direct consequence of the opposition is the difficulty of articulating public policies for shared management, which are aimed at resolving conflicts over the multiple uses of water and land, both for the productive sector and for state and municipal management.
Integrative forms of analysis usually use indicators that aim to understand the greatest number of existing relationships, covering the macrosocial, economic, and environmental approaches, but trying to extract differences through the spatial distribution of the analysis variables and how they behave over time. Among the definitions of indices, those that focus on the relationship between the demand and availability of water are separate from those that represent specific factors, such as the water governance factor (Juwana et al., 2012; Jarzebski et al., 2024). Water sustainability is, therefore, understood as guaranteeing water demand without compromising the supply, with the capacity to adapt to meet future needs (Gonzales and Ajami, 2015; Da Silva et al., 2020).
For quantifying water sustainability, indicators based on maintaining qualitative and quantitative water standards include the following: the water resilience index (WRI) (Malkina-Pykh and Pykh, 2001), DPSIR model linked with water quality indices (Alexakis, 2021), and water quality indexes (Derdour et al., 2022). Composite factor indices enhance management aspects by associating the quantitative components of water consumption and management; these are generally based on weighted analyses according to aggregate value scales, such as the watershed sustainability index (WSI) (Chaves and Alipaz, 2007); sustainability index for water resources planning and management (Sandoval-Solis et al., 2011); sustainable development of energy, water, and environment systems (SDEWES) (Kılkış, 2019); sustainable water management index (SWaM_Index) (Maiolo et al., 2019); hydro–social–economic–environmental sustainability index (HSEESI) (Zamanzad-Ghavidel et al., 2021); and water sustainability indicator based on a multireference methodology (WSI-MR) (De Castro-Pardo et al., 2022).
To address specific factors, various proposals have sought to simulate local issues to better characterize a given problem or environment, such as the water poverty index (WPI) (Molle and Mollinga, 2003), urban water sustainability framework (UWS) (Gonzales and Ajami, 2015), aquifer sustainability index (ASI) (Senent-Aparicio et al., 2015), water system performance index (WSPI) (Goharian and Burian, 2018), river basin water sustainability index (RBWSI) (Da Silva et al., 2020), water service sustainability index (WSSD) (Mvongo et al., 2021), water service sustainability index (WSSD) (Mvongo et al., 2021), rural water sustainability index (RWSI) (Crispim and Fernandes, 2022), and irrigation sustainability index (Cánovas-Molina et al., 2023).
Discussing the application of water sustainability indicators in the Amazon region includes addressing water demand and availability in a basin renowned for its abundant waters, but also the problems of quality and accessibility for human consumption and direct use in the productive sector (Lathuillière et al., 2016; Figueiredo and Ioris, 2021). The Tocantins–Araguaia River basin flows into the estuary of the Amazon River basin and partly inherits several of the latter’s characteristics (especially the link to forest cover) in its mid-lower reaches. The biggest difference between them is in the compromised water supply because of seasonal climatic factors, especially in the upper reaches. The Amazon basin is also affected by climatic conditions, but the greatest variations are more linked to extreme conditions, whereas in the Tocantins–Araguaia basin, in addition to extremes, there is an annual variability with a well-defined dry period in the basin (Junqueira et al., 2020; Oliveira Serrão et al., 2021; Pelicice et al., 2021). Thus, these two watersheds that compose the northern region of Brazil represent an expressive quantity of water, with multiple associated uses, but they also include factors that threaten water sustainability and that must be evaluated on multiple scales.
As a rule, the application of water resource management instruments in Brazil, especially in the northern region, has been slow and disconnected from the local context. It reflects the process of the colonization of the Amazon, particularly in the study area in southeastern Pará, which involved a territorial transformation based on an exogenous development model, dictated by public policies and economic cycles, which determined and strongly influenced the worsening of local socioeconomic and environmental standards (Ferreira et al., 2020). In this sense, in this study, we seek to contribute to assessing the development of the territory of the Itacaiúnas River Watershed (IRW). To achieve this, the river basin sustainability Index (RBSI) was used, which was adapted from the one proposed by Chaves and Alipaz (2007), in which the environmental, hydrological, social, and pressure situations of the water user sectors in the basin were analyzed.
2 Study area
The IRW is located between the 05°10′ and 07°15′ S latitudes and the 48°37′ and 51°25′ W longitudes in the eastern Amazon (Figure 1), within the Tocantins–Araguaia hydrographic basin (Brazil, 2003). Its drainage, an area of approximately 42,000 km2, is made up of the sub-basins of the Itacaiúnas (11,177 km2), Parauapebas (9,522 km2), Vermelho (7,208 km2), Sororó (3,610 km2), Cateté (3.657 km2), Aquiri (1,767 km2), Cinzento (815 km2), Tapirapé (2,663 km2), and Preto (1268 km2). It has a steep relief that varies between 80 m and 900 m of altitude, in which the Serra de Carajás stands out (400 m–900 m). In the basin area, two types of land cover are predominant: tropical forest and mountain savannah, and the dominant land uses are extensive pastures that surround a mosaic of forest remnants made up of indigenous lands and conservation units, which occupy 11,700 km2, which is approximately a quarter of the total basin area (Souza-Filho et al., 2016).
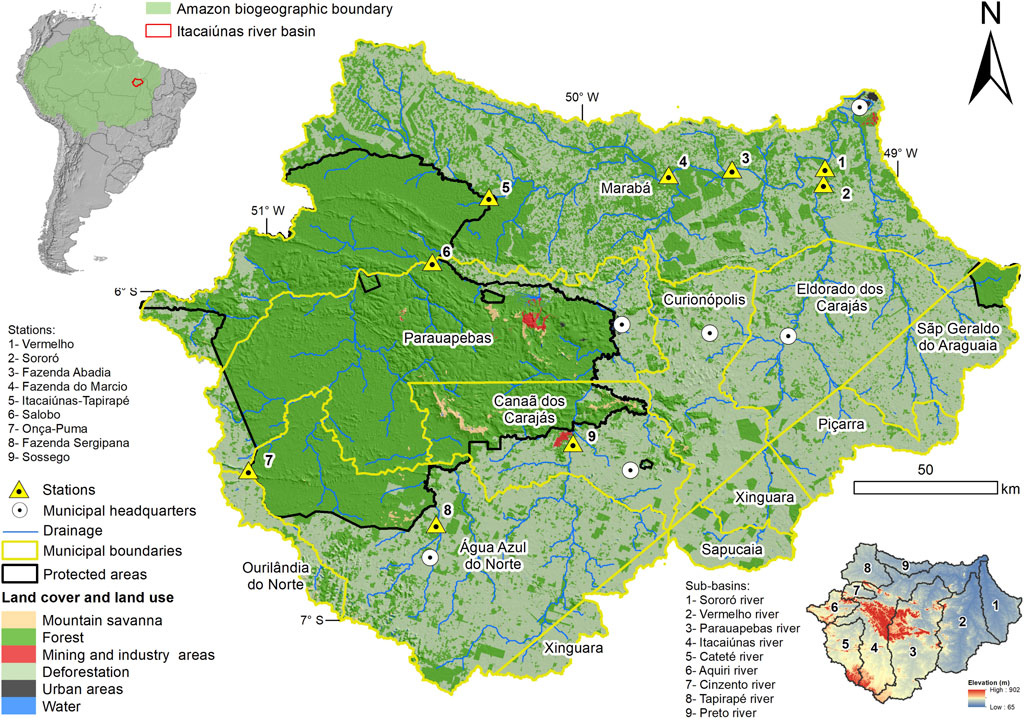
Figure 1. Location of the study area and physiographic features—drainage network, watersheds, and rainfall and fluviometric monitoring points.
The IRW area includes the following municipalities: Marabá, Curionópolis, Eldorado dos Carajás, Parauapebas, São Geraldo do Araguaia, Canaã dos Carajás, Piçarra, Água Azul do Norte, Xinguara, Sapucaia, and Ourilândia. The municipalities that contribute most to the gross domestic product (GDP) are as follows: Parauapebas, Marabá, and Canaã dos Carajás, with a direct impact on the state’s GDP. These municipalities stand out for their intense mineral activity, with the presence of large mining projects such as the Carajás Mining Complex (Silva and Vidal, 2022). Curionópolis and Eldorado dos Carajás make a significant economic contribution, but it is on a smaller scale than the first three. The other municipalities, such as Água Azul do Norte, Xinguara, Sapucaia, Ourilândia do Norte, Piçarra, and São Geraldo do Araguaia, have less significant economies, are generally focused on agricultural activities, and have less industrialization (Cirilo and Almeida, 2020).
The uses of water resources in the IRW vary between municipalities. The purposes for which licenses are issued include human supply, irrigation, industry, mineral extraction, effluent dilution, and earthwork compaction. Municipalities such as Canaã dos Carajás and Marabá have a wide range of uses, whereas Piçarra has no permits issued. In Parauapebas, water resources were used for flood control, landscaping, and industrial washing, among other purposes. In the case of São Geraldo do Araguaia, the only registered use was for industry. These grants reflect the diversity of the uses of water resources in the region, depending on local demands (Sousa and Silva-Júnior, 2020).
The IRW is currently monitored by 26 hydrometeorological stations, 23 of which are run by the Vale Sustainable Development Technological Institute (ITV DS) and three by the National Water and Basic Sanitation Agency (ANA). In total, it has a density of approximately 1,600 km2/station, which is in accordance with WMO standards (WMO, 2013; Ferreira et al., 2024). The climate of the region is typical of the monsoon (Am), characterized as tropical rainy climate (hot and humid), with an average air temperature above 26 °C (INMET, 1992; Alvares et al., 2014). Specifically, in the IRW, the average temperature recorded is 27.2 °C, with the lowest annual temperature of 26.6 °C occurring in January and the highest temperature of 28.1 °C occurring in September. The rainy season, which occurs between November and May, and the dry season, which occurs between June and October, are well defined, with annual precipitation rates that can vary between 1,800 mm and 2,300 mm in the rainy season and between 10 mm and 350 mm in the dry season (Moraes et al., 2005; Silva Júnior et al., 2017). The Intertropical Convergence Zone (ITCZ) and South Atlantic Convergence Zone (SACZ) influence the weather conditions in this region.
3 Materials and methods
The River Basin Sustainability Index (RWSI) was adapted from the one proposed by Chaves and Alipaz (2007) and applied to the IRW (Figure 2), based on the environmental, hydrological, social, and pressure situations of the water user sectors in the basin were analyzed.
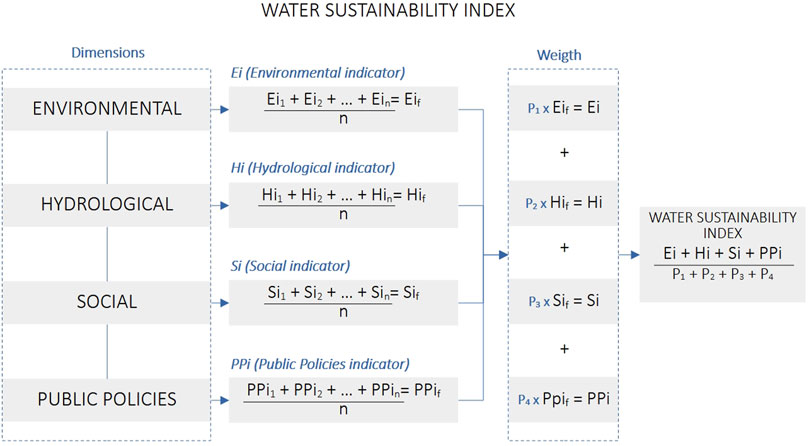
Figure 2. Summary of the evaluation process of the proposed indicators for defining the water sustainability index of the Itacaiúnas River Watershed (WSI-IRW).
3.1 Environmental (E) factor
The environmental dimension, one of the pillars of sustainable development, is fundamental for understanding the relationship between human beings and the environment.
The information on the vegetated area in the IRW is obtained from the land-cover and land-use mapping carried out by Souza Filho et al. (2016), Souza Filho et al. (2018) for 2013 using Landsat images, and Nunes et al. (2019) for 2008 and 2017 using Landsat and Sentinel images, respectively. For mapping 2022, the object-oriented classification approach (GEOBIA) was used, which consists of segmenting images using the similarity criteria by region growth, which generated segments called objects that present information related to the size, brightness, texture, shape, and spatial relationships between the segments generated (Blaschke et al., 2014).
The years referred to for analysis in this study were chosen with the aim of understanding the situation in the IRW after the establishment of the new forestry code in 2012 (Federal Law 12.651/12) (Brazil, 2012). Regarding the situation of native vegetation cover, the new code established that rural properties must maintain an area with native vegetation cover as a legal reserve and created rules for rural landowners who deforested their rural properties before 22 July 2008. Owners of medium and large rural properties must commit to recovering the legal reserve area established by the code in accordance with the rules of SISNAMA (the National Environment System) and must do so within 20 years. Owners of small rural properties (less than four fiscal modules) can use the area set aside as a legal reserve for other land-use purposes, and the remaining native vegetation must be maintained.
For the Legal Amazon, the reserve area in a forest environment must comprise 80% of the property. For the Cerrado environment, it is 35%, and it is 20% for the other regions of the country. In this research, the proposed environmental dimension is represented by two environmental indicators. The first, called the vegetation cover indicator, consists of analyzing the percentage of vegetated areas. The value of the indicator is expressed as a decimal percentage, that is, the value of the vegetated areas would be within the range of 0 (no vegetation) to 1 (totally covered by vegetation). The second, called the indicator of the density of fragments in areas with vegetation, aims to analyze the level of fragmentation of the remnants. Fragments larger than 5 ha were selected because smaller areas might not represent blocks of native vegetation. An analysis of the density of fragments per km2 of vegetated areas was carried out to detect the state of forest fragmentation in the basin.
The presence of forest remnants in a watershed results in a decrease in the environmental quality, leading to an increase in soil erosion processes, a reduction in biodiversity, a reduction in genetic variability, and a change in the water regime as vegetation cover plays an important role in the quality and availability of water because its functions include protecting the soil and watercourses (Azevedo et al., 2016; Hentz et al., 2015).
Thus, the density of fragments was classified on a scale of 0–1 to compose the indicator. A value of 0 represents an area without forest fragmentation and a value of 1 indicates a greater number of remnants. Table 1 shows the relationship between the density values and the corresponding indicator number.

Table 1. Environmental indicator of the density of plant fragments per vegetated area in IRW.
The expression representing the value of the environmental dimension (Equation 1) is constituted by the arithmetic mean between the percentage of vegetated area in the watershed (Ei1) and the density of fragments (Ei2):
Here, Ei1 is the indicator of the vegetated area in the IRW, Ei2 is the indicator of the density of fragments in the vegetated area, and Eif is the final environmental indicator.
3.2 Hydrological (H) factor
The assessment of water availability using historical flows is based on the method developed by the ANA (technical note no. 75/2020/SPR) and the discussion presented in the study by Cruz and Tucci (2008), who highlight the calculation of the minimum flows as the basis of the water resource management processes, where the reference flows adopted are generated from the flow permanence curves (Q50, Q90, and Q95). It does not portray the spatial variation of flows throughout the basin but relates the flow and the percentage of the time of permanence in the historical period adopted, and it is a probability of occurrence that helps in the planning and management of water use in a river basin.
Table 2 summarizes the data adopted according to the hydrological monitoring carried out in the basin by the Vale Sustainable Development Technological Institute (ITV DS) (Melo et al., 2022; Melo et al., 2023).

Table 2. Average and reference flows according to the river-flow monitoring in the basin.
Based on the flows in Table 2, the ratio between the 95% flow (Rq) (Q95) of the permanence curve and the average flow (Qmd) was calculated. According to Clarke and Tucci (2003), this makes it possible to estimate the variability of the flow throughout the year as Q95 is a value of the dry season behavior of a basin, and the average flow is the synthesis of all the flows over time (Equation 2).
The classification described by Rodrigues et al. (2015) was modified to fit the relationship of Equation 2 with the understanding that the approach referring to the minimum flows (Q7,10, Q90, and Q95) remains (Silveira and Tucci, 1998; Clarke and Tucci (2003). Thus, the values are described as low for Rq < 0.1, medium for Rq values between 0.1 and 0.3, high for Rq values between 0.3 and 0.4, and very high for Rq values greater than 0.4. The Fazenda Alegria fluviometric station (ID-29100000, monitored by the ANA) located in the IRW near its mouth was used as a reference for the total behavior of the river basin, with the average flow and minimum flow values (Q7,10, Q90, and Q95) defined by Alves (2022) for the period from 1985 to 2014, totaling 30 years.
To determine the precipitation seasonality index, hourly data from ERA5-Land reanalysis (Muñoz-Sabater, 2019a; Muñoz-Sabater, 2019b) were used for the period 2008 to 2022. Produced by the European Center for Medium-Range Weather Forecasts (ECMWF), ERA5-Land is an improved dataset for the land component of the fifth generation of the European Reanalysis (ERA5) (Muñoz-Sabater et al., 2021). ERA5-Land produces a total of 50 variables, describing the cycles globally and hourly with a spatial resolution of 9 km (0.1° × 0.1°) (Malardel et al., 2016). Currently, this dataset has been widely used in many studies to assess the conditions of the Earth’s surface (Chen et al., 2021; Wang et al., 2022; Dos Santos Silva et al., 2023).
The rainfall seasonality index was adapted and calculated based on the method developed by Walsh and Lawler (1981), which makes it possible to classify the annual rainfall regime and investigate its variability, along with classifying the average rainfall regime for the period and obtaining its degree of replicability. The rainfall indices used as the analysis parameters are the individual seasonality index (Hi1) and the general seasonality index (Hi2).
Hi1 is used to identify the monthly contrasts in rainfall seasonality. This index makes it possible to classify the rainfall regime of each year and assess its variability. Here, X is the accumulated monthly rainfall in month n and Ri is the accumulated annual rainfall, both in year i (Equation 3):
Hi2 makes it possible to detect contrasts in annual rainfall seasonality patterns, and it serves as a parameter for classifying the average rainfall regime of a period (Equation 4). Here, considering a period of N years (Equations 5, 6),
The indices Hi1 and Hi2 can vary from 0 to 1.83; the rainfall regime classes are defined between these two extreme values. In addition, to construct the hydrological dimension based on these indices, these classes were divided into scales of five score levels that, in this case, range from an optimum condition to a weaker or unfavorable condition (1–0), as shown in Table 3.

Table 3. Rainfall regime classes based on individual and general seasonality indices.
The average annual rainfall data were used to find the value of the weights that will make up the sustainability indicator for the IRW. To do that, the average, standard deviation, and dispersion coefficient of the historical series were calculated.
3.3 Social (S) factor
To construct the social dimension of the WSI-IRW, the Amazon social progress index (SPI) was used (Santos et al., 2023). This index is a territorial management tool that measures social progress in the Brazilian Amazon. The Amazon SPI is calculated using secondary public data from official bodies, research centers, and civil society institutions (Santos et al., 2023) and varies on a scale from 0 to 100. The SPI, made up of exclusively social and environmental indicators, is aggregated into three dimensions (basic human needs, foundations for well-being, and opportunities) and 12 components (nutrition and basic medical care, water and sanitation, housing, personal security, access to basic knowledge, access to information and communication, health and well-being, environmental quality, individual rights, individual freedoms and choice, social inclusion, and access to higher education).
According to Barbosa and Bilotta (2024), the SPI allows for a better understanding of the social weaknesses of the areas studied, including aspects such as accessibility to quality basic services, education, health, environmental variables, communication, and the exercise of human rights. To estimate the levels of social development for the IRW, the SPI was divided into a scale made up of five score levels (0–1) (Table 4).

Table 4. Proposed values for defining the social indicator in the IRW based on IPS 2023.
The social Si indicator can be expressed using Equation 7:
Here,
3.4 Pressure from sectors
In terms of analyzing the pressure dimension of the water-use sectors, the following parameters were evaluated: average consumption per capita (Csmd-pcta, l/inhab/day) and flows granted (m3/day) for human supply (AbH), use in mining (Mn), irrigation (Ir), rural supply (AbRu), industrial use (UInd), urban use (AbUr), and other types of grant (Out). The structuring considered discharge into water bodies and underground and surface abstractions. The data presented (621 data points, from 2006 to 2024) were synthesized from the information base provided by the State Secretariat for the Environment and Sustainability (SEMAS, 2024). The average consumption per capita and the population served were based on information from the National Sanitation Information System (SNIS, 2023) for the municipalities that constitute the IRW.
Gonzales and Ajami (2015) defined the factors of supply, demand, and adaptive capacity of water resources. To integrate the pressure variables of the water-use sectors, supply–demand relationships are adopted, which translate into the “diversity of water demand” criterion. It is defined as the fraction allocated to a given use type considering the distribution given by the Gini–Simpson index (Equation 8), where the lower the value is, the more the demand tends to be concentrated in a few use types. The aim is to treat the demand for water as the result of the interactions among land use, economic activities, and the supply for human consumption in each basin.
3.5 Water sustainability index for the Itacaiúnas River Watershed (WSI-IRW)
The WSI-IRW is a modified proposal by Chaves and Alipaz (2007), observing its examples applied to the scenario of the hydrographic basins of the Brazilian territory, more precisely those of the northern region marked by the presence of diverse ecosystems. It ranges from forests (Amazonian) with the presence of wetlands to savannah cover, is delimited by the Cerrado and its transition zone, and has a rainfall pattern in which in the Amazon portion is predominantly defined by rainy and dry seasons (Silva Júnior et al., 2017). Meanwhile, in the Cerrado, the effect of seasonality is marked with a well-defined dry period (Gama Rego et al., 2013; Roboredo et al., 2016; Ferreira et al., 2020; Silva et al., 2021; Crispim and Fernandes, 2022; Rocha and Lima, 2022).
In the proposed modified index, the core of the hydrological (H), environmental (E), and social (S) indicators was maintained. The public policy (PP) indicator was evaluated by the pressure of the water-use sectors, as this variable reflects the condition of water management in the basin. In the individual formulation of each indicator, the values are already normalized from 0 to 1, allowing them to be distributed according to the identified categories (Table 5).

Table 5. Summary of the analysis variables according to the proposed indicators for IRW.
To define the WSI-IRW, a multivariate analysis was carried out based on a weighted average, which was defined according to the distribution of the coefficient of variation (Equation 9; Equation 10). Dispersion measures determine the variability of the data around a measure of central tendency, which is the mean. When comparisons are made between the standard deviation values from different data series, the influence of the mean can be eliminated by expressing the standard deviation as a percentage of the mean. This statistical measure is called the coefficient of variation (Assis et al., 1996) and is represented by Equation 8:
The weights were obtained by calculating the respective coefficients of variation of the data series that compose the indices, so the final sustainability index is defined by Equation 10:
Here, Cv is the coefficient of dispersion (%),
4 Results and discussion
4.1 Environmental (E)
Table 6 shows the percentage values corresponding to the forest cover indicator in the river basin.
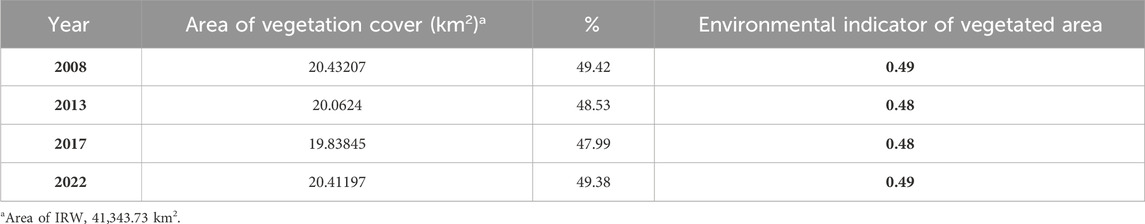
Table 6. Area and percentage of vegetation cover in the IRW and the value of the environmental indicator for each year.
Among the years mapped, the average percentage corresponding to the environmental indicator of vegetation cover was 0.485 (48.5%). This result shows that vegetation cover represents between 48% and 49% of the total area of the IRW between 2008 and 2022. Other forms of land cover and use account for up to 51%, which is represented by the other land-cover classes (pasture, bodies of water, ferruginous canga, urban areas, mined areas, etc.). In turn, when assessing the number of vegetation fragments in the basin, the data shown in Table 7 were obtained.

Table 7. Number of vegetation fragments in the IRW in 2008, 2013, 2017, and 2022.
Over the years mapped, there has been an increase in the number of fragments in the IRW. In 2008, there were 4,476 fragments, increasing to 7,019 in 2013, 8,521 in 2017, and 8,624 in 2022. Comparing data from 2008 and 2022 shows an increase of 4,148 fragments (an increase of approximately 93%). The area of vegetation cover in the 2 years corresponds to 20,400 km2. This represents an increase in the fragmentation and density per vegetated area.
The density of fragments by the vegetated area corresponded to 0.22 fragments/km2 in 2008. In 2013, it increased to 0.35 fragments/km2. In 2017, it was 0.43 fragments/km2, and in 2022, it was 0.42 fragments/km2. According to Table 8, the environmental indicator values for fragments in the vegetated area were 0.8 in 2008, 0.7 in 2013, and 0.6 in 2017 and 2022.
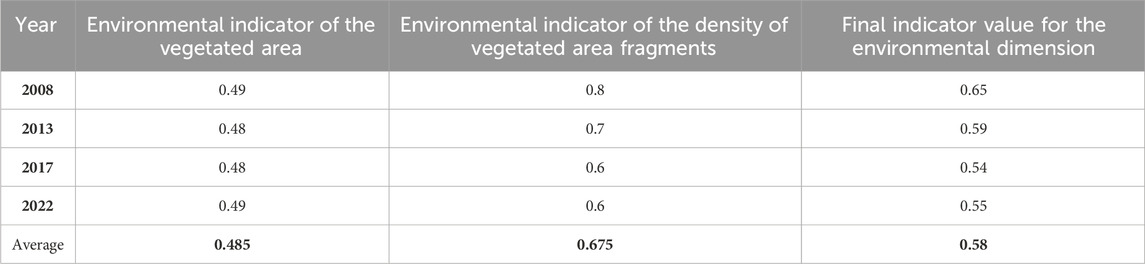
Table 8. Final environmental indicator value for the environmental dimension considering the indicators of vegetation cover and vegetation fragment density in the IRW.
Table 8 shows the final indicator values for the environmental dimension considering the indicators of vegetation cover and fragment density in the IRW. Thus, the final environmental indicator is represented by the average of the final values for 2008, 2013, 2017, and 2022, which corresponds to 0.58.
4.2 Hydrological (H)
Regarding the hydrological indicator of water availability, the flows regionalized by the ANA (Q95 reg) showed values that varied in relation to those associated with the observed flows (Q95 md) for the same water units. However, apart from those corresponding to the Fazenda Abadia, Itacaiúnas–Tapirapé, and Sossego (Table 2) stations, the others show less variation. For the whole basin, the overall average Q95 reg is 7.94 m3/s, which is equivalent to 6.7% of the total regionalized average flow (Figure 3).
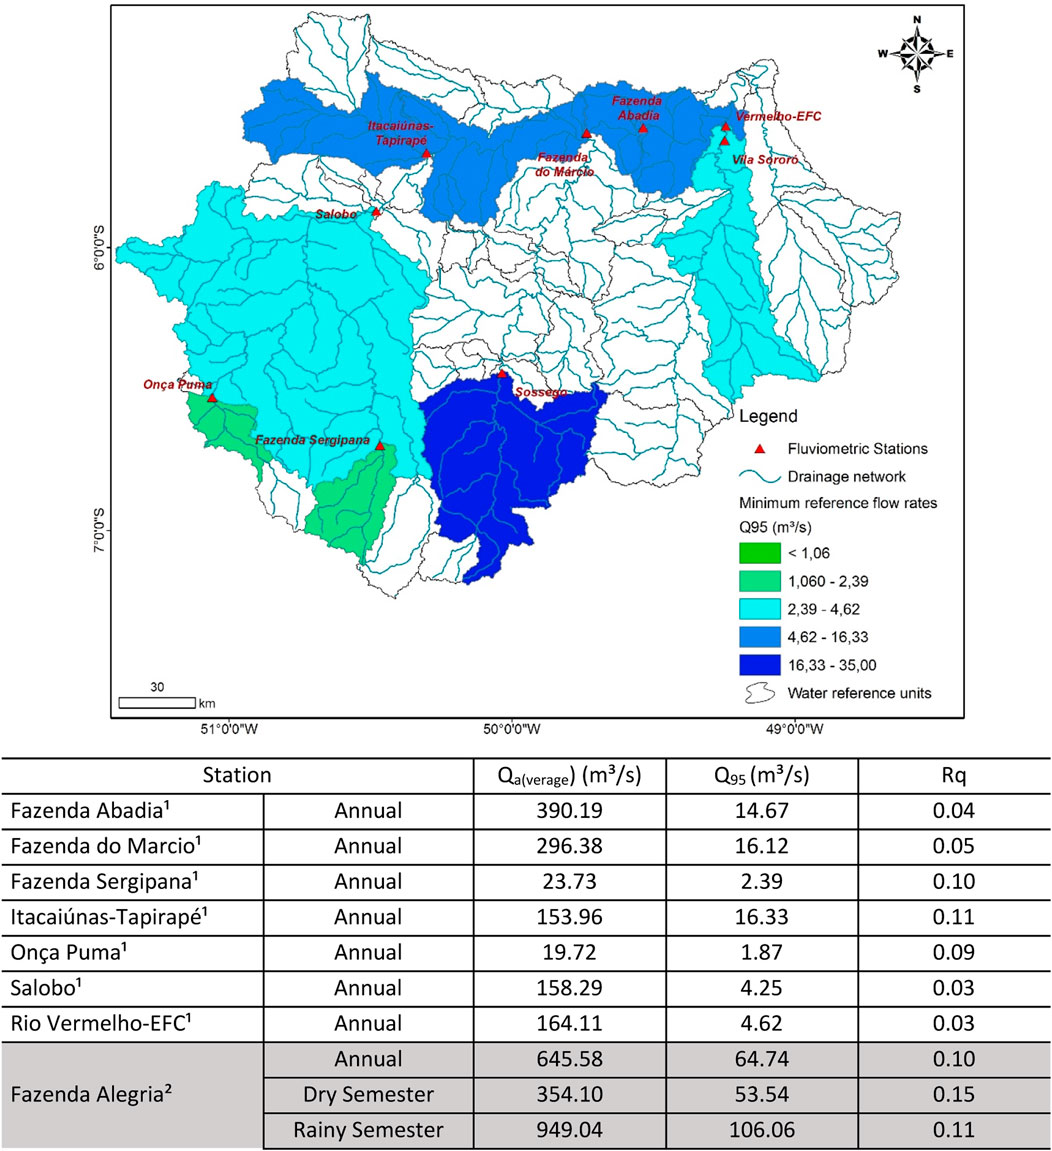
Figure 3. Relationship between the flows (m3/s) regionalized by ANA (Q95 reg) and the observed flows (Q95 med) [(1) Melo et al. (2022) and Melo et al. (2023); (2) Alves (2022)].
The relationship between the observed Q95 and the average flow (Qmd) defines a medium-to-low natural regularization capacity of the monitored sub-basins (average Rq of 0.06). The IRW records an average annual flow of 645.57 m3/s at the Fazenda Alegria fluviometric station (ID-29100000), which, being located close to its mouth, represents all accumulated flows in the basin, and a Q95 of 64.74 m3/s (Alves, 2022), which is equivalent to a value of 0.10, establishing the average behavior of the basin, even considering only the driest months or those with the highest rainfall.
Figure 4 shows the average annual and monthly rainfall for the entire IRW area obtained from the ERA5-Land data for the period 2008 to 2022. Figure 5 shows the time series of the individual and general seasonality indices for the same period in the basin.
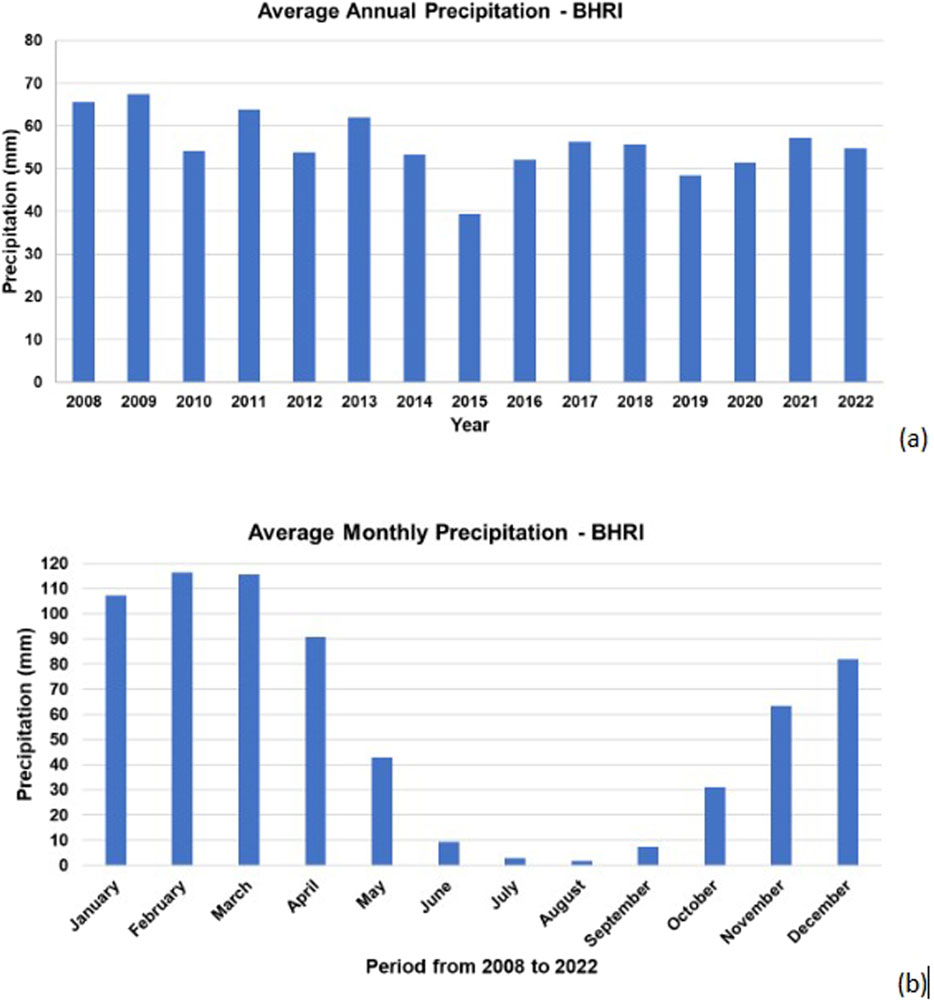
Figure 4. Distribution of rainfall from 2008 to 2022 in IRW: (a) annual average and (b) monthly average.
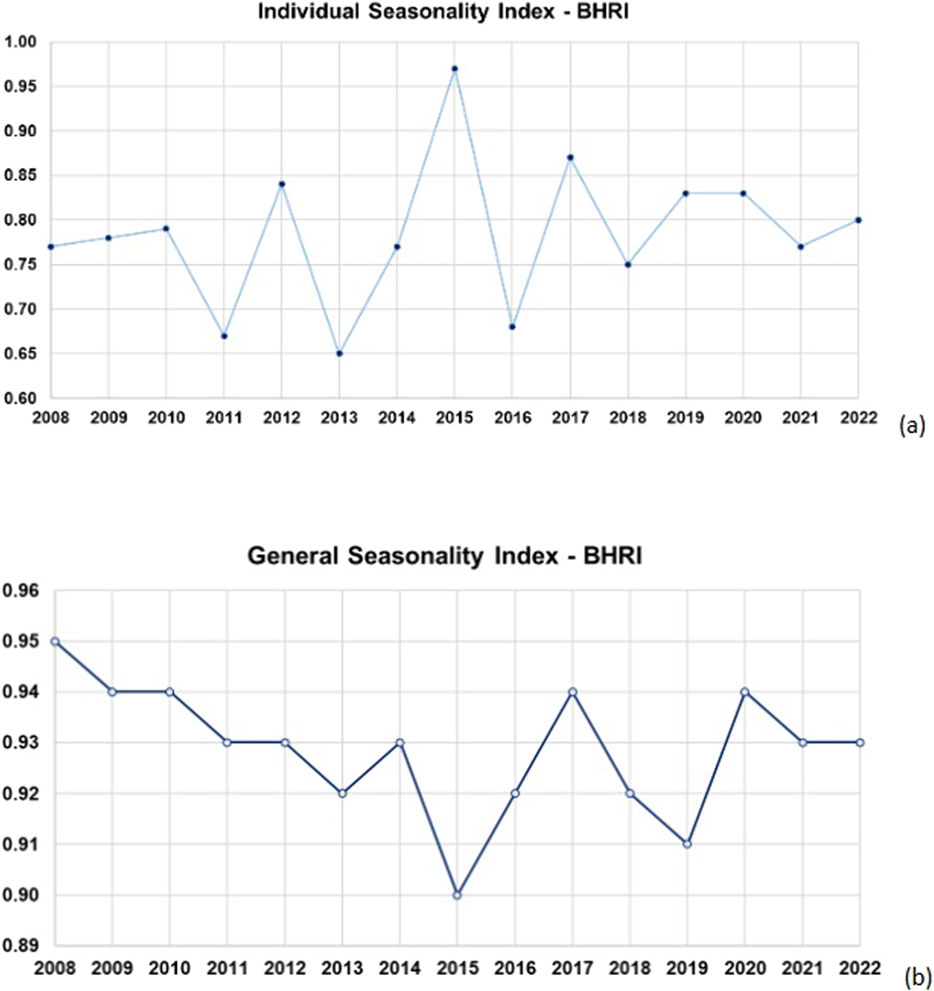
Figure 5. Time series for IRW: (a) individual seasonality index (Hi1) and (b) general seasonality index (Hi2).
The average annual rainfall in the basin ranged from 39 mm in 2015 to 67 mm in 2009, with the average value for the period being approximately 56 mm. According to the average monthly rainfall, it can be seen that rainfall followed the seasonality of the region (Silva-Júnior et al., 2017), with the highest amounts occurring in the rainy months (November to April) and the lowest amounts occurring in the dry months (May to October), with March being the most representative, reaching a monthly average of 116 mm, and August being the driest, with a monthly average of just 2 mm.
Analyzing the results in Figure 5, it can be observed that 2015 simultaneously showed the highest peak of individual seasonality reaching a value of 0.97 (class V) and the lowest overall seasonality value of 0.90 (class V); thus, it was a year classified as markedly seasonal with a long dry season (Table 2), which makes sense given that 2015 was an extremely dry year in the Amazon region due to a strong El Niño (Pereira et al., 2017; Silva Júnior et al., 2021). During the study period, the individual seasonality index in the region ranged from 0.65 to 0.97, ranging from seasonal to markedly seasonal, and the average value of the index was 0.78 (class IV), which was classified as seasonal. The general seasonality index ranged from 0.90 to 0.95, and the average value of the index was 0.93 (class V), which was classified as markedly seasonal. Thus, the rainfall regime in the IRW is classified as seasonal to markedly seasonal, and the indicators are 0.50 and 0.25, respectively (Table 2).
Changes in the hydrological cycle, and consequently in water resources, are related to various factors, such as climate variability and climate change, which are caused by natural or anthropogenic phenomena, along with non-climatic factors, including changes in land cover and land use, alterations in aquifer recharge, changes in flow regimes due to dam construction, and modifications in water use. All these factors are largely dependent on the human system, whose behavior is linked to economic development, population growth, and the adoption of water resource management solutions (Brazil, 2022).
4.3 Social
For the SPI, the calculated values of Si are as follows (Table 9; Figure 6): Água azul do Norte (SPI = 52.54; Si1 = 0.25), Canaã dos Carajás (SPI = 62.99; Si2 = 0.5), Curionópolis (SPI = 55.31; Si3 = 0.5), Eldorado dos Carajás (SPI = 53.04; Si4 = 0.25), Marabá (SPI = 56.29; Si5 = 0.5), Ourilândia do Norte (SPI =; Si6 = 0.25), Parauapebas (SPI = 59.91; Si7 = 0.25), Piçarra (SPI = 49.99; Si8 = 0.0), São Geraldo de Araguaia (SPI = 54.01; Si9 = 0.25), Sapucaia (SPI = 51.79; Si10 = 0.25), and Xinguara (SPI = 53.03; Si10 = 0.25). The Sif was calculated according to the method proposed by Ferreira et al. (2020), which resulted in a value of 0.34 for the IRW social indicator. The overall SPI for the Amazon for 2023 was 54.32, and it is below the national average of 67.94 (SPI Brazil).
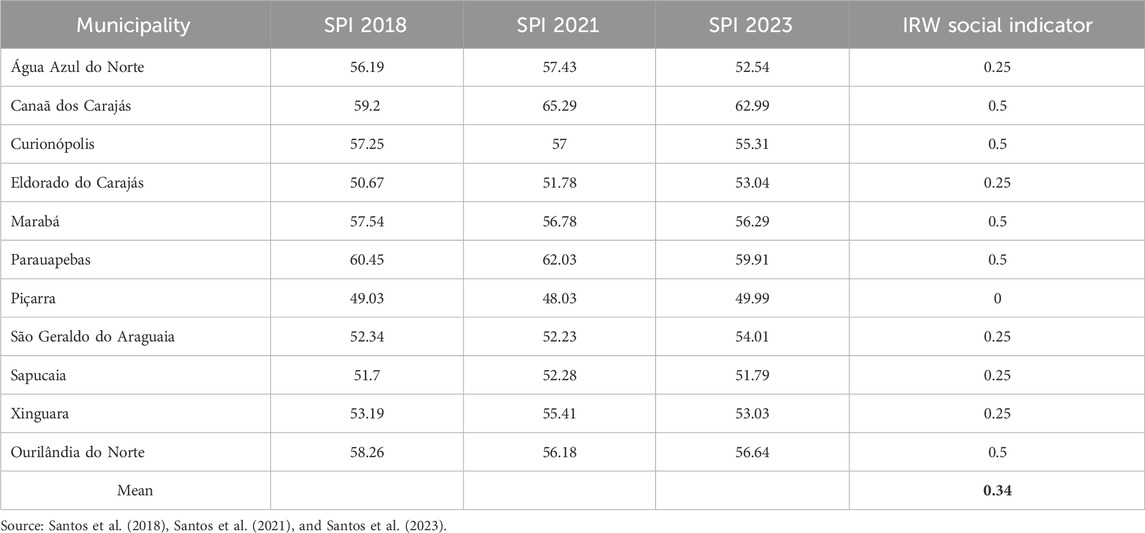
Table 9. Social progress index of the municipalities that make up the IRW calculated for 2018, 2021, and 2023.
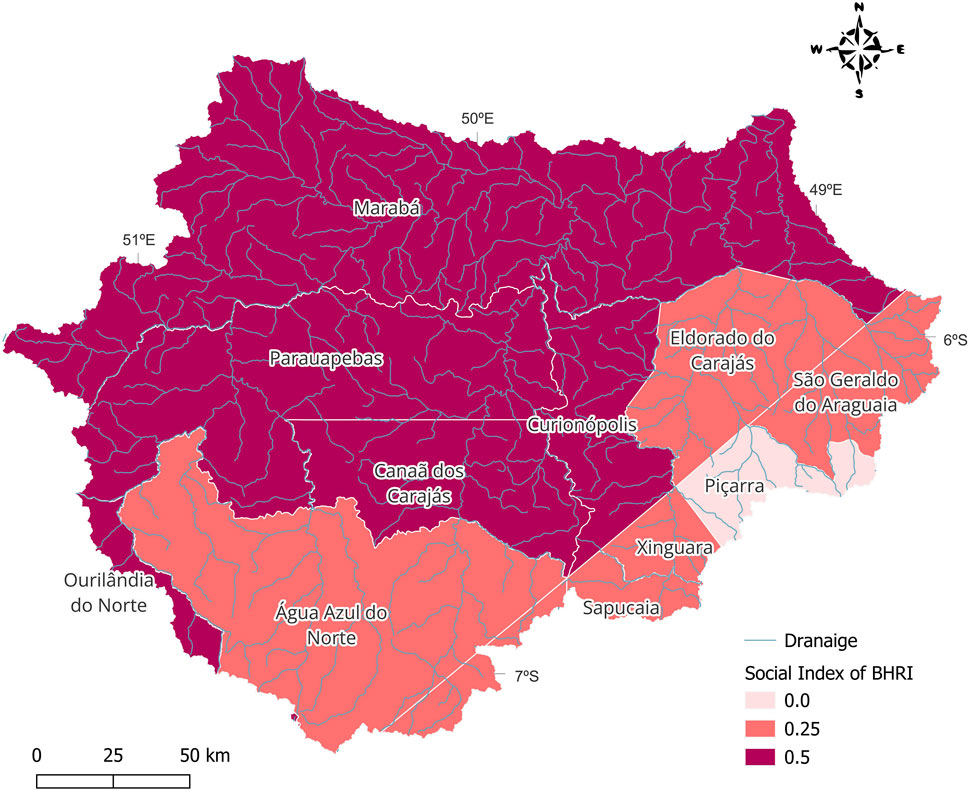
Figure 6. Spatial representation of the social indicator for IRW by municipality. Source: prepared by the authors (2024).
The municipalities with the highest SPI are Parauapebas and Canaã dos Carajás, which also have the highest GDP per capita (R$ 227,449.71 and R$ 894,806.28). The intense mining activity that has taken place in these two territories over the years has promoted the social and economic development of these municipalities in a more pronounced way than that in other municipalities (Moia et al., 2024; Oliveira and Silva, 2019; Almeida et al., 2022). Notably, the IRW has municipalities with large territorial extensions, such as Marabá. This factor generates great disparities between urban and rural areas within the territory of the same municipality (Santos et al., 2023), whose indicator, such as the SPI, is not capable of portraying that reality, thus imposing a limitation on it.
To better understand the social situation of the municipality of Piçarra and the possible reasons for its slow development, as identified in this study, it is necessary to investigate the territorial evolution of the municipality. Until 1982, the territory was part of the municipality of Conceição do Araguaia. From this year onward, the region was divided, and Piçarra became part of the territory of the municipality of São Geraldo do Araguaia, until the municipality was emancipated in 1997 due to population growth because of farming activities and land disputes. Compared to the other municipalities in the IRW, Piçarra has the lowest GDP. The municipality’s recent history, marked by conflicts and dismemberments, justifies its low social and economic development.
In addition to the historical context of the territorial and socioeconomic development of the IRW, analyzing the role of mining royalties is fundamental for understanding the variations in social progress between the municipalities of the basin. The Financial Compensation for Mineral Exploration (FCME) was legally designed so that the resources from exploration would be invested in health, education, and the environment. However, when analyzing the FCME data (2007–2020), it was concluded that the resources are consumed in budget adjustments so that spending on salaries and pensions grows more than the investments in education and health. In the Pará state, most of the royalties collected are generated from iron extraction, followed by copper and bauxite extraction (Floris et al., 2021).
The mining of these resources is highly concentrated in geographical terms, with the municipalities of Parauapebas and Canaã dos Carajás accounting for 80% of the FCME recorded for the municipalities in Pará between 2007 and 2020. Parauapebas stands out for its iron extraction operations, whereas Canaã dos Carajás concentrates its activities on copper mining. Other municipalities that also receive significant volumes of royalties include Marabá, whose main production is copper (Araujo and Bragança, 2022).
4.4 Pressure from water-use sectors
In the IRW, 64.74% of water-use type is associated with groundwater, 31.56% with surface water, and 3.70% is released into water bodies. The main forms of use include tube-well abstraction (55.23%) and surface abstraction (27.70%), whereas the other uses (17.07%) correspond mainly to water works (e.g., dams, pipes, and crossings), specific demands (e.g., flow reserves), and the dilution of effluents. In terms of purpose, abstraction for human consumption accounts for 41.06% of the demand, followed by mineral research (20.93%), and the remaining 38.01% is distributed in smaller but very diverse categories (e.g., construction, agro-industrial consumption, industrial consumption, animal watering, effluent dilution, and irrigation).
Per capita consumptions vary greatly in the municipalities that form the basin, with Canaã dos Carajás (385.35 L/inhab./day), Parauapebas (157.50 L/inhab./day), Marabá (137.63 L/inhab./day), Curionópolis (129.73 L/inhab./day), Eldorado dos Carajás (78.50 L/inhab./day), and Água Azul do Norte (32.75 L/inhab./day) standing out. The others, including Xinguara (101.91 L/inhab./day) and São Geraldo do Araguaia (135.63 L/inhab./day), are peripheral to the basin but have significant consumption.
Considering the flows granted (m3/day) for human supply (AbH), mining use (Mn), irrigation (Ir), rural supply (AbRu), industrial use (UInd), urban use (AbUr), and other types of grants (Out), a value of 0.47 was obtained for the diversity of demand, assuming that the entire area was sampled. The assessment of the diversity of each of the categories highlighted indicates an average value of 0.92.
Analyzing only per capita consumption (considering the entire population served) shows that 55.75% of the total flow was already consumed, corresponding to the interpretation obtained by the demand diversity value, which qualifies a greater concentration in a few classes of use.
Water use in the Itacaiúnas River basin exerts specific pressures, but collectively it compromises water availability, particularly during the region’s dry season. The pressures posed by the region’s productive sector are directly related to population growth, reaching seasonal peaks during the implementation of large-scale projects (Fernandes, 2022). This results in fluctuating water demand, with periods of high consumption followed by regulation. The cities that have developed have become regional hubs with high growth potential, most notably Marabá, Parauapebas, and Canaã dos Carajás. The response of water resources to this pressure will depend on the degree of water governance implemented.
Urban and rural sanitation services, including water supply and sewage treatment, are critical due to direct water consumption and sewage dilution. Insufficient treatment of generated effluents degrades water quality, which is compromised further during the region’s dry season. This causes a negative impact on population health and intensifies disputes over water use in areas that are vulnerable to scarcity (Gesualdo et al., 2021).
In the Itacaiúnas River basin, the principles of water governance must influence the factors driving economic development. This requires a greater degree of interaction, interdependence, and political cooperation among all stakeholders involved in the decision-making processes. Networks of public and private stakeholders should establish cooperative relationships based on the principle of allocating responsibilities to enhance the quality of decisions and ensure the sustainability of water resources (Matos et al., 2022).
4.5 Water sustainability index for the Itacaiúnas river watershed (WSI-IRW)
Water security is an indispensable condition for social and economic development, especially when considering the impacts of the extreme hydrological events that have occurred in the current decade in Brazil (ANA, 2019).
The WSI was calculated for the IRW, based on the environmental, hydrological, social, and pressure dimensions of the water-using sectors in the region, in which extractive activities predominate, with an emphasis on extensive farming and mining. Therefore, the WSI obtained was 0.37, which indicated low water sustainability (Table 10).

Table 10. Description of the calculated values for H, E, S, and PP dimensions of the IRW.
The hydrological indicator formed by the variables of water availability and individual and general seasonality indices had a medium-to-low response for the Itacaiúnas basin in general, reflecting two points: the low density of hydrological information and the influence of seasonal variation between the rainy and dry seasons. This approach, which has already been discussed (Silva-Júnior et al., 2017; Junqueira et al., 2020; Alves, 2022), highlights the importance of expanding monitoring for the management of water resources in the IRW (Pontes et al., 2019; Oliveira Serrão et al., 2021; Pontes et al., 2024).
The study by Alakbar and Burgan (2024) addresses the modeling of power duration curve (PDC) data, which are generally used to estimate the hydroelectric potential in intermittent watersheds that are not continuously monitored. The PDC is derived from the flow duration curve (FDC). In this context, the relationship between this study and the WSI-IRW is established through the hydrological dimension, given the possibility of using regional modeling to estimate the FDC in the basin. This represents a potential solution to the data scarcity problem suggested for the IRW. The solution consists of using variables such as the drainage area, topography, and precipitation to estimate the flow obtained through remote sensing (rain sphere).
The results are more significant when pressure from water users implies a high demand and uncertain supply (Pelicice et al., 2021). This scenario may be similar to that seen in drier regions (Silva et al., 2020; Senent-Aparicio et al., 2015; Mvongo et al., 2021), where the reduction in rainfall generates water deficit conditions, but with high historical, current, and projected consumption for the productive sector and human supply (Galford et al., 2013; Almeida et al., 2022).
Similar responses to those obtained for the hydrological indicator of the IRW have been recorded in other basins near the mouth of the Tocantins River in the Amazon estuary, such as the Guamá River basin (Rocha and Lima, 2022) and the Moju River basin (Ferreira et al., 2020), both with a context of insufficient hydrological information and continued pressure for water consumption. In Brazil, there are other similar situations characterizing a situation of growing demand for water and estimated flows based on a reduced fluviometric network (Melo et al., 2020), even in regions that are ecologically distinct from the Amazon environment, such as the Atlantic forest areas (Taffarello et al., 2017) or in river basins with great economic pressure from the productive sector, including rural and industrial sectors, such as those draining the southeastern region of Brazil (Branchi, 2022).
Water security was analyzed in Iran (Zakeri et al., 2022) and its large watersheds for a period of 20 years with 5-year intervals (1996, 2001, 2006, 2011, and 2016). Eight indicators were considered for water security assessment: the renewable water resources per capita (RWRPC), water use intensity (IWU), water productivity (WP), investing in water infrastructures (IWI), water quality (WQ), access to drinking water and pollution management (ADWPM), changes in the green coverage area (CGCA), and changes in the large water bodies area (CWBA).
In the approach applied to the Itacaiúnas River basin, the relationship was distributed among hydrological indicators and public policy measures. However, it is notable that the arguments differ, with a greater emphasis on detailing water security in the region. The primary limitation of applying the proposal by Zakeri et al. (2022) to the Itacaiúnas River basin is the availability of water demand data for both the urban and rural sectors.
In the state of Pará (Brazil), the databases associated with water-use permits are limited to enterprises seeking regulation, thus lacking a broad and comprehensive registry that reflects an important sector in the region—agriculture—and quantifies the industrial sector. Mining is the most representative economic activity and has the highest number of regularized waters-use permits, making it the main water consumer. However, other enterprises in the region also use water, but they are not included in the official consumption databases. Therefore, improving the indicators primarily depends on enhancing the quality of information available for the region.
The social indicator used establishes a condition linked to water demand according to accessibility to quality basic services, education, health, environmental variables, communication, and the exercise of human rights in the IRW. The municipalities with the highest SPI (Canaã dos Carajás and Parauapebas) also have the highest GDP. This result is expected due to the intense mining activity that takes place in these two territories, which, over the years, has promoted the social and economic development of these municipalities (Moia et al., 2024; Oliveira and Silva, 2019; Almeida et al., 2022). However, despite mining municipalities presenting more favorable social scenarios in the IRW, the regions with major ISP are still below the national average.
Mining is one of the most important economic activities in the state of Pará, generating revenues of more than R$90 billion a year and accounting for more than 80% of the state’s exports. Araujo and Bragança (2022) concluded that the royalties paid by mining companies are not converted into economic growth or social welfare for local communities. This result is not uncommon and suggests the urgency of reforming legislation on the governance and destination of these resources to ensure that the local population benefits from them.
The exploitation of natural resources only provides sustainable growth in well-being if societies can invest a significant amount of the income generated by this activity in reproducible physical and human capital (Hartwick, 2017). Without this investment, a drop in well-being is inevitable when natural resources are depleted.
In this regard, it is consistent to say that vegetation cover in a watershed is fundamental for preserving ecological relationships and water resources. From a hydrological point of view, vegetation regulates the quantity and quality of water (FAO, 2017), and the advance of deforestation leads to a reduction in infiltration, evapotranspiration, and relative humidity; increases surface temperature; increases surface runoff; and reduces the flow of water into the atmosphere (Nepstad et al., 2009; Souza Filho et al., 2016; Zhang et al., 2017; Silva Júnior et al., 2021).
In 2008, the area of vegetation cover at IRW corresponded to 20,432 km2. In 2022, it was approximately 20,412 km2. This represents approximately 20 km2 of reduction in area over 15 years. However, vegetation fragmentation increased from 4,476 to 8,624, that is, an increase of 4,198 (92.7%). This increase in forest fragmentation can result in a reduction in rainwater absorption and infiltration into the soil for groundwater recharge (Balbinot et al., 2008), an increase in surface runoff and river flow (Balbinot et al., 2008), and an increase in temperature and a decrease in evapotranspiration, leading to severe droughts (Silva and Santos, 2021).
Souza Filho et al. (2016), when investigating the relationship between changes in land cover and land use with hydro-climatological processes at IRW, showed that the increase in deforestation over 4 decades (1973–2013) coincides with an increase in air temperature and river flow, along with a reduction in relative humidity in the region. Silva-Júnior et al. (2021) analyzed the relationship between land cover and the components of the hydrological cycle and found an 8.1% reduction in soil water storage and an increase in evaporation/evapotranspiration due to increased deforestation.
In 2017, the IRW had 39% (16,090 km) of rural properties registered in the Rural Environmental Registry (CAR), of which 55% are considered large, 24% medium, and 21% small (Nunes et al., 2019). The values of forest fragments in the watershed increased between 2008 and 2022, and this change may be a consequence of the increase in deforestation that may be occurring on rural properties. Nunes et al. (2019) found a deficit in the legal reserve area of the basin, corresponding to 4,383 km2 between 2008 and 2017, of which 1,927 km2 should be restored, as it is associated with deforestation after 22 July 2008. In addition, according to Nunes et al. (2019), approximately 13% of the area of IRW is made up of permanent preservation areas (PPAs) (5,254 km2), of which 1,356 km2 (26% of the total APP) needs to be restored according to the new forest code.
In summary, approximately 3,283 km2 of the IRW needs to be legally restored, 59% of which is in legal reserve areas and 41% in APP areas, as they were cleared after the date established by the forest code (22 July 2008).
In the preparation of the state water resources plan (SWRP/PA) (SEMAS, 2021), scenarios were used as a tool to organize visions of the environments in which management decisions should be made, reducing the variety of possibilities by defining “possible alternative futures.” In the State Water Resources Plan of Pará–Executive Summary (2021) forecast, the Tocantins–Itacaiúnas analysis unit (AU) was considered the most critical for all projections. In most of the sub-basins, the resulting risk level (RL) was equal to three, regardless of the scenario, which means that the current and projected demands in these sub-basins are within the allocation criteria employed by the state and are not influenced by the articulated variables.
In Araguaia, Fresco, and Tocantins–Itacaiúnas AUs, the NRs are greater than three in the baseline scenario, indicating that the granting criterion is no longer respected, although demands are still below the reference flow (Q95%), except for the Tocantins–Itacaiúnas unit (SEMAS, 2021). In Alto Tapajós, Alto Xingu, Araguaia, Costa-Gurupi, Fresco, Guamá-Moju-Capim, Jamanxim-Novo, Médio Xingu, Teles Pires, and Tocantins–Itacaiúnas AUs, the projected growth in demand could lead to the risk of the granting criteria being breached (NR = 4). In the Araguaia, Fresco, Jamanxim, Novo, and Tocantins–Itacaiúnas AUs, the growth in demand may exceed the reference flows for allocations (NR = 5). In the Araguaia and Tocantins–Itacaiúnas AUs, both the growth in demand and the reduction in availability can lead to an NR = 6, which is considered relatively high, as it is above the reference flows adopted in Pará.
It is important to highlight that Jiménez-Muñoz et al. (2016) identified that in 2015, during the El Niño event, potential evapotranspiration in the Amazon reached abnormally high levels, intensifying extreme drought in the region. Additionally, Silva Júnior et al. (2021) emphasized that in the IRW, the influence of La Niña combined with deforestation has intensified water flows, increasing the risk of flooding in flat areas due to the reduction in soil infiltration and water storage capacity. These data reinforce the influence of climate extremes on the region’s water sustainability and must be considered in water resource planning and management.
In summary, scenarios are planning tools used to provide coherence to a series of pieces of information, seeking to extract guidelines from them for proposing actions or management decisions that consider what may happen in the future in some ways (SEMAS, 2021). Thus, the conception of medium- and long-term scenarios represents objectives that will soon come to fruition.
In terms of indicators relating to the expansion of hydrological monitoring and water resource governance, it is evident that improvements could be made to the Itacaiúnas River basin to safeguard the region’s future water supply. Hydrological monitoring requires collaboration between the public and private sectors, covering the surface water, groundwater, and atmospheric water. More information is needed to reduce uncertainty in climate variability scenarios, as shown by models generated for the region (Souza-Filho et al., 2016; Silva-Júnior et al., 2017; Pontes et al., 2019; Silva-Júnior et al., 2021; Costa et al., 2025).
The challenges regarding water governance are more complex because inter-municipal coordination must overcome the limitations imposed by political interests, and the productive sector must start acting collaboratively. This means understanding that water is a common good and that shared management is the only way to guarantee its future availability (Matos et al., 2022).
The Itacaiúnas River basin is part of the Tocantins River basin (the main left-bank tributary in the state of Pará). Therefore, water governance indicators should be included in this broader framework, given that the Tocantins River basin is a region with significant economic and energy potential. In this regard, the following are of particular pertinence (Oliveira Serrão et al., 2021; Pelicice et al., 2021; Swanson and Bohlman, 2021): the ongoing observation of the rates of land cover change, the evaluation of the series of dams designated for hydroelectric development, the consequences of the conversion of natural ecosystems into agricultural ones, the planning of the expansion of the mining sector in the region, the formulation of cooperative water management pacts in critical river basins, and integrated action to manage the risks and disasters resulting from climate extremes. These elements should comprise measurable variables that can be monitored over time to ensure the implementation and consolidation of water-management actions.
5 Conclusion
The WSI of the IRW is 0.37, indicating low water sustainability, which reflects the limitations in the management of water resources, mainly due to the low density of hydrological data and marked seasonal pressures.
Vegetation plays an essential role in water regulation, but increased forest fragmentation and deforestation reduce infiltration, increase surface runoff, and increase the risk of water deficits. The vegetation cover of the IRW was reduced by 20 km2 between 2008 and 2022, whereas fragmentation increased dramatically, reflecting negative impacts on hydrological cycles.
The mining sector is a major consumer of water in the basin. Although it contributes to an increase in GDP and SPI in mining municipalities, the benefits are not reflected in a sustainable improvement in local well-being. Seasonal variability, coupled with insufficient fluviometric data, exacerbates the challenges of water management. Similar situations can be observed in other basins with different hydrological and economic characteristics. Approximately 3,283 km2 of the IRW needs to be restored, including permanent preservation areas (PPAs) and legal reserves. This highlights the need for legal measures and effective public policies to restore vegetation cover.
The management scenarios developed by the State Water Resources Plan (PERH/PA) enhances the criticality of the Tocantins–Itacaiúnas AU, where water risk levels are high. This requires coordinated actions and long-term projections to guarantee water sustainability. Several studies corroborate the need to reform legislation to ensure that mining royalties are used to benefit local communities, promoting investment in human and physical capital to prevent a decline in well-being when resources run out.
Finally, it is recommended that hydrological monitoring in the IRW be expanded to reduce uncertainties in the management of water resources, public policies aimed at forest restoration and the protection of permanent preservation areas be implemented, the governance of mineral resources be reformed to ensure that the revenues generated benefit the local population, and robust water planning scenarios aligned with current and future demands be considered to mitigate the risks of water scarcity. These conclusions spotlight the complexity of the challenges faced at IRW, including environmental, social, and economic issues, and point out the need for an integrated and multidimensional approach to sustainable water management.
Data availability statement
The datasets presented in this study can be found in online repositories. The names of the repository/repositories and accession number(s) can be found in the article/supplementary material.
Author contributions
RS: Conceptualization, Investigation, Project administration, Supervision, Writing – original draft, Writing – review and editing. WJ: Conceptualization, Methodology, Software, Writing – original draft, Writing – review and editing. AM: Conceptualization, Investigation, Methodology, Writing – original draft, Writing – review and editing. HA: Conceptualization, Investigation, Methodology, Writing – original draft, Writing – review and editing. MS: Visualization, Writing – review and editing. FO: Conceptualization, Methodology, Validation, Writing – original draft. AL: Conceptualization, Investigation, Methodology, Supervision, Validation, Writing – original draft, Writing – review and editing.
Funding
The author(s) declare that financial support was received for the research and/or publication of this article. The scholarships were funded by the Instituto Tecnológico Vale (ITV) and managed by the Fundação de Amparo e Desenvolvimento da Pesquisa–FADESP (Grant No. 339020.02, Research Scholarship for AMQM; and Grant No. 1143∗179, Research Scholarship for HPA).
Conflict of interest
The authors declare that the research was conducted in the absence of any commercial or financial relationships that could be construed as a potential conflict of interest.
The reviewer LP declared a shared affiliation with the authors FO and AL to the handling editor at the time of review.
Generative AI statement
The author(s) declare that no Generative AI was used in the creation of this manuscript.
Any alternative text (alt text) provided alongside figures in this article has been generated by Frontiers with the support of artificial intelligence and reasonable efforts have been made to ensure accuracy, including review by the authors wherever possible. If you identify any issues, please contact us.
Publisher’s note
All claims expressed in this article are solely those of the authors and do not necessarily represent those of their affiliated organizations, or those of the publisher, the editors and the reviewers. Any product that may be evaluated in this article, or claim that may be made by its manufacturer, is not guaranteed or endorsed by the publisher.
References
Agência Nacional de Águas (Brazil) (2019). National water security plan/national water agency. Brasília: ANA, 112.
Alakbar, T., and Burgan, H. I. (2024). Regional power duration curve model for ungauged intermittent river basins. J. Water Clim. Change 15 (9), 4596–4612. doi:10.2166/wcc.2024.207
Alexakis, D. E. (2021). Linking D PSIR model and water quality indices to achieve sustainable development goals in groundwater resources. Hydrology 8, 90. doi:10.3390/hydrology8020090
Almeida, P. B., Martins, S., Barros, J. N., and Coutinho, M. M. (2022). Gestão dos recursos minerais no município de Canaã dos Carajás – PA na perspectiva dos cidadãos. NAU Soc. 13 (24), 1000–1020. doi:10.9771/ns.v13i24.45152
Alvares, C. A., Stape, J. L., Sentelhas, P. C., Gonçalves, J. L. M., and Sparovek, G. (2014). Köppen's climate classification map for Brazil. Meteorol. Z. 22, 711–728. doi:10.1127/0941-2948/2013/0507
Alves, M. B. (2022). Regionalization of reference minimum flows and long-term mean flows in the tocantins-araguaia river basin. 148 f. Viçosa: Federal University of Viçosa. Dissertation (Master's in Agricultural Engineering).
Araujo, R. A., and Bragança, A. (2022). Mining royalties and socioeconomic development in Pará. Rio de Janeiro: Climate Policy Initiative.
Assis, J. C. (1996). Methods of statistical analysis for experiments in agricultural sciences. Viçosa: Federal University of Viçosa.
Azevedo, D. G., Gomes, R. L., and Moraes, M. E. B. (2016). Studies on landscape fragmentation in defining priority areas for environmental recovery in the Buranhém River basin. Boletim de Geografia. Maringá 34 (2), 127–144. Available online at: https://www.researchgate.net/publication/312478294
Balbinot, R., Oliveira, N. K. d., Vanzetto, S. C., Pedroso, K., and Valerio, A. F. (2008). The role of the forest in the hydrological cycle in river basins. Ambiěncia. J. Agric. Environ. Sci. 4 (1), 139–149.
Barbosa, S. M., and Bilotta, P. (2024). A relação entre o índice de progresso social (IPS) e a segurança no estado do Amazonas. Peer Rev. 6 (1), 152–167. doi:10.53660/PRW-1710-3324
Barbosa, W. G., Carvalho, J. D. M., Silva, D. H. L. D., Silva Júnior, A. N. D., Araújo, L. D. S., Silva, A. S. A. D., et al. (2023). Sazonalidade do regime de chuva nas mesorregiões do estado de Pernambuco, Brasil. Res. Soc. Dev. 12 (12), e29121243835. doi:10.33448/rsd-v12i12.43835
Blaschke, T., Hay, G. J., Kelly, M., Lang, S., Hofmann, P., Addink, E., et al. (2014). Geographic Object-Based Image Analysis – towards a new paradigm. ISPRS J. Photogrammetry Remote Sens. 87, 180–191. doi:10.1016/j.isprsjprs.2013.09.014
Branchi, B. A. (2022). Sustentabilidade de Bacias Hidrográficas e Índices Compostos: aplicação e Desafios. Sociedade and Natureza 34, e63868. doi:10.14393/SN-v34-2022-63868
Brazil (2003). “Resolution No. 32, of October 15, 2003, of the National Water Resources Council. Establishes the National Hydrographic Division into hydrographic regions,” in Water resources – compilation of legal norms. 2nd ed. (Brasília: Secretariat of Water Resources of the Ministry of the Environment).
Brazil (2012). Law No. 12,651, of May 25, 2012. Provides for the protection of native vegetation; amends Laws No. 6,938 of August 31, 1981, No. 9,393 of December 19, 1996, and no. 11,428 of December 22, 2006; repeals laws No. 4,771 of September 15, 1965, and No. 7,754 of April 14, 1989, and Provisional measure No. 2,166-67 of August 24, 2001; and other provisions. Brasília, DF: Official Gazette of the Union. Available online at: https://www.planalto.gov.br/ccivil_03/_ato2011-2014/2012/lei/l12651.htm (Accessed November, 2024).
Brazil (2022). Plano Nacional de Recursos Hídricos (PNRH). Plano de Ação: estratégia para a Implementação do PNRH 2022-2040. Volume II do PNRH 2022-2040. Março/2022. 213. Available online at: https://www.gov.br/mdr/pt-br/assuntos/seguranca-hidrica/plano-nacional-de-recursos-hidricos-1/pnrh_2022_para_baixar_e_imprimir.pdf.
Cánovas-Molina, A., García-Frapolli, E., and Ruggerio, C. A. (2023). A proposal of an Irrigation Sustainability Index for agricultural basins: application in a semi-arid river basin. Irrigation Sci. 41, 173–182. doi:10.1007/s00271-022-00831-w
Chaves, H. M. L., and Alipaz, S. (2007). An integrated indicator based on Basin Hydrology, environment, life, and Policy: the watershed sustainability index. Water Resour. Manag. 21 (5), 883–895. doi:10.1007/s11269-006-9107-2
Chen, Y., Sharma, S., Zhou, X., Yang, K., Li, X., Niu, X., et al. (2021). Spatial performance of multiple reanalysis precipitation datasets on the southern slope of central Himalaya. Atmos. Res. 250, 105365. doi:10.1016/j.atmosres.2020.105365
Cirilo, B. B., and Almeida, O. T. (2020). The limits of municipal public authority in managing water resources in the Marapanim and Itacaiúnas river basins, Pará state, Brazil. J. Postgrad. Program Geogr. Dep. Geogr. at UFES, 268–292. doi:10.7147/geo.v1i31.31165
Clarke, R. T., and Tucci, C. E. M. (2003). “Hydrological regionalization,” in Hydrology applied to the management of small watersheds. Editors J. D. B. Paiva, and E. M. C. D. Paiva (Porto Alegre, Brazil: Federal University of Rio Grande do Sul), 169–222.
Costa, L. R. R., Ferreira, D. B. D. S., Senna, R. C., de Sousa, A. M. L., Carmo, A. M. C. D., Silva Jr, J. D. A., et al. (2025). River stage variability and extremes in the itacaiúnas basin in the eastern amazon: machine learning-based modeling. Hydrology 12 (5), 115. doi:10.3390/hydrology12050115
Crispim, D. L., and Fernandes, L. L. (2022). Application of the rural water sustainability index (RWSI) in amazon rural communities, Pará, Brazil. Water Policy 24 (2), 282–304. doi:10.2166/wp.2022.153
Cruz, J. C., and Tucci, C. E. M. (2008). Estimation of water availability through the flow duration curve. Rev. Bras. Recur. Hídricos 13 (1), 111–124. doi:10.21168/rbrh.v13n3.p59-71
Da Silva, J., Fernandes, V., Limont, M., Dziedzic, M., Andreoli, C. V., and Rauen, W. B. (2020). Water sustainability assessment from the perspective of sustainable development capitals: conceptual model and index based on literature review. J. Environ. Manag. 254, 109750. doi:10.1016/j.jenvman.2019.109750
De Castro-Pardo, M., Cabello, J. M., Martín, J. M., and Ruiz, F. (2022). A multi reference point-based index to assess and monitor European water policies from a sustainability approach. Socio-Economic Plan. Sci. 89, 101433. doi:10.1016/j.seps.2022.101433
Derdour, A., Jodar-Abellan, A., Pardo, M. Á., Ghoneim, S. S. M., and Hussein, E. E. (2022). Designing efficient and sustainable predictions of water quality indexes at the regional scale using machine learning algorithms. Water 14, 2801. doi:10.3390/w14182801
Dos Santos Silva, F. D., da Costa, C. P. W., dos Santos Franco, V., Gomes, H. B., da Silva, M. C. L., dos Santos Vanderlei, M. H. G., et al. (2023). Intercomparison of different sources of precipitation data in the Brazilian legal amazon. Climate 11 (241), 241. doi:10.3390/cli11120241
Fernandes, P. C. Á. (2022). Nature, infrastructure, mining, and urbanization: mapping historical intersections in the carajás region. Novos Cad. NAEA 25 (4). doi:10.18542/ncn.v25i4.12650
Ferreira, S. C. G., Lima, A. M. M., and Corrêa, J. A. M. (2020). Indicators of hydrological sustainability, governance, and water resource regulation in the moju river basin (PA) – eastern Amazonia. J. Environ. Manag. 263, 110354. doi:10.1016/j.jenvman.2020.110354
Ferreira, D. S., Paes, A. P., Da Costa, C. W., Tedeschi, R., Silva Júnior, R., Neto, A. N., et al. (2024). The role of meteorology in the mining chain in northern Brazil. Eur. J. Appl. Sci. 12 (4), 08–30. doi:10.14738/aivp.123.17165
Figueiredo, D. M., and Ioris, A. A. R. (2021). Water governance and the hydrosocial territory of the teles pires river basin in the Brazilian amazon. Environ. Dev. Challenges, Policies Pract., 437–467. doi:10.1007/978-3-030-55416-3_16
Floris, L. M., Caríssimo, C. R., Silva, S. S., and Calegário, C. L. L. (2021). Mining royalties, efficiency of public spending, and social development: an empirical investigation of the largest mining municipalities in Brazil. Rev. Gestão Planej. 22, 382–404. doi:10.53706/gep.v.22.6378
Galford, G. L., Soares-Filho, B., and Cerri, C. E. (2013). Prospects for land-use sustainability on the agricultural frontier of the Brazilian amazon. Philosophical Trans. R. Soc. B Biol. Sci. 368 (1619), 20120171. doi:10.1098/rstb.2012.0171
Gama Rego, A., Fernandes, L. L., Blanco, C. J. C., and Barp, A. R. B. (2013). Evaluation of sustainability in the use of water within the amazon deforestation area: a case study in rondon do Pará, Pará state, Brazil. Acta Sci. Technol. 35 (2), 237–245. doi:10.4025/actascitechnol.v35i2.13820
Gesualdo, G., Sone, J. S., Galvao, C. D. O., Martins, E. S., Montenegro, S. M. G. L., Tomasella, J., et al. (2021). Unveiling water security in Brazil: current challenges and future perspectives. Hydrological Sci. J. 66 (5), 759–768. doi:10.1080/02626667.2021.1899182
Goharian, E., and Burian, S. J. (2018). Developing an integrated framework to build a decision support tool for urban water management. J. Hydroinformatics 20 (3), 708–727. doi:10.2166/hydro.2018.088
Gonzales, P., and Ajami, N. K. (2015). Urban water sustainability: an integrative framework for regional water management. Hydrology Earth Syst. Sci. 12, 11291–11329. doi:10.5194/hessd-12-11291-2015
Hartwick, J. M. (2017). “Intergenerational equity and the investing of rents from exhaustible resources,” in The economics of sustainability (Abingdon, England: Routledge), 63–65.
Hentz, A. M. K., Corte, A. P. D., Doubrawa, B., and Sanquetta, C. R. (2015). Avaliação da fragmentação dos remanescentes florestais da Bacia Hidrogràfica do Rio Iguaçu – PR, Brasil. Encicl. Biosf. Goiânia, 2842–2858.
Jarzebski, M. P., Karthe, D., Chapagain, S. K., Setiawati, M. D., Wadumestrige Dona, C. G., Pu, J., et al. (2024). Comparative analysis of water sustainability indices: a systematic review. Water 16, 961. doi:10.3390/w16070961
Jiménez-Muñoz, J. C., Mattar, C., Barichivich, J., Santamaría-Artigas, A., Takahashi, K., Malhi, Y., et al. (2016). Record-breaking warming and extreme drought in the amazon rainforest during the course of El Niño 2015–2016. Sci. Rep. 6, 33130. doi:10.1038/srep33130
Junqueira, R., Viola, M. R., de Mello, C. R., Vieira-Filho, M., Alves, M. V., and Amorim, J. D. S. (2020). Drought severity indexes for the tocantins river basin, Brazil. Theor. Appl. Climatol. 141 (1), 465–481. doi:10.1007/s00704-020-03229-w
Juwana, I., Muttil, N., and Perera, B. J. C. (2012). Indicator-based water sustainability assessment – a review. Sci. Total Environ. 438, 357–371. doi:10.1016/j.scitotenv.2012.08.093
Kılkış, Ş. (2019). Data on cities that are benchmarked with the sustainable development of energy, water and environment systems index and related cross-sectoral scenario. Data Brief. 24, 103856. doi:10.1016/j.dib.2019.103856
Lathuillière, M. J., Coe, M. T., and Johnson, M. S. (2016). A review of green-and blue-water resources and their trade-offs for future agricultural production in the amazon basin: what could irrigated agriculture mean for Amazonia? Hydrology Earth Syst. Sci. 20 (6), 2179–2194. doi:10.5194/hess-20-2179-2016
Maiolo, M., Pantusa, D., and Aziz, H. A. (2019). Sustainable water management index (SWaM_Index). Cogent Eng. 6 (1), 1603817. doi:10.1080/23311916.2019.1603817
Moia, G. C. M., Matlaba, V. J., and Santos, J. M. F. (2024). Evaluation of the impact of mining royalties on socio-environmental indicators in Parauapebas, Pará, the Eastern Amazon. Extr. Ind. Soc. 19, 101556
Malardel, S., Wedi, N., Deconinck, W., Diamantakis, M., Kuehnlein, C., Mozdzynski, G., et al. (2016). A new grid for the IFS. ECMWF Newsl. 146, 23–28. doi:10.21957/zwdu9u5i
Malkina-Pykh, I. G., and Pykh, Y. A. (2001). Indices and indicators of water sustainability: systems analysis approach. WIT Trans. Ecol. Environ. 46, 10.
Matos, F., Dias, R., and Ayrimoraes, S. (2022). Governance failures and knowledge asymmetries in the state river basin committees and their impacts on water resource management in Brazil. Water Int. 47 (2), 223–237. doi:10.1080/02508060.2022.2041833
Melo, D. C., Anache, J. A., Almeida, C. D. N., Coutinho, J. V., Ramos Filho, G. M., Rosalem, L. M., et al. (2020). The big picture of field hydrology studies in Brazil. Hydrological Sci. J. 65 (8), 1262–1280. doi:10.1080/02626667.2020.1747618
Melo, A. M. Q., Blanco, C. J. C., Pontes, P. R. M., Cavalcante, R. B. L., Silva Júnior, R. O., and Silva, M. S. (2022). Elaborating rating curves for implementation of the MGB hydrological model in a river basin, Amazon region, Brazil. Sustain. Water Resour. Manag. 8, 132. doi:10.1007/s40899-022-00715-z
Melo, A. M. Q., Silva Júnior, R. O., and Silva, M. S. (2023). Hydrometeorological monitoring in the itacaiúnas River basin (BHRI), Eastern amazon. Belém-PA, Brazil: Instituto Tecnológico Vale -I TV, 34. Final Report.
Molle, F., and Mollinga, P. (2003). Water poverty indicators: conceptual problems and policy issues. Water Policy 5 (5–6), 529–544. doi:10.2166/wp.2003.0034
Moraes, B., Costa, J., Costa, A., and Costa, M. (2005). Variação espacial e temporal da precipitação no Estado do Pará. Acta Amaz. 35, 207–214. doi:10.1590/S0044-59672005000200010
Muñoz-Sabater, J. (2019a). ERA5-Land hourly data from 1981 to present. Copernic. Clim. Change Serv. (C3S) Clim. Data Store (CDS) 13 (9), 4349–4383. doi:10.24381/cds.e2161bac
Muñoz-Sabater, J. (2019b). ERA5-Land monthly averaged data from 1981 to present. Copernic. Clim. Change Serv. (C3S) Clim. Data Store (CDS). doi:10.24381/cds.68d2bb30
Muñoz-Sabater, J., Dutra, E., Agustí-Panareda, A., Albergel, C., Arduini, G., Balsamo, G., et al. (2021). ERA5-Land: a state-of-the-art global reanalysis dataset for land applications. Earth Syst. Sci. Data 13, 4349–4383. doi:10.5194/essd-13-4349-2021
Mvongo, V. D., Defo, C., and Tchoffo, M. (2021). Sustainability of rural water services in rural Sub-Saharan Africa environments: developing a water Service sustainability index. Sustain. Water Resour. Manag. 7, 46. doi:10.1007/s40899-021-00526-8
National Water and Basic Sanitation Agency (ANA) (2020). Technical note N (75/2020/SPR). Document no. 02500. 051718/2020-19. Update of the surface water availability base of ANA.
Nepstad, D., Soares-Filho, B. S., Merry, F., Lima, A., Moutinho, P., Carter, J., et al. (2009). The end of deforestation in the Brazilian amazon. Science 326 (5958), 1350–1351. doi:10.1126/science.1182108
Nunes, S., Cavalcante, R. B. L., Nascimento, W. R., Souza-Filho, P. W. M., and Santos, D. (2019). Potential for forest restoration and deficit compensation in itacaiúnas watershed, southeastern Brazilian amazon. Forests 10, 439. doi:10.3390/f10050439
Oliveira, L. A. A., and Silva, D. N. (2019). Mining and development: an analysis of mining municipalities in Pará. Federal university of the South and southeast of Pará, marabá university campus. Marabá-PA-Brazil: Institute of Studies in Agrarian and Regional Development, Faculty of Agricultural Sciences. Available online at: http://repositorio.unifesspa.edu.br/handle/123456789/803 (Accessed December 23, 2024).
Oliveira Serrão, E. A., Silva, M. T., Ferreira, T. R., de Ataide, L. C. P., Wanzeler, R. T. S., da Silva, V. D. P. R., et al. (2021). Large-scale hydrological modelling of flow and hydropower production in a Brazilian watershed. Ecohydrol. and Hydrobiology 21 (1), 23–35. doi:10.1016/j.ecohyd.2020.09.002
Pelicice, F. M., Agostinho, A. A., Akama, A., Andrade Filho, J. D., Azevedo-Santos, V. M., Barbosa, M. V. M., et al. (2021). Large-scale degradation of the tocantins-Araguaia river basin. Environ. Manag. 68, 445–452. doi:10.1007/s00267-021-01513-7
Pereira, H. R., Reboita, M. S., and Ambrizzi, T. (2017). Características da Atmosfera na Primavera Austral Durante o El Niño de 2015/2016. Braz. J. Meteorology 32 (2), 293–310. doi:10.1590/0102-77863220011
Pontes, P. R., Cavalcante, R. B., Sahoo, P. K., da Silva Júnior, R. O., da Silva, M. S., Dall'Agnol, R., et al. (2019). The role of protected and deforested areas in the hydrological processes of Itacaiúnas river Basin, eastern Amazonia. J. Environ. Manag. 235, 489–499. doi:10.1016/j.jenvman.2019.01.090
Pontes, P. R. M., Cavalcante, R. B. L., Salomão, G. N., Guimarães, J. T. F., and Dall’Agnol, R. (2024). Environmental assessment based on soil loss, deforestation in permanent preservation areas, and water quality applied in the itacaiúnas watershed, Eastern Amazon. Int. Soil Water Conservation Res. doi:10.1016/j.iswcr.2024.11.001
Roboredo, D., Bergamasco, S. M. P. P., and Bleich, M. E. (2016). Aggregate Index of social–environmental sustainability to evaluate the social-environmental quality in a watershed in the Southern Amazon. Ecol. Indic. 63, 337–345. doi:10.1016/j.ecolind.2015.11.042
Rocha, N. C. V., and Lima, A. M. M. D. (2022). Water sustainability in the Guamá River basin, Eastern Amazon/Brazil. Sociedade and Natureza 32, 130–148.
Rodrigues, J. A. M., de Oliveira Andrade, A. C., Viola, M. R., and Morais, M. A. V. (2015). Hydrological indicators for water resources management in the Manuel Alves da Natividade River basin, Tocantins. Sci. Agrar. 16 (4), 58–79. doi:10.21168/rbrh.v3n3.p111-131
Sandoval-Solis, S., McKinney, D. C., and Loucks, D. P. (2011). Sustainability index for water resources planning and management. J. Water Resour. Plan. Manag. 137, 381–390. doi:10.1061/(asce)wr.1943-5452.0000134
Santos, D., Mosaner, M., Celentano, D., Moura, R., and Veríssimo, A. (2018). Social Progress Index in the Brazilian Amazon – IPS Amazon 2018. Belém: Imazon.
Santos, D., Veríssimo, A., Seifer, P., and Mosaner, M. (2021). Social Progress Index in the Brazilian Amazon – IPS Amazon 2021. Belém: Imazon & Amazon 2030.
Santos, D., Lima, M., Wilm, M., Seifer, P., and Veríssimo, B. (2023). Social progress index in the Brazilian Amazon – IPS Amazon 2023. Belém: institute of man and environment of the Amazon (Imazon).
Senent-Aparicio, J., Pérez-Sánchez, J., García-Aróstegui, J. L., Bielsa-Artero, A., and Domingo-Pinillos, J. C. (2015). Evaluating groundwater management sustainability under limited data availability in semiarid zones. Water 7, 4305–4322. doi:10.3390/w7084305
Silva, J., and Santos, P. (2021). Climate change and forest fragmentation: challenges for water resources. Climatol. Recur. Hídricos 16 (1), 88–100.
Silva, K. R. S., and Vidal, M. R. (2022). Physical characterization of the itacaiúnas river basin/PA. Brazil: Fundação Universidade Federal de Rondônia, 9. Revista Presença Geográfica.
Silva, A. S. A., Cunha Filho, M., Menezes, R. S. C., Stosic, T., and Stosic, B. (2020). Trends and persistence of dry–wet conditions in northeast Brazil. Atmosphere 11 (10), 1134. doi:10.3390/atmos11101134
Silva, J. C. C., de Lima, A. M. M., de Holanda, B. S., de Andrade Moreira, F. D. S., and da Costa Cavalcante, J. (2021). Sustainability index in the municipal district of the marapanim River watershed (Pará/Brazil). Rev. Gestão Ambient. Sustentabilidade 10 (1), 1–23.
Silva-Júnior, R. O., Queiroz, J. C. B., Ferreira, D. B. S., Tavares, A. L., Souza-Filho, P. W. M., Guimarães, J. T. F., et al. (2017). Precipitation estimation and mean flows for the itacaiúnas River basin (BHRI), eastern Amazon, Brazil. Rev. Bras. Geogr. Física 10 (5), 1638–1654. doi:10.26848/rbgf.v.10.5.p1638-1654
Silva-Júnior, R. O., Souza-Filho, P. W. M., Salomão, G. N., Tavares, A. L., Santos, J. F., Santos, D. C., et al. (2021). Response of water balance components to changes in soil use and vegetation cover over three decades in the Eastern Amazon. Front. Water 3, 1–15. doi:10.3389/frwa.2021.749507
Silveira, G., and Tucci, C. E. M. (1998). Monitoring small basins for water availability estimation. Rev. Bras. Recur. Hídricos 3 (3), 97–110.
SNIS (2023). Indicator Panel. National sanitation information System – SNIS. Natl. Secr. Environ. Sanitation (SNSA), Ministry Cities.
Sousa, E., and Silva-Júnior, R. O. (2020). Management of water resources in the Itacaiúnas River Basin in the Eastern Amazon. Brazil, Belém: Vale Technological Institute.
Souza-Filho, P. W. M., de Souza, E. B., Silva-Júnior, R. O., Nascimento, W. R., Versiani de Mendonça, B. R., Guimarães, J. T. F., et al. (2016). Four decades of land-cover, land-use, and hydroclimatology changes in the Itacaiúnas River watershed, Southeastern Amazon. J. Environ. Manag. 167, 175–184. doi:10.1016/j.jenvman.2015.11.039
Souza-Filho, P., Nascimento, W., Santos, D., Weber, E., Silva, R., and Siqueira, J. (2018). A GEOBIA approach for multitemporal land-cover and land-use change analysis in a tropical watershed in the Southeastern Amazon. Remote Sens. 10, 1683. doi:10.3390/rs10111683
State Water Resources Plan of Pará – Executive Summary (2021). Produced by the State secretariat of environment and sustainability of Pará (SEMAS/PA) and the Brazilian Company of projects and enterprises (CBPE).
Swanson, A. C., and Bohlman, S. (2021). Cumulative impacts of land cover change and dams on the land–water interface of the Tocantins River. Front. Environ. Sci. 9, 662904. doi:10.3389/fenvs.2021.662904
Taffarello, D., do Carmo Calijuri, M., Viani, R. A. G., Marengo, J. A., and Mendiondo, E. M. (2017). Hydrological services in the Atlantic Forest, Brazil: an ecosystem-based adaptation using ecohydrological monitoring. Clim. Serv. 8, 1–16. doi:10.1016/j.cliser.2017.10.005
Walsh, R. P. D., and Lawler, D. M. (1981). Rainfall seasonality: spatial patterns and change through time. Weather 36 (7), 201–208. doi:10.1002/j.1477-8696.1981.tb05400.x
Wang, Y.-R., Hessen, D. O., Samset, B. H., and StordaL, F. (2022). Evaluating global and regional land warming trends in the past decades with both MODIS and ERA5-Land land surface temperature data. Remote Sens. Environ. 280, 113181. doi:10.1016/j.rse.2022.113181
WMO (2013). Guidelines for trainers in meteorological, hydrological and climate services (WMO-No. 1114). Geneva: World Meteorological Organization.
Zakeri, M. A., Mirnia, S. K., and Moradi, H. (2022). Assessment of water security in the large watersheds of Iran. Environ. Sci. and Policy 127 (2022), 31–37. doi:10.1016/j.envsci.2021.10.009
Zamanzad-Ghavidel, S., Sobhani, R., Etaei, S., Hosseini, Z., and Montaseri, M. (2021). Development of hydro-social-economic-environmental sustainability index (HSEESI) in integrated water resources management. Environ. Monit. Assess. 193, 463. doi:10.1007/s10661-021-09129-4
Keywords: water sustainability index (WSI), environmental public policies, hydrological management, social dimension, eastern Amazon
Citation: Silva Junior RO, Junior WN, Melo AMQ, Almeida HP, Silva MS, Oliveira FS and Lima AMMD (2025) The water sustainability index in a watershed of the eastern Amazon: an analysis of environmental, hydrological, social, and sectoral use dimensions. Front. Environ. Sci. 13:1551177. doi: 10.3389/fenvs.2025.1551177
Received: 02 January 2025; Accepted: 18 August 2025;
Published: 19 September 2025.
Edited by:
Carmen Teodosiu, Gheorghe Asachi Technical University of Iaşi, RomaniaReviewed by:
Florica Manea, Politehnica University of Timişoara, RomaniaLuci Pereira, Federal University of Pará, Brazil
Halil Ibrahim Burgan, Akdeniz University, Türkiye
Copyright © 2025 Silva Junior, Junior, Melo, Almeida, Silva, Oliveira and Lima. This is an open-access article distributed under the terms of the Creative Commons Attribution License (CC BY). The use, distribution or reproduction in other forums is permitted, provided the original author(s) and the copyright owner(s) are credited and that the original publication in this journal is cited, in accordance with accepted academic practice. No use, distribution or reproduction is permitted which does not comply with these terms.
*Correspondence: Renato Oliveira Silva Junior, cmVuYXRvLnNpbHZhLmp1bmlvckBpdHYub3Jn