 Haifa Jia
 Tianyou Wang
 Pengyu Liang
 Jianxun Zhang
 Runhao Zhang
- 1School of Civil Engineering and Water Resources, Qinghai University, Xining, China
- 2Key Laboratory of Energy-Saving Building Materials and Engineering Safety, Xining, Qinghai, China
- 3Laboratory of Ecological Protection and High Quality Development in the Upper Yellow River, Xining, Qinghai, China
- 4School of Architecture and Urban Planning, Beijing University of Technology, Beijing, China
A comprehensive understanding of the spatiotemporal changes and influencing factors of ecosystem service levels is crucial for regional sustainable development and coordination. The Yellow River Basin faces challenges such as ecological degradation due to uneven regional burdens. This study constructed an ecosystem service evaluation framework based on five dimensions. A combined weighting model was used to assess the ecosystem service levels, spatiotemporal characteristics, and influencing factors of nine provincial capital cities in the Yellow River Basin from 2010 to 2020. The results indicated that: (1) There were notable differences in ecosystem service levels among cities in the Yellow River Basin. The first category of cities, rich in tourism resources, exhibited high ecosystem service levels. The second category of cities, currently undergoing industrial green transformation, urgently needed to achieve a balance between economic development and ecological protection. The third category of cities faced challenges due to poor socioeconomic conditions and limited resources. (2) Resource and energy use, Ecological environmental protection, and Socioeconomic development were the most significant dimensions influencing ecosystem service levels. (3) Indicators such as per capita disposable income, per capita road area, urban green coverage, electricity consumption per unit of GDP, and the number of higher education institutions had a considerable impact on ecosystem service levels. This study suggests optimizing the energy structure, promoting clean energy development, supporting industrial green transformation, and strengthening infrastructure to enhance and protect ecosystem services in the Yellow River Basin.
1 Introduction
For a long time, unequal regional development has been a key factor limiting the sustainable development of the river basin (Zhang et al., 2023). Known for its abundant natural resources, strategic location, and fertile soil, the Yellow River Basin (YRB) is a key agricultural production base in China (Zhang et al., 2024), providing significant ecosystem services. However, the region’s geographical expanse and distinct natural geographic features result in ecological vulnerability and imbalanced regional pressures, thereby causing environmental deterioration and pollution (Zhang et al., 2022). In China’s strategic planning for the new era, “promoting green development and fostering harmony between humans and nature” has been established as the core mission of ecological civilization construction. The “Yellow River Protection Law of the People’s Republic of China,” which came into effect in 2023, underscores the importance of the YRB as a critical ecological barrier for the nation. It requires cities within the basin prioritize coordinated ecological restoration and protect the environmental lifeline. With robust national policy support, ecological conservation restoration in the basin has made steady progress, significantly mitigating several key challenges. Nevertheless, ecological protection remains a long-term and formidable task. Coordinating efforts across cities within the basin to enhance ecosystem service levels is a critical component of China’s national strategy and an essential practical measure for achieving ecological conservation goals.
Scholars have extensively investigated ecosystem services and developed various assessment systems and quantitative methods to measure sustainable development. These include the Human Development Index (HDI) (Bhanojirao, 1991; Lind, 2019), Environmental Sustainability Index (ESI) (Env ironmental Sustainability Index, 2002; Bui et al., 2019), and Environmental Performance Index (EPI) (Emerson et al., 2012; Pinar, 2022), among others. In evaluating urban ecosystem service functions, a range of methods and indicator systems have been employed, with common approaches including physical measurements (Dai et al., 2021), value-based evaluations (De Groot et al., 2010; Zhou et al., 2020), and emergy analysis techniques (Odum, 1996; Guan et al., 2022). Indicator systems typically encompass aspects such as biodiversity, air quality, water resources, soil quality, and urban green spaces. These methods and indicator systems provide robust tools for a comprehensive evaluation of urban ecosystem service functions. For example, Costanza et al. proposed a framework for assessing global ecosystem service values, which has served as a reference for evaluating urban ecosystem services (Costanza et al., 1997). Subsequently, more scholars, integrating the characteristics of urban ecosystems, have developed assessment systems suited for evaluating urban ecosystem service functions. Empirical research has demonstrated that the level of urban ecosystem service functions is closely related to factors such as city size, urban planning, and population density. Daily emphasized that rational urban planning and management can significantly enhance the level of urban ecosystem services (Daily, 1997).
In terms of the research scope, some scholars have conducted comprehensive evaluations at a national level (Yuan et al., 2024), analyzing internal regional differences, while others have focused on provinces (Yang et al., 2024) or cities (Kim et al., 2021), evaluating their ecosystem service conditions. Additionally, some studies have analyzed and evaluated regional ecosystem services in areas such as the Yangtze River Economic Belt (Xie et al., 2024), the Beijing-Tianjin-Hebei Region (Zhai et al., 2024), and urban agglomerations (Peng et al., 2021). Regarding the methods for assigning weights to indicators, scholars have made significant innovations, including the Delphi method (Jo et al., 2024), the entropy weight method (Amirnejad et al., 2024; Chen et al., 2024), the analytic hierarchy process (Ji et al., 2024; Jorge-García and Estruch-Guitart, 2022), fuzzy comprehensive evaluation (Fan and Ma, 2024; Sun et al., 2019), and principal component analysis (Kou et al., 2024; Salata and Grillenzoni, 2021), as well as integrate weighting methods that combine two or more weighting techniques (Chen et al., 2022).
Despite substantial theoretical advancements in measuring ecosystem service levels, several gaps remain: (1) In terms of research areas, studies frequently focus on national, provincial, or urban scales, with linear regions such as railway or canal corridors receiving more attention (Tong et al., 2021; Gao et al., 2019). Few studies have focused on river basins, especially the YRB, as their research scope. (2) In terms of evaluation system construction, much of the focus has been on ecological environment construction (Gómez-Limón et al., 2020), while the impact of ecosystem service levels has been overlooked, leading to incomplete indicator dimensions. (3) There is a lack of interregional comparative studies (Guo et al., 2017), as well as differentiated strategies for addressing regional disparities.
This study constructed and employed an ecosystem service evaluation indicator system specifically for the provincial capitals along the Yellow River. It assessed the level of ecosystem services and their influencing factors from 2010 to 2020. The findings aimed to provide valuable insights into the development of ecosystem service systems and to promote high-quality development within the YRB.
2 Study area and data sources
2.1 Study area
The Yellow River in northern China is the country’s second-longest river, extending approximately 5,464 km and covering a watershed area of about 795,000 square kilometers (Cui et al., 2022a). This study focuses on the provincial capitals along the Yellow River, which serve as major urban centers within the basin. The river traverses nine provinces and autonomous regions: Qinghai, Sichuan, Gansu, Ningxia, Inner Mongolia, Shanxi, Shaanxi, Henan, and Shandong. These areas are endowed with abundant natural resources, including coal, oil, natural gas, rare earth elements, non-ferrous metals, and other minerals. Additionally, they also possess abundant biological resources such as forests, grasslands, wildlife, and diverse plant species. Despite these advantages, the basin faces pressing environmental issues like soil erosion, water pollution, water scarcity, and ecological degradation (Lu et al., 2022). In response, the Chinese government has initiated efforts to mitigate these challenges, including enhancing soil and water conservation, advancing ecological restoration projects, and promoting sustainable water use and protection (Yurui et al., 2021).
This study examines nine provincial capital cities along the Yellow River as research subjects (Figure 1), which serve as the primary urban centers within the basin. As key administrative and economic hubs, these cities are prioritized for ecological governance in the Yellow River Basin. Spanning the upper, middle, and lower reaches of the Yellow River, these cities encompass a diverse array of ecosystems from alpine regions to alluvial plains. The dynamics of their ecosystem services provide clear evidence of the spatial heterogeneity and pressures experienced across the entire basin.
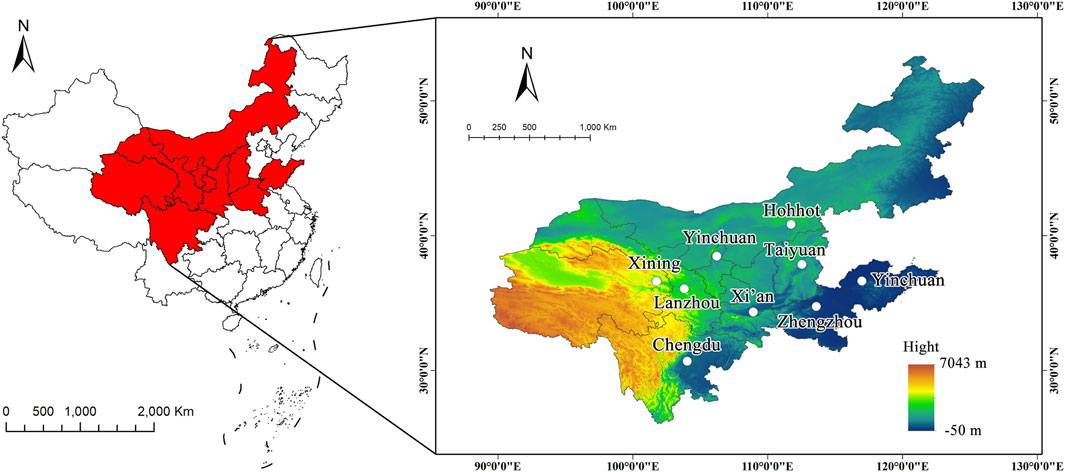
Figure 1. Overview of the Study area. This map is based on the standard map with the approval number GS (2024) 0650 downloaded from the national platform for common geospatial information services (Tianditu), and the base map has not been modified.
2.2 Construction of the indicator system
Adhering to principles of scientific rigor, hierarchy, operational feasibility, comprehensiveness, and purposefulness, we selected indicators based on various frameworks and research, including the Global Biodiversity and Ecosystem Services Assessment Report (Baste et al., 2024) and the 2030 Agenda for Sustainable Development (Schneider et al., 2019). We designed an indicator system to evaluate the ecosystem service development level of the provincial capitals in the YRB across five dimensions: National land space, Socioeconomic development, Resource and energy use, institutional and inputs, and ecological environmental protection.
The indicators are organized into three layers: target, standardized, and indicator layers, as shown in Table 1. This structure establishes a clear hierarchical relationship among the indicators, facilitating an integrated assessment of urban ecosystem service levels.
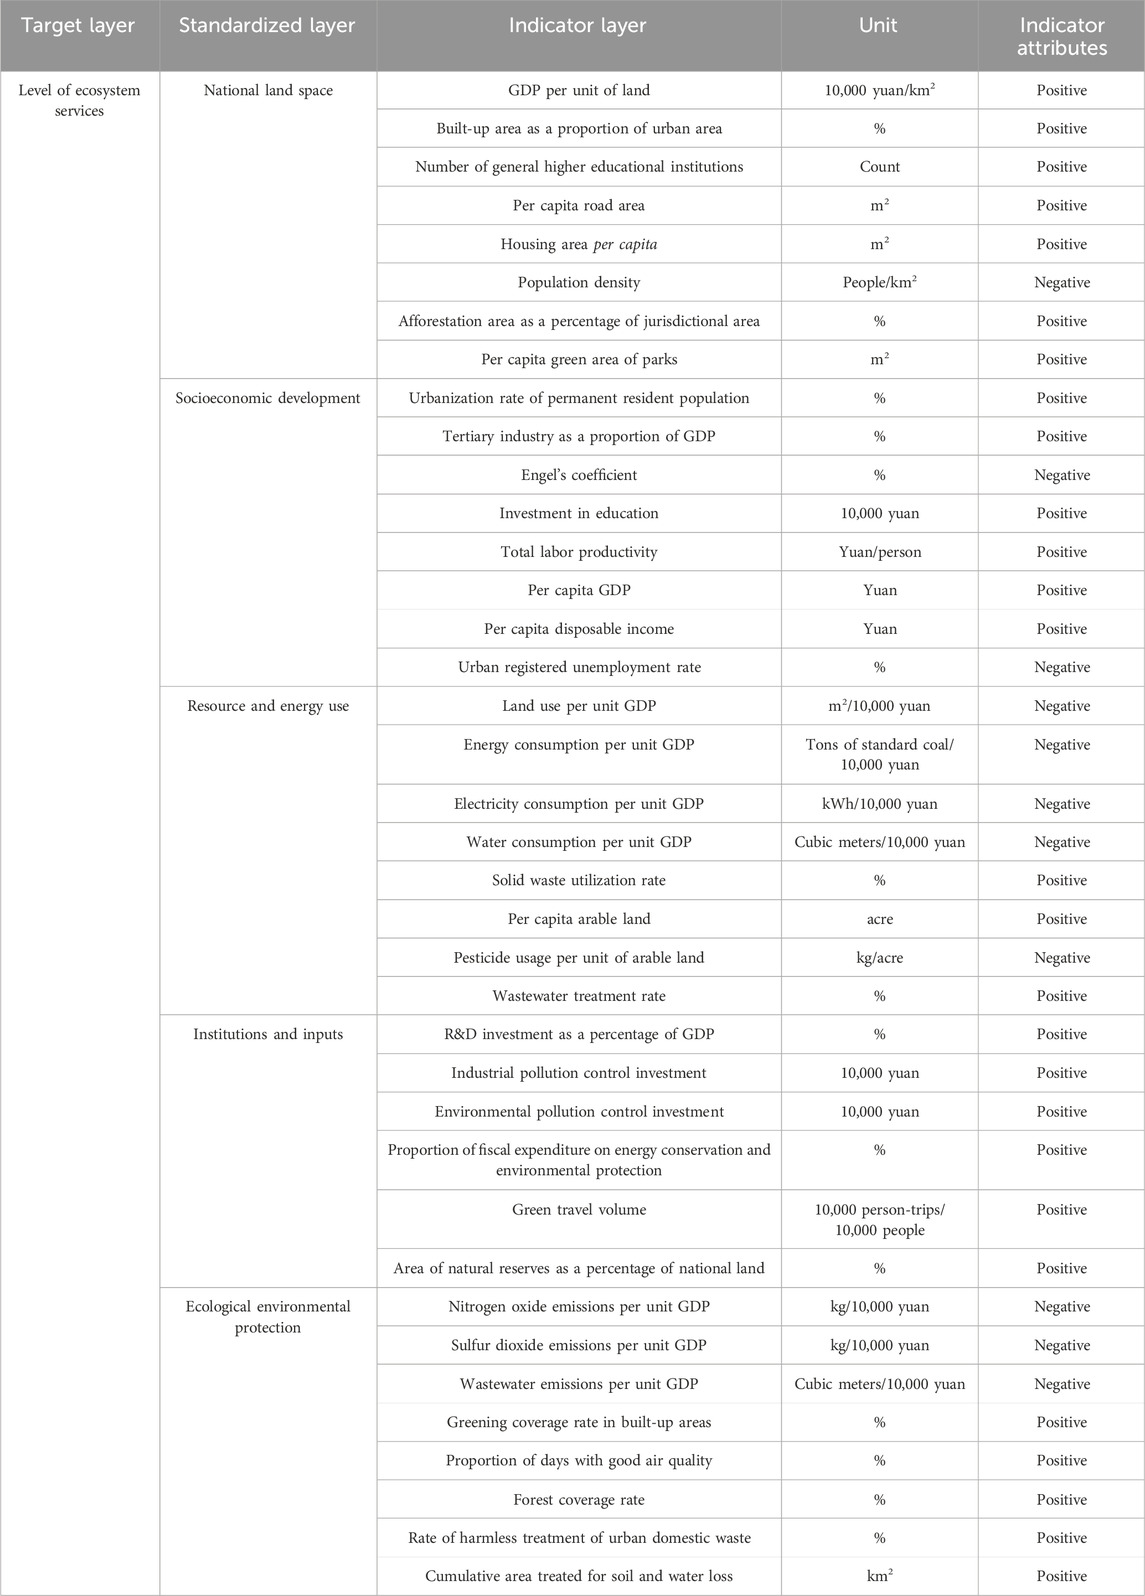
Table 1. Urban ecosystem service level evaluation indicator system for the provincial capitals of the YRB.
2.3 Data sources
This study utilized data from 2010 to 2020, primarily sourced from official statistics, provincial and city statistical yearbooks (2011–2021), and city environmental status reports (2011–2021). Calculations were performed to derive certain indicators, including GDP per unit of land, Built-up area as a proportion of urban area, afforestation area as a percentage of the jurisdictional area, and pesticide usage per unit of arable land. Economic indicators such as per capita GDP, Engel’s coefficient, and the tertiary industry as a proportion of GDP were obtained from provincial and city statistical yearbooks. Environmental indicators such as proportion of days with good air quality, nitrogen oxide emissions per unit GDP and Sulfur dioxide emissions per unit GDP were referenced from each city’s environmental status reports. Additional data on area treated for soil and water loss and nature reserves were acquired directly from relevant government departments. For missing data, we employed trend extrapolation methods.
3 Methods
The research approach of this study consists of four main steps: (1) Gather multi-period indicator data for the nine provincial capital cities in the Yellow River Basin across five dimensions: National land space, Socioeconomic development, Resource and energy use, Institutions and inputs, and Ecological environmental protection; (2) Employ a combined weighting model to determine the weights of the indicators and calculate the comprehensive scores for ecosystem service levels; (3) Visualize the ecosystem service levels and conduct cluster analysis to identify spatial-temporal patterns; (4) Utilize a panel data regression model to analyze the influencing factors and test their significance, ultimately identifying the key indicators affecting ecosystem service levels in the Yellow River Basin.
3.1 Indicator weights
To determine the weights of the indicators, both subjective and objective methods were employed. The subjective method depend on the evaluator’s expertise and understanding of the subject matter but can be influenced by personal biases (Kokangül et al., 2017). The objective method, specifically the entropy weight method, quantifies the variability and disorder within the data, assigning weights accordingly. This method posits that the less variation an indicator exhibits, the lower its entropy and, consequently, its weight in the evaluation system (Žižović et al., 2020).
To mitigate the limitations of both approaches, we adopted a hybrid method combining hierarchical analysis and entropy weighting. Initially, weights were calculated independently using each method. The final weights were then determined by averaging the results from both the subjective and objective calculations.
For the hierarchical analysis, we consulted 15 experts specializing in resource utilization, ecological restoration, economic development, land planning, and related fields. Using a 1-5 scale, these experts compared the importance of each indicator, assigning values to each influencing factor. A judgment matrix was then constructed, and SPSS 26.0 was used to calculate the weight of each indicator.
The entropy weight method is defined as follows: For the j-th indicator, the entropy
Where:
The weight
These formulas measure the informational content of each indicator, with the final weights reflecting both the variability and significance of each factor within the comprehensive evaluation system.
3.2 Panel data regression
Panel data regression analysis, as a commonly used method in economic research, can help researchers explore the changes of observed objects over time and among individuals, and further analyze the impact of specific factors on them (Hoechle, 2007). This method is particularly effective for understanding dynamics that may not be evident in purely cross-sectional or time-series data.
The panel data regression model in this study is structured as follows:
Dependent Variable: The dependent variable represents the level of ecosystem services in each city, denoted by the comprehensive score of ecosystem services (
Independent Variables: The independent variables are selected based on their relevance to the ecosystem service level and encompass factors related to the economy, resources, and environment. These variables include: Number of general higher education institutions (X1), Per capita road area (X2), Per capita disposable income (X3), Electricity consumption per unit of GDP (X4), Greening coverage rate in built-up areas (X5), R&D investment as a percentage of GDP (X6), and Urban registered unemployment rate (X7).
Model Specification: The panel data regression model is formally expressed as:
Where: yit is the observed value of the dependent variable for city i at time t, xkit the observed value of the k-th independent variable for city i at time t, βk are the parameters to be estimated, uit is the error term accounting for variations over time and across individuals, i represents each of the 9 cities analyzed, t covers the 11-year time span from 2010 to 2020.
This model allows us to assess the impact of various economic, resource, and environmental factors on the ecosystem service levels of the provincial capitals along the YRB.
3.3 Results of influencing factors
3.3.1 Unit root test
To ensure the reliability of our regression analysis, we conducted unit root tests on the time-series panel data to ascertain stationarity. Non-stationary time series, characterized by the presence of a unit root, can lead to spurious regression results. Using EViews 10, we applied four different test methods—Levin, Lin and Chu (LLC), Im, Pesaran & Shin (IPS), Augmented Dickey-Fuller (ADF), and Phillips-Perron (PP)—to evaluate the stationarity of our variables. The results are summarized in Table 2. The results indicate that all variables pass the unit root tests at the 1% or 5% significance levels, confirming that the series are stationary and suitable for further analysis.
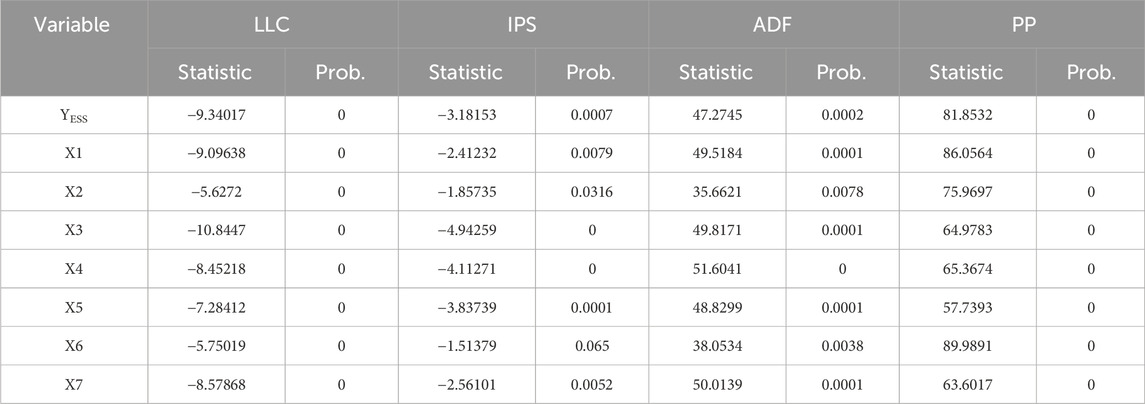
Table 2. Unit root test results.
3.3.2 Cointegration tests
After establishing stationarity, we conducted a cointegration test to verify the absence of spurious regression in our model. This test examines whether a long-term equilibrium relationship exists among the variables, assuming the differenced series are integrated of the same order. The results, presented in Table 3, indicate that four out of seven tests show statistical significance. These cointegration results affirm the presence of a stable long-term equilibrium relationship among the variables. Consequently, this confirms that the regression results are valid and not affected by spurious regression.
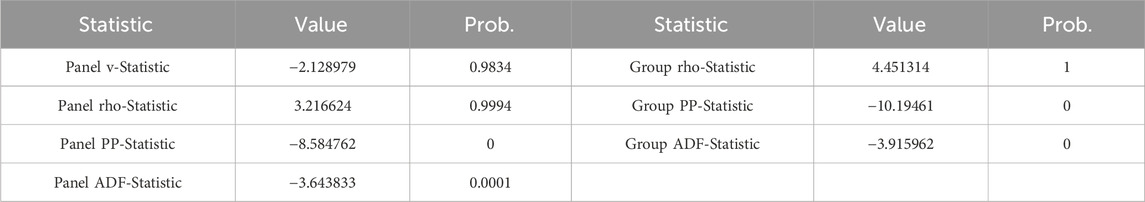
Table 3. Cointegration test results.
3.3.3 Regression results and model testing
We then performed model diagnostics to determine the most appropriate regression model. The results, summarized in Table 4, indicate that the fixed-effects model passed both the F-test and the Hausman test, suggesting it is suitable for our data. The heteroscedasticity test rejected the null hypothesis of homoscedasticity, and the Wooldridge test for auto-correlation rejected the null hypothesis of no autocorrelation. These findings support the use of the fixed-effects model for analyzing the influencing factors in our study.
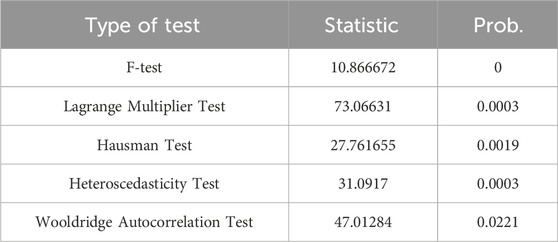
Table 4. Model test results.
3.3.4 Analysis of empirical results
Table 5 presents the regression results from various models, including hybrid model, fixed effects, random effects, and Feasible Generalized Least Squares (FGLS). The initial pooled and random effects models showed that three indicators did not pass the significance tests at the 1% or 5% levels, indicating these models may not adequately capture the relationships among variables. The fixed-effects model improved upon this but still had two indicators that were not significant, suggesting limitations in addressing within-group autocorrelation, contemporaneous correlation, and heteroscedasticity.
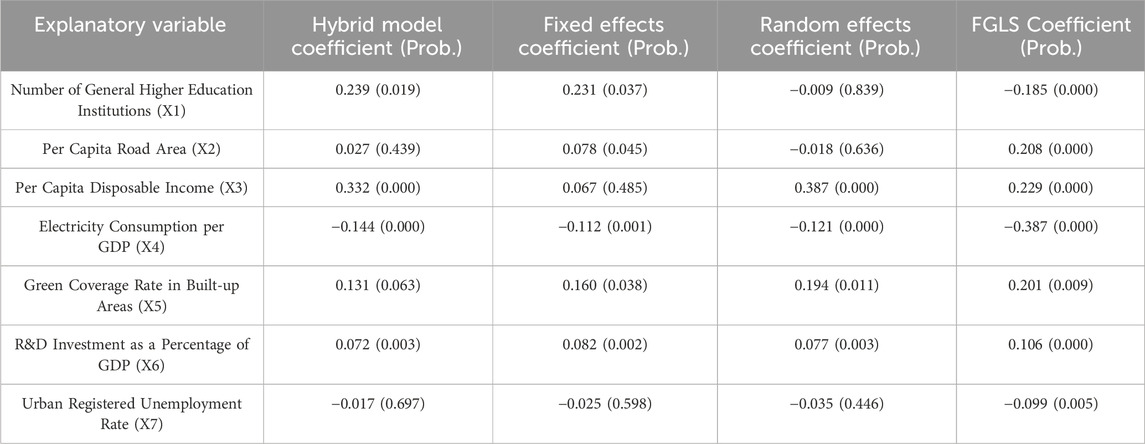
Table 5. Model regression results.
To resolve these issues, we applied FGLS for correction. The FGLS-corrected model effectively mitigated the problems of heteroscedasticity and autocorrelation, leading to statistically significant results across all indicators. Consequently, the FGLS-corrected panel model demonstrates its efficacy in analyzing the influencing factors in this study, providing robust and reliable results even in the presence of potential data irregularities.
4 Results
4.1 Composite scores of ecosystem service levels
Using the weighting method described earlier, we calculated the composite ecosystem service scores (
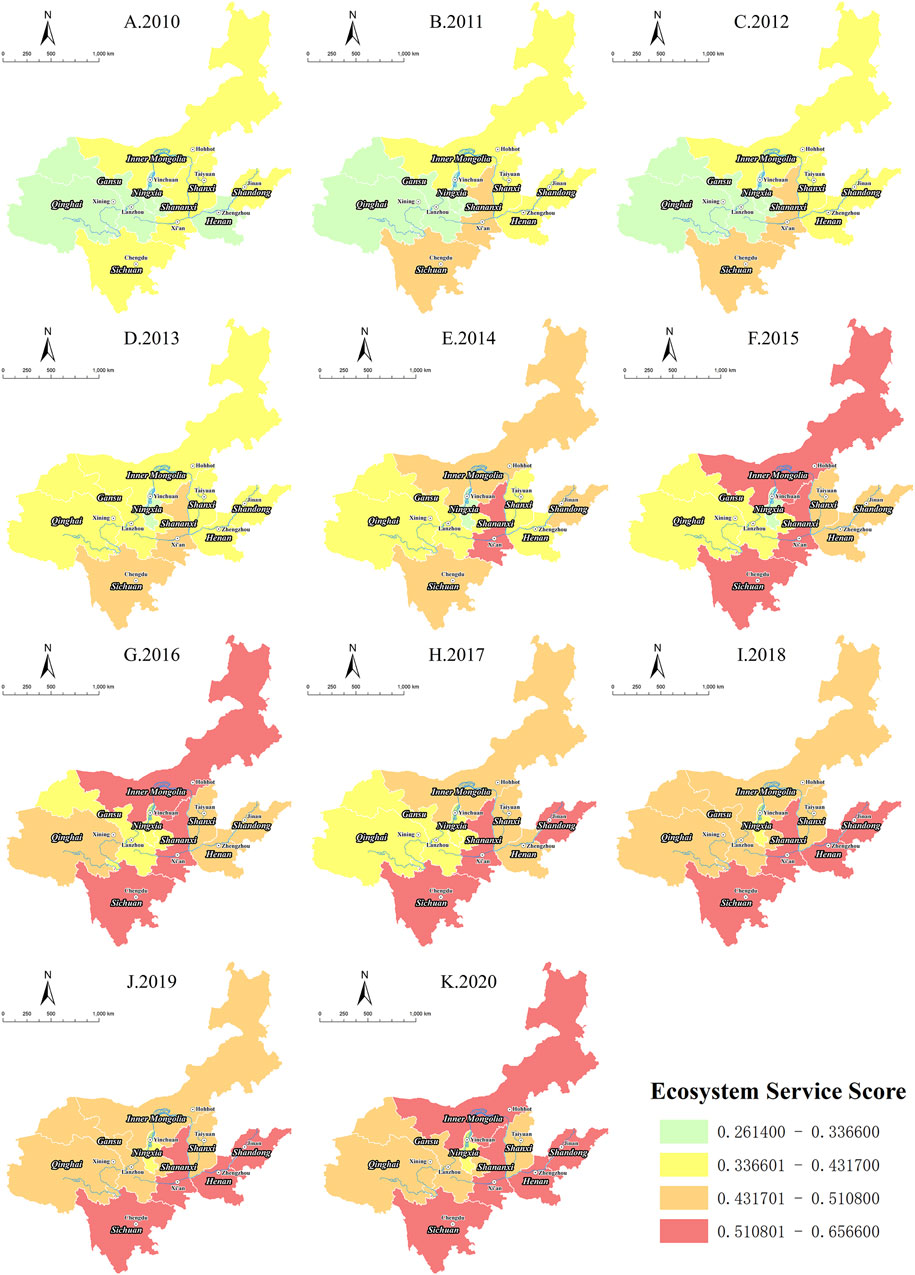
Figure 2. Ecosystem service scores of the provincial capitals in the YRB (2010–2020).
The data indicate a significant upward trend in the ecosystem service levels of the nine provincial capitals from 2010 to 2020. The average comprehensive score increased from 0.3453 to 0.5173, marking a substantial rise of 49.79%. This improvement reflects the effective implementation of ecosystem service initiatives, ecological protection measures, and national high-quality development strategies that collectively enhanced the region’s ecosystem services.
From a spatial layout perspective, the upstream high-altitude and arid regions exhibit a fragile ecological foundation and relatively low ecosystem service levels compared to other cities within the Yellow River Basin. Despite significant growth due to measures such as the treatment of the Three-Rivers Source and grassland restoration, the average value in 2020 was only 0.4355, indicating that water resource constraints and climate change continue to pose long-term challenges. In contrast, the middle reaches, characterized by severe soil erosion, have seen a substantial improvement in their average value to 0.5638, attributed to initiatives like reforestation and the closure of polluting enterprises. The downstream estuarine wetlands, focusing on wetland restoration, have also witnessed a steady increase in their ecological value to 0.5302. However, there was a slight decline in 2019, which might be related to the encroachment of urban expansion on ecological space (Dong et al., 2023).
We also assessed scores for each of the five criterion layers: National Land Space, Socioeconomic Development, Resource and Energy Use, Institutions and Inputs, and Ecological Environmental Protection (Figure 3).
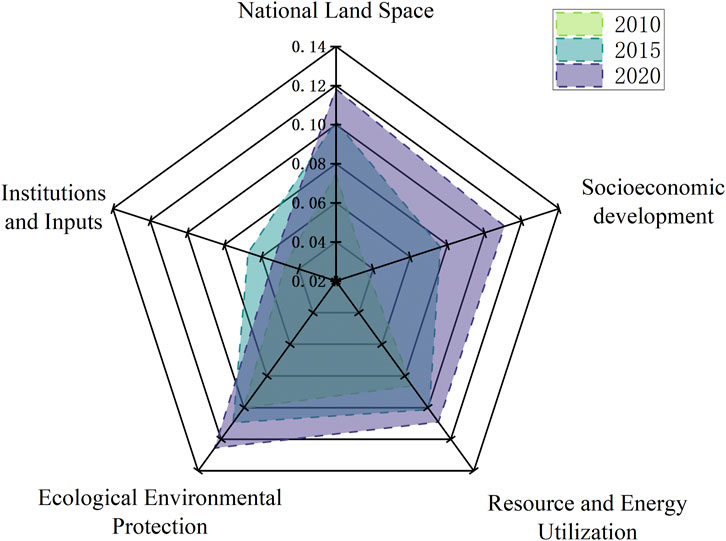
Figure 3. Ecosystem service scores of the provincial capitals in the YRB (2010–2020).
The results show that the contribution value of ecological environment protection indicators to ecosystem services has always ranked first, highlighting its core position in maintaining regional ecological functions. Notably, socioeconomic development indicators have shown a strong growth trend, with their score rising sharply from 0.0366 in 2010 to 0.1107 in 2020, representing a cumulative increase of 202.06%. This significant rise not only confirms the positive synergy between socioeconomic factors and ecosystem services but also highlights the profound impact of transitioning socioeconomic development models on enhancing ecological service capacity. Additionally, the national land space indicators have also achieved a significant increase of 57.98%, reflecting the optimization of land use structure and the continuous improvement of spatial governance efficiency, providing important spatial support for the enhancement of ecosystem service capacity. In contrast, the institutions and inputs indicators have only grown by 13.51%, and their relatively lagging development speed reveals the insufficiency of institutional innovation and financial guarantee mechanisms, which has become a key shortcoming restricting the continuous optimization of ecosystem service capacity.
These developments are consistent with the strategic objectives outlined in China’s 12th and 13th Five-Year Plans, which prioritized ecological protection and high-quality development as key national goals. During these periods, rapid economic growth and enhancements in living standards facilitated better integration of economic and ecological goals. The promotion of green industry transformation and the adoption of sustainable development principles have propelled these cities toward higher stages of social and economic advancement, aiming to achieve a comprehensively prosperous society.
Furthermore, the average per capita disposable income in these cities increased from 16,368 yuan in 2010 to 37,108 yuan in 2020. Simultaneously, the average population density rose from 559 people per square kilometer to 731 people per square kilometer (Figure 4). This increase in population density highlights the growing pressure on urban space and underscores the ongoing challenges in balancing human activities with environmental sustainability. It emphasizes the need for continuous efforts to improve human-nature relationships, with sustainable urban planning and development being essential components in enhancing ecosystem services.
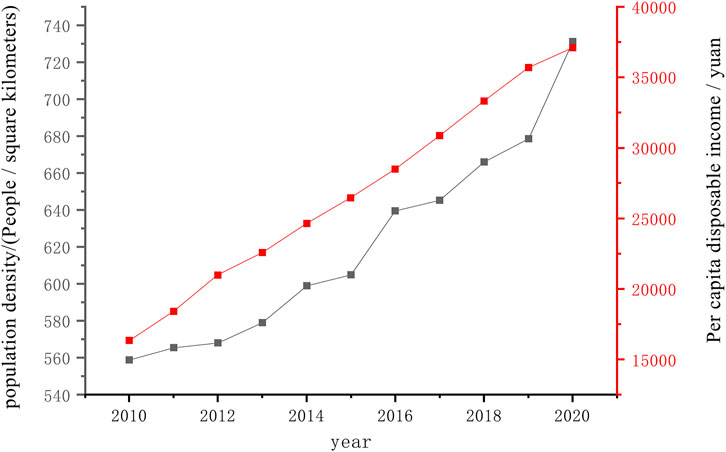
Figure 4. Per capita disposable income and population density of the capital cities in the YRB from 2010 to 2020.
4.2 Time-series evolution characteristics
From 2010 to 2020, the ecosystem service levels of each city exhibited a general up-ward trend. Notably, Chengdu, Xi’an, and Zhengzhou recorded the highest comprehensive scores, reaching 0.6566, 0.5790, and 0.5643, respectively. The most significant score in-creases were observed in Chengdu, Zhengzhou, and Xining, with respective gains of 0.240, 0.238, and 0.187. In terms of percentage growth, Zhengzhou, Xining, and Lanzhou showed the most substantial improvements, increasing by 73.2%, 71.6%, and 66.6%, respectively.
Despite these overall gains, some cities experienced periodic declines. In 2012, Chengdu’s score dropped by 2.82% due to reduced afforestation, local climate disruptions, and increased carbon dioxide levels, which negatively affected air quality. Yinchuan’s score decreased by 1.27% in 2011, largely because the effectiveness of domestic waste treatment fell by 40.2%, impacting the city’s composite score. Hohhot faced downturns in 2017 and 2018, with decreases of 4.20% and 0.31%, respectively. These declines occurred during the initial phase of the “13th Five-Year Plan,” a period marked by significant industrial restructuring. In 2017, increases in Hohhot’s electricity and water consumption per unit of GDP, along with a 17.44% reduction in soil erosion control areas, contributed to the lower scores. In 2018, further increases in electricity consumption per unit of GDP and a decline in the comprehensive utilization of solid waste exacerbated the reduction in its overall ecosystem service level.
4.3 Cluster analysis results
To deepen our understanding of the variations in ecosystem service levels among the provincial capitals of the YRB, we performed a cluster analysis using SPSS 26.0 software. This analysis produced a dendrogram that visualizes the relationships and groupings among the cities (Figure 5).
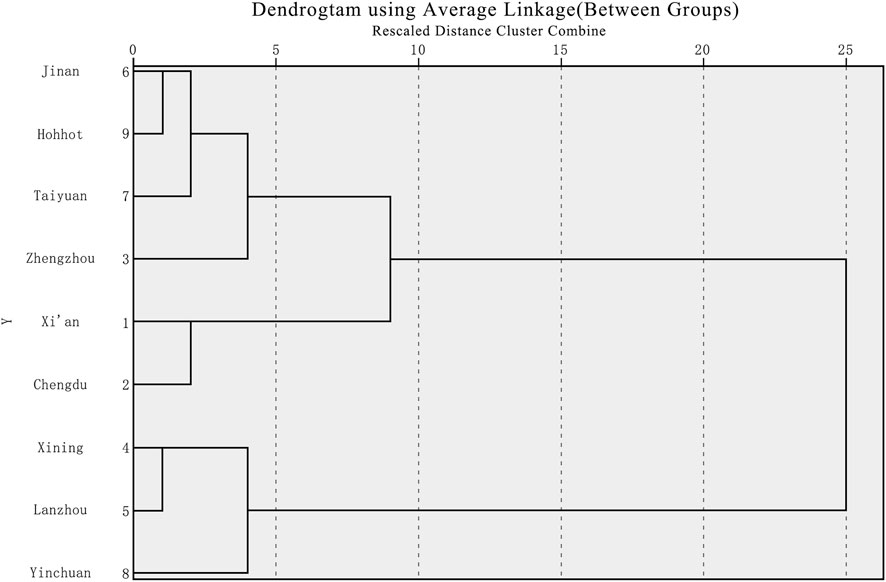
Figure 5. Cluster analysis dendrogram of ecosystem service levels in the provincial capitals of the YRB.
The dendrogram categorizes the provincial capitals into three distinct groups based on their ecosystem service levels. First Category: Xi’an and Chengdu are classified together as cities with high ecosystem service levels. Second Category: Jinan, Hohhot, Taiyuan, and Zhengzhou form a group with medium ecosystem service levels. Third Category: Xining, Lanzhou, and Yinchuan are grouped as cities with relatively low ecosystem service levels.
A time-series analysis of these categories from 2010 to 2020, as detailed in Table 6, reveals significant improvements across all groups. The first category, comprising Xi’an and Chengdu, started with an average comprehensive score of 0.4192 in 2010 and in-creased to 0.6178 by 2020, marking the most substantial growth of 0.1986. The second category’s average score rose from 0.3640 in 2010 to 0.5312 in 2020, an increase of 0.1672. The third category, despite starting with the lowest average score of 0.2712 in 2010, achieved 0.4318 by 2020, reflecting a growth of 0.1606.
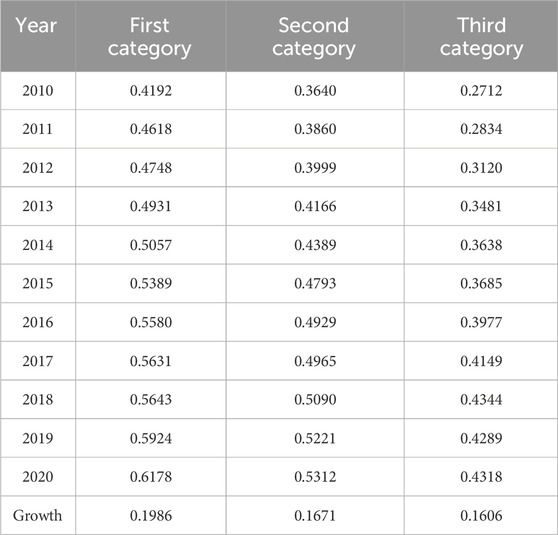
Table 6. Average comprehensive scores and growth for the three categories of urban ecosystem service from 2010 to 2020.
5 Discussion
5.1 Urban classification discussion
The first category of cities are famous tourist cities in China, which continuously promote policies and financial investments in the field of environmental governance and protection. Tourist cities pay more attention to environmental protection and pollution control. The second category of cities is in the stage of industrial green transformation, and the lack of green industry is the main factor leading to its low level. Hohhot is rich in forest and grassland resources, but grassland degradation caused by overgrazing has resulted in its low level of ecosystem services (Qin et al., 2021). Cities in the third category are mostly in areas with underdeveloped economic development, which is due to the low level of urban development leading to inefficient environmental governance, again a factor limiting their ecosystem service level, similar to the findings of Guo et al. (2017).
5.2 Analysis of influencing factors
From the perspective of the influence mechanism of key variables, per capita disposable income is identified as the most significant positive driver of ecosystem service levels. Higher per capita disposable income not only signifies improved urban economic development but also reflects enhanced environmental awareness among residents and increased investment in environmental governance, thereby significantly boosting environmental management efficiency. In contrast, electricity consumption per unit of GDP, as the strongest negative indicator, has an impact coefficient nearly twice that of per capita disposable income. This result clearly demonstrates that, at comparable levels of economic development, higher energy consumption intensity leads to lower resource utilization efficiency and greater environmental pollution pressure, ultimately resulting in a marked decline in ecosystem service levels.
The indicators of per capita road area, greening coverage rate in built-up areas, and R&D investment as a percentage of GDP all exhibit significant positive correlations with ecosystem service levels. Specifically, the positive effect of per capita road area underscores the role of improved urban infrastructure in enhancing ecological service capacity; the positive impact of greening coverage rate in built-up areas confirms the critical importance of “green space” in improving urban ecological environments; and the positive correlation of R&D investment intensity highlights the significance of technological innovation in promoting green development.
Notably, the number of general higher education institutions and the urban registered unemployment rate are negatively correlated with ecosystem service levels. The negative effect of higher education institutions may stem from the associated increase in population density, which places additional pressure on the urban ecological environment. Meanwhile, the negative impact of the urban registered unemployment rate reveals the close relationship between employment status and the ecological environment: a higher unemployment rate not only indicates insufficient economic momentum but can also lead to reduced environmental governance investment, thereby intensifying environmental governance challenges.
These findings offer important policy implications: while continuing to enhance economic development, efforts must be made to reduce energy consumption intensity, optimize the allocation of higher education resources, and support ecological civilization construction through stable employment promotion. Additionally, investments in infrastructure should be increased, urban greening should be advanced, and R&D investment should be raised to enhance ecosystem service levels across multiple dimensions.
5.3 Recommendations
Effective enhancement of ecosystem services requires differentiated strategies for cities facing distinct challenges. For first category cities, maintaining regional leadership and robust ecological services growth should focus on high-quality development. Chengdu should advance park city construction by expanding urban green spaces and increasing R&D investment. Xi’an could leverage its academic resources to optimize environmental science programs, converting educational advantages into ecological innovations. Second category cities need to balance economic growth with environmental conservation through habitat improvement. Jinan requires rational urban planning to prevent ecosystem degradation from overdevelopment (Cui et al., 2022b). Hohhot should strengthen grassland conservation while developing eco-friendly husbandry and tourism. Taiyuan must accelerate green transition in coal industries and nurture renewable energy sectors. Zhengzhou should accelerate the green transformation of traditional manufacturing industries and simultaneously cultivate industrial clusters for the recycling and utilization of renewable resources to form a closed-loop resource utilization system. For third category cities, infrastructure development forms the foundation for ecological services enhancement. Key measures include expanding road networks, establishing ecological corridors, and increasing vegetation coverage. Xining could leverage its strategic location in the Three-Rivers Source region to develop ecotourism, thereby boosting local incomes. Lanzhou should prioritize employment security while constructing ecological corridors along the Yellow River. Yinchuan needs to implement water-efficient irrigation systems and strengthen wetland conservation in Yellow River basins.
Achieving both ecological protection and high-quality development in the Yellow River Basin requires a comprehensive approach. Rational allocation of water resources, coupled with optimized ecological compensation mechanisms through cross-regional cooperation, will promote both ecological and economic progress.
6 Conclusion
This study established an indicator system to evaluate ecosystem services in the provincial capital cities within the Yellow River Basin. By employing a combined weighting method, we calculated the ecosystem service levels for nine provincial capitals from 2010 to 2020. Cluster analysis was conducted to assess the spatiotemporal characteristics of ecosystem service levels across the nine provincial capital cities in the basin. Additionally, a panel regression model was applied to analyze the factors influencing ecological services and to identify the key indicators affecting the ecosystem service levels in the Yellow River Basin.
The results show that the ecosystem service levels of the nine provincial capitals in the Yellow River Basin have significantly improved, and the ecological environment has continuously improved. However, there are noticeable differences among cities. Chengdu and Xi’an exhibit the highest ecosystem service levels, while Zhengzhou, Xining, and Lanzhou show the largest increases in ecosystem service levels. The rankings of cities in the upper, middle, and lower reaches of the Yellow River are mixed, revealing a distinct spatial pattern influenced by regional ecological characteristics and restoration strategies. This suggests that the optimization and enhancement of ecosystem service functions depend on the synergistic interaction of multiple factors, including natural conditions, socio-economic elements, and policy regulations.
In terms of influencing factors, the analysis revealed that per capita disposable income, per capita road area, greening coverage rate in built-up areas, and R&D investment as a percentage of GDP all have significant positive correlations with ecosystem service levels. Notably, per capita disposable income shows a consistent positive correlation across three models, indicating that it plays a key role in the overall improvement of ecosystem service levels in the Yellow River Basin. On the other hand, variables such as electricity consumption per unit of GDP, the number of general higher education institutions, and the urban registered unemployment rate show significant negative correlations with ecosystem service levels. Overall, effective measures to maintain and gradually improve ecosystem service levels in the Yellow River Basin include optimizing the energy structure, promoting the development of clean energy, driving the green transformation of industrial structures, and enhancing infrastructure development.
Although this study provides valuable insights into the dynamics of ecosystem services in provincial capital cities along the Yellow River Basin, it is also necessary to recognize some limitations. The indicator system primarily focuses on socioeconomic and environmental dimensions, which may overlook nuanced cultural or governance factors that can influence ecosystem services. Additionally, due to constraints in data availability, trend extrapolation was necessary for handling missing values, potentially introducing uncertainties in the calculation of indicators. Future research could integrate high-resolution remote sensing data to capture more detailed ecological patterns. Comparative studies across different river basins, such as the Yangtze River Basin, would help identify both region-specific and universal drivers of ecosystem services.
Data availability statement
The data analyzed in this study is subject to the following licenses/restrictions: The data are not publicly available due to privacy or ethical restrictions. Requests to access these datasets should be directed to Jianxun Zhang, emhhbmdqaWFueHVuQHFodS5lZHUuY24=.
Author contributions
HJ: Conceptualization, Methodology, Writing – original draft, Writing – review and editing. TW: Data curation, Investigation, Writing – original draft. PL: Software, Writing – review and editing. JZ: Conceptualization, Methodology, Writing – original draft, Writing – review and editing. RZ: Formal Analysis, Validation, Writing – review and editing.
Funding
The author(s) declare that financial support was received for the research and/or publication of this article. This research was funded by the National Social Science Foundation of China (Grant number 22XTJ005).
Conflict of interest
The authors declare that the research was conducted in the absence of any commercial or financial relationships that could be construed as a potential conflict of interest.
Generative AI statement
The authors declare that no Generative AI was used in the creation of this manuscript.
Publisher’s note
All claims expressed in this article are solely those of the authors and do not necessarily represent those of their affiliated organizations, or those of the publisher, the editors and the reviewers. Any product that may be evaluated in this article, or claim that may be made by its manufacturer, is not guaranteed or endorsed by the publisher.
References
Amirnejad, H., Hosseini, S., and Azadi, H. (2024). Evaluation and valuation of tajan River Basin ecosystem services. Ecohydrol. Hydrobiol. 25, 238–249. doi:10.1016/j.ecohyd.2024.03.005
Baste, I., Larigauderie, A., and Watson, R. T. (2024). “The intergovernmental science-policy platform on biodiversity and ecosystem services,” in Encyclopedia of biodiversity. Editor S. M. Scheiner 3rd Edition (Oxford, United Kingdom: Academic Press), 214–235. doi:10.1016/B978-0-12-822562-2.00147-X
Bhanojirao, V. V. (1991). Human development report 1990: review and assessment. World Dev. 19 (10), 1451–1460. doi:10.1016/0305-750X(91)90087-X
Bui, N. T., Kawamura, A., Bui, D. D., Amaguchi, H., Bui, D. D., Truong, N. T., et al. (2019). Groundwater sustainability assessment framework: a demonstration of environmental sustainability Index for Hanoi, Vietnam. J. Environ. Manage. 241, 479–487. doi:10.1016/j.jenvman.2019.02.117
Chen, L., Ma, L., Jiji, J., Kong, Q., Ni, Z., Yan, L., et al. (2022). River ecosystem health assessment using a combination weighting method: a case study of Beijing section of Yongding River in China. Int. J. Environ. Res. Public. Health 19 (21), 14433. doi:10.3390/ijerph192114433
Chen, L., Yao, Y., Xiang, K., Dai, X., Li, W., Dai, H., et al. (2024). Spatial-temporal pattern of ecosystem services and sustainable development in representative mountainous cities: a case study of Chengdu-Chongqing urban agglomeration. J. Environ. Manage. 368, 122261. doi:10.1016/j.jenvman.2024.122261
Costanza, R., d’Arge, R., de Groot, R., Farber, S., Grasso, M., Hannon, B., et al. (1997). The value of the World’s ecosystem services and natural capital. Nature 387 (6630), 253–260. doi:10.1038/387253a0
Cui, J., Zhu, M., Liang, Y., Qin, G., Li, J., and Liu, Y. (2022a). Land use/land cover change and their driving factors in the Yellow River Basin of Shandong province based on google earth engine from 2000 to 2020. ISPRS Int. J. Geo-Inf. 11 (3), 163. doi:10.3390/ijgi11030163
Cui, J., Zhu, M., Mi, H., and Liu, Y. (2022b). Evaluation of eco-environmental quality and analysis on spatio-temporal variation in Jinan, China. Pol. J. Environ. Stud. 31 (2), 1061–1072. doi:10.15244/pjoes/140297
Dai, X., Johnson, B. A., Luo, P., Yang, K., Dong, L., Wang, Q., et al. (2021). Estimation of urban ecosystem services value: a case study of Chengdu, Southwestern China. Remote Sens. 13 (2), 207. doi:10.3390/rs13020207
Daily, G. C., Matson, P. A., and Vitousek, P. M. (1997). “Introduction: what are ecosystem services,” in Nature’s services: societal dependence on natural ecosystems. Editor G. C. Daily (Washington, DC: Island Press), 1.
De Groot, R. S., Alkemade, R., Braat, L., Hein, L., and Willemen, L. (2010). Challenges in integrating the concept of ecosystem services and values in landscape planning, management and decision making. Ecol. Complex. 7 (3), 260–272. doi:10.1016/j.ecocom.2009.10.006
Dong, H., Liu, Y., Cui, J., Zhu, M., and Ji, W. (2023). Spatial and temporal variations of vegetation cover and its influencing factors in Shandong province based on GEE. Environ. Monit. Assess. 195 (9), 1023. doi:10.1007/s10661-023-11650-7
Emerson, J. W., Hsu, A., Levy, M. A., de Sherbinin, A., Mara, V., Esty, D. C., et al. (2012). Environmental performance Index and pilot trend environmental performance Index. New Haven, CT: Yale Center for Environmental Law and Policy.
Environmental Sustainability Index (2002). An initiative of the global leaders of tomorrow environment task force.
Fan, Y., and Ma, S. (2024). Integrating fuzzy analytic hierarchy process into ecosystem service-based spatial planning: a case study of the Shenyang Metropolitan area, China. Ecol. Inf. 81, 102625. doi:10.1016/j.ecoinf.2024.102625
Gao, J., Yu, Z., Wang, L., and Vejre, H. (2019). Suitability of regional development based on ecosystem service benefits and losses: a case study of the Yangtze River Delta urban agglomeration, China. Ecol. Indic. 107, 105579. doi:10.1016/j.ecolind.2019.105579
Gómez-Limón, J. A., Arriaza, M., and Guerrero-Baena, M. D. (2020). Building a composite indicator to measure environmental sustainability using alternative weighting methods. Sustainability 12 (11), 4398. doi:10.3390/su12114398
Guan, X., Fu, Y., Meng, Y., and Yan, D. (2022). Water ecology emergy analytic system construction and health diagnosis. Energy Convers. Manag. 270, 116254. doi:10.1016/j.enconman.2022.116254
Guo, J., Zhu, D., Wu, X., and Yan, Y. (2017). Study on environment performance evaluation and regional differences of strictly-environmental-monitored cities in China. Sustainability 9 (12), 2094. doi:10.3390/su9122094
Hoechle, D. (2007). Robust standard errors for panel regressions with cross-sectional dependence. Stata J. 7 (3), 281–312. doi:10.1177/1536867X0700700301
Ji, Z., Zou, S., Zhang, W., Song, F., Yuan, T., and Xu, B. (2024). Optimizing zoning for ecological management in alpine region by combining ecosystem service supply and demand with ecosystem resilience. J. Environ. Manage. 365, 121508. doi:10.1016/j.jenvman.2024.121508
Jo, J.-H., Choi, M., Kweon, D., Son, Y.-G., and Lim, E. M. (2024). Regulating ecosystem services in a local forest: navigating supply, trade-offs, and synergies. Trees For. People 15, 100466. doi:10.1016/j.tfp.2023.100466
Jorge-García, D., and Estruch-Guitart, V. (2022). Comparative analysis between AHP and ANP in prioritization of ecosystem services - a case study in a rice field area raised in the Guadalquivir Marshes (Spain). Ecol. Inf. 70, 101739. doi:10.1016/j.ecoinf.2022.101739
Kim, I., Lee, J., and Kwon, H. (2021). Participatory ecosystem service assessment to enhance environmental decision-making in a border city of South Korea. Ecosyst. Serv. 51, 101337. doi:10.1016/j.ecoser.2021.101337
Kokangül, A., Polat, U., and Dağsuyu, C. (2017). A new approximation for risk assessment using the AHP and fine kinney methodologies. Saf. Sci. 91, 24–32. doi:10.1016/j.ssci.2016.07.015
Kou, L., Wang, X., Wang, H., Wang, X., and Hou, Y. (2024). Spatiotemporal analysis of ecological benefits coupling remote sensing ecological Index and ecosystem services Index. Ecol. Indic. 166, 112420. doi:10.1016/j.ecolind.2024.112420
Lind, N. (2019). A development of the human development Index. Soc. Indic. Res. 146 (3), 409–423. doi:10.1007/s11205-019-02133-9
Lu, M., Zhao, Q., Ding, S., Wang, S., Hong, Z., Jing, Y., et al. (2022). Hydro-geomorphological characteristics in response to the water-sediment regulation scheme of the Xiaolangdi dam in the lower Yellow River. J. Clean. Prod. 335, 130324. doi:10.1016/j.jclepro.2021.130324
Peng, K., Jiang, W., Ling, Z., Hou, P., and Deng, Y. (2021). Evaluating the potential impacts of land use changes on ecosystem service value under multiple scenarios in support of SDG reporting: a case study of the Wuhan urban agglomeration. J. Clean. Prod. 307, 127321. doi:10.1016/j.jclepro.2021.127321
Pinar, M. (2022). Sensitivity of environmental performance Index based on stochastic dominance. J. Environ. Manage. 310, 114767. doi:10.1016/j.jenvman.2022.114767
Qin, P., Sun, B., Li, Z., Gao, Z., Li, Y., Yan, Z., et al. (2021). Estimation of grassland carrying capacity by applying high spatiotemporal remote sensing techniques in Zhenglan Banner, inner Mongolia, China. Sustainability 13 (6), 3123. doi:10.3390/su13063123
Salata, S., and Grillenzoni, C. (2021). A spatial evaluation of multifunctional ecosystem service networks using principal component analysis: a case of study in Turin, Italy. Ecol. Indic. 127, 107758. doi:10.1016/j.ecolind.2021.107758
Schneider, F., Kläy, A., Zimmermann, A. B., Buser, T., Ingalls, M., and Messerli, P. (2019). How can science support the 2030 Agenda for sustainable development? Four tasks to tackle the normative dimension of sustainability. Sustain. Sci. 14 (6), 1593–1604. doi:10.1007/s11625-019-00675-y
Sun, B., Tang, J., Yu, D., Song, Z., and Wang, P. (2019). Ecosystem health assessment: a PSR analysis combining AHP and FCE methods for Jiaozhou Bay, China. Ocean. Coast. Manag. 168, 41–50. doi:10.1016/j.ocecoaman.2018.10.026
Tong, H., Peng, J., Zhang, Y., Fang, T., Zhang, J., Men, Z., et al. (2021). Environmental benefit analysis of “Road-to-Rail” policy in China based on a railway Tunnel measurement. J. Clean. Prod. 316, 128227. doi:10.1016/j.jclepro.2021.128227
Xie, Z., He, L., Mao, Z., Wan, W., Song, X., Wu, Z., et al. (2024). Spatial heterogeneity of natural and socio-economic features shape that of ecosystem services. A large-scale study on the Yangtze River Economic Belt, China. Ecol. Indic. 159, 111729. doi:10.1016/j.ecolind.2024.111729
Yang, Y., Yuan, X., An, J., Su, Q., and Chen, B. (2024). Drivers of ecosystem services and their trade-offs and synergies in different land use policy zones of Shaanxi province, China. J. Clean. Prod. 452, 142077. doi:10.1016/j.jclepro.2024.142077
Yuan, S., Mei, Z., Zhu, C., Cao, R., Li, S., Yang, L., et al. (2024). Investigating the spatio-temporal interactive relationship between land use structure and ecosystem services in Urbanizing China. Ecol. Indic. 158, 111315. doi:10.1016/j.ecolind.2023.111315
Yurui, L., Xuanchang, Z., Zhi, C., Zhengjia, L., Zhi, L., and Yansui, L. (2021). Towards the progress of ecological restoration and economic development in China’s loess plateau and strategy for more sustainable development. Sci. Total Environ. 756, 143676. doi:10.1016/j.scitotenv.2020.143676
Zhai, Y., Zhai, G., Yu, Z., Lu, Z., Chen, Y., and Liu, J. (2024). Coupling coordination between urbanization and ecosystem services value in the beijing-tianjin-hebei urban agglomeration. Sustain. Cities Soc. 113, 105715. doi:10.1016/j.scs.2024.105715
Zhang, Z., Li, H., and Cao, Y. (2022). Research on the coordinated development of economic development and ecological environment of nine provinces (regions) in the Yellow River Basin. Sustainability 14 (20), 13102. doi:10.3390/su142013102
Zhang, Z., Wang, S., and Zhang, J. (2024). Spatiotemporal evolution of carbon budget and carbon compensation zoning of urban agglomerations in the Yellow River Basin. Sci. Rep. 14 (1), 17984. doi:10.1038/s41598-024-68614-1
Zhang, Z., Zhang, J., Liu, L., Gong, J., Li, J., and Kang, L. (2023). Spatial–temporal heterogeneity of urbanization and ecosystem services in the Yellow River Basin. Sustainability 15, 3113. doi:10.3390/su15043113
Zhou, J., Wu, J., and Gong, Y. (2020). Valuing wetland ecosystem services based on benefit transfer: a meta-analysis of China wetland studies. J. Clean. Prod. 276, 122988. doi:10.1016/j.jclepro.2020.122988
Keywords: ecosystem services, sustainable development, regional coordination, mechanisms of influence, Yellow River Basin
Citation: Jia H, Wang T, Liang P, Zhang J and Zhang R (2025) Critical evaluation on the ecosystem service levels of provincial capital cities along the Yellow River Basin. Front. Environ. Sci. 13:1554157. doi: 10.3389/fenvs.2025.1554157
Received: 01 January 2025; Accepted: 07 April 2025;
Published: 22 April 2025.
Edited by:
Tianjiao Feng, Beijing Forestry University, ChinaReviewed by:
Weifeng Gong, Qufu Normal University, ChinaYaohui Liu, Shandong Jianzhu University, China
Copyright © 2025 Jia, Wang, Liang, Zhang and Zhang. This is an open-access article distributed under the terms of the Creative Commons Attribution License (CC BY). The use, distribution or reproduction in other forums is permitted, provided the original author(s) and the copyright owner(s) are credited and that the original publication in this journal is cited, in accordance with accepted academic practice. No use, distribution or reproduction is permitted which does not comply with these terms.
*Correspondence: Jianxun Zhang, emhhbmdqaWFueHVuQHFodS5lZHUuY24=; Runhao Zhang, NTA1NTU1MjE2QHFxLmNvbQ==