 Shuaifeng Yuan
 Xiaoyang Zhang2
- 1School of Urban Economics and Public Administration, Capital University of Economics and Business, Beijing, China
- 2Handan University, Handan, Hebei, China
- 3College of Environment, Beijing Normal University, Beijing, China
- 4Capital University of Economics and Business, Beijing, China
Introduction: This study investigates the impact of the digital economy on the carbon emission efficiency of 282 prefecture-level cities in China from 2008 to 2020.
Methods: This study used two-way fixed panel model, moderated effects model, CCR-SBM model and spatial Durbin model.
Results: There is an obvious “U”-shaped relationship between the digital economy and carbon emission efficiency, with a linear coefficient of −0.320. In addition, the Dig data shows a substantial inflection point at 2.62, thus confirming the obvious correlation between the digital economy and carbon emission efficiency. After conducting a series of robustness tests (including endogeneity tests and alternative model specifications), the model was found to show consistent positive correlation. The results of the mechanism tests suggest that human capital reinforces the positive impact of the digital economy on carbon emission efficiency by accelerating the inflection point of the U-curve. In addition, the digital economy has been shown to enhance carbon emission efficiency through industrial structural transformation and marketization. Heterogeneity analysis shows that regional location, city size and characteristics influence this effect.
Discussion: The results of the study, provide insights into the green, low-carbon and high-quality development of Chinese cities.
1 Introduction
China’s rapid economic development, historically fueled by high carbon emissions, has brought substantial growth but also significant environmental challenges, including excessive energy consumption and high emissions. Industry, the cornerstone of China’s economic expansion, remains a primary source of carbon emissions and plays a pivotal role in addressing the country’s dual-carbon targets (carbon peak and carbon neutrality). However, the current industrial model faces numerous constraints due to the evolving international economic landscape, particularly with pressures from shifting global labor divisions and China’s ambition to meet its environmental goals. Despite the strides made in economic development, China now faces a paradox: a tendency toward premature de-industrialization. This trend, often referred to as “Baumol’s Disease” (Baumol, 1967), arises from the increasing proportion of the service sector, which contributes to a decline in Total Factor Productivity (TFP), a reduction in economic efficiency, and a slowdown in economic growth. The industrialization level in China has yet to align with that of high-income countries, with many manufacturing enterprises struggling to optimize resource allocation efficiency and bolster the resilience of industrial supply chains. In this context, the digital economy emerges as a powerful tool for addressing these challenges. By harnessing technology and data, the digital economy represents a shift from traditional growth paradigms. The unique characteristics of digital technologies—such as non-consumptive data elements and increasing marginal benefits—have fundamentally transformed the production function and the economic development model (McAfee and Brynjolfsson, 2012). Specifically, the integration of digital technologies into manufacturing has the potential to overcome the “carbon lock-in” of traditional industrial structures, creating space for carbon reductions while advancing the transition to more sustainable industrial practices (Chen and Ding, 2022). While the digital economy has the capacity to stimulate technological innovation and enhance carbon emission efficiency, its relationship with carbon reduction is not straightforward. Prior studies, such as those by (Li and Cui, 2024), suggest that digitalization can improve energy efficiency, yet it also carries risks of increased energy consumption due to expanded infrastructure and scaling of digital industries. Therefore, understanding the mechanisms by which the digital economy contributes to carbon emission efficiency—particularly in industrial upgrading and marketization—is essential for China to simultaneously achieve high-quality economic development and meet its dual-carbon goals.
The marginal contributions of this paper are as follows: firstly, the CCR-SBM model is constructed based on unintended outputs, which can be solved by linear programming and can effectively avoid the problem of mis-setting the functional form of traditional parametric methods (e.g., SFA). The traditional CCR model is predicated on the adjustment of inputs and outputs according to predetermined ratios. In contrast, the SBM model permits the optimisation of different indicators at different ratios, thereby circumventing the restriction of radial assumption inherent to the traditional CCR model. This is achieved by introducing the slack variable mechanism of the SBM. This feature renders the system particularly well-suited to scenarios involving the measurement of carbon emission efficiency, where outcomes are not anticipated. Secondly, the non-linear characteristics of the impact of the digital economy on carbon emission efficiency through the energy rebound effect are analysed. The aim of this analysis is to dialectically view the systematic impact of the digital economy on carbon emission efficiency from a multi-dimensional perspective. Thirdly, human capital is examined as a moderating effect of the digital economy on carbon emission efficiency, which highlights the important impact of human capital on the digital economy. Fourthly, both carbon emissions and the digital economy exhibit pronounced spatial characteristics. Therefore, the research strategy adopted in this study includes the replacement of the spatial weight matrix with a geographic distance spatial weight matrix, an economic distance spatial weight matrix, and a geographic-economic nested spatial weight matrix. Figure 1 shows the theoretical framework of the study.
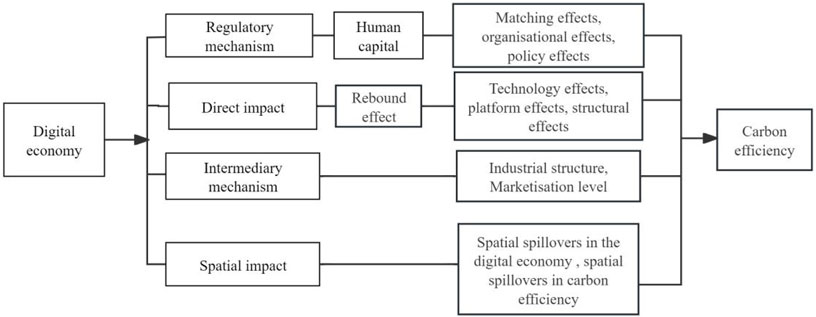
Figure 1. Research design framework.
The rest of this paper is arranged as follows: the second part is the literature review; the third part explains the theoretical mechanism and proposes the research hypothesis; the fourth part is the research design, introduces the construction of data, model and main indicators; the fifth part is empirical analysis; the sixth part is further analysis; and the seventh part is the conclusion and policy suggestion.
2 Literature review
In recent decades, a substantial corpus of literature has examined the manner in which diverse factors, including technological progress, industrial structure and energy efficiency, contribute to carbon emission efficiency. In recent years, the concept of the digital economy has attracted mounting attention due to its capacity to transform conventional economic structures, stimulate innovation, and address pressing global challenges, such as climate change (Kovacikova and Janoskova, 2021; Zhang and Lyu, 2022). As technological advances continue to accelerate, there is an increasing discourse surrounding the potential of the digital economy to influence carbon efficiency and promote sustainable development (Liu and Dong, 2024). A number of scholars have investigated the capacity of the digital economy to catalyse industrial transformation and promote green economic development. On the one hand, technological innovation driven by digital platforms is regarded as a pivotal factor in achieving green growth. Digitalisation has precipitated a transition in industry, moving from labour- and capital-intensive models to technology- and green-intensive models (Brynjolfsson and Hitt, 2000). This transition holds the potential to enhance the efficiency of resource allocation, thereby contributing to the development of a low-carbon economy. This enhancement can be achieved through the augmentation of industrial productivity and the reduction of waste (Zhang, 2010; Yang and Zhao, 2019). Conversely, technological advancements are frequently identified as a pivotal catalyst for carbon mitigation (Khurshid and Fiaz, 2022). Innovations in energy-efficient technologies, renewable energy sources, and production processes have the potential to substantially reduce the carbon intensity of production (Napp and Gambhir, 2014; Jahanger et al., 2023). As companies adopt digital tools, they can improve production processes, optimise supply chains and reduce the carbon footprint of manufacturing (Kamble and Gunasekaran, 2022; Camel and Belhadi, 2024).
The role of green technological innovation in the construction of low-carbon cities has been explored by some scholars, particularly with regard to the increase in the number of green patents to measure the level of technological innovation (Du and Antunes, 2022; Dilanchiev and Urinov, 2024). Research has indicated that the transition from traditional carbon-intensive industries to knowledge-based and service industries has the potential to reduce the overall carbon footprint of an economy (Li and Chen, 2024; Zhao, 2024). It has been demonstrated by other studies that the effects of carbon-reducing technology and industry transfers may be subject to variation depending on geographic location and level of economic development (Lee and Zhao, 2023; Tan and Wei, 2024). Industrialised regions may encounter greater challenges in reducing emissions due to the higher carbon intensity of existing infrastructure, whereas regions with higher levels of digital integration may witness faster improvements in carbon efficiency due to the adoption of low-carbon technologies (Ding and Li, 2017; Jiang and Purohit, 2023). Nevertheless, concerns have been raised that the rapid growth of the digital economy could inadvertently lead to an increase in carbon emissions. A plethora of studies have underscored the potential rebound effect of digitisation (Roussilhe and Ligozat, 2023; Peng and Qin, 2024), whereby the augmentation of digital infrastructure may precipitate an escalation in energy consumption, consequent to the proliferation of digital business, culminating in an escalation in carbon emissions in the short term (Lange and Pohl, 2020). The development of large-scale digital infrastructure and the subsequent increase in internet penetration have the potential to result in elevated levels of energy consumption, particularly in the initial phases of digital transformation (Kim and Sovacool, 2024; Yang and Lin, 2023). As companies expand their operations, the energy demand associated with digital technologies may exceed the short-term carbon reductions achieved through operational efficiencies (Lu and Li, 2024). The aforementioned conflicting views underscore the necessity for a more nuanced study of the timing and conditions under which the digital economy delivers tangible carbon reductions (Ren and Hao, 2021).
A review of the extant literature suggests that the majority of studies have employed one-way efficiency measures in the selection of CO2 indicators. This a priori assumption of unidirectional causality between ‘output’ and ‘carbon emissions’ may result in a biased understanding of the relationship between the two. Secondly, an analysis of existing studies reveals a lack of consensus in the findings, which are dispersed and lack the regularity of analysing the impact of the digital economy on carbon emission efficiency from a dynamic perspective. In comparison with alternative economic structures, the relationship between the digital economy and human capital is more intricate, and the impact of human capital on the digital economy and carbon emission efficiency merits meticulous examination. It is evident that the extant literature on this subject scarcely considers the spatial dynamic relationship between the digital economy and carbon emissions.
3 Theoretical analysis and hypothesis
This section delineates the mechanisms through which the digital economy impacts carbon emission efficiency. The development of hypotheses is informed by pertinent theoretical frameworks, with the objective of investigating the mediating influence of industrial structure and marketisation, in conjunction with the moderating effect of human capital. These hypotheses are founded upon established theoretical frameworks, including endogenous growth theory, diffusion of innovation theory, and the environmental Kuznets curve (EKC). The Environmental Kuznets Curve (EKC) posits that pollution and carbon emissions tend to increase as an economy industrialises. However, it is subsequently argued that after a certain level of development, further industrial progress and technological innovation leads to a reduction in emissions (Grossman and Krueger, 1992). The theoretical framework posits the existence of a non-linear U-shaped relationship between the development of the digital economy and carbon emission efficiency. In its nascent stages, the digital economy is characterised by an increase in energy consumption, attributable to the expansion of digital infrastructure and business activities. This phenomenon aligns with the Jevons Paradox, a theoretical concept positing that efficiency-enhancing technological advancements may result in an overall escalation in energy consumption, thereby nullifying the initial carbon emission reductions (Polimeni and Polimeni, 2006). However, as digital technologies mature and industries integrate more efficient processes, there will be a concomitant improvement in carbon efficiency. Therefore, we hypothesize that:
Hypothesis 1. There is a “U” shaped relationship between the development of the digital economy and carbon emission efficiency, i.e., early digital expansion increases emissions and reduces carbon emission efficiency, but after a certain threshold is reached, digital progress reduces emissions and increases carbon emission efficiency.
Human capital, defined as the skills, knowledge, and capabilities of a population, plays a central role in economic development and technological progress. Endogenous Growth Theory emphasizes the importance of human capital in fostering innovation and improving productivity, which directly influences environmental outcomes. In the context of the digital economy, human capital enables more effective adoption and implementation of digital technologies, fostering efficiency gains that enhance carbon emission efficiency. The role of human capital in enhancing the positive effects of digital economy development is crucial. Skilled workers contribute to technological innovation, green technologies, and effective policy implementation, thus accelerating the transition to more sustainable industrial practices. Given this relationship, we propose the following hypothesis:
Hypothesis 2. Human capital moderates the relationship between digital economy development and carbon emission efficiency, such that higher levels of human capital strengthen the positive impact of the digital economy on carbon emission efficiency.
As the digital economy evolves, it influences the structure of industries, shifting from traditional, resource-intensive industries to more knowledge-based and technology-intensive sectors. According to the Theory of Structural Change (Clark, 1940), economic development often leads to shifts in industrial structure, which can reduce carbon emissions by promoting less resource-heavy industries. Industrial upgrading, driven by digital technologies, can improve energy efficiency and reduce carbon intensity, thus acting as a key mediator in the relationship between digital economy and carbon emission efficiency. As digital technologies drive innovation in the industrial sector, they enable the transition to low-carbon production processes and products, optimizing energy use and reducing emissions. Therefore, we hypothesize that:
Hypothesis 3. Industrial structure upgrading mediates the relationship between the digital economy and carbon emission efficiency, such that the digital economy enhances carbon efficiency through the transformation of industrial structures.
Market-oriented reforms are crucial for achieving economic efficiency and promoting environmental sustainability. Marketization Theory (Dewatripont and Tirole, 2012) posits that increased market integration leads to better resource allocation and incentivizes businesses to adopt more efficient and environmentally friendly technologies. In the digital economy, enhanced market competition and transparency can foster the adoption of green technologies and improve the carbon emission efficiency of firms. As markets become more competitive, firms are incentivized to adopt energy-efficient and low-carbon technologies to reduce operational costs and meet consumer demand for sustainable products. Thus, the extent of marketization can amplify the benefits of digital economy development on carbon efficiency. Based on this, we propose the following hypothesis:
Hypothesis 4. Marketization enhances the relationship between digital economy development and carbon emission efficiency, such that higher levels of marketization strengthen the positive effect of the digital economy on carbon emission efficiency.
Spatial Econometrics and Regional Innovation Theory (Feldman and Audretsch, 1999) suggest that economic development in one region can have spillover effects on neighboring regions, especially in terms of technological innovation and environmental outcomes. The digital economy has the potential to foster regional integration, creating a digital innovation ecosystem that enables the diffusion of sustainable technologies and practices across borders. Regions with advanced digital infrastructure can act as innovation hubs, transferring knowledge, technologies, and best practices to nearby areas, thus enhancing their carbon emission efficiency. Given this, we hypothesize:
Hypothesis 5. The impact of the digital economy on carbon emission efficiency exhibits significant spatial spillover effects, such that regions with more advanced digital economies positively influence the carbon efficiency of neighboring regions.
4 Study design
Considering the completeness and availability of the data this paper selects 282 prefecture-level cities and above in China from 2008 to 2020 as the research objects, and the data selected in this paper, except for the digital financial inclusion index, mainly come from China Statistical Yearbook, China Urban Statistical Yearbook, China Demographic Statistical Yearbook, China Science and Technology Statistical Yearbook, and some provincial and municipal statistical yearbooks, and the small amount of missing data is compensated by the moving average method and linear interpolation method. data are compensated by moving average method and linear interpolation method. In this study, the moving average method and linear interpolation are used to make up for the small amount of missing data.
4.1 Dependent variable: Carbon Emission efficiency
Carbon emission efficiency will be measured as the ratio of economic output (GDP) to total carbon emissions:
Where: GDP represents the economic output of a region, adjusted for inflation using constant prices (2008 base year), Total Carbon Emissions represents the emissions of CO2 and other greenhouse gases in the region, measured in tons, The SBM-DEA model will be used to capture the inefficiencies in both carbon emissions and economic output. It allows for the detection of both input slacks (excess carbon emissions) and output slacks (inefficiencies in producing economic output).
In Equation 2,
The traditional DEA method is easy to overestimate the actual efficiency value, compared with the single carbon productivity indicator, using the SBM model that incorporates unintended outputs such as environmental pollution to measure carbon emission efficiency can reflect the quality of economic development in a more comprehensive way, and can more accurately estimate whether the economic development mode is in line with energy saving, emission reduction, and green growth.The CCR model can calculate the resource allocation efficiency oriented by the ratio of inputs to outputs in the case of constant returns to scale, i.e., in the optimal state. The CCR model can calculate the input and output oriented resource allocation efficiency under constant returns to scale, and under this assumption, DMU achieves scale efficiency efficiency, i.e., in the optimal state, and the measured efficiency is the total technical efficiency. Therefore, this paper adopts the CCR-SBM model in which the slack degree variables of inputs and outputs are variable according to the incremental condition and incorporate the CCR-SBM model that includes non-desired outputs to measure the carbon emission efficiency (eff_
When it reaches its optimal value, the constraints of the SBM model are converted to the CCR model and the slack variables are re-specified, and the SBM model adds a constraint to this assumption as shown in Equation 4.
The indicator system consists of two components, the first being the input component, which consists of capital, labour and energy. The capital stock in the ‘perpetual inventory method’ is used as an indicator of capital input to calculate the input of capital factors. Taking 2008 as the base period, dividing the gross fixed capital formation of the base year by 10% as the initial capital stock of the city, with an annual depreciation rate of 9.6%, the data for the period of 2008–2020 are measured, and then the obtained data are uniformly adjusted to the corresponding value with 2008 as the base period, which is deflated to obtain the capital factor input. The annual depreciation rate is 9.6%, the data for the period 2008–2020 are measured, and then the obtained data are uniformly adjusted to the corresponding value with 2008 as the base period, and the level of capital input is obtained by deflating the level of capital input in billions of yuan, and the capital stock is calculated as shown in Equation 5:
where,
Since the statistics of labour variables are affected by a variety of factors such as the quality and type of labour, and the standard is difficult to be unified, this paper adopts the method in most of the literature, and chooses to use the number of current employment (the sum of the number of employees in the primary, secondary and tertiary industries) in each prefecture-level city to characterize the input of labour factors, in ten thousand people. The total energy consumption data of each province and municipal area from 2008 to 2020 is used as an indicator of energy input, and the total electricity consumption of the whole society (10,000 kWh) is used to measure the energy factor.
The second is the output part, including desired output and non-desired output. Although many scholars have different views on the output indicator of carbon emission, GDP is mostly used as the indicator to measure the economic output of a region. In this paper, the desired output level is based on the nominal GDP (billion yuan) in 2007, and in order to exclude the influence of inflation, the nominal GDP of each city in each year is converted to get the real GDP in 2007 as the base period. The total carbon emission of prefecture-level cities is chosen as the non-desired output indicator, and the carbon emission includes the carbon emission from the direct energy consumption and that from the consumption of electric power and heat, which are included in the present study. Carbon emissions include carbon emissions from direct energy consumption and carbon emissions from electricity and heat energy consumption, and in this study, carbon emissions from liquefied petroleum gas (LPG), gas, transport and carbon emissions from electricity and heat energy consumption are added together as the total carbon emissions of each city.
4.2 Core explanatory variables: Digital economy (dig)
The development level of the digital economy will be measured using a comprehensive index constructed from four key dimensions: digital infrastructure, digital industry development, digital innovation, and digital financial inclusion. The evaluation indicator system for digital economy development, as adapted from Zhao (2010), is shown in Table 1 below. The entropy weight-TOPSIS method will be used to calculate a composite index for digital economy development.
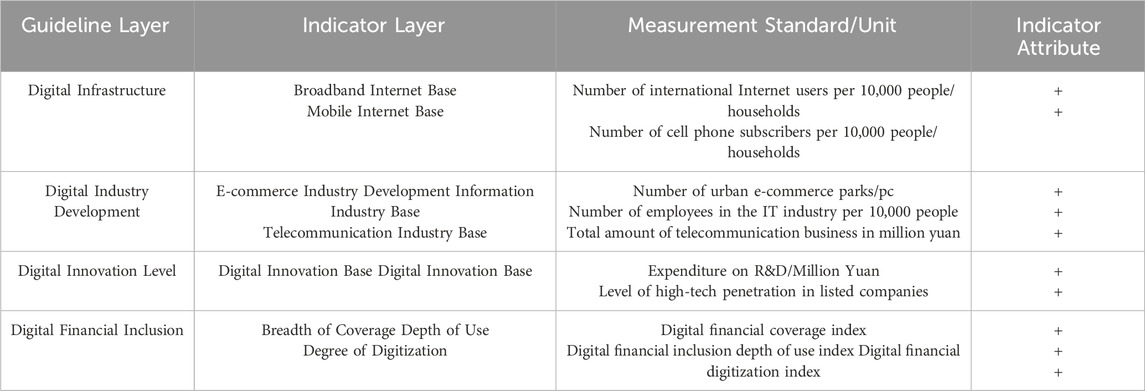
Table 1. Evaluation index system of digital economy development.
The composite index will be calculated using the entropy weighting methodology as shown in Equation 6.
Where:
4.3 Mechanism variables
(1) Marketization Level (mar):The marketization level is an important mechanism influencing carbon efficiency. It will be measured using the entropy value method, based on indicators such as market competition, regulatory environment, and financial market development:
In Equation 7 Market Competition: Measured using the Herfindahl-Hirschman Index (HHI).
Regulatory Environment: Based on indices for ease of doing business and labor market flexibility.
Financial Market Development: Measured by credit to GDP ratio.
The weights (
(2) Human Capital Level (hum): The human capital level will be measured by the share of college students as a percentage of the resident population. As shown in Equation 8:
This indicator reflects the level of education and skill within the population, which is critical for the adoption of digital technologies and for improving carbon efficiency.
(3) Industrial Structure Advanced (hsm):The industrial structure will be characterized by the ratio of the share of the tertiary industry GDP to the secondary industry GDP:
This ratio reflects the shift from more energy-intensive sectors (secondary industry) to less carbon-intensive sectors (tertiary industry), a key aspect of the transition to a more sustainable economy.
4.4 Control variables
In order to avoid bias due to omitted variables, the following control variables will be included in the analysis: Regional Per Capita GDP (pgdp): Measured by the logarithm of regional per capita GDP, adjusted for inflation using constant 2008 prices. Per Capita Research Expenditure (Rd): Measured by the portion of local fiscal expenditure on research and education in the current year, expressed in ten thousand yuan. Environmental Regulation (env): Measured by the ratio of completed investment in industrial pollution control to the value added of the secondary industry. Transportation Infrastructure (roa): Measured by the ratio of the area of urban roads in the region to the average area of roads in each city. Energy structure (es):Represents the proportion of energy consumption from clean and non-clean sources. Foreign direct investment (FDI):Reflects the impact of foreign investment on the region’s economy. Financial development (fin_dev):Indicates the level of development in the financial market. Telecommunications business per million people (Tbmp):Indicates the level of digital infrastructure.
4.5 Efficiency measurement
The SBM-DEA model will be used to measure carbon emission efficiency, capturing inefficiencies in carbon emissions relative to economic output. This model simultaneously considers input and output slacks, allowing for a more nuanced measurement of efficiency.
4.6 Spatial Econometrics model
Given that digital economy development can have spatial spillover effects, a Spatial Durbin Model (SDM) will be employed to account for both direct and indirect effects across neighboring regions:
Where:
Endogeneity: To address potential endogeneity between the digital economy and carbon efficiency, instrumental variables (IV) will be used. An appropriate instrument, such as distance from the coastline, will be employed for digital economy development.
4.7 Sample selection and data sources
Considering the completeness and availability of the data, this paper selects 282 prefecture-level cities and above in China from 2008 to 2020 as the research object, and the data are mainly obtained from China Statistical Yearbook, China Demographic Statistical Yearbook, China Energy Statistical Yearbook, and some provincial and municipal statistical yearbooks, and combined with the Digital Inclusive Finance Index (2011) compiled by Peking University and Ant Financial Services. (2011–2020). Some missing data are made up using the moving average method and linear interpolation method.
5 Empirical analysis
5.1 Descriptive statistics of different variables
In Table 2, referring to Tone’s method (Tone, 2001), we measures the crs_sbm and ebm of carbon emission efficiency (eff_
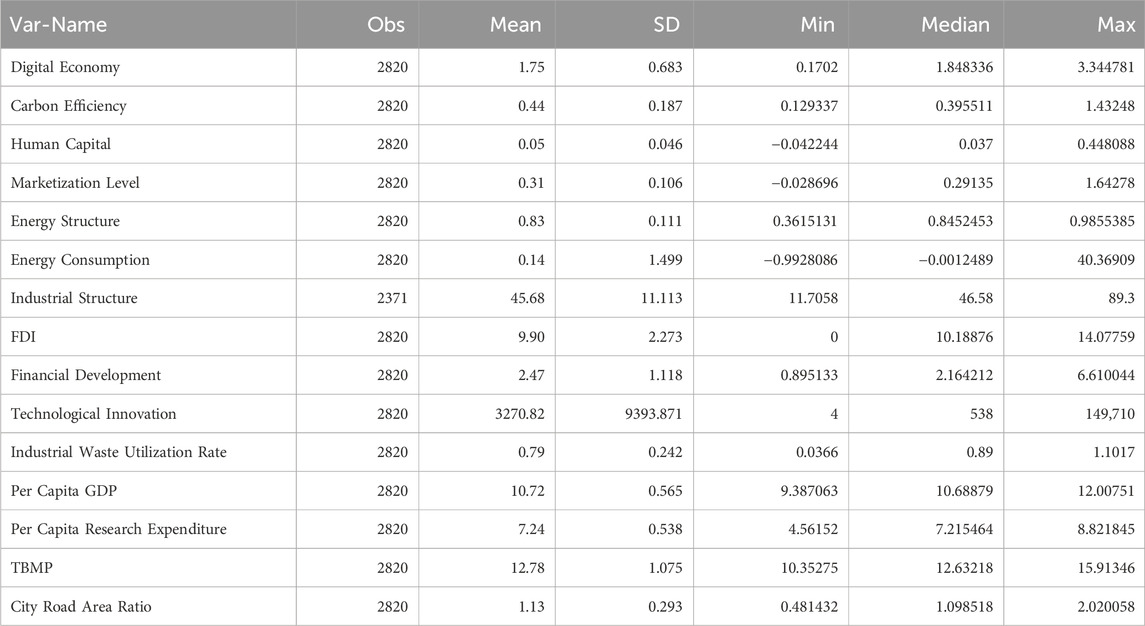
Table 2. Descriptive statistical analysis of different variables.
5.2 Benchmark regression results
This study uses the Environmental Benchmarking Model (EBM) to measure carbon emission efficiency, comparing regions to best practice benchmarks. The EBM values reflect each region’s efficiency relative to environmental best practices. Following the analytical approach of (Arenius, 2011), high-dimensional fixed and mixed effects are applied to Equation 1, with the baseline regression results shown in Table 3. Column (1) reveals a significant inverted U-shaped relationship between the digital economy (dig) and carbon emission efficiency, with a coefficient of 0.095 at the 1% significance level. When the quadratic term for the digital economy is added, the results confirm a non-linear relationship, indicating that in the early stages of digital economy development, economic growth leads to higher carbon emissions, as the effect of technological emission reduction is less than the emissions increase. However, as the digital economy matures, technological advancements in emission reduction and energy efficiency lead to improved carbon emission efficiency. Column (4) further supports this inverted U-shaped relationship. The negative coefficient for the linear term (dig) and the positive coefficient for the quadratic term (dig2) suggest that in the early stages of digital economy development, carbon emissions initially increase. However, once a certain threshold is reached, further development of the digital economy enhances carbon efficiency through energy optimization, industrial upgrades, and reduced waste. This aligns with the Jevons Paradox, where early improvements in energy efficiency can increase overall consumption, but over time, these advancements result in greater efficiency and lower emissions. The results remain robust even after incorporating control variables, further supporting the inverted U-shaped hypothesis (H1) that digital economy development improves carbon emission efficiency only beyond a certain threshold. Per capita research expenditure, regional GDP, and environmental regulation all show significant positive relationships with carbon emission efficiency. However, the transportation infrastructure variable did not significantly impact carbon efficiency, suggesting that while regional economic strength is crucial, infrastructure alone may not drive improvements in emission efficiency.
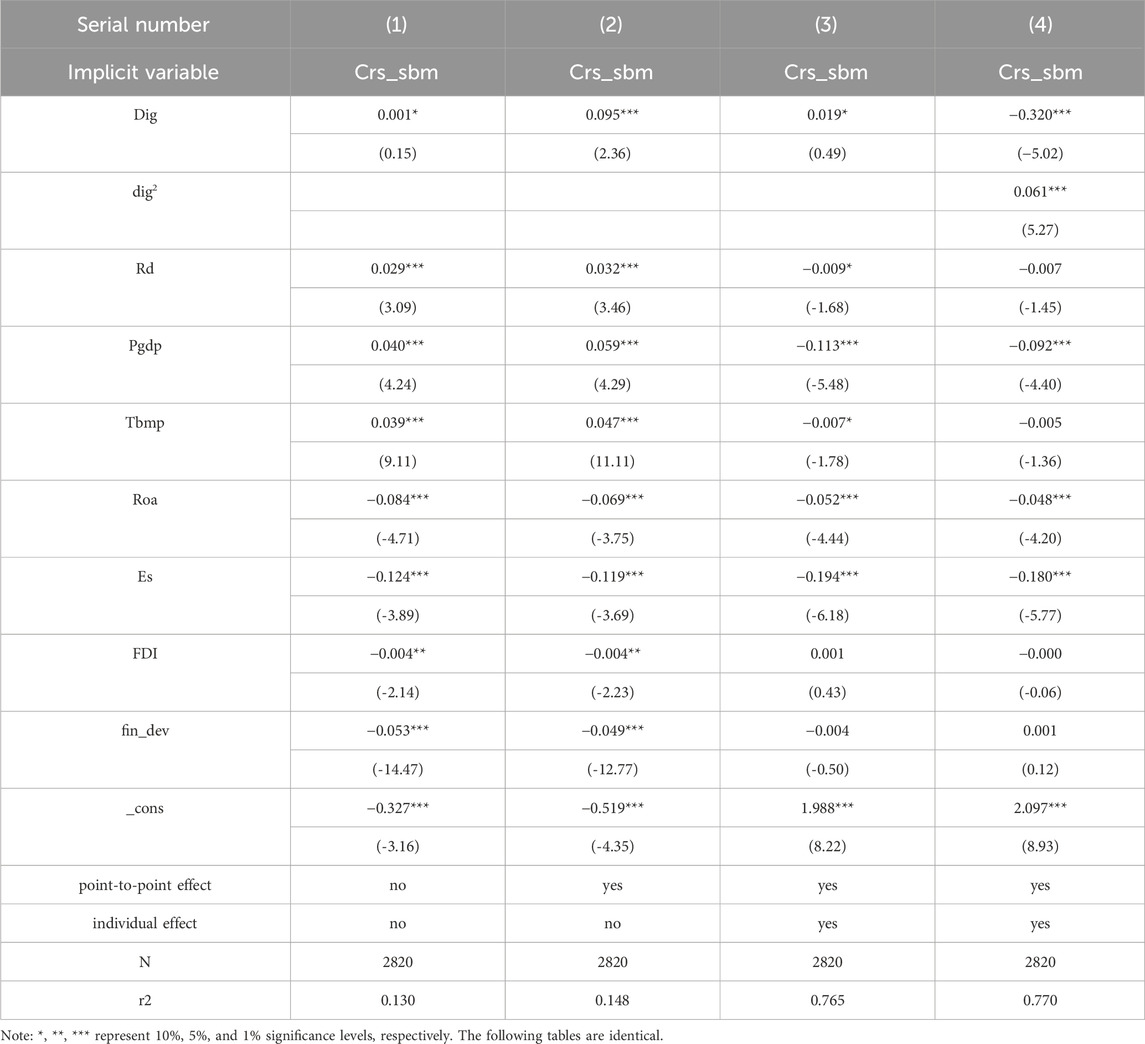
Table 3. Baseline regression.
In this study, in order to analyze the spatial effect of the digital economy on the impact of carbon emission efficiency, four types of weight matrices, namely, geographic distance inverse, economic distance, and composite and transportation matrices, are used to in the regression Equation 4. The results, as shown in Table 4, show a positive effect in all four types of weight matrices, with coefficients of 0.555, 0.270, 0.590 and 0.021, respectively. The effect is significant in the geographic inverse and composite matrix models. The spatial lag term coefficients indicate that the level of digital economy development of neighboring cities has a robust and significant positive spillover effect on the carbon emission efficiency of the city, especially in the economic distance and the composite matrix model, with the most significant effect, with coefficients of 2.856 and 1.237, respectively. The spatial autocorrelation coefficients are significant in all the models, which indicates that there is significant spatial correlation of the carbon emission efficiency among the cities. The highest spatial autocorrelation coefficient in the transportation matrix model is 0.459, indicating that the transportation network has a significant effect on the spatial connection between cities. The coefficients of both direct and indirect effects are significant, indicating that the impact of the digital economy on carbon emission efficiency is a cumulative result of the direct effect and the indirect effect through spatial spillover effects.
Table 4. Spatial measurement regression.
Geographic proximity plays a key role in knowledge dissemination, infrastructure sharing and local policy spillovers. The geographic proximity matrix (inverse distance) is best suited to capture direct, localized spillovers from digital economy development between physical neighborhoods. The economic proximity matrix is used to model the spillover effects of the digital economy, as carbon efficiency gains are mainly propagated through economic linkages. Based on the focus of this study on carbon efficiency and digital economy spillovers between Chinese cities, the most appropriate choice depends on whether the spillovers are caused by physical proximity or economic integration. The spillovers in this study are mainly due to economic linkages, trade and digital industry clusters that transcend geographic constraints. Carbon efficiency gains are mainly transmitted through economic linkages (trade, industry transfers and investment flows), and the economic distance matrix is more relevant, so it is used to model the spillovers from the digital economy.
5.3 Endogeneity and robustness tests
Endogeneity concerns are addressed by considering potential bidirectional causality or omitted variable bias, which may affect the robustness of the findings. To mitigate these concerns, we conduct endogeneity tests by using instrumental variables and fixed effects models. In Table 5, the regression results across all models show a statistically significant relationship between digital economy (dig) and carbon emission efficiency (Crs_sbm). Specifically, in columns (2) and (5), the coefficient for dig was 0.337* (at the 1% significance level) and 0.367 (at the 5% significance level), indicating a positive effect of digital economy development on carbon emission efficiency. However, in column (6), the coefficient for dig was negative (−0.323***), suggesting that in certain stages, the expansion of the digital economy initially leads to a reduction in carbon emission efficiency. This finding aligns with the Jevons Paradox, where technological advancements might initially increase energy consumption before contributing to efficiency gains in the long run. Multiple control variables were included in the analysis to account for potential confounding factors. The regression results of key control variables such as per capita GDP (pgdp), per capita research expenditure (Rd), telecommunications business per million people (Tbmp), transportation infrastructure (roa), energy structure (es), foreign direct investment (FDI), and financial development (fin_dev) indicate significant relationships with carbon emission efficiency. Per capita GDP (pgdp) was positively and significantly associated with carbon emission efficiency across several models, indicating that higher economic development levels are linked to improved carbon emission performance. Similarly, energy structure (es) and foreign direct investment (FDI) exhibited a negative relationship with carbon efficiency, suggesting that higher reliance on non-clean energy and increased foreign investment may contribute to higher emissions.
Table 5. Endogeneity test.
To address potential endogeneity, we utilized instrumental variables, specifically minimum distance to optic cities (MinDist_to_OpticCities) and spatial distance to Hangzhou (SphDist_to_Hangzhou). The results from these instruments show that MinDist_to_OpticCities had a positive and significant coefficient (0.039*), indicating that proximity to digital infrastructure (i.e., optic cities) is positively correlated with improved carbon emission efficiency. In contrast, SphDist_to_Hangzhou showed a negative coefficient (−0.045***), suggesting that greater spatial distance from Hangzhou is associated with lower carbon emission efficiency. To further ensure the reliability of our results, we conducted robustness checks, which confirmed the stability of the relationships. Per capita research expenditure (Rd) and regional GDP (pgdp) consistently showed significant positive relationships with carbon emission efficiency. Additionally, environmental regulation (es) and foreign direct investment (FDI) remained significant predictors of carbon efficiency. The transportation infrastructure variable (roa), however, did not exhibit a significant effect, suggesting that while economic strength is crucial, infrastructure alone may not drive improvements in emission efficiency.The endogeneity analysis in this study, through the use of instrumental variables and robustness checks, supports the relationship between digital economy development and carbon emission efficiency. While early stages of digital economy expansion may temporarily lead to increased emissions due to infrastructure expansion and digital industry scaling, over time, technological advancements in energy optimization and industrial upgrades lead to greater carbon efficiency. Furthermore, the control variables revealed complex effects of economic development, energy structure, and foreign investment on carbon efficiency. Overall, the impact of digital economy development on carbon emission efficiency is dynamic, mediated by several factors, and exhibits a non-linear relationship that changes as digital technologies mature and industrial structures transition.
Another important consideration is potential spatial endogeneity, which was not addressed in the original analysis. If unobserved factors such as regional policies or external economic influences affect more than one region at the same time, there may be spatial effects that can lead to correlated errors. Failure to account for spatial dependence may distort the results, as neighboring regions may exhibit similar trends in digital economy development and carbon emission efficiency. To address this issue, the study incorporates the Spatial Durbin Model (SDM) to better account for spatial interactions and improve the estimation of the relationship between the digital economy and carbon emission efficiency. Drawing on the spatial weighting matrices selected in related studies, the spatial correlation of carbon emission efficiency of 282 cities at prefecture level and above in China from 2008 to 2020 is measured under four types of weighting matrices, namely, geographic, economic, composite, and transportation matrices, using the global Moran index. As shown on Table 6 it can be seen that after 2014, the global Moran index of the four types of weight matrices passes the significance test at the 1% level, and the spatial correlation shows positive. With the global Moran index showing a continuous upward trend, the spatial spillover effect of urban carbon emission efficiency is more significant, and the mutual promotion effect is continuously strengthened, gradually appearing contiguous spatial characteristics, further confirming that the impact of the digital economy on the carbon emission efficiency has a strong spatial spillover effect. Accordingly, research hypothesis H4 is verified.
Table 6. The Moran’s I values of Urban Carbon Emission Efficiency from 2008 to 2020.
5.4 Mechanism of action analysis
5.4.1 Moderating effects of human capital
Human capital plays a leading role in the development of digital economy and promotes the progress of green technology and the advanced industrial structure, thus affecting the relationship between digital economy and carbon emission efficiency. Therefore, this paper adopts human capital as a regulating mechanism variable to analyze the impact on carbon emission efficiency, and incorporates the cross-multiplier terms of digital economy and human capital into the research model. The results, as shown in column (5) in Table 7, the cross-multiplier term of digital economy and human capital is significant at 1% level and the regression coefficient is negative, and a higher level of human capital can enhance the positive impact of digital economy on urban carbon emission efficiency. Accordingly, hypothesis H2 is verified. The increase of human capital level helps the city to form a good innovation ecosystem, promotes the increase of invention patents of scientific research institutions and social enterprises, and is conducive to taking the lead in researching and developing more advanced digital technology, energy-saving technology, new energy technology, etc., and stimulates the large-scale production and sale of scientific and technological inventions and patents through the superior market network, which provides a strong support for the enhancement of the level of the development of the digital economy and the improvement of the efficiency of carbon emissions at the macro level. Thus providing strong support for the improvement of the level of development of the digital economy and the efficiency of carbon emissions at the macro level.
Table 7. Mechanism tests.
5.4.2 Analysis of the mediating effect of industrial structure upgrading
In this paper, carbon emission efficiency (eff_
5.4.3 Analysis of the mediating effect of the level of marketization
The level of marketization can reflect the efficiency of factor marketization and allocation of a country or region in a more comprehensive way. The entropy method is used to measure the marketization level. Columns (3) and (4) in Table 7 show the test results. Column (3) tests the role of the digital economy on the level of marketization, and the coefficient is 0.869 and is significant at the 1% level, which indicates that the digital economy has a significant positive impact on the level of marketization. In the test result of column (4), the coefficient of marketization effect is 0.062 and significant at 5% statistical level, indicating that the increase in the level of marketization has a significant enhancement effect on the improvement of carbon emission efficiency. Accordingly, hypothesis H3 is verified. The reason for this is because the emergence of digital economy can guide enterprises to plan production according to market demand and market signals, reduce energy consumption and resource waste, and thus improve carbon emission efficiency.
6 Further analysis
6.1 Analysis of regional heterogeneity
This study analyzes the regional heterogeneity of the impact of the digital economy on carbon emission efficiency using a two-way fixed effects model. The approach controls for the effects of time-invariant regional characteristics and time-specific factors on the relationship between the digital economy and carbon emission efficiency, highlighting significant differences between regions. The level of regional economic development plays a key role in shaping the development of the digital economy, and as a result, improvements in carbon emission efficiency vary across regions. We divide China into four regions: eastern, northeastern, central, and western, which are categorized based on differences in their level of economic development, industrial structure, and stage of digital economy development. Specifically, the eastern region is the most economically developed, with a high degree of industrial concentration and advanced infrastructure; the northeastern region is dominated by heavy industry; the central region is undergoing economic transformation and is gradually diversifying; and the western region is lagging behind, and is still in the rapid development stage of industrialization and infrastructure construction. The analysis of regional heterogeneity reveals that the digital economy’s impact on carbon emission efficiency varies across regions in China. As shown in Table 8, in the Eastern region, with advanced infrastructure and concentrated industries, digital technology significantly improves carbon efficiency (coefficient = 48.358). In the Northeastern region, dominated by energy-intensive heavy industries, digitalization has a negative impact on carbon efficiency (coefficient = −98.147), as it may increase emissions. The Central region benefits from digitalization, which optimizes processes, reduces waste, and improves carbon efficiency (coefficient = 115.734). However, in the Western region, rapid industrialization and infrastructure development lead to higher emissions in the short term, despite digitalization’s long-term potential to improve efficiency (coefficient = −53.465). The eastern and central regions are transitioning to more advanced economic models, and digital technologies play a crucial role in enhancing carbon efficiency, especially in the digital transformation of the manufacturing sector. In contrast, the heavy industrial base in the Northeast is likely to increase emissions due to the expansion of energy-intensive industries, while the West faces higher emissions in the short term due to rapid industrialization and infrastructure development. The eastern region has larger cities, more advanced infrastructure and higher levels of urbanization, factors that are inherently captured by regional heterogeneity.
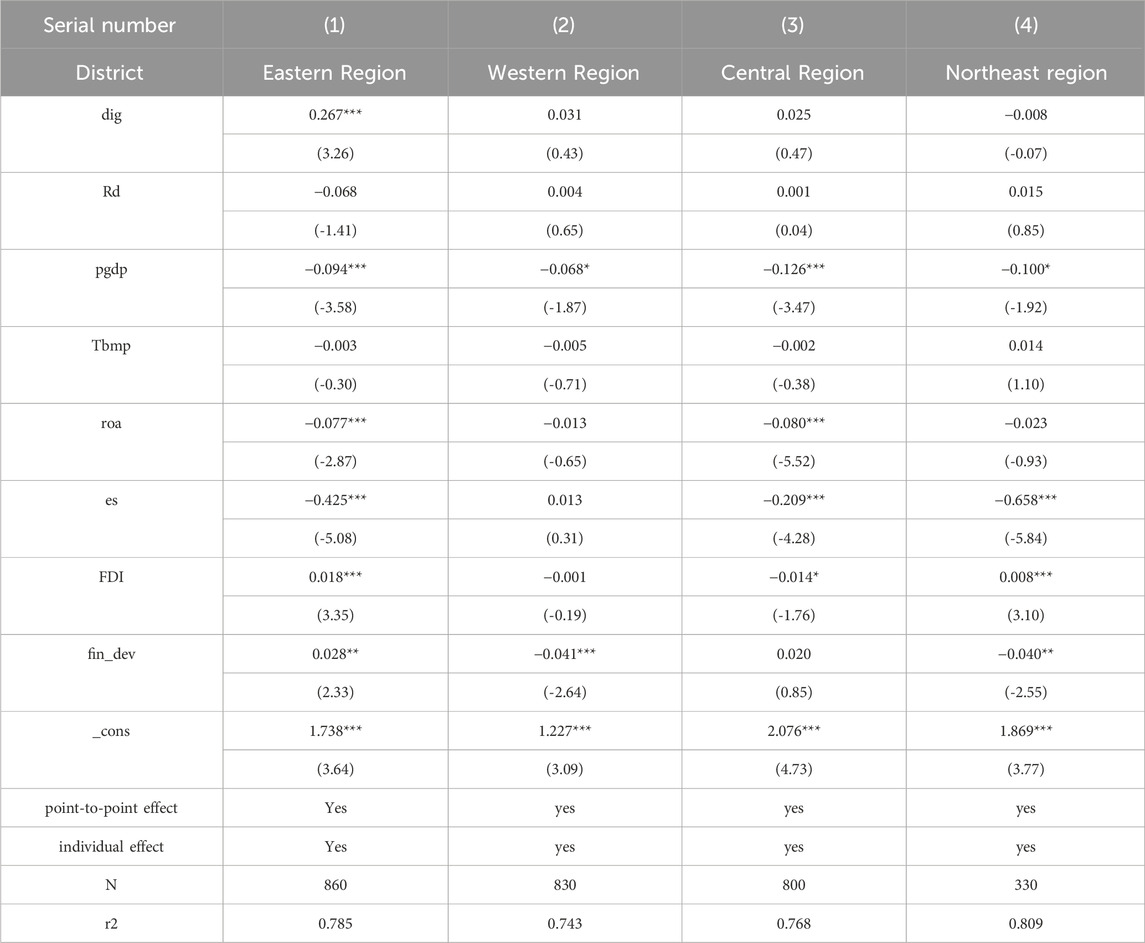
Table 8. Regional Heterogeneity1.
This analysis examines regional differences in the impact of the digital economy on carbon emission efficiency in four different regions (South, North, non-coastal and coastal). The model uses a two-way fixed effects approach to control for time-invariant regional characteristics and time-specific factors. As shown in Table 9, the Southern region is Column 1 with a coefficient of 0.065, a positive coefficient indicating that the development of the digital economy has a slight positive impact on carbon efficiency in the Southern region. Although the impact is not significant, it suggests that digital technologies play a role in improving carbon efficiency in the region. The Northern region is Column 2 with a coefficient of −0.067, a negative coefficient indicating a small but significant negative impact of the digital economy on carbon efficiency in the Northern region. This may be due to specific regional characteristics or industries that are less well optimized by digital technologies, possibly due to a reliance on energy-intensive industries. The non-coastal region is for column 3 and the coefficient is −0.029, a negative coefficient indicating that the digital economy in non-coastal regions has the least negative and non-significant impact on carbon emission efficiency. This suggests that the digital economy has less of an impact outside of coastal areas, and may even have a potentially negative impact, possibly due to slower digital adoption or more traditional industries. The coastal region is Column 4 and the coefficient is 0.209, a marginally significant positive coefficient indicating a significant positive impact of the digital economy on carbon efficiency in the coastal region. Coastal zones, with their more advanced infrastructure and higher levels of industrialization, are able to benefit more from digital technology, which contributes to carbon efficiency. The results highlight the regional heterogeneity of the impact of the digital economy on carbon emission efficiency. Coastal regions, with their higher levels of infrastructure and industrialization, benefit more significantly from digital technologies. In contrast, other regions, especially the North and non-coastal regions, show weaker or negative impacts, possibly due to a reliance on more traditional and energy-intensive industries. The South has improved, while the North, despite progress in digital technologies, still faces challenges in optimizing carbon efficiency.
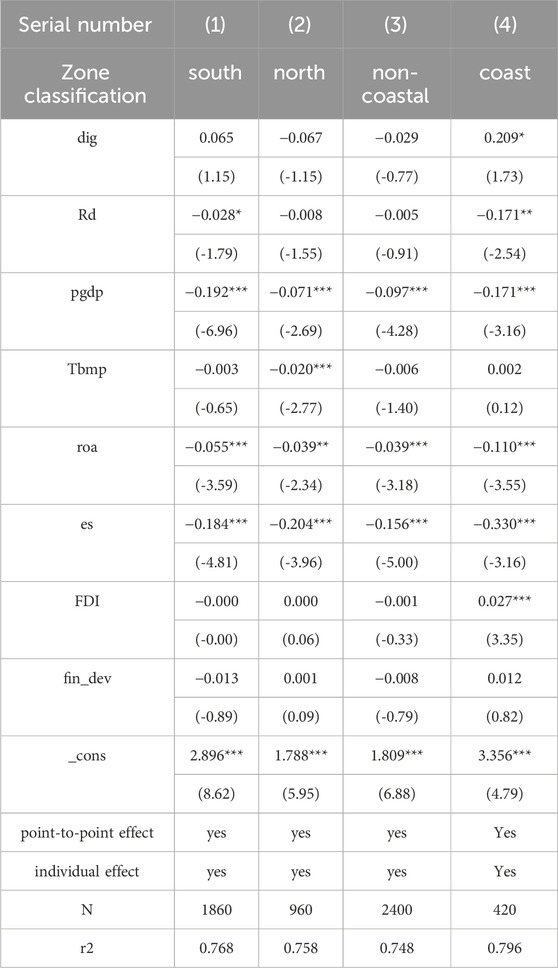
Table 9. Regional Heterogeneity2.
6.2 Analysis of the heterogeneity of city characteristics
This analysis examines the regional differences in the impact of the digital economy on carbon emission efficiency across four distinct groups: Small Cities, Large and Medium Cities, Non-Traditional Industrial Bases, and Traditional Industrial Bases. The model uses a two-way fixed effects approach to control for both time-invariant regional characteristics and time-specific factors. As shown in Table 10, the results highlight the regional heterogeneity in the impact of the digital economy on carbon emission efficiency. Large and medium cities benefit significantly from digital technologies due to their advanced infrastructure and industrial concentration. Small cities experience a slight negative impact due to slower adoption and limited resources. Non-traditional industrial bases show some positive but non-significant effects, while traditional industrial bases see no significant improvements in carbon efficiency despite digital advancements.
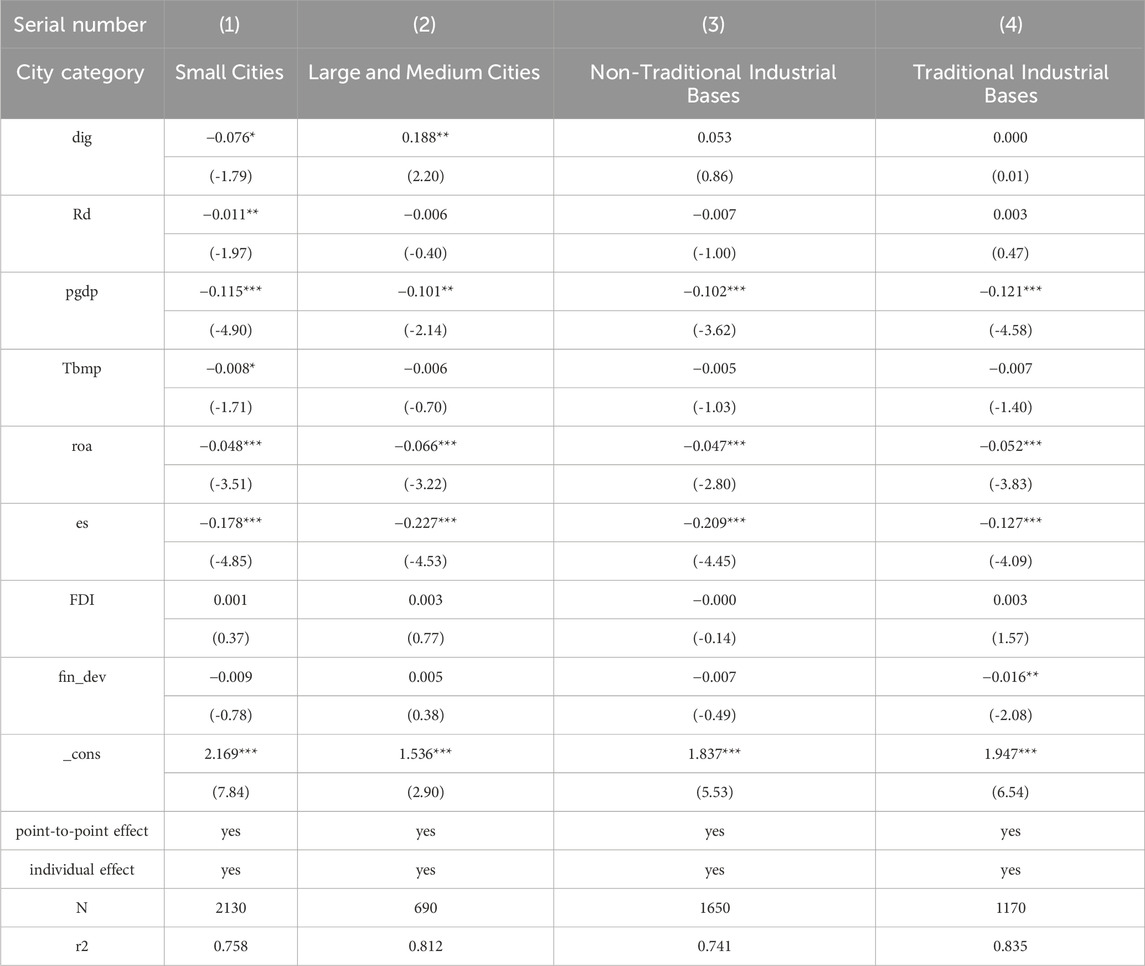
Table 10. Urban heterogeneity.
7 Discussion and policy implications
7.1 Main findings
The digital economy is a significant catalyst for achieving high-quality economic development and advancing the realisation of dual-carbon goals. This paper utilises a two-way fixed effect model and a mediation-regulation effect model to explore the dynamic evolution process, mechanism and spatial heterogeneity of the impact of the digital economy on carbon emission efficiency. The analysis is based on balanced panel data from 282 Chinese cities from 2008 to 2020. The following conclusions are drawn: Firstly, an analysis of extant evidence suggests that the development of the digital economy exerts a dual impact on carbon emission efficiency. It has been demonstrated that the digital economy fosters episodic economic growth. This, in turn, has been shown to precipitate large-scale production expansion. Consequently, escalating energy consumption and carbon emissions during the production process can be expected. Concurrently, this phenomenon has been shown to diminish the efficiency of carbon emissions. Conversely, the digital economy has been demonstrated to enhance productivity through the empowering effect of digital technology, which in turn has been shown to improve the efficiency of carbon emissions. The impact of digital economic development on carbon emission efficiency is non-linear, exhibiting a 'U-shaped’ curve. It is evident that the conclusions drawn remain valid even after the implementation of instrumental variables for the endogeneity test and the utilisation of the EBM model as opposed to the SBM model for the purpose of assessing the robustness of the test for carbon emission efficiency. Secondly, a thoroughgoing analysis of the mechanism clearly demonstrates that the digital economic development of cities with high human capital exerts a more marked effect on the improvement of urban carbon emission efficiency. The digital economic development achieves this through the upgrading and optimisation of the industrial structure and the promotion of the level of marketisation. Thirdly, it is evident that the development of the digital economy exerts a spatial spillover effect on the efficiency of carbon emissions. The heterogeneity analysis indicates that the impact of the digital economy on enhancing carbon emission efficiency exhibits spatial heterogeneity, city-scale heterogeneity, and differences in the nature of cities. In the eastern and central regions of China, the influence of small cities and cities that are not old industrial bases is particularly evident.
7.2 Policy implications
In response to the above conclusions, this paper puts forward the following policy recommendations: First, integrate the changes in carbon emissions into economic system analysis, deeply understand the connotation and law of the impact of the digital economy on the efficiency of carbon emissions, and actively develop the digital economy to improve the digitalisation level of the city. Second, accelerate the integration of the existing education system with the development of the digital economy, enhance the interconnection between digital knowledge and skills and different disciplines, and vigorously cultivate professional, cross-border and composite digital talents. Through the system of ‘learning by doing’ and ‘industry-academia-research’, the digital literacy and skills of relevant workers will be improved, so as to alleviate the current lack of digital talents in traditional employment positions. Stimulate the vitality of talents to form a virtuous cycle of digital technology basic research and development capabilities, digital transformation and digital talent training. Thirdly, we attach importance to the use of the digital economy to promote the transformation and upgrading of traditional industries, create a new type of intelligent industrial platform, promote the in-depth integration of ‘industry, academia and research’, and help enterprises in their digital transformation to improve the operational efficiency of production, management, operation, sales and other links. Improve the market resource allocation system for the digital economy, form a market-oriented and enterprise-oriented innovation model, improve the efficiency of innovation transformation, and force backward low-end industries to realise circular, efficient and intensive production methods. Fourth, expand the radiation effect of digital economy development and coordinate regional digital economy development. At present, China’s digital economy development plateau is still clustered in developed regions such as North, Shanghai and Guangzhou, while the level of digital economy development in the surrounding areas is generally low. Developed regions need to further consolidate the role of digital leaders, form regional growth poles, and guide the spread of digital dividends to neighbouring regions. Promote the free flow and optimal allocation of capital, technology, talents and other factor resources across regions, industries and sectors nationwide, give full play to the complementary synergies of old and new technologies and those of neighbouring regions, and give full play to the ‘demonstration effect’ and ‘trickle-down effect’ of developed cities in the digital economy. The ‘demonstration effect’ and ‘trickle-down effect’ will be brought into full play in developed cities of the digital economy. At the same time, neighbouring regions need to identify their own strengths, complement resources with those of developed regions, and further achieve green development in digital sharing.
7.3 Research limitations and directions for improvement
Firstly, with regard to the utilisation of data, this study employs linear interpolation to address missing data, a process which may result in systematic bias, such as an increased incidence of missing data in less economically developed regions. Subsequent research could incorporate firm-level energy consumption records with a view to improving the accuracy of carbon accounting. Secondly, the study’s scope is limited to the Chinese context. Consequently, the conclusions may not be applicable to countries with significant variations in the development stages of the digital economy. Furthermore, the extrapolation of the conclusions is constrained, necessitating additional cross-country comparative studies to compare the differences in the carbon efficiency contribution of the digital economy under different policy frameworks. Thirdly, with regard to the modelling, the SBM-DEA is sensitive to the choice of input-output indicators and does not take into account dynamic efficiency changes, such as the intertemporal impacts of technological progress. This may result in an underestimation of the spatial spillover effects of the digital economy on carbon efficiency or an inaccurate assessment of regional heterogeneity. The enhanced approach introduces the dynamic SBM model and Malmquist index to analyse the intertemporal evolution of carbon efficiency. Fourthly, an absence of heterogeneity analysis and limited city type segmentation may obscure crucial mechanism differences and fail to accurately identify high-potential emission reduction city types. Further research could incorporate city functional classification.
Data availability statement
The datasets presented in this study can be found in online repositories. The names of the repository/repositories and accession number(s) can be found in the article/supplementary material.
Author contributions
SY: Investigation, Writing – original draft. XZ: Writing – review and editing, Data curation, Investigation, Methodology. SL: Conceptualization, Funding acquisition, Supervision, Validation, Writing – review and editing. ZL: Formal Analysis, Project administration, Resources, Writing – original draft.
Funding
The author(s) declare that financial support was received for the research and/or publication of this article. This study was supported by the National Natural Science Foundation of China (No. 42271097) and the National Key Research and Development Programme of China (No. 2022YFF1303204).
Conflict of interest
The authors declare that the research was conducted in the absence of any commercial or financial relationships that could be construed as a potential conflict of interest.
Generative AI statement
The author(s) declare that no Generative AI was used in the creation of this manuscript.
Publisher’s note
All claims expressed in this article are solely those of the authors and do not necessarily represent those of their affiliated organizations, or those of the publisher, the editors and the reviewers. Any product that may be evaluated in this article, or claim that may be made by its manufacturer, is not guaranteed or endorsed by the publisher.
Supplementary material
The Supplementary Material for this article can be found online at: https://www.frontiersin.org/articles/10.3389/fenvs.2025.1556238/full#supplementary-material
References
Arenius, P., and Laitinen, K. (2011). Entrepreneurial teams and the evolution of networks: a longitudinal study. 12, 239, 247. doi:10.5367/ijei.2011.0054
Baumol, W. J. (1967). Performing arts: the permanent crisis. Bus. Horizons 10 (3), 47–50. doi:10.1016/0007-6813(67)90083-3
Brynjolfsson, E., and Hitt, L. M. (2000). Beyond computation: information technology, organizational transformation, and business performance. J. Econ. Perspect. 14 (4), 23–48. doi:10.1257/jep.14.4.23
Camel, A., Belhadi, A., Kamble, S., Tiwari, S., and Touriki, F. E. (2024). Integrating smart green product platforming for carbon footprint reduction: the role of blockchain technology and stakeholders' influence within the agri-food supply chain. Int. J. Prod. Econ. 272, 109251. doi:10.1016/j.ijpe.2024.109251
Chen, S., Ding, D., Shi, G., and Chen, G. (2022). Digital economy, industrial structure, and carbon emissions: an empirical study based on a provincial panel data set from China. Chin. J. Popul. Resour. Environ. 20 (4), 316–323. doi:10.1016/j.cjpre.2022.11.002
Clark, F. J. (1940). Cytogenetic studies of divergent meiotic spindle formation in zea mays. Am. J. Bot. 27 (7), 547–559. doi:10.1002/j.1537-2197.1940.tb14716.x
Dewatripont, M., and Tirole, J. (2012). Macroeconomic shocks and banking regulation. J. Money, Credit Bank. 44 (s2), 237–254. doi:10.1111/j.1538-4616.2012.00559.x
Dilanchiev, A., Urinov, B., Humbatova, S., and Panahova, G. (2024). Catalyzing climate change mitigation: investigating the influence of renewable energy investments across BRICS. Econ. change Restruct. 57 (3), 113. doi:10.1007/s10644-024-09702-0
Ding, Y., and Li, F. (2017). Examining the effects of urbanization and industrialization on carbon dioxide emission: evidence from China's provincial regions. Energy 125, 533–542. doi:10.1016/j.energy.2017.02.156
Du, M., Antunes, J., Wanke, P., and Chen, Z. (2022). Ecological efficiency assessment under the construction of low-carbon city: a perspective of green technology innovation. J. Environ. Plan. Manag. 65 (9), 1727–1752. doi:10.1080/09640568.2021.1945552
Feldman, M. P., and Audretsch, D. B. (1999). Innovation in cities:. Eur. Econ. Rev. 43 (2), 409–429. doi:10.1016/s0014-2921(98)00047-6
Grossman, G. M., and Krueger, A. B. (1992). Environmental impacts of a North American free trade agreement. CEPR Discuss. Pap. 8 (2), 223–250. doi:10.3386/w3914
Jahanger, A., Ozturk, I., Onwe, J. C., Joseph, T. E., and Razib Hossain, M. (2023). Do technology and renewable energy contribute to energy efficiency and carbon neutrality? Evidence from top ten manufacturing countries. Sustain. Energy Technol. Assessments 56, 103084. doi:10.1016/j.seta.2023.103084
Jiang, H., Purohit, P., Liang, Q. M., Liu, L. J., and Zhang, Y. F. (2023). Improving the regional deployment of carbon mitigation efforts by incorporating air-quality co-benefits: a multi-provincial analysis of China. Ecol. Econ. 204, 107675. doi:10.1016/j.ecolecon.2022.107675
Kamble, S. S., Gunasekaran, A., Parekh, H., Mani, V., Belhadi, A., and Sharma, R. (2022). Digital twin for sustainable manufacturing supply chains: current trends, future perspectives, and an implementation framework. Technol. Forecast. Soc. Change 176, 121448. doi:10.1016/j.techfore.2021.121448
Khurshid, N., Fiaz, A., Khurshid, J., and Ali, K. (2022). Impact of climate change shocks on economic growth: a new insight from non-linear analysis. Front. Environ. Sci. 10. doi:10.3389/fenvs.2022.1039128
Kim, J., Sovacool, B. K., Bazilian, M., Griffiths, S., and Yang, M. (2024). Energy, material, and resource efficiency for industrial decarbonization: a systematic review of sociotechnical systems, technological innovations, and policy options. Energy Res. and Soc. Sci. 112, 103521. doi:10.1016/j.erss.2024.103521
Kovacikova, M., Janoskova, P., and Kovacikova, K. (2021). The impact of emissions on the environment within the digital economy. Transp. Res. Procedia 55, 1090–1097. doi:10.1016/j.trpro.2021.07.080
Lange, S., Pohl, J., and Santarius, T. (2020). Digitalization and energy consumption: does ICT reduce energy demand? Ecol. Econ. 176, 106760. doi:10.1016/j.ecolecon.2020.106760
Lee, C. C., and Zhao, Y. (2023). Heterogeneity analysis of factors influencing CO2 emissions: the role of human capital, urbanization, and FDI. Renew. Sustain. Energy Rev. 185, 113644. doi:10.1016/j.rser.2023.113644
Li, Q., Chen, H., Sharma, S., Singh, R., and Abbas, M. (2024). Optimization countermeasures for high-quality development of green economy driven by environmental regulations, carbon emission reductions, and efficiency enhancements. Stoch. Environ. Res. Risk Assess. 38 (11), 4169–4191. doi:10.1007/s00477-024-02696-1
Li, W., Cui, W., and Yi, P. (2024). Digital economy evaluation, regional differences, and spatio-temporal evolution: case study of yangtze river economic belt in China. Sustain. Cities Soc. 113, 105685. doi:10.1016/j.scs.2024.105685
Liu, Y., Dong, F., Yu, J., and Liu, A. (2024). Examining the impact of digital economy on environmental sustainability in China: insights into carbon emissions and green growth. J. Knowl. Econ. 15, 18044–18080. doi:10.1007/s13132-024-01766-7
Lu, J., and Li, H. (2024). Can digital technology innovation promote total factor energy efficiency? firm-Level evidence from China. Energy 293, 130682. doi:10.1016/j.energy.2024.130682
McAfee, A., and Brynjolfsson, E. (2012). Big data: the management revolution. Harv. Bus. Rev. 90, 60–128. doi:10.1007/s11623-013-0105-2
Napp, T. A., Gambhir, A., Hills, T., Florin, N., and Fennell, P. (2014). A review of the technologies, economics, and policy instruments for decarbonising energy-intensive manufacturing industries. Renew. Sustain. Energy Rev. 30, 616–640. doi:10.1016/j.rser.2013.10.036
Peng, H. R., and Qin, X. F. (2024). Digitalization as a trigger for a rebound effect of electricity use. Energy 300, 131585. doi:10.1016/j.energy.2024.131585
Polimeni, J. M., and Polimeni, R. I. (2006). Jevons’ paradox and the myth of technological liberation. Ecol. Complex. 3 (4), 344–353. doi:10.1016/j.ecocom.2007.02.008
Ren, S., Hao, Y., Xu, L., Wu, H., and Ba, N. (2021). Digitalization and energy: how does internet development affect China's energy consumption? Energy Econ. 98, 105220. doi:10.1016/j.eneco.2021.105220
Roussilhe, G., Ligozat, A. L., and Quinton, S. (2023). A long road ahead: a review of the state of knowledge of the environmental effects of digitization. Curr. Opin. Environ. Sustain. 62, 101296. doi:10.1016/j.cosust.2023.101296
Tan, J., and Wei, J. (2024). Balancing growth and sustainability: a regional analysis of industrial carbon efficiency in China. J. Knowl. Econ. 15 (3), 13946–13978. doi:10.1007/s13132-023-01679-x
Tone, K. (2001). A slacks-based measure of efficiency in data envelopment analysis. Eur. J. Operational Res. 130 (3), 498–509. doi:10.1016/s0377-2217(99)00407-5
Yang, L., Lin, Y., Zhu, J., and Yang, K. (2023). Dynamic coupling coordination and spatial-temporal analysis of digital economy and carbon environment governance from provinces in China. Ecol. Indic. 156, 111091. doi:10.1016/j.ecolind.2023.111091
Yang, W., Zhao, R., Chuai, X., Xiao, L., Cao, L., Zhang, Z., et al. (2019). China’s pathway to a low carbon economy. Carbon Balance Manag. 14 (1), 14. doi:10.1186/s13021-019-0130-z
Zhang, J., Lyu, Y., Li, Y., and Geng, Y. (2022). Digital economy: an innovation driving factor for low-carbon development. Environ. Impact Assess. Rev. 96, 106821. doi:10.1016/j.eiar.2022.106821
Zhang, Z. (2010). China in the transition to a low-carbon economy. Energy Policy 38 (11), 6638–6653. doi:10.1016/j.enpol.2010.06.034
Keywords: carbon emission efficiency, CCR-SBM model, human capital, spatial spillover, digital economy
Citation: Yuan S, Zhang X, Liu S and Li Z (2025) Low-carbon pathways to digitalization: can the digital economy improve carbon efficiency?. Front. Environ. Sci. 13:1556238. doi: 10.3389/fenvs.2025.1556238
Received: 09 January 2025; Accepted: 19 June 2025;
Published: 09 July 2025.
Edited by:
Fuyou Guo, Qufu Normal University, ChinaReviewed by:
Hong-Dian Jiang, China University of Geosciences, ChinaKaicheng Liao, Tongji University, China
Minzhe Du, South China Normal University, China
Copyright © 2025 Yuan, Zhang, Liu and Li. This is an open-access article distributed under the terms of the Creative Commons Attribution License (CC BY). The use, distribution or reproduction in other forums is permitted, provided the original author(s) and the copyright owner(s) are credited and that the original publication in this journal is cited, in accordance with accepted academic practice. No use, distribution or reproduction is permitted which does not comply with these terms.
*Correspondence: Shuaifeng Yuan, MTIwMjIwMTAwMTJAY3VlYi5lZHUuY24=; Shiliang Liu, c2ptY3NneXNmQDE2My5jb20=