 Moibon Gabisa
 Gizachew kabite
 Siraj Mammo
- 1Ambo University, College of Natural and Computational Science, Biology department Ambo, Ambo, Ethiopia
- 2Ethiopian Space Science and Geospatial Institute, Addis Ababa, Ethiopia
Land use and land cover (LULC) change represents a critical environmental challenge that significantly impacts the Earth’s systems and ecosystem services and leads to environmental degradation and economic loss. The main objective of this study was to investigate the trend of LULC change, drivers, and its impacts on ecosystem services in the Burayu sub-city, Shager City, Ethiopia. The study used satellite images from four time periods, Landsat Series sensors’ 4, 5, and 8, at 10-year intervals to understand the spatial and temporal dynamics of LULC by using the integration of GIS and RS techniques under a supervised classification system. Respondent interviews, focus group discussions (FGDs), and field observations were employed. In addition, to address the drivers of LULC changes in the study area, a multifaceted method was followed using field observations. A modified benefit transfer method was used to evaluate ecosystem service value (ESV) changes in response to LULC change. The study revealed that population growth, urbanization, agricultural expansion, and infrastructure development were driving the change in the LULC composition of the study area over the past 30 years. Croplands have decreased from 51.2% to 30.3%, forest cover has dropped from 32.9% to 15%, and grassland has fallen from 12.7% to 6.1%. On the other hand, settlement areas have expanded from 2.5% to 46.9%, and the total natural capital value has decreased from $368.7million to $227.0 million per year. Therefore, it is possible to conclude that a significant change in LULC and declining ecosystem service values has occurred in the study area. The local government should develop a comprehensive land use plan, balance urban development with ecosystem service preservation, strengthen law enforcement, and increase public awareness to minimize the significant impacts of urbanization on ecosystem services.
1 Introduction
Land use and land cover (LULC) change is a critical issue globally, impacting both developed and developing nations. In Ethiopia, challenges related to land use and land cover (LULC) change are especially pronounced (Siraj et al., 2018a). These changes significantly impact agricultural practices and food security. Studies indicate that environmental issues critically shape agricultural outcomes, underscoring the need for effective management strategies (Solomon, 2016; Ayele et al., 2018; Minta et al., 2017; Berihun et al., 2019; Kuma et al., 2022).
Significant LULC changes in Ethiopia have been driven by rapid population growth, extreme weather events, and inadequate land use planning and policy (Meshesha et al., 2016; Wubie et al., 2016; Siraj et al., 2018a; Genet, 2020; Hailu et al., 2020). These changes arise from a combination of human and natural factors, encompassing social, economic, environmental, and political aspects (Ayele et al., 2016; Siraj et al., 2018a; Hailu et al., 2020; Dibaba et al., 2020).
The implications of LULC change are particularly significant in the highlands of Ethiopia, where rain-fed subsistence agriculture serves as the primary livelihood and is foundational to economic development (Belay et al., 2022).
Rapid land use and land cover (LULC) changes in these areas have led to adverse effects, including environmental degradation, soil erosion, reduced soil quality, biodiversity loss, habitat destruction, and decreased water availability (Wubie et al., 2016; Miheretu and Yimer, 2018; Hassen and Assen, 2017; Abebe et al., 2022). Numerous studies conducted throughout Ethiopia have examined the dynamics of LULC change and its socio-economic and environmental impacts (Shete et al., 2016; Wubie et al., 2016; Minta et al., 2017; Berihun et al., 2019; Belay and Mengistu, 2019; Degife et al., 2019; Siraj et al., 2018a; Hailu et al., 2020; Hishe et al., 2021; Kuma et al., 2022). However, the findings of these studies have varied, reflecting the influence of different socio-economic and biophysical factors (Belay and Mengistu, 2019). LULC changes affect ecosystems in two major ways. The first is the direct impact on aquatic and terrestrial ecosystems, while the second involves contributing to climate change through carbon emissions. Consequently, LULC influences fundamental ecosystem characteristics and processes, such as land productivity, biological diversity, and hydrological cycles (Turner et al., 2020). The LULC pattern of a region results from the interplay of natural and socio-economic factors and their utilization over time and space. Understanding LULC is essential for selecting, planning, and implementing effective land use strategies that address the increasing demands for basic human needs and contribute to overall welfare (Zubair, 2006; Liu et al., 2021).
Ecosystem service valuation has emerged as a widely adopted approach for assessing the impacts of Land Use and Land Cover (LULC) dynamics on the flow of ecosystem services, which are essential for human wellbeing (Tolessa et al., 2017; Gashaw et al., 2018; Tolessa et al., 2021). The growing emphasis on ecosystem service studies stems from increasing concerns about environmental degradation caused by human activities and the recognition of the critical benefits provided by nature. These benefits, often overlooked in traditional economic production and consumption models, are now gaining attention due to their vital role in supporting human livelihoods. With rapid population growth and shifting consumption patterns, the demand for ecosystem-dependent production and consumption sectors has surged. As a result, ecosystem service valuation studies have become instrumental in tracking changes in ecosystem service values across spatial and temporal scales, while also informing policy decisions to ensure sustainable management of natural resources.
Investigating and leveraging changes in LULC to assess their impact on ecosystem service values is critically important. Estimating these values through LULC change analysis provides essential insights into how ecosystem services have been affected by human activities across various spatial and temporal scales. Such evaluations are crucial in shaping decision-making processes, enabling national accounting systems to reflect the true value of ecosystem services and thereby promote sustainable development (Terefe et al., 2017; Wang et al., 2022). Furthermore, this knowledge supports the design of alternative development projects that balance economic benefits with the preservation and enhancement of ecosystem services.
The study hypothesizes that changes in land use and land cover are driven by a combination of natural and anthropogenic factors, and these changes significantly alter ecosystem services by affecting biodiversity, water regulation, carbon storage, and soil quality. Therefore, this study intended to integrate geospatial technologies, such as remote sensing and GIS, which offers a cost-effective and time-efficient approach, for analyzing LULC changes (1) to analyze the spatial and temporal extent of LULC changes in Burayu Sub-City from 1993 to 2023; (2) To identify the drivers of LULC changes in the study area and (3) to quantify the impacts of LULC change on ecosystem services in the study area.
2 Materials and methods
2.1 Description of the study area
The study was conducted in Burayu Sub-City, located in the Shagger City Oromia, Ethiopia (Figure 1). Burayu sub-city is located in central Ethiopia within the Oromia National Regional State, under Sheger City. It lies approximately 15 km from Finfine/Addis Ababa, the capital of both Oromia and Ethiopia. Geographically, the study area is situated between 9°0′0″N to 9°5′0″N latitude and 38°36′0″E to 38°42′0″E longitude (Figure 1). The sub-city spans an area of 8,494 ha, characterized by sub-high terrain and a plateau-like landscape (Ethio-GIS, 2021). According to the Urban Development and Housing Office, Burayu sub-city is one of the fastest-growing urban areas in Ethiopia within Sheger City. Significant changes began across the city, particularly during the implementation of the first Growth and Transformation Plan (GTP I) from 2010 to 2015. During this period, Burayu experienced substantial infrastructure development, including the construction of 373 apartments, 200.3 km of gravel roads, 22.68 culverts, and 61.9 km of electric lines. The study area occupies 8,494 ha, of territory and made up of six kebeles such as Gefersa Burayu, Burayu Keta, Leku Keta, Gefersa Guje, Gefersa Nono, and Melka Gefersa (Burayu Sub-City Urban Development and Housing Office, 2024). Based on data from the 2007 Central Statistical Agency census, the city’s population was projected to reach 71,900 by 2015. Nevertheless, when we compare this number to the city’s present population, it seems unrealistic.
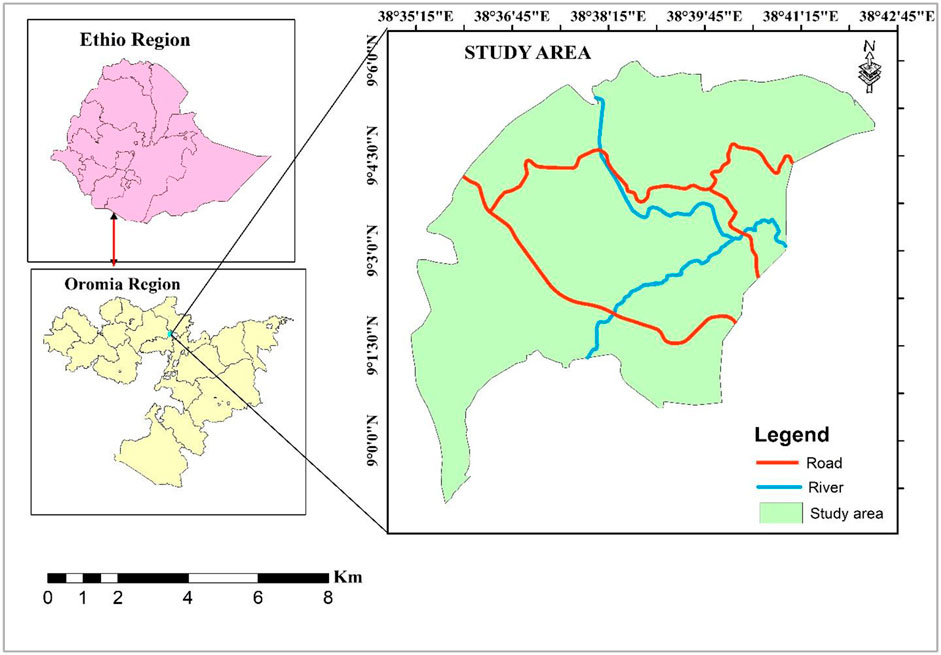
Figure 1. Map of the study area.
2.2 Methods
2.2.1 Data sources and acquisition method
To assess trends in Land Use and Land Cover (LULC) change, satellite images from four periods (1993, 2003, 2013, and 2023) were downloaded from the United States Geological Survey (USGS) Earth Explorer platform during the dry season. Dry season images were selected because they are typically cloud-free and less affected by moisture, ensuring higher quality for analysis (retrieved 24 December 2023, from https://earthexplorer.usgs.gov/). The satellite images used were from Landsat TM (1993, 2003, 2013) and Landsat OLI (2023), all with a spatial resolution of 30 m (Table 1). In addition to satellite imagery, 82 Ground Control Points (GCPs) were collected using a Global Positioning System (GPS) to train and validate the classification of LULC types. These GCPs were collected from various LULC categories to ensure representative sampling.
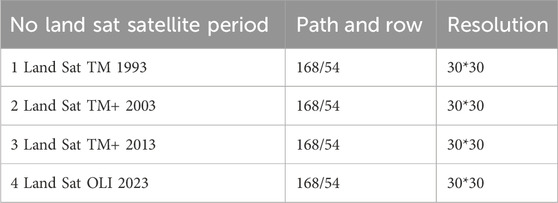
Table 1. Satellite images, periods, Paths and Rows, and Resolution.
Major LULC types were also identified by discussion with local community and development agents, field observation, and satellite image analysis. To understand the changes within a period, an approach of temporal analysis for change detection was carried out. The LULC change maps of the Burayu sub-city for four reference years (1993, 2003, 2013, and 2023) and statistical summaries of the different LULC dynamics were presented. LULC dynamics results were acquired through a combined method of GIS and remote sensing techniques from land sat images. Potential land use and land cover types observed and identified in the study area were defined. In the study area, there are five types of land use types (Table 2).
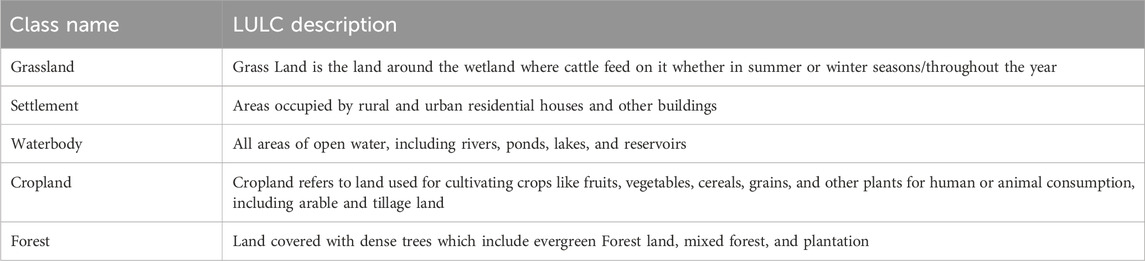
Table 2. LULC class description.
2.2.2 Image processing and data analysis
Preprocessing of satellite images is essential to establish a direct link between acquired data and biophysical phenomena (El-Kawya et al., 2010). Digital images affected by systematic and random errors cannot be directly used for feature identification; thus, this process involves their management and analysis (Zhang et al., 2009). Standard techniques such as extraction, radiometric correction, layer stacking, geometric correction, and change detection were applied to the images across four reference periods.
Ground reference data was collected to aid in image interpretation, class determination, and accuracy assessment (Thapa and Murayama, 2009). Field data validated LULC dynamics interretation, supported image classification, and provided qualitative descriptions of LULC types. For satellite image processing and LULC change analysis, ERDAS IMAGINE, 2025; Free GIS maps, 20251 were utilized.
A reconnaissance survey conducted in March 2023 identified land use and land cover (LULC) changes and helped understand land patterns through multispectral and temporal satellite images. Focus Group Discussions (FGDs) gathered diverse groups of 6–12 participants from the community and relevant stakeholders to discuss specific topics. A facilitator guided these discussions to collect qualitative insights that informed the classification process and enhanced contextual understanding of the data.
Key Informant Interviews (KIIs) involved in-depth discussions with selected individuals who have specialized knowledge of the study area. These informants, including local leaders, experts, and residents, provided valuable information on socio-economic and environmental factors affecting land use. Their insights enriched the qualitative data and complemented the quantitative analysis.
Additionally, field observations informed by FGDs revealed the history of land use during classification periods. Ground truth data was collected from fixed locations representing different LULC types to guide classification and assess accuracy for the 2023 classification year. A total of 82 ground control points (GCPs) were randomly collected, considering area proportions for various LULC change types. LULC change statistics were computed using specified methods.
2.2.3 Supervised images classification
Supervised image classification was employed using the maximum likelihood algorithm, which is a widely used technique in image classification (Chen and Stow, 2002). Ground truth points from each LULC category were collected to aid in the classification process. The supervised classification method is commonly used to identify land use classifications using spectral signatures (Congalton and Green, 2019) and it assumes that the statistics are normally distributed for each class and in each band Yonaba et al. (2021). The image was then sorted into groups based on how closely it resembled the training signatures after collecting samples from the various land cover classes (training data) [52]. The variance and covariance of the spectral response patterns were quantitatively evaluated using the maximum likelihood algorithm, and each pixel was then assigned to the class for which it has the greatest likelihood of association (Alam et al., 2019). The LULC classes that were identified are forestland, cropland, grassland, Settlement areas, water bodies (Table 2).
2.2.4 Detection of land use land cover changes
A post-classification comparison approach was employed to identify Land Use and Land Cover (LULC) changes over time, based on numerical values extracted from classified images (Alam et al., 2019; Yonaba et al., 2021). This method involves overlay comparisons to determine the types of LULC conversions that have occurred (Alam et al., 2019). Specifically, independently generated classification images of the same region from different time periods were compared. The final classified thematic maps for subsequent periods (i.e., 1993–2003, 2003–2013, 2013–2023, and 1993–2023) were cross-tabulated (Kindu et al., 2018; Mengist et al., 2021) to quantify the percentage and rate of LULC changes over the time series.
To further analyze the observed LULC transitions, the total and net changes in area were calculated using the following equations (Equation 1; Equation 2; Equation 3):
LULC Change in hectare is calculated by:
Where, Area is extent of each LULC type. Positive values suggest an increase whereas the negative values imply a decrease in extent.
Percentage LULC changes calculated using the following equation:
Where, Area is extent of each LULC type. Positive values suggest an increase whereas negative values imply a decrease in extent.
Rate of LULC: computed using the following simple formula (Equation 3)
Where, r, Q2, Q1 and t indicates rate of change, recent year LULC in ha, initial year LULC in ha and interval year between
initial and recent year correspondingly.
2.2.5 Accuracy assessment
Remote sensing data, being subject to various factors such as classification techniques and satellite data capture methods, often contain errors. Therefore, when deriving land use and land cover maps from remote sensing, it is essential to quantitatively explain these errors in terms of classification accuracy.
In this study, field observations and data collection related to land use and land covers were conducted using a digital camera and GPS. The current features of the study area were checked, and each sampling location was recorded using GPS and Google Earth (Rwanga et al., 2017). The number of sampling points for land use and land cover classes was sufficient and statistically accurate for conducting the accuracy assessment.
The following equation indicates how the accuracy assessments are carried.
2.3 Proximate and underlying driving forces of LULC change
Through the questionnaire survey, local community views about LULC trends and priorities were evaluated. KII, FGD, and household interviews were used which address issues related to the proximate and underlying causes of LULC changes with both open-ended and closed-ended questions. 8 focus group discussions (FGD) and 10 Key informant interviews (KII) were conducted. A total of 18 respondents were randomly selected from the area.
Table 3 in the FGD, there were 8 participants, consisting of 5 males and 3 females, whereas for the KII, there were 10 participants, with 6 males and 4 females. Overall, a total of 18 individuals participated in both the FGD and KII, with 11 males and 7 females. The ages of the participants were also collected individually and can be summarized in a table or narrative format as needed.

Table 3. Marital status and sex of the respondents.
2.4 Ecosystem service valuation
The outputs from the land use and land cover (LULC) analysis, along with global datasets developed for various biomes, were used to evaluate trends in ecosystem service values (ESVs) within the study area over the specified period. A total of 82 data points from 42 case studies were compiled to create a global ecosystem service valuation database (ESVD), which is based on monetary values for all biomes. This approach aimed to reduce uncertainties identified in previous studies (Simeon and Wana, 2024; Mekuria et al., 2021; de Groot et al., 2020; Kindu et al., 2016; Li et al., 2007). The most recent updated global ESVD (Table 4) was utilized to estimate changes in ESVs resulting from LULC changes in the study area, employing a benefit transfer method (Simeon and Wana, 2024; Temesgen et al., 2018).
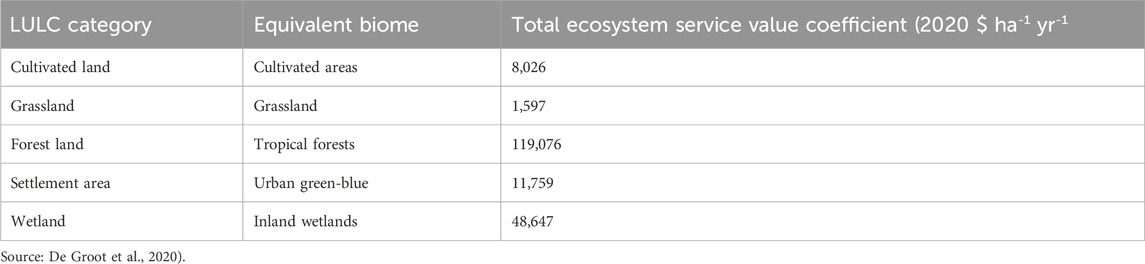
Table 4. LULC classes, their equivalent biome types, and corresponding ecosystems.
Representative biomes served as proxies for each LULC class (Table 4). Equations 5–8 were applied to estimate ESVs for each LULC category, the overall ESVs, the values of individual ecosystem services (including provisioning, regulating, supporting, and cultural services), and the percentage change in ESVs across various periods (1993–2003, 2003–2013, 2013–2023) for the entire kebeles (Tolessa et al., 2017; Tolessa et al., 2021).
Where ESV is the estimated ecosystem service value, AK is the area (ha), and V Ck is the value coefficient (US $ ha−1year−1).
For LULC category k, the changes in ecosystem service value were estimated by calculating the differences between the estimated values for each LULC category in 1993, 2003, 2013, and 2023. In addition to estimating LULC change effects on the total value of ecosystem services, the impacts of such changes on 16 individual ecosystem services were also calculated (de Groot et al., 2020) for the study area. The values individual ecosystem service values were calculated using Equation 6 (Wayesa et al., 2025; Tolessa et al., 2017; Tolessa et al., 2021):
Where ESVf is the estimated ecosystem service value of function f, AK is the area (ha), and VCfk is the value coefficient of function f (US $ ha−1year−1) for LULC category k.
2.5 Elasticity of ESV change in relation to LULC
Changes in ESVs as a result of changes in LULC change were also estimated using Equation 8 to explore the magnitude of the impacts of the most important land use identified (Tolessa et al., 2021).
Where, NCV is the total natural capital value (US$ year-1) of all ESs from all LULC classes at t year (US$ year-1)
VCt, i is the total value of ESs provided by the i LULC class at t year (US$ year-1) and
At, i is the area coverage (ha) of the i LULC class at t year.
3 Results and discussions
3.1 Accuracy assessment
A total of 82 Ground Control Points (GCPs) were collected using GPS during field visits, with 40 used for supervised classification and 42 for accuracy assessment. Reference points for 1993 and 2023 were obtained through Google Earth, Landsat images, and historical reports. This similarity in results has been observed in other studies that utilized low-quality historical maps, including those by Tilahun (2015), Gashaw et al. (2018), and Fasika et al. (2019). Based on the results of the post-classification accuracy assessment for 2023, it was revealed that user accuracy was highest for the water body at 100% and lowest for the forest at 73.44% (Table 5). Producer accuracy, which reflects the proportion of correctly classified data, was also highest for water bodies (100%) and lowest for grassland (66.67%). For the second study period, user accuracy for grassland and forest land ranged from 75.51% to 100%. In 2003, individual LULC class producer accuracy was highest for water body (100%) and lowest for grassland (75.51%).
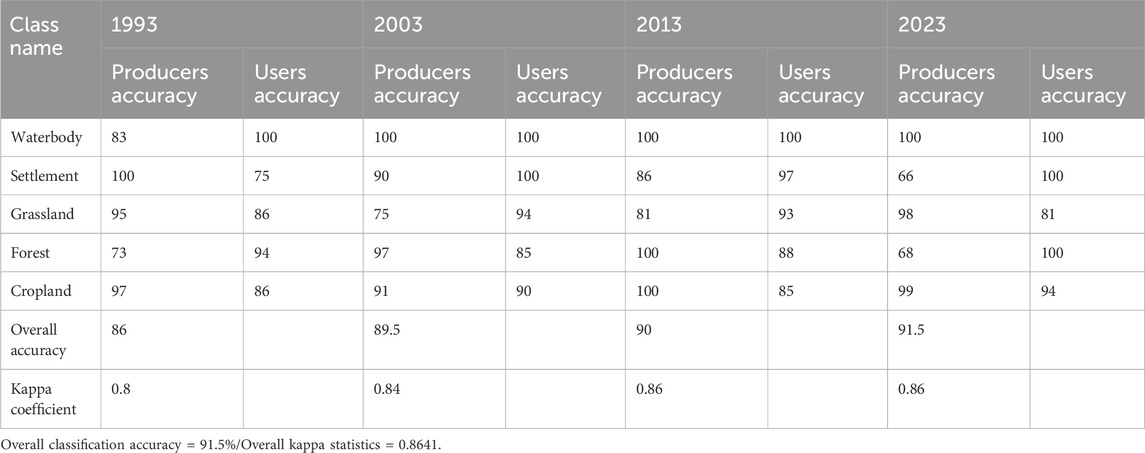
Table 5. The accuracy level and conditional kappa coefficient of each LULC category.
3.2 Land use and land cover dynamics
The study identified five LULC classes in the study area such as settlements, cropland, water bodies, forests, and grasslands (Figure 2; Table 6). Significant landscape changes were observed between 1993 and 2023. In 1993, cropland was the dominant land use, covering 51.2% of the total area. By 2003, cropland had decreased to 43.4%, while settlements expanded to 7.7%. Forests and grasslands experienced slight declines, covering 16% and 31.2%, respectively.
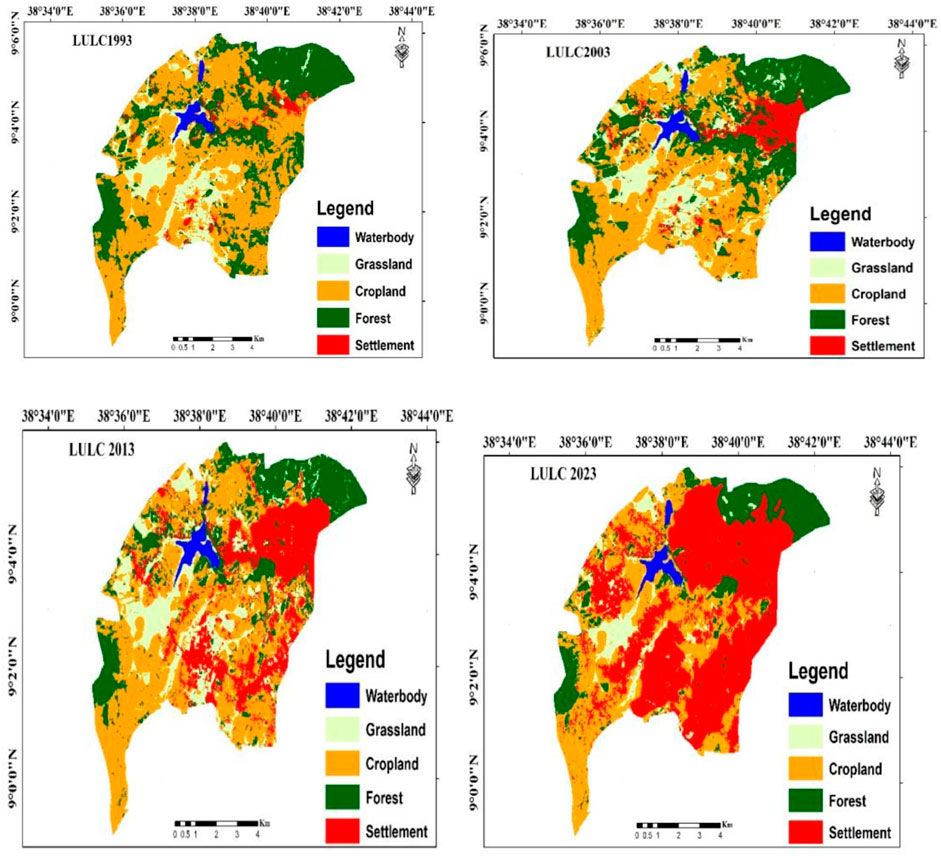
Figure 2. LULC map (1993_ 2023).
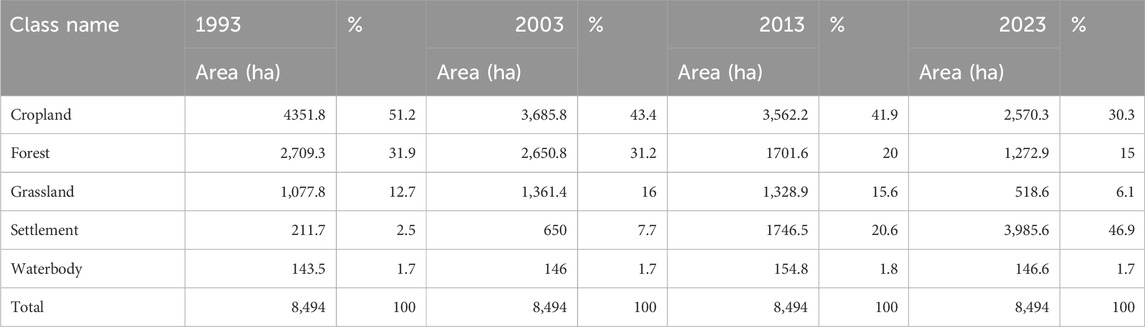
Table 6. LULC change classes in the Study Area from 1993–2023.
The most significant change occurred in 2013 when settlement areas increased to 20.6%. Although cropland remained the largest land cover at 41.9%, forests declined to 20%, grasslands to 15.6%, and water bodies remained stable at 1.8%. By 2023, settlements became the dominant land use, covering 46.9% of the total area. Meanwhile, cropland, forestland, and grassland declined to 30.3%, 15%, and 6.1%, respectively. Water bodies remained relatively stable covering about 1.7%. These findings indicate a substantial loss of cropland, grassland, and forestland between 1993 and 2023. The results align with previous studies, including Gessesse and Bewket (2014), Bekele et al. (2019), Berihun et al. (2019), and Guyu and Aduwa (2020), which reported significant increases in settlement areas at the expense of cropland and natural landscapes such as forests and grasslands.
3.2.1 Cropland (CL)
The majority of rural communities in the study area rely on agricultural production for their livelihoods, similar to other regions in Ethiopia. Crop cultivation remains the primary economic activity and a dominant land use in the study area. This study revealed a substantial conversion of CL into Settlement (SA) (Table 6). In 1993, CL was the dominant land cover, occupying 4,351.8 ha (51.2%) of the total area. Over the next decade, this area declined to 3,685.8 ha (43.4%) by 2003 and further decreased to 3,562.2 ha (41.9%) in 2013. The most significant reduction occurred by 2023, with cropland shrinking to 2,570.3 ha (30.3%) (Table 6; Figure 2). The rapid decline of cropland, accompanied by an increase in settlement areas, has also been observed in other parts of Ethiopia, as documented by Guyu and Aduwa (2020). Previous research has shown that much of the expansion of agricultural land occurs in marginal and ecologically fragile environments, such as forests, wetlands, grasslands, and steep slopes, particularly when more suitable land for cultivation becomes scarce (Tolessa et al., 2017; Siraj et al., 2018b).
3.2.2 Grassland (GL)
Grasslands were transformed into other land use types. The trends in GL areas over the past 3 decades reveal significant changes in land use and land cover. In 1993, GL covered 1,077.8 ha, accounting for 12.7% of the total area. By 2003, this figure had increased to 1,361.4 ha (16%), possibly reflecting initial conservation or expansion efforts. However, by 2013, the GL area declined to 1,328.9 ha (15.6%), signaling the onset of land conversion for other uses. By 2023, and grassland area had plummeted to just 518.6 ha (6.1%) (Table 6). This dramatic loss is primarily attributed to conversion for agricultural purposes and urban development. As population growth drives increased demand for food and living space, grasslands are often prioritized for cultivation and settlement. This shift not only reduces GL area but also negatively impacts biodiversity, soil health, and local ecosystems.
The findings of this study are consistent with other research conducted across Ethiopia, which has documented similar patterns of grassland conversion. Studies by Tolessa et al. (2017), Siraj et al., (2018a), Hailu et al. (2020), Habte et al. (2021), and Regasa et al. (2021) have reported that local communities are increasingly transforming grasslands into agricultural fields to meet the demands of a growing population. These studies underscore the critical need for sustainable land management practices that balance agricultural expansion with ecological preservation. Effective strategies are essential to protect natural resources and ensure their availability for future generations.
3.2.3 Forest Land (FL)
In 1993, forest land (FL) was the second-largest land cover class, occupying 2,709.3 ha (31.9%) of the total study area. Over the next decade, it remained relatively stable, slightly decreasing to 2,650.8 ha (31.2%) by 2003. However, a more substantial decline occurred between 2003 and 2013, with forest cover reducing to 1,701.6 ha (20%). This downward trend continued, and by 2023, forest cover had further decreased to 1,272.9 ha (15%).
The steady decline in FL throughout the study period (1993–2023) indicates that a significant portion of forest land has been converted to other land uses, predominantly cropland. Similar trends of forest loss and cropland expansion have been documented in other parts of Ethiopia, as reported by Tolessa et al. (2017), Siraj et al., (2018a), Hailu et al. (2020), Habtamu et al. (2023), and Wayesa et al. (2025).
3.2.4 Settlement Areas (SA)
SA The expansion of settlement areas in Burayu Sub City is significantly correlated with the decline in agricultural land cover over the past 30 years. In 1993, settlements covered a relatively small area of 211.7 ha (2.5%). By 2003, this had increased to 650 ha (7.7%). The growth continued, reaching 1,746.5 ha (20.6%) in 2013 and expanding dramatically to 3,985.6 ha (46.9%) by 2023.
Between 1993 and 2023, a total of 703.02 ha of land were converted into settlement areas Table 6. Similar trends in settlement expansion have been documented in various studies across Ethiopia, including the works of Garedew (2010), Tolessa et al. (2017), Siraj et al. (2018a), Hailu et al. (2020), and Wayesa et al. (2025).
3.2.5 Water bodies (WB)
The area covered by water bodies (WB) remained relatively stable throughout the study period. In 1993, wetlands occupied 143.5 ha (1.7%) of the total area. This slightly increased to 154.8 ha (1.8%) by 2013 but slightly declined to 146.6 ha (1.7%) by 2023 (Figure 2).
This consistency suggests that WB has been less affected by land use changes compared to other categories. The stability may indicate effective management practices aimed at protecting these critical ecosystems. Wetlands are vital for maintaining biodiversity, providing habitats for aquatic species, and supporting surrounding ecosystems. Additionally, their relatively unchanged size underscores their significance in water resource management, ensuring a reliable supply for agriculture, drinking water, and recreation, as illustrated in Figure 2 and Table 6. This study is aligning with an analysis of land use and land cover changes in the Bilate Watershed, Ethiopia, which examined the impact of these changes on climate variability. The study found that alterations in land cover, particularly the reduction of natural vegetation, contributed to local climate variability, which in turn affected water resources and ecosystem services (Bikeko et al., 2024).
3.3 Trends of change in land use land cover
The results of this study revealed significant LULC changes between 1993 and 2023, with notable conversions from FL to CL. Over the 30-year study period (Table 7). The findings showed a cumulative decline of 20.9% in CL, 16.9% in FL, and 6.6% in GL, while SA expanded substantially by 44.4%. Meanwhile, the area occupied by WB remained essentially unchanged. This trend suggests a higher propensity for certain LULC types, particularly SA to expand rather than decline.
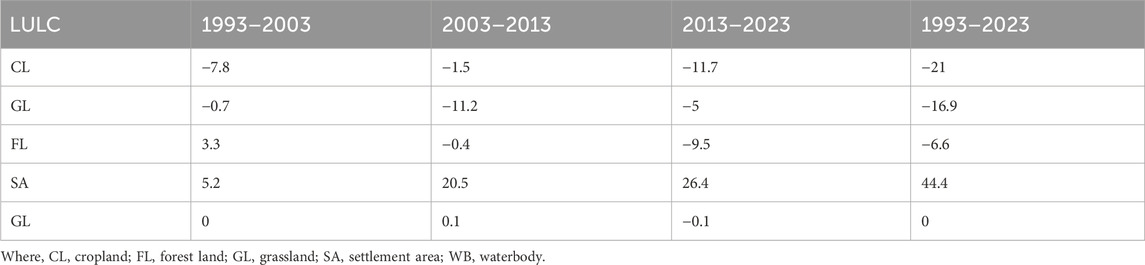
Table 7. LULC change from 1993–2023 (in %).
These results are consistent with the findings of Tesfaye et al. (2024), who reported similar patterns of land use transformation. Overall, the study highlights a dynamic change in LULC over the past three decades (1993–2023), reflecting a clear trend of increasing conversion of CL, FL, GL, and WB to SA as illustrated in (Figure 2).
3.4 LULC change matrix
The LULC matrix analyzes pixel-to-pixel differences between study year images through overlay analysis, illustrating the change in direction and the original land use types (Table 8). Population pressure resulted in the cutting of trees for firewood and the construction of houses and hence has changed land cover and caused a loss of biodiversity. The analysis of LULC changes from 1993 to 2023 revealed significant transformations in the study area, with important implications for ecological health and resource management. Cropland (CL) experienced a dramatic decline from 4342.9 ha in 1993 to 2,560.1 ha by 2023, primarily driven by urbanization and increasing demand for settlement space. This trend aligns with observations from other studies, which highlight the growing repurposing of agricultural lands for housing and infrastructure development.
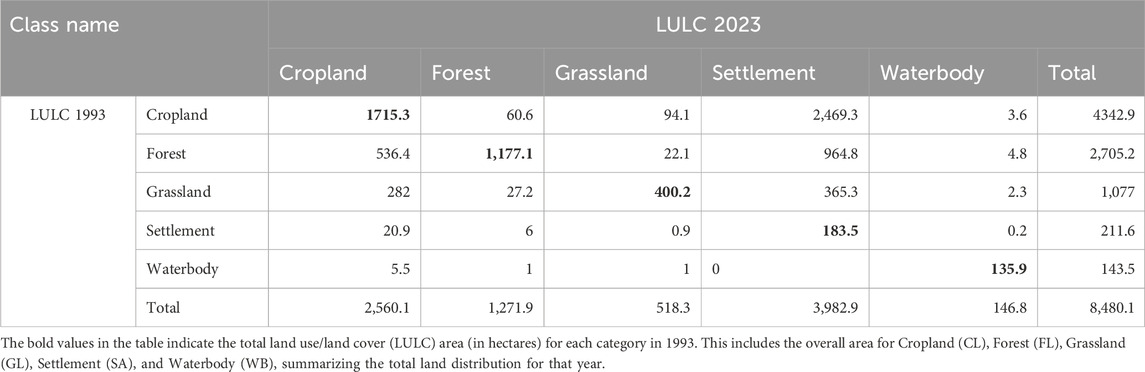
Table 8. LULCC confusion matrix from 1993 to 2023.
Similarly, forest land (FL) experienced a sharp decrease from 2,705.2 ha in 1993 to 1,271.9 ha in 2023, raising concerns about biodiversity loss and the disruption of essential ecological functions such as carbon sequestration and habitat provision. Grasslands also faced moderate reductions, declining from 1,077 ha to 518.3 ha, which may have adverse effects on local ecosystems, livestock grazing, and soil stability.
Population pressure has been a major driver of land use and land cover (LULC) changes over the last decade, significantly exaggerating these transformations. A substantial portion of the original farming land has been converted into other LULC classes, particularly settlement areas. In stark contrast, settlement areas expanded dramatically, increasing from 211.6 ha in 1993 to 3,982.9 ha in 2023. This rapid urbanization is largely attributed to population growth and economic development. It underscores the urgent need for integrated land-use planning to mitigate the impacts of urban sprawl on agricultural and natural resources (Table 8).
Interestingly, WB remained relatively stable over the 30 years, suggesting effective management practices or lower developmental pressures compared to other land uses. This stability is critical for maintaining local biodiversity and supporting surrounding ecosystems.
Overall, these findings highlight the urgent need for sustainable land management practices that balance urban expansion with ecological preservation, ensuring the long-term sustainability of the region’s natural resources. These results align with Singh et al. (2011), who initially reported significant land-use changes, and with subsequent studies by Siraj et al. (2018), Hailu et al. (2020), and Wayesa et al. (2025), all of which documented a decline in cropland in favor of settlement cover.
In contrast, the values along the diagonal in the LULC change matrix represent areas where no change occurred, (Table 8). The LULC change matrix, based on satellite image interpretations from 1993 to 2023, is presented in Tables 8. These tables illustrate the area distribution of land cover and land use classes and provide insights into the proportions of each cover type that transitioned into other classes during subsequent periods, as summarized in (Table 8) this indicates a higher tendency of LULC types to continue rather than decline. This study is in line with the study of Hailuet al. (2020), Kinduet al. (2015) and Shiferaw and Singh, (2011), who stated a significant increment of settlement at the decline of Cropland, grasslands and forests. Population growth within Burayu Sub City is a primary driver of land use and land cover changes, leading to increased urbanization and decreased forest cover.
3.5 The major driving forces of LULC dynamics in the study area
LULC change in Burayu Sub City highlights various driving factors that contribute to environmental problems and the degradation of natural resources. LULC change reflects the socio-economic conditions of the surrounding community and is influenced by social practices, cultural factors, and economic elements. Key environmental factors, such as land quality, topography, water availability, and land policy, shape these changes (Tesfaw et al., 2023). Previous research has identified population growth, land tenure issues, poverty, weak rule enforcement, limited extension services, and inadequate public awareness as root causes of LULC change (Ewunetu et al., 2021). FGDs have revealed that population pressure, agricultural land expansion, and the demand for fuelwood and construction materials are significant contributors to LULC dynamics.
Proximate driving forces include the expansion of agricultural land spurred by rising population demands, which has led to urban encroachment into forested areas. This shift exacerbates LULC changes as agricultural and forested lands are transformed to meet housing and infrastructure needs. Unsustainable farming practices, coupled with increasing demand for fuelwood, have resulted in deforestation and habitat loss, disrupting ecological balance (Regasa et al., 2021; Abebe et al., 2022). Infrastructure development further transforms agricultural areas into built environments, threatening food security and the livelihoods of local farmers and pastoralists (Melese, 2016; Wubie et al., 2016). According to FGDs participants identified increasing population density as a key driver of Land Use and Land Cover (LULC) change in Burayu Sub City. This growth elevates the demand for housing, leading to urban encroachment into natural areas, and increases the need for agricultural land, resulting in forest conversion into farmland. These insights highlight the need for sustainable practices to balance housing and agricultural demands with environmental conservation. The underlying drivers of Land Use and Land Cover (LULC) change in Burayu are complex and interconnected, primarily influenced by urbanization, population pressure, ineffective policy enforcement, property rights issues, and biophysical factors. Rapid population growth fuels urbanization, leading to the conversion of agricultural and natural lands into residential and commercial spaces, often at the expense of agricultural production and environmental conservation (Birhanu and Meseret, 2013). Focus group discussions and key informant interviews revealed that increasing population density heightens the demand for housing, resulting in urban encroachment into natural areas and a greater need for agricultural land, prompting the conversion of forests into farmland.
Moreover, FGD participants noted that farmers lack confidence and feel they have no rights over their land. Coupled with very low landholding per household, this situation encourages local farmers to encroach on vegetated areas for cropping, settlement, and grazing. These findings highlight the urgent need for sustainable practices to balance housing and agricultural demands with environmental conservation.
3.6 Impacts of LULCC on ecosystem services
The ecosystem service values across the study period have been reduced by 38.4%. Regarding the changes in ESVs for each land use class, settlement areas showed an increasing trend, while cropland, grassland, and forest land showed a reduction trend (Tables 9, 10). But waterbody areas were slightly increased, tending to reduce in the first, third, and fourth periods, as well as an increase in the values in the second period (2003–2013). The overall reduction in vital ecosystem service values is attributed to the reduction in vital components of the landscape such as grassland and forestland. This result corroborates the findings of Mekuria et al. (2021) and Costanza et al. (1997), who asserted that cultivated land was the dominant land use with the highest ecosystem service values (ESVs), showing increasing trends over time. In contrast, the highest reduction in overall ESVs was recorded for forest land, followed by a significant decline in the total ESVs of cropland (40.0%). These findings align with studies conducted in the Central Highlands of Ethiopia (Tolessa et al., 2017; Admasu et al., 2023) and the Andassa watershed in Ethiopia (Gashaw et al., 2018). However, the rate of decline observed in our study area is notably higher, likely due to rapid urbanization and weak enforcement of land use policies.
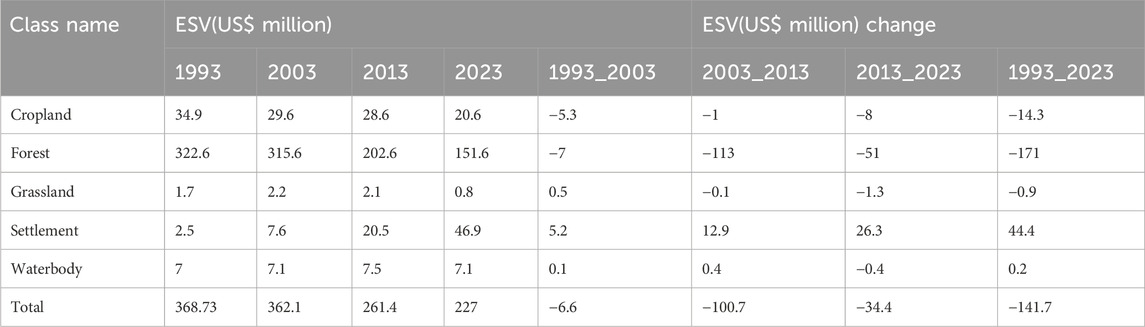
Table 9. ESV estimated for each LULC category and their changes for burayu.
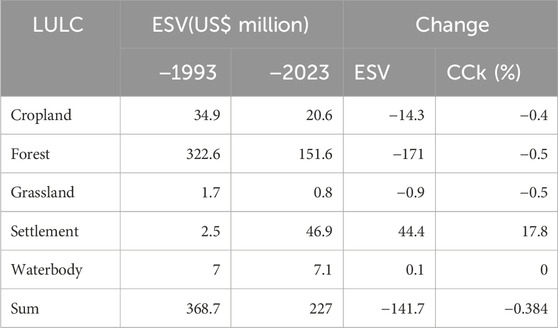
Table 10. Total ecosystem service values estimated for each LULC category and changes of 1993 and 2023 in the study area.
3.6.1 Cropland
The value of cropland has seen a significant decline, dropping from $34.9 million in 1993 to $20.6 million in 2023, a total reduction of $14.3 million (Table 10). This decline can be attributed primarily to urbanization and the conversion of agricultural land for residential and commercial development. As cities expand the demand for housing and infrastructure has led to the repurposing of fertile agricultural lands, which not only decreases the area of cropland but also the associated ecosystem services, such as food production and soil conservation.
3.6.2 Forest
Forest values experienced the most dramatic decline, decreasing from $322.6 million in 1993 to $151.6 million in 2023, amounting to a total loss of $171 million. The steepest drop occurred between 2003 and 2013, indicating potential factors such as deforestation, logging, and land conversion for agriculture or urban development. This extensive loss of forest cover raises serious concerns regarding biodiversity, carbon storage, and overall ecosystem health, highlighting an urgent need for conservation efforts.
3.6.3 Grassland
Grassland values fluctuated slightly, with a decrease from $1.7 million in 1993 to $0.8 million in 2023 (Table 10). Although the reduction is modest, it reflects a broader trend of land use change that affects these ecosystems. Factors such as urban encroachment and the expansion of agricultural lands may have contributed to this decline. Despite their relatively low economic valuation, grasslands provide crucial ecological services, including habitat for wildlife and soil stabilization.
3.6.4 Settlement
Conversely, the value of settlement areas increased dramatically from $2.5 million in 1993 to $46.9 million in 2023, a total increase of $44.4 million. This growth reflects societal trends towards urbanization and population growth, indicating a rising demand for residential and commercial space. While this shift highlights economic development, it also raises concerns about the sustainability of such growth and its impact on surrounding ecosystems.
3.6.5 Waterbody
The value of water bodies remained relatively stable, with minor fluctuations, showing a slight increase from $7.0 million in 1993 to $7.1 million in 2023. This stability may indicate successful management practices or the resilience of these ecosystems, although it is essential to monitor them closely to ensure they continue to provide vital services like water filtration and habitat.
3.6.6 Total Economic Value
Table 10 the total ESV decreased from $368.73 million in 1993 to $227 million in 2023, representing an overall loss of $141.7 million. This decline underscores the cumulative impact of land use changes on ecosystem services. The trends observed in individual land classes indicate a pressing need for integrated land management strategies that balance development with the preservation of essential ecosystem functions. A general decline in ecosystem service values (ESVs) has been observed in various regions, including Malawi (Kindu et al., 2015), the Central Highlands of Ethiopia (Tolessa et al., 2017), the Andassa watershed in Ethiopia (Gashaw et al., 2018; Aneseyee et al., 2019; Makwinja et al., 2021), and in recent studies by Wayesa et al. (2025).
The analysis of ecosystem service values (ESV) in Burayu Sub City highlights the profound ecological impacts of extensive land use changes over the past three decades (Table 11). The significant decline in ESV across various land use categories underscores critical environmental trade-offs associated with rapid urbanization. Notably, the reduction in cropland ESV by 41%, from $34.9 million in 1993 to $20.6 million in 2023, reflects a decrease in food production and the loss of agricultural landscapes that support local livelihoods. This decline raises concerns about food security, as reduced agricultural output may lead to greater reliance on external sources, posing economic challenges.
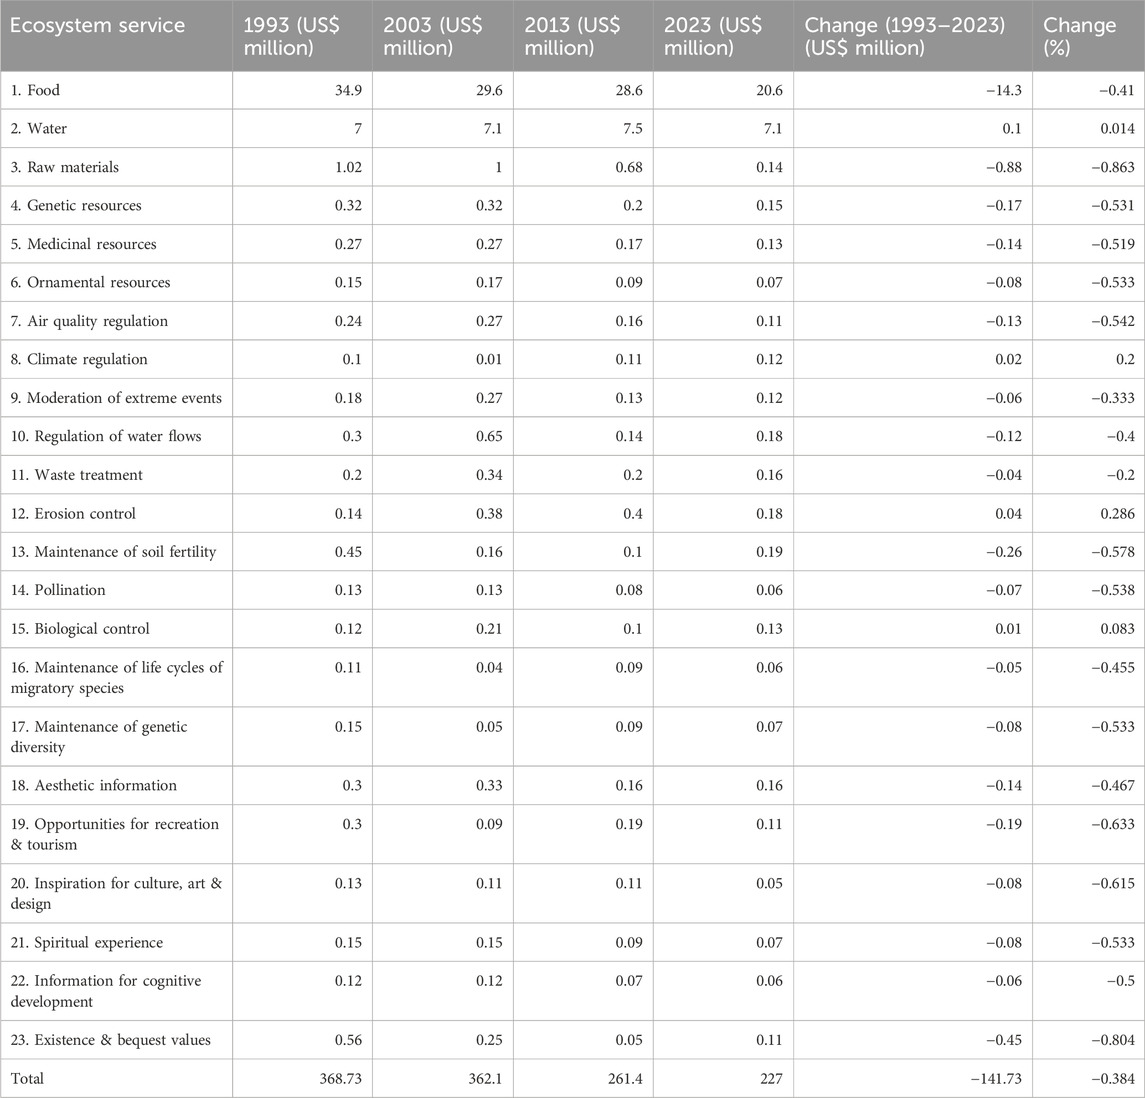
Table 11. Estimated annual value of each ecosystem service (ESVf in US $ million per year).
Forests experienced a dramatic 53% decline in ESV, dropping from $322.6 million to $151.6 million. This loss indicates a troubling trend in resource availability, as forests are crucial for timber, fiber, and essential ecosystem services like carbon sequestration (Table 11). The conversion of these natural areas into urban settlements diminishes resources for future generations and exacerbates climate change by reducing the landscape’s capacity to sequester carbon. Grasslands also saw a substantial reduction in ESV, decreasing by 53%, which impacts supporting services such as soil stability and habitat for various species, compromising local resilience and increasing vulnerability to erosion.
Interestingly, while some cultural services, such as aesthetic appreciation, increased from $2.5 million to $46.9 million, this does not offset the overall loss in ecosystem services. The rise in appreciation for remaining natural landscapes suggests growing public awareness of environmental values, yet the decline in spiritual and religious experiences indicates a loss of cultural heritage linked to natural areas (Table 11). This duality highlights the complex relationship between urban development and cultural identity, as communities struggle to balance these rapid changes. The improved global value coefficients provide a reliable basis for estimating changes in ecosystem services over spatial and temporal scales. Contrary to findings elsewhere, such as those by Mekuria et al. (2021), which indicate a decrease in ecosystem services for food due to wetland reduction, this study assigns high values to remaining ecosystems (Gashaw et al., 2018; Girma et al., 2019; Kindu et al., 2018; De Groot et al., 2020; Amberber et al., 2020; Qiu et al., 2021).
Overall, the total Ecosystem Service Value (ESV) in the study area dropped by 38.4%, from $368.7 million in 1993 to $227 million in 2023 (Table 11). This decline highlights the impact of converting natural landscapes to urban areas, with built-up areas now covering nearly half of the land. The shift in land use favors short-term economic benefits over long-term ecological health. Key drivers of this ESV loss include the significant reduction of forests (53% decline) and grasslands (52% reduction), both linked to the 1,500-ha expansion of urban areas.
The data reveals a significant decline in the total value of ecosystem services in the study area, with a 38.4% reduction over the 30-year period. The most affected services include Food, Existence & Bequest Values, and Opportunities for Recreation & Tourism, which experienced declines of 41%, 80.4%, and 63.3%, respectively. These declines highlight the urgent need for sustainable land management and conservation efforts to restore and protect ecosystem services for future generations.
Similar trends were observed in the Munessa-Shashemene landscape of Ethiopia (Kindu et al., 2016), which shares similar agroecological characteristics with our study area.
Our results align with those of Tolessa et al. (2017), who reported similar trends in ecosystem service valuation in the Ethiopian highlands. However, our estimates for forest ecosystem services were 20% higher, likely due to differences in the valuation methods and the inclusion of additional services such as carbon sequestration.”
In contrast to Mekuria et al. (2021), who focused on arid regions, our study found higher values for water regulation services, reflecting the unique hydrological characteristics of our study area.
3.7 Elasticity of ecosystem services valuation
Cropland showed a significant decline, with a –41.0% change in both 1993 and 2003, followed by further reductions of –28.0% in 2013 and 2023. The CS value decreased from 0.4100 to 0.2800, indicating reduced sensitivity and potential vulnerability of this land cover type (Table 12). This decline may be linked to shifts in agricultural practices, urban encroachment, or land degradation, highlighting the need for sustainable farming methods to maintain productivity and ecosystem health
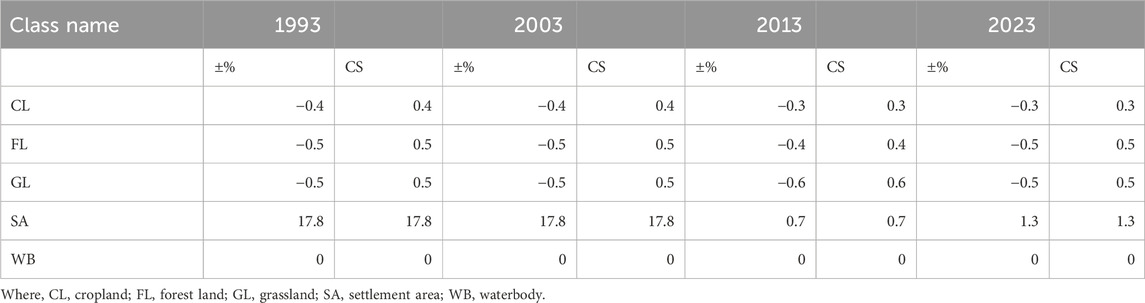
Table 12. Change in total NCV (%) and sensitivity coefficient (CS) after adjusting ESs Values by ±50% for the years 1993–2023.
In contrast, forestland experienced a substantial decline of −53.0% from 1993 to 2003, with consistent decreases of −36.0% in 2013 and -53.0% in 2023. The CS value remained high at 0.5300, suggesting that while forestland is losing area, it remains sensitive to management practices and conservation efforts. This trend emphasizes the need for targeted interventions to combat deforestation and promote reforestation(Table 12).
Grassland exhibited a similar pattern, with changes of −52.9% in both 1993 and 2003, a more drastic decline of −61.0% in 2013, and stabilization at −52.9% in 2023. The CS value increased to 0.6100 during the decline, indicating heightened sensitivity. These fluctuations reflect changing land use practices and challenges in maintaining grassland ecosystems, often threatened by overgrazing and urbanization.
Settlements experienced extraordinary growth, with a +1776.0% increase from 1993 to 2003, maintaining this change in 2003, followed by +66.0% in 2013 and +129.0% in 2023. The CS value rose dramatically from 17.7600 to 1.2900, highlighting the significant impact of urbanization on land use. This rapid expansion indicates a shift towards more developed areas, leading to habitat loss and fragmentation.
Waterbodies showed stable changes of +1.4% across all years, with a consistent CS value of 0.0140, suggesting a stable role in supporting ecosystem services such as habitat provision and water quality regulation.
Overall, the findings indicate that cropland is the most significant contributor to ecosystem services, followed by forestland and grassland. The observed trends underscore the importance of sustainable land management practices to enhance ecosystem service provision in the region. Continuous monitoring and adaptive management strategies are essential to address the challenges posed by land use changes, ensuring the resilience and sustainability of these critical ecosystems. This conclusion aligns with results reported in other studies across various landscapes, as noted by Gaglio et al. (2017) and Tolessa et al. (2021), (Wayesa et al., 2025).
3.8 Discussions
The results of this study reveal significant transformations in land use and land cover (LULC) dynamics in Burayu Sub City from 1993 to 2023, highlighting profound implications for both the environment and local communities. The findings indicate a clear trend of urbanization, characterized by the expansion of settlement areas at the expense of agricultural land, grasslands, and forests. This discussion synthesizes the key insights from the results, contextualizing them within broader environmental and socio-economic frameworks.
Significant landscape changes were observed between 1993 and 2023. In 1993, cropland was the dominant land use, covering 51.2% of the total area. By 2003, cropland had decreased to 43.4%, while settlements expanded to 7.7%. Forests and grasslands experienced slight declines, covering 16% and 31.2%, respectively.
The most significant change occurred in 2013 when settlement areas increased to 20.6%. Although cropland remained the largest land cover at 41.9%, forests declined to 20%, grasslands to 15.6%, and water bodies remained stable at 1.8%. By 2023, settlements became the dominant land use, covering 46.9% of the total area. Meanwhile, cropland, forestland, and grassland declined to 30.3%, 15%, and 6.1%, respectively. Water bodies remained relatively stable covering about 1.7%. These findings indicate a substantial loss of cropland, grassland, and forestland between 1993 and 2023. The results align with previous studies, including Gessesse and Bewket (2014), Bekele et al. (2019), Berihun et al. (2019), and Guyu and Aduwa (2020), which reported significant increases in settlement areas at the expense of cropland and natural landscapes such as forests and grasslands.
Settlement Areas (SA): SA The expansion of settlement areas in Burayu Sub City is significantly correlated with the decline in agricultural land cover over the past 30 years. In 1993, settlements covered a relatively small area of 211.7 ha (2.5%). By 2003, this had increased to 650 ha (7.7%). The growth continued, reaching 1,746.5 ha (20.6%) in 2013 and expanding dramatically to 3,985.6 ha (46.9%) by 2023.
Between 1993 and 2023, a total of 703.02 ha of land were converted into settlement areas Table 13. Similar trends in settlement expansion have been documented in various studies across Ethiopia, including the works of Garedew (2010), Tolessa et al. (2017), Siraj et al. (2018a), Hailu et al. (2020), and Wayesa et al. (2025).
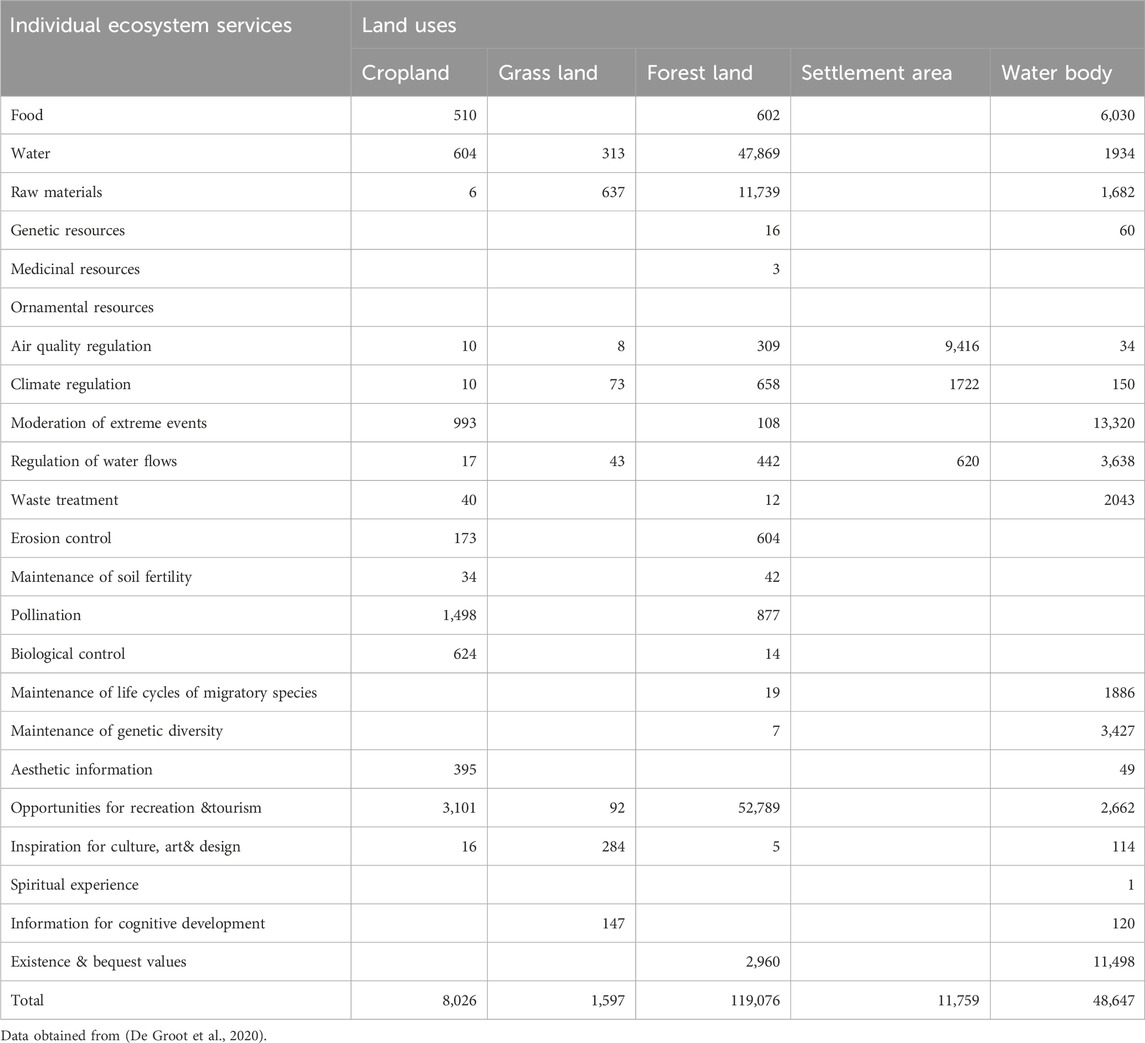
Table 13. Annual value coefficients for ecosystem services (in USD ha−1 year−1).
The LULC matrix analysis highlights significant land use changes in Burayu Sub City from 1993 to 2023, driven primarily by population pressure. This has resulted in substantial tree cutting for firewood and housing, leading to biodiversity loss. Cropland (CL) fell dramatically from 4,342.9 ha to 2,560.1 ha, primarily due to urbanization. Forestland (FL) also decreased sharply from 2,705.2 ha to 1,271.9 ha, raising concerns about biodiversity and ecological functions. Grasslands declined from 1,077 ha–518.3 ha, impacting local ecosystems and soil stability.
Settlement areas expanded dramatically, growing from 211.6 ha in 1993 to 3,982.9 ha in 2023, underscoring the urgent need for integrated land-use planning. In contrast, water bodies (WB) remained stable, suggesting effective management practices.
These findings align with previous studies by Singh et al. (2011), Siraj et al. (2018), Hailu et al. (2020), and Wayesa et al. (2025), which document the decline of cropland in favor of settlement cover. The LULC change matrix illustrates the persistence of certain land use types, indicating a tendency for continued transformation driven by population growth.
LULC change in Burayu Sub City reveals various driving factors contributing to environmental degradation and resource depletion. These changes reflect the socio-economic conditions of the community and are influenced by social practices, cultural factors, and economic elements. Key environmental factors, such as land quality, topography, water availability, and land policy, significantly shape these changes (Tesfaw et al., 2023).
Previous research identifies population growth, land tenure issues, poverty, weak enforcement, limited extension services, and inadequate public awareness as root causes (Ewunetu et al., 2021). Focus group discussions (FGDs) indicate that population pressure, agricultural expansion, and the demand for fuelwood and construction materials are major contributors to LULC dynamics.
The expansion of agricultural land driven by rising population demands has led to urban encroachment into forests, exacerbating LULC changes. Unsustainable farming practices and increasing fuelwood demand have resulted in deforestation and habitat loss (Regasa et al., 2021; Abebe et al., 2022). Infrastructure development further transforms agricultural areas, threatening food security and local livelihoods (Melese, 2016; Wubie et al., 2016).
FGD participants noted that increasing population density heightens the demand for housing and agricultural land, leading to the conversion of forests into farmland. Additionally, farmers feel insecure about their land rights, prompting them to encroach on vegetated areas for cropping and grazing.
4 Conclusions and recommendations
This study analyzed land use and land cover trends, their driving forces, and their impacts on ecosystem services in Burayu Sub City, Shager City, Oromia, Ethiopia, over a 30-year period (1993–2023). Urbanization, driven by population pressure, has led to significant LULC changes, particularly the large-scale conversion of agricultural land into built-up areas. The results indicate substantial LULC changes in that: CL declined from 4,351.8 ha (51.2%) in 1993 to 2,570.3 ha (30.3%) in 2023; FL decreased from 2,709.3 ha (31.9%) to 1,272.9 ha (15%), Grassland shrank from 1,077.8 ha (12.7%) to 518.6 ha (6.1%), whereas SA expanded dramatically from 211.7 ha (2.5%) to 3,985.6 ha (46.9%) over the same period.
The observed changes primarily occurred due to the expansion of settlement areas, driven by a combination of direct and indirect factors. Direct drivers included the expansion of agricultural land, deforestation for fuelwood and charcoal production, infrastructure construction, overgrazing, and the extension of both rural and urban settlements. Indirect drivers included population pressure, policy and institutional factors, income levels, sociocultural influences, and biophysical conditions. These findings were supported by data from household interviews and focus group discussions (FGDs). The study also revealed a 38.4% decline in ecosystem service values over the study period, highlighting the impact of human activities on landscape characteristics and ecosystem services. These results emphasize the importance of considering environmental and ecosystem impacts in local development plans.
To address LULC challenges in Burayu Sub City, authorities should adopt a dynamic land use plan that balances urban growth and ecosystem preservation. Promoting sustainable agriculture, soil conservation training, and enforcing land use regulations are essential to curb land degradation. Utilizing GIS and remote sensing for monitoring, along with prioritizing vertical development, can optimize land use and reduce sprawl. Public awareness initiatives can foster community support for sustainable practices. Further research incorporating socio-economic factors and machine learning is needed to enhance understanding and prediction of LULC changes, supporting more effective urban planning strategies.
Data availability statement
The original contributions presented in the study are included in the article/supplementary material, further inquiries can be directed to the corresponding author.
Ethics statement
The studies involving humans were approved by Ethics approval and consent to participatePermission to collect data was obtained from the Ambo University Institutional Research Ethical Committee (AUIREC) through a written letter with reference number AUIREC/007/13/2021 and the Informants had agreed and signed the informed consent before starting the survey and the interview. The studies were conducted in accordance with the local legislation and institutional requirements. The participants provided their written informed consent to participate in this study.
Author contributions
SM: Supervision, Writing – review & editing. MG: Formal Analysis, Investigation, Writing – original draft. GW: Methodology, Writing – review & editing.
Funding
The author(s) declare that no financial support was received for the research and/or publication of this article.
Conflict of interest
The authors declare that the research was conducted in the absence of any commercial or financial relationships that could be construed as a potential conflict of interest.
Generative AI statement
The author(s) declare that no Generative AI was used in the creation of this manuscript.
Publisher’s note
All claims expressed in this article are solely those of the authors and do not necessarily represent those of their affiliated organizations, or those of the publisher, the editors and the reviewers. Any product that may be evaluated in this article, or claim that may be made by its manufacturer, is not guaranteed or endorsed by the publisher.
Abbreviations
FGD, focus group discussion LULC land use land cover; ESV, Ecosystem service valuation; ERDAS, Earth Resources Data Analysis System; GCPs, ground control points System; KII, key informatics interview; LULC, land use land cover; LULCC, Land use lands cover change.
Footnotes
1Installing ArcGIS Desktop on your computer–ArcMap | Documentation. (n.d.). Available online at: https://desktop.arcgis.com/en/arcmap/latest/get-started/installation-guide/installing-on-your-computer.htm.
References
Abebe, G., Getachew, D., and Ewunetu, A. (2022). Analysing land use/land cover changes and its dynamics using remote sensing and GIS in Gubalafito district, Northeastern Ethiopia. SN Appl. Sci. 4 (1), 30. doi:10.1007/s42452-021-04915-8
Abebe, M. T., Degefu, M. A., Assen, M., and Legass, A. (2022). Dynamics of land use/land cover: implications on environmental resources and human livelihoods in the Middle Awash Valley of Ethiopia. Environ. Monit. Assess. 194 (11), 833. doi:10.1007/s10661-022-10498-7
Admasu, S., Yeshitela, K., and Argaw, M. (2023). Impact of land use land cover changes on ecosystem service values in the Dire and Legedadi watersheds, central highlands of Ethiopia: Implication for landscape management decision making. Heliyon 9 (4). doi:10.1016/j.heliyon.2023.e15352
Alam, A., Bhat, M. S., and Maheen, M. (2019). Using Landsat satellite data for assessing the land use and land cover change in Kashmir valley. GeoJournal 85 (6), 1529–1543. doi:10.1007/s10708-019-10037-x
Amberber, M., Argaw, M., Feyisa, G. L., and Degefa, S. (2020). Status, approaches, and challenges of ecosystem services exploration in Ethiopia: a systematic review. Chin. J. Popul. Resour. Environ. 18 (3), 201–213. doi:10.1016/j.cjpre.2019.07.001
Aneseyee, A. B., Soromessa, T., and Elias, E. (2019). The effect of land use/land cover changes on ecosystem services valuation of Winike watershed, Omo Gibe basin, Ethiopia. Hum. Ecol. Risk Assess. Int. J. 26 (10), 2608–2627. doi:10.1080/10807039.2019.1675139
Ayele, G. T., Demessie, S. S., Mengistu, K. T., Tilahun, S. A., and Melesse, A. M. (2016). “Multitemporal land use/land cover change detection for the Batena watershed, rift valley Lakes basin, Ethiopia,” in Landscape dynamics, soils and hydrological processes in varied climates (Berlin: Springer), 51–72.
Ayele, G. T., Tebeje, A. K., Demissie, S. S., Belete, M. A., Jemberrie, M. A., Teshome, W. M., et al. (2018). Time series land cover mapping and change detection analysis using geographic information system and remote sensing. North. Ethiop. doi:10.1186/s40068-024-00365-4
Bekele, B., Wu, W., and Yirsaw, E. (2019). Drivers of land use-land cover changes in the central rift valley of Ethiopia. Sains Malays. 48 (7), 1333–1345. http://dx.doi.org/10.17576/jsm-2019-4807-03
Belay, A., and Mengistu, D. (2019). Analysis of land use/land cover dynamics and its drivers in the Wabi Shebelle River Basin, Ethiopia. Environ. Syst. Res. 8 (1), 23. doi:10.1016/j.rsase.2019.100249
Belay, T., Melese, T., and Senamaw, A. (2022). Impacts of land use and land cover change on ecosystem service values in the Afroalpine area of Guna Mountain, Northwest Ethiopia. Heliyon 8 (12), e12246. doi:10.1016/j.heliyon.2022.e12246
Berihun, M. L., Tsunekawa, A., Haregeweyn, N., Meshesha, D. T., Adgo, E., Tsubo, M., et al. (2019). Exploring land use/land cover changes, drivers and their implications in contrasting agro-ecological environments of Ethiopia. Land Use Policy 87, 104052. doi:10.1016/j.landusepol.2019.104052
Bikeko, S. S., and E, V. (2024). Land use land cover change as a casual factor for climate variability and trends in the Bilate Watershed, Ethiopia. Environ. Monit. Assess. 196 (12), 1250. doi:10.1007/s10661-024-13435-y
Birhanu, A., and Meseret, D. (2013). Structural soil and water conservation practices in Farta District, North Western Ethiopia: an investigation on factors influencing continued Use. Sci. Technol. Arts Res. J. 2 (4), 114–121. doi:10.4314/star.v2i4.20
Chen, D., and Stow, D. (2002). The effect of training strategies on supervised classification at different spatial resolutions. Photogrammetric Eng. and Remote Sens. 68 (11), 1155–1162.
Congalton, R. G., and Green, K. (2019). Assessing the accuracy of remotely sensed data. USA, CRC Press eBooks. doi:10.1201/9780429052729
Costanza, R., D’Arge, R., De Groot, R., Farber, S., Grasso, M., Hannon, B., et al. (1997). The value of the world’s ecosystem services and natural capital. Nature 387 (6630), 253–260. doi:10.1038/387253a0
Degife, A., Worku, H., Gizaw, S., and Legesse, A. (2019). Land use land cover dynamics, its drivers and environmental implications in Lake Hawassa Watershed of Ethiopia. Remote Sens. Appl. Soc. Environ. 14, 178–190. doi:10.1016/j.rsase.2019.03.005
De Groot, R., Brander, L., and Solomonides, S. (2020). Ecosystem Services Valuation Database (ESVD)-Update of global ecosystem service valuation data. Defra, UK: Department for Environment, Food and Rural Affairs. Available online at: https://www.Es-partnership.Org/wp-content/uploads/2020/08/ESVD_Global-Update-FINAL-Report-June-2020.Pdf.
Dibaba, W. T., Demissie, T. A., and Miegel, K. (2020). Drivers and implications of land use/land cover dynamics in Finchaa Catchment, Northwestern Ethiopia. Land 9 (4), 113. doi:10.3390/land9040113
El-Kawy, O. A., Rød, J., Ismail, H., and Suliman, A. (2010). Land use and land cover change detection in the western Nile delta of Egypt using remote sensing data. Appl. Geogr. 31 (2), 483–494. doi:10.1016/j.apgeog.2010.10.012
ERDAS IMAGINE (2025). Your complete remote sensing solution. Hexagon. Available online at: https://hexagon.com/products/erdas-imagine.
Ewunetu, A., Simane, B., Teferi, E., and Zaitchik, B. F. (2021). Land cover change in the Blue Nile river headwaters: farmers’ perceptions, pressures, and satellite-based mapping. Land (Basel). 10, 68. doi:10.3390/land10010068
Fasika, A., Motuma, T., and Gizaw, T. (2019). Land Use land cover change trend and its drivers in Somodo watershed south western, Ethiopia. Afr. J. Agric. Res. 14, 102–117. doi:10.5897/ajar2018.13672
Free GIS maps (2025). Available online at: https://simplemaps.com/gis/country/et.
Gaglio, M., Aschonitis, V. G., Gissi, E., Castaldelli, G., and Fano, E. A. (2017). Land use change effects on ecosystem services of river deltas and coastal wetlands: case study in Volano–Mesola–Goro in Po river delta (Italy). Wetl. Ecol. Manag. 25, 67–86. doi:10.1007/s11273-016-9503-1
Garedew, E. (2010). Land-use and land-cover dynamics and rural livelihood perspectives, in the semi-arid areas of Central Rift Valley of Ethiopia (Vol. 2010.
Gashaw, T., Tulu, T., Argaw, M., Worqlul, A. W., Tolessa, T., and &Kindu, M. (2018). Estimating the impacts of land use/land cover changes on Ecosystem Service Values: the case of the Andassa watershed in the Upper Blue Nile basin of Ethiopia. Ecosyst. Serv. 31, 219–228. doi:10.1016/j.ecoser.2018.05.001
Genet, A. (2020). Population growth and land Use land cover change Scenario in Ethiopia. Int. J. Environ. Prot. Policy 8 (4), 77. doi:10.11648/j.ijepp.20200804.12
Gessesse, B., and Bewket, W. (2014). Drivers and implications of land Use and land cover change in the central highlands of Ethiopia: evidence from remote sensing and socio-demographic data integration. Ethiop. J. Soc. Sci. Humanit. 10 (2), 1–23.
Girma, Y., Terefe, H., Pauleit, S., and Kindu, M. (2019). Urban green infrastructure planning in Ethiopia: the case of emerging towns of Oromia special zone surrounding Finfinne. J. urban Manag. 8 (1), 75–88. doi:10.1016/j.jum.2018.09.004
Guyu, D. F., and Aduwa, T. A. (2020). Land Use land cover (LULC) change detection using geospatial technique in Anbessa forest, Benishangul-Gumuz region, Ethiopia. Res. Square Res. Square. doi:10.21203/rs.3.rs-29693/v1
Habtamu, M., Elias, E., Argaw, M., and Bulley, H. N. (2023). Effects of land use and landscape position on soil properties in dire watershed, central highlands of Ethiopia. Eurasian Soil Sci. 56 (7), 951–962. doi:10.1134/s1064229322602645
Habte, D. G., Belliethathan, S., and &Ayenew, T. (2021). Evaluation of the status of land use/land cover change using remote
Hailu, A., Mammo, S., and Kidane, M. (2020). Dynamics of land use, land cover change trend and its drivers in Jimma Geneti District, Western Ethiopia. Land Use Policy 99, 105011. doi:10.1016/j.landusepol.2020.105011
Hassen, A., and Assen, M. (2017). Spatial analysis of land use/land cover dynamics and its implications on ecosystem services in the Central Ethiopian Highlands. Remote Sens. Appl. Soc. Environ. 7, 1–12.
Hishe, H., Giday, K., Van Orshoven, J., Muys, B., Taheri, F., Azadi, H., et al. (2021). Analysis of land use land cover dynamics and driving factors in Desa’a forest in Northern Ethiopia. Land use policy 101, 105039. doi:10.1016/j.landusepol.2020.105039
Jensen, J. R. (1995). Introductory digital image processing: a remote sensing perspective. Prentice-Hall.
Kindu, M., Schneider, T., Döllerer, M., Teketay, D., and Knoke, T. (2018). Scenario modelling of land use/land cover changes in Munessa-Shashemene landscape of the Ethiopian highlands. Sci. Total Environ. 622, 534–546. doi:10.1016/j.scitotenv.2017.11.338
Kindu, M., Schneider, T., Teketay, D., and &Knoke, T. (2015). Drivers of land use/land cover changes in Munessa-Shashemene landscape of the south-central highlands of Ethiopia. Environ. Monit. Assess. 187 (7), 452. doi:10.1007/s10661-015-4671-7
Kindu, M., Schneider, T., Teketay, D., and Knoke, T. (2016). Changes of ecosystem service values in response to land use/land cover dynamics in Munessa-Shashemene landscape of the Ethiopian highlands. Sci. Total Environ. 547, 137–147. doi:10.1016/j.scitotenv.2015.12.127
Kuma, H. G., Feyessa, F. F., and Demissie, T. A. (2022). Land-use/land-cover changes and implications in Southern Ethiopia: evidence from remote sensing and informants. Heliyon 8 (3), e09071. doi:10.1016/j.heliyon.2022.e09071
Li, R., Dong, M., Cui, J., Zhang, L.-, Cui, Q., and He, W. (2007). Quantification of the impact of Land-Use changes on ecosystem services: a case study in Pingbian County, China. Environ. Monit. Assess. 128 (1–3), 503–510. doi:10.1007/s10661-006-9344-0
Liu, J., Liu, J., Zhang, Y., Kalantari, M., Shojaei, D., and Marjani, A. M. (2021). Understanding the impacts of land use change on ecosystem services in urbanizing regions: a review. Land Use Policy 104, 105367. doi:10.1016/j.landusepol.2021.105367
Makwinja, R., Kaunda, E., Mengistou, S., and Alamirew, T. (2021). Impact of land use/land cover dynamics on ecosystem service value a case from Lake Malombe, Southern Malawi. Environ. Monit. Assess. 193 (8), 492. doi:10.1007/s10661-021-09241-5
Mekuria, W., Diyasa, M., Tengberg, A., and Haileslassie, A. (2021). Effects of long-term land use and land cover changes on ecosystem service values: an example from the central rift valley, Ethiopia. Land 10 (12), 1373. doi:10.3390/land1012137
Melese, S. M. (2016). Effect of land use land cover changes on the forest resources of Ethiopia. Int. J. Nat. Resour. Ecol. Manag. 1 (2), 51.
Mengist, W., Soromessa, T., and Feyisa, G. L. (2021). Landscape change effects on habitat quality in a forest biosphere reserve: Implications for the conservation of native habitats. J. Clean. Prod. 329, 129778. doi:10.1016/j.jclepro.2021.129778
Meshesha, T. W., Tripathi, S. K., and Khare, D. (2016). Analyses of land use and land cover change dynamics using GIS and remote sensing during 1984 and 2015 in the Beressa Watershed Northern Central Highland of Ethiopia. Model. Earth Syst. Environ. 2 (4), 1–12. doi:10.1007/s40808-016-0233-4
Miheretu, B. A., and Yimer, A. A. (2018). Land use/land cover changes and their environmental implications in the Gelana sub-watershed of Northern highlands of Ethiopia. Environ. Syst. Res 6 (1), 1–12. doi:10.1186/s40068-017-0084-7
Minta, M., Kibret, K., Thorne, P., Nigussie, T., and Nigatu, L. (2017). Land use and land cover dynamics in Dendi-Jeldu hilly-mountainous areas in the central Ethiopian highlands. Geoderma 314, 27–36. doi:10.1016/j.geoderma.2017.10.035
Qiu, H., Hu, B., and Zhang, Z. (2021). Impacts of land use change on ecosystem service value based on SDGs report--Taking Guangxi as an example. Ecol. Indic. 133, 108366. doi:10.1016/j.ecolind.2021.108366
Regasa, M., Nones, M., and Adeba, D. (2021). A review on land use and land cover change in Ethiopian basins. Land 10 (6), 585. doi:10.3390/land10060585
Rwanga, S. S., He, Y., Zhang, L., and Shu, Q. (2017). Evaluating land cover change maps in a complex and fragmented landscape: a case study in Malawi. J. Afr. Earth Sci. 134, 513–523.
Shete, M., Rutten, M., Schoneveld, G. C., and Zewude, E. (2016). Land-use changes by large-scale plantations and their effects on soil organic carbon, micronutrients and bulk density: empirical evidence from Ethiopia. Agric. Hum. values 33, 689–704. doi:10.1007/s10460-015-9664-1
Shiferaw, A., and Singh, K. L. (2011). Evaluating the land Use and land cover dynamics in BorenaWoreda south Wollo highlands, Ethiopia. Ethiop. J. Bus. Econ. (The).).
Simeon, M., and Wana, D. (2024). Impacts of Land Use Land cover dynamics on Ecosystem services in maze national park and its environs, southwestern Ethiopia. Heliyon 10 (9), e30704. doi:10.1016/j.heliyon.2024.e30704
Singh, C. K., Shashtri, S., Mukherjee, S., Kumari, R., Avatar, R., Singh, A., et al. (2011). Application of GWQI to assess effect of land use change on groundwater quality in Lower Shiwaliks of Punjab: remote sensing and GIS based approach. Water Resour. Manag. 25 (7), 1881–1898. doi:10.1007/s11269-011-9779-0
Siraj, M., Zhang, K., and Moges, K. (2018a). Retrospective analysis of land use land cover dynamics using gis and remote sensing in central highlands of Ethiopia. J. Landsc. Ecol. 11 (2), 31–52. doi:10.2478/jlecol-2018-0005
Siraj, M., Zhang, K., Xiao, W., Bilal, A., Gemechu, S., Geda, K., et al. (2018b). Does participatory forest management save the remnant forest in Ethiopia. Proc. Natl. Acad. Sci. India Sect. B Biol. Sci. 88, 1–14. doi:10.1007/s40011-016-0712-4
Solomon, D. (2016). Land use and land cover change dynamics and its implications for food security in Ethiopia. Environ. Syst. Res. 5 (1), 1–14.
Temesgen, H., Wu, W., Shi, X., Yirsaw, E., Bekele, B., and Kindu, M. (2018). Variation in ecosystem service values in an agroforestry dominated landscape in Ethiopia: implications for land use and conservation policy. Sustainability 10 (4), 1126. doi:10.3390/su10041126
Terefe, B., Yirgu, A., and Mulugeta, L. (2017). The role of ecosystem services in sustainable development: a case study from Ethiopia. Ecol. Indic. 75, 185–195. doi:10.1016/j.ecolind.2016.12.059
Tesfaye, W., Elias, E., Warkineh, B., Tekalign, M., and Abebe, G. (2024). Modeling of land use and land cover changes using google earth engine and machine learning approach: implications for landscape management. Environ. Syst. Res. 13 (1), 31. doi:10.1186/s40068-024-00366-3
Tesfaw, B. A., Dzwairo, B., and Sahlu, D. (2023). Assessments of the impacts of land use/land cover change on water resources: Tana Sub-Basin, Ethiopia. J. water clim. chang 14 (2), 421–441. doi:10.2166/wcc.2023.303
Thapa, R. B., and Murayama, Y. (2009). Urban mapping, accuracy, and image classification: a comparison of multiple approaches in Tsukuba City, Japan. Appl. Geogr. 29 (1), 135–144. doi:10.1016/j.apgeog.2008.08.001
Tilahun, A. (2015). Accuracy assessment of land Use land cover classification using google earth. Am. J. Environ. Prot. 4 (4), 193. doi:10.11648/j.ajep.20150404.14
Tolessa, T., Kidane, M., and &Bezie, A. (2021). Assessment of the linkages between ecosystem service provision and land use/land cover change in Fincha watershed, North-Western Ethiopia. Heliyon 7 (7), e07673. doi:10.1016/j.heliyon.2021.e07673
Tolessa, T., Senbeta, F., and Kidane, M. (2017). The impact of land use/land cover change on ecosystem services in the central highlands of Ethiopia. Ecosyst. Serv. 23, 47–54. doi:10.1016/j.ecoser.2016.11.010
Turner, W., Spector, H., and Houghton, R. (2020). The role of land use and land cover change in the global carbon cycle. Glob. Change Biol. 26 (6), 4423–4435. doi:10.1111/gcb.15181
Wang, Y., Liu, J., Zhang, Q., and Velázquez-Rosas, N. (2022). Assessing ecosystem service values in response to land use changes: a case study in the Loess Plateau of China. Sustainability 14 (5), 2881. doi:10.3390/su14052881
Wayesa, G., Kidane, M., Tolessa, T., and Mammo, S. (2025). Impacts of land Use/land cover dynamics on ecosystem services in Jimma Rare District, Western Ethiopia. Sustain. Environ. 11 (1), 2436231. doi:10.1080/27658511.2024.2436231
Wubie, M. A., Assen, M., and Nicolau, M. D. (2016). Patterns, causes and consequences of land use/cover dynamics in the Gumara watershed of Lake Tana basin, Northwestern Ethiopia. Environ. Syst. Res. 5 (1), 8. doi:10.1186/s40068-016-0058-1
Yonaba, R., Koïta, M., Mounirou, L., Tazen, F., Queloz, P., Biaou, A., et al. (2021). Spatial and transient modelling of land use/land cover (LULC) dynamics in a Sahelian landscape under semi-arid climate in northern Burkina Faso. Land Use Policy 103, 105305. doi:10.1016/j.landusepol.2021.105305
Zhang, J., Zhengjun, L., and Xiaoxia, S. (2009). Changing landscape in the Three Gorges Reservoir Area of Yangtze River from 1977 to 2005: land use/land cover, vegetation cover changes estimated using multi-source satellite data. Int. J. Appl. earth observation geoinformation 11 (6), 403–412. doi:10.1016/j.jag.2009.07.004
Keywords: ecosystem valuation, GIS, population growth, proximate causes, urbanization
Citation: Gabisa M, kabite G and Mammo S (2025) Land use and land cover change trends, drivers and its impacts on ecosystem services in burayu sub city, Ethiopia. Front. Environ. Sci. 13:1557000. doi: 10.3389/fenvs.2025.1557000
Received: 07 January 2025; Accepted: 24 March 2025;
Published: 24 April 2025.
Edited by:
Merja H. Tölle, University of Kassel, GermanyReviewed by:
Shetie Gatew, Earth and Environmental Science, EthiopiaTesfaye Tadesse, Bonga University, Ethiopia
Copyright © 2025 Gabisa, kabite and Mammo. This is an open-access article distributed under the terms of the Creative Commons Attribution License (CC BY). The use, distribution or reproduction in other forums is permitted, provided the original author(s) and the copyright owner(s) are credited and that the original publication in this journal is cited, in accordance with accepted academic practice. No use, distribution or reproduction is permitted which does not comply with these terms.
*Correspondence: Siraj Mammo, c2lyYWptYW1tb0BnbWFsLmNvbQ==