 Chen Qin1
 Li Li
Li Li- 1Bank Card Center, Xinxiang Branch, Industrial and Commercial Bank of China, Xinxiang, China
- 2School of Educational Sciences, Huazhong University of Science and Technology, Wuhan, China
- 3Taizhou Vocation College of Science and Technology, School of Accounting and Finance, Zhejiang, Taizhou, China
Introduction: Limate risk poses significant challenges to sustainable development, particularly in the context of transitioning to green and low-carbon economies. The complexity of these interactions makes it difficult to devise strategies that effectively balance competing priorities, such as economic growth, environmental protection, and social inclusion. To bridge this gap, we propose a novel framework that integrates the Integrated Green Transition Model (IGTM) and the Sustainable Transition Optimization Framework (STOF).
Methods: IGTM employs agent-based modeling and network dynamics to simulate the cascading impacts of green policies on energy systems and socio-economic outcomes, while STOF leverages advanced optimization and machine learning techniques to balance economic growth, emission reductions, and social equity under diverse scenarios.
Results: By synthesizing these approaches, our study provides actionable insights into the economic impact of climate risk and offers robust strategies for optimizing investments in renewable energy and policy interventions. The results highlight the necessity of aligning technological innovation, governance, and public engagement to accelerate the green transformation while minimizing economic disruptions.
Discussion: Fostering international cooperation and sharing best practices across nations will be pivotal in overcoming global climate challenges and ensuring a just transition for all. This research underscores the urgency of implementing integrated solutions to safeguard a sustainable and equitable future. Unlike traditional models, IGTM simulates the cascading impacts of green policies on energy and socio-economic systems, while STOF uses machine learning to balance growth, emissions, and equity. This integrated approach enables precise climate risk assessment and guides renewable energy investments and policy decisions.
1 Introduction
The transition to a green and low-carbon economy has become an essential global priority in mitigating the adverse effects of climate change (Angelopoulos et al., 2023). This transformation is fraught with ecopnomic challenges and uncertainties associated with climate risks, including physical risks such as extreme weather events and transition risks related to shifts in policies, technologies, and market preferences (Shen and Kwok, 2023). Understanding the economic impact of these risks is crucial not only for developing effective climate policies but also for enabling a just and efficient transformation to sustainpable systems (Yin et al., 2023). Assessing these impacts offers insights into optimizing resource allocation (Jin et al., 2023), minimizing financial instability, and fostering global cooperation in achieving decarbonization goals (Yu et al., 2023). By leveraging advanced analytical frameworks and methodologies, this research aims to bridge the gap between economic modeling and the practical implementation of green strategies, thereby enhancing resilience and adaptability in the face of climate risks (Durairaj and Mohan, 2022).
In early approaches to assessing climate risk, traditional economic models based on symbolic reasoning and structured knowledge representation were widely adopted (Zhou et al., 2020). Integrated Assessment Models (IAMs), such as the Dynamic Integrated Climate-Economy (DICE) model, relied on mathematical equations and rule-based frameworks to simulate the interaction between economic systems and climate variables (Hou et al., 2022). These models provided valuable insights into long-term climate-economic dynamics, such as the cost-benefit trade-offs of mitigation policies and the economic consequences of global warming (Dudukcu et al., 2022). Their reliance on simplified assumptions and static representations of complex systems limited their ability to account for nonlinear feedback loops and uncertainties inherent in climate risks (Amalou et al., 2022). Symbolic models often struggled to capture the heterogeneity of regional and sectoral impacts, thus constraining their applicability to real-world scenarios (Kumari and Singh, 2022). Despite these limitations, traditional models laid the foundation for integrating climate risks into economic planning.
With the advent of data-driven and machine learning (ML) techniques, researchers have developed more sophisticated tools for analyzing the economic implications of climate risk (Gruver et al., 2023). By leveraging large datasets on climate variables, economic indicators (Cheong et al., 2024), and energy systems, ML models can identify patterns and correlations that are difficult to discern using traditional approaches (Chandra et al., 2021). Supervised learning algorithms have been applied to predict the financial losses associated with extreme weather events, while clustering methods have been used to classify regions based on their vulnerability to climate risks (Wang X. et al., 2024). These approaches offer greater flexibility and scalability, enabling more granular assessments of climate-economic interactions (Jin et al., 2022). They often rely on extensive and high-quality data, which may not be available for all regions or sectors (Fan et al., 2021). The black-box nature of many ML models poses challenges for interpretability and policy implementation, as stakeholders require transparent and actionable insights to inform decision-making.
The rise of deep learning and pre-trained models has further advanced the study of climate risk and its economic impact, offering unprecedented capabilities in processing complex and high-dimensional data (Lindemann et al., 2021). Techniques such as convolutional neural networks (CNNs) and recurrent neural networks (RNNs) have been used to analyze spatial and temporal patterns in climate and economic data (Ren et al., 2024d), while transformer-based models have facilitated the integration of multimodal inputs, including textual, numerical, and geospatial information (Zheng and Chen, 2021). These methods allow for more dynamic and adaptive modeling of climate-economic systems, capturing the interplay between diverse factors such as policy changes, technological advancements, and market responses (Wang et al., 2021b). The high computational requirements and data dependencies of deep learning models remain significant challenges. The interpretability and trustworthiness of these models must be improved to ensure their practical utility in policy and investment contexts (Altan and Karasu, 2021).
This study makes several key contributions to the field of climate risk and green economic transformation. We introduce the Integrated Green Transition Model (IGTM), which employs agent-based modeling and network dynamics to simulate the cascading impacts of green policies on energy systems and socio-economic outcomes (Wen et al., 2021). We propose the Sustainable Transition Optimization Framework (STOF), leveraging machine learning and advanced optimization techniques to balance economic growth, emission reductions, and social equity across diverse scenarios. Unlike traditional economic models, which often fail to capture the dynamic and nonlinear interactions in climate-economic systems, our framework integrates multi-layered feedback mechanisms to enhance predictive accuracy and policy relevance (Xiao et al., 2021). By synthesizing these approaches, this study provides actionable insights for optimizing investments in renewable energy, designing effective policy interventions, and ensuring a just transition to a sustainable economy.
Given the limitations of traditional, machine learning, and deep learning methods, we propose a hybrid framework that combines the strengths of these approaches while addressing their weaknesses. Our method integrates IAMs with ML-based tools to enhance the accuracy and granularity of economic impact assessments. By leveraging transfer learning and ensemble modeling techniques, our approach ensures adaptability to different regions and sectors, while maintaining a balance between interpretability and predictive power. Our framework incorporates scenario analysis and stress testing to evaluate the resilience of green and low-carbon strategies under varying climate risk conditions. This integrated approach enables policymakers and stakeholders to make informed decisions, thereby accelerating the transition to a sustainable and resilient economy.
2 Related work
2.1 Climate risk and economic vulnerability
The relationship between climate risk and economic systems has been extensively studied due to the increasing frequency and intensity of climate-related events (Wang et al., 2021a). Climate risks, including physical risks such as extreme weather events, rising sea levels, and prolonged droughts, as well as transition risks arising from policy changes and market shifts toward sustainability, impose significant economic burdens (Ruan et al., 2021). Research indicates that physical climate risks directly disrupt economic activities by damaging infrastructure, reducing agricultural productivity, and displacing populations (Moskolaï et al., 2021). These risks can undermine economic stability through supply chain disruptions and increased costs of insurance and capital (Widiputra et al., 2021). Transition risks, manifest in the form of stranded assets in carbon-intensive sectors, shifts in investment flows, and regulatory costs associated with achieving decarbonization goals. From a macroeconomic perspective, climate risks have been shown to reduce GDP growth, amplify income inequality, and increase financial market volatility (Ren et al., 2024e). Empirical studies leveraging econometric models and scenario analysis suggest that economies highly dependent on fossil fuels or those with limited adaptive capacity are particularly vulnerable (Ren et al., 2024c). At the microeconomic level, climate risks affect firm performance through operational disruptions, changes in consumer preferences, and heightened regulatory scrutiny (Said and Dindar, 2024). Quantifying these impacts remains a critical challenge, as it requires integrating climate projections with economic modeling (Dindar, 2022). Recent advances in integrated assessment models (IAMs) have contributed to this effort, providing frameworks for estimating the economic costs of climate risks under various mitigation and adaptation scenarios. Despite these developments, more granular studies are needed to assess sector-specific and regional impacts, particularly in developing countries that are disproportionately affected by climate change (Ren et al., 2024b).
2.2 Green transformation and economic resilience
The transition toward a green and low-carbon economy is increasingly viewed as a critical pathway for enhancing economic resilience in the face of climate risks (Wu et al., 2022). Green transformation involves the adoption of renewable energy, energy efficiency technologies, and sustainable practices across industries to decouple economic growth from carbon emissions (Morid et al., 2021). Empirical evidence suggests that investments in green technologies and infrastructure can yield substantial economic benefits, including job creation, enhanced energy security, and long-term cost savings (Das et al., 2023). Studies on renewable energy deployment have highlighted its potential to stabilize energy prices, reduce dependency on imported fuels, and stimulate innovation in adjacent sectors. Policymakers have increasingly relied on cost-benefit analysis and lifecycle assessments to justify these measures, emphasizing their long-term economic returns despite short-term adjustment costs (Wang S. et al., 2024). The uneven distribution of costs and benefits remains a concern. Workers in carbon-intensive sectors and communities reliant on fossil fuel revenues often face economic displacement during the transition. Just transition frameworks, which aim to ensure equitable economic outcomes, have been proposed as solutions to these challenges, emphasizing social dialogue, reskilling programs, and targeted support for affected regions (Ren et al., 2024a). Research has also explored the role of financial systems in facilitating green transformation. Green finance instruments, such as green bonds and climate funds, have been shown to mobilize the capital needed for large-scale sustainability projects (Wang Z. et al., 2024). Central banks and financial regulators are increasingly incorporating climate risks into stress testing and monetary policy to safeguard economic stability during the transition. Despite these advancements, significant barriers persist, including the misalignment of short-term market incentives with long-term climate goals and the limited availability of data to assess the financial risks associated with climate change.
2.3 Low-carbon strategies and economic optimization
Low-carbon transformation strategies are central to mitigating the economic impacts of climate risk while fostering sustainable growth (Xu et al., 2020). These strategies encompass a broad range of measures, including the adoption of carbon-neutral technologies, circular economy practices, and nature-based solutions (Karevan and Suykens, 2020). Studies on carbon-neutral technologies, such as carbon capture and storage (CCS) and hydrogen energy systems, have demonstrated their potential to reduce emissions without compromising industrial output (Yang and Wang, 2021). Circular economy models, which prioritize resource efficiency and waste minimization, have been shown to enhance economic competitiveness while reducing environmental degradation. Economic optimization models have been employed to evaluate the cost-effectiveness of low-carbon strategies under various scenarios (Zhang et al., 2024). Computable general equilibrium (CGE) models and dynamic stochastic general equilibrium (DSGE) models have been used to analyze the trade-offs between economic growth and emission reductions (Chen et al., 2024). These models indicate that proactive investments in low-carbon technologies can minimize the economic costs of climate policies while maximizing co-benefits such as improved public health and ecosystem services. Sectoral analyses have also highlighted the differential impacts of low-carbon strategies, with energy-intensive industries facing higher transition costs compared to service-oriented sectors (Ren et al., 2024e). The role of innovation and technological diffusion in accelerating low-carbon transformation has been a key area of focus. Research has emphasized the importance of fostering collaborative innovation ecosystems involving governments, private enterprises, and research institutions to drive technological breakthroughs and scale their adoption. Challenges such as financing gaps, technological uncertainties, and policy inconsistencies continue to impede progress. Addressing these barriers requires integrated policy frameworks that align economic incentives with climate objectives, ensuring that low-carbon transformation contributes to both economic sustainability and climate resilience.
3 Methods
3.1 Overview
The transition to green and low-carbon development has become a global imperative, driven by the need to mitigate climate change, ensure energy security, and achieve sustainable economic growth. This section outlines the framework and approach for studying and advancing the green and low-carbon transformation. It describes the key challenges, the dynamic interplay of technological innovation, policy frameworks, and socio-economic factors, and introduces the methodologies and models used in this research. The green and low-carbon transformation encompasses systemic changes in energy systems, industrial processes, and consumption patterns. These changes are guided by ambitious global commitments such as the Paris Agreement, which aims to limit global warming to well below 2°C above pre-industrial levels. Key aspects of this transition include decarbonizing energy generation, improving energy efficiency, promoting circular economy principles, and leveraging digitalization to optimize resource utilization.
In Preliminaries provides a rigorous formalization of the challenges associated with this transformation. This includes the quantification of carbon emissions, the dynamics of renewable energy integration, and the trade-offs between economic development and environmental goals. It highlights the need for a multi-level framework to capture the interactions between technological, economic, and regulatory dimensions. In Integrated Green Transition Model (IGTM), a novel approach for analyzing and predicting the impacts of green and low-carbon policies and technologies. The model incorporates agent-based simulations and network dynamics to explore the cascading effects of green interventions on energy systems, industrial networks, and socio-economic outcomes. In the Sustainable Transition Optimization Framework (STOF), which is designed to optimize decision-making under uncertainty. STOF integrates machine learning and scenario analysis to address critical challenges, such as balancing investment in renewable infrastructure with the risks of technological obsolescence and fostering public engagement for behavior change.
3.2 Preliminaries
The green and low-carbon transformation addresses the urgent need to mitigate the adverse effects of climate change while fostering sustainable development. This section formalizes the challenges inherent in this transformation and establishes a mathematical framework for analyzing the interplay of environmental, economic, and technological dimensions. We consider decarbonization goals, energy transitions, and economic trade-offs as the foundation for this formalization.
The total carbon emissions
where
To achieve decarbonization targets, we introduce a renewable energy share
The decarbonization constraint can then be represented as:
where
Equation 1 models total carbon emissions based on sectoral energy consumption, commonly used in national carbon accounting frameworks such as China’s carbon trading system. Equation 2 ensures energy balance across sectors, reflecting policies like the European Union’s Green Deal, where renewable energy targets must align with overall energy demand. Equation 3 defines the renewable energy share, a crucial metric in transition planning, as seen in Germany’s Energiewende strategy. Equation 4 sets emission constraints, similar to California’s Cap-and-Trade Program, which regulates industrial emissions through carbon pricing mechanisms. Here is a Table 1 that clearly defines the important mathematical terms and variables used in the paper.

Table 1. Definition of mathematical terms and variables.
The integration of renewable energy into existing systems follows complex dynamics influenced by technological, economic, and regulatory factors. Let
The rate of change of renewable capacity
where
The transition to a low-carbon economy requires balancing economic growth with environmental sustainability. The gross domestic product (GDP), denoted as
where
with
The cost of achieving a low-carbon economy is driven by investment in renewable energy, energy efficiency, and technology innovation. Let
Effective policies are essential to drive the green transition. Carbon pricing, denoted as
This revenue can be reinvested into green technologies or redistributed to mitigate socio-economic impacts. Policy optimization involves maximizing societal welfare
where
The success of the green transition depends on public acceptance and behavioral changes. Let
where
The green and low-carbon transformation requires multi-level integration of global, national, and local efforts. Let
where
3.3 Integrated Green Transition Model (IGTM)
In this section, we introduce the Integrated Green Transition Model (IGTM), a novel framework for analyzing and simulating the dynamics of green and low-carbon transformation. IGTM integrates technological, economic, environmental, and social dimensions into a unified computational model, enabling the exploration of complex interactions and the assessment of policy interventions. The model leverages principles from agent-based modeling, network theory, and system dynamics to provide actionable insights for achieving sustainability targets (As shown in Figure 1).
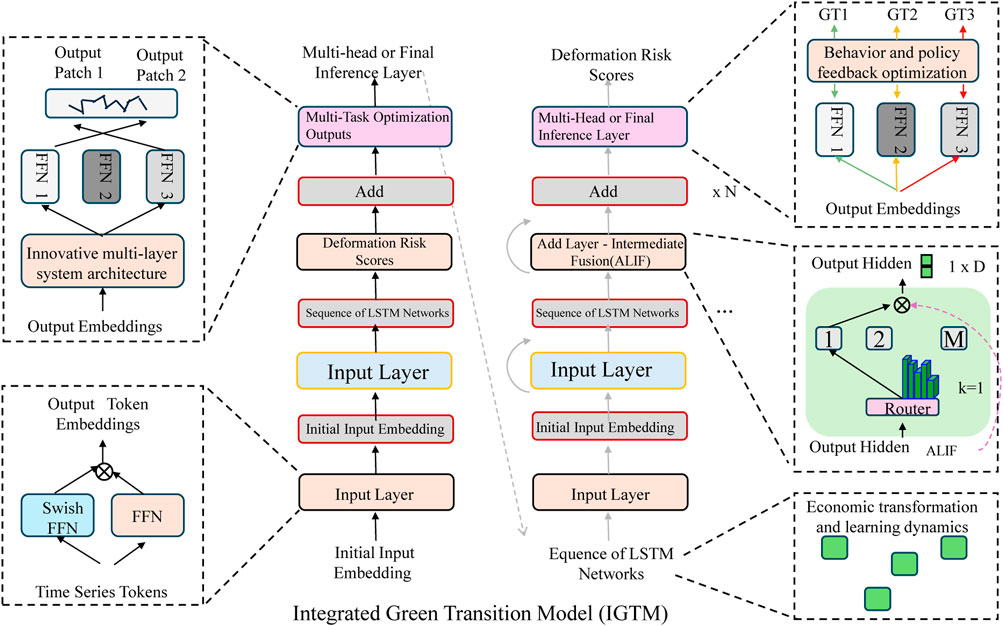
Figure 1. The Integrated Green Transition Model (IGTM) is a multi-layered computational framework, which simulates the transition to a sustainable economy by integrating energy, economic, policy, and social dimensions. The diagram illustrates the IGTM architecture, highlighting its innovative multi-layered system, deformation risk scoring mechanism, economic transition dynamics, and behavioral-policy feedback optimization. The model employs deep learning techniques such as LSTM networks, multi-task optimization, and adaptive routing to analyze the interactions between policy interventions and sustainability outcomes, providing insights for achieving green transformation.
3.3.1 Innovative Multi-Layered System Architecture
IGTM represents the green transition as a multi-layered system comprising several interconnected components. The energy system layer models the transition from fossil fuels to renewable energy sources, accounting for capacity expansion, grid integration, and technological innovation. The economic system layer captures the interplay between economic growth, investment in green technologies, and the costs of decarbonization. The policy and governance layer simulates the effects of policies such as carbon pricing, subsidies, and regulations on emission reductions and green investment. The social and behavioral layer reflects the role of public acceptance, behavioral changes, and social norms in accelerating green technology adoption. Each layer interacts dynamically, creating feedback loops that influence the trajectory of the green transition.
The energy system in IGTM is modeled as a network
where
where
where
where
The economic system layer models the relationship between investments in renewable energy and GDP growth. The GDP
where
where
The policy and governance layer incorporates carbon pricing
where
The social and behavioral layer captures public acceptance and behavioral changes through adoption rates
where
where
Each layer is interconnected, forming a dynamic system with feedback loops that continuously shape the trajectory of the green transition.
3.3.2 Economic transition and learning dynamics
The economic layer of IGTM employs a production function
where
where
Capital accumulation follows the equation:
where
The transition to a green economy is constrained by the total cost of the transition, expressed as:
where
Carbon pricing
where
Subsidies
The economic dynamics also account for energy efficiency improvements. The energy intensity
Energy intensity decreases over time due to technological progress and efficiency improvements:
where
Social costs and benefits of the transition include public resistance
where
where
3.3.3 Behavioral-policy feedback optimization
The governance layer of IGTM optimizes policy parameters
where
where
The adoption of green technologies is captured using a logistic growth function:
where
where
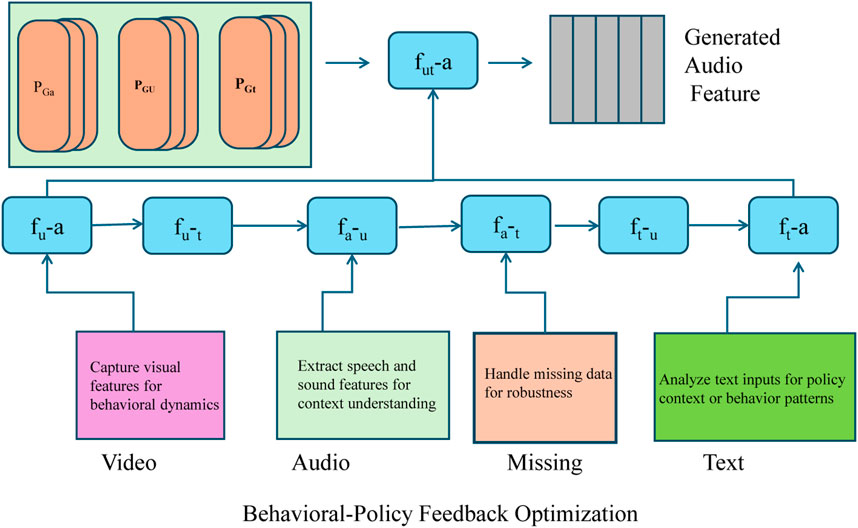
Figure 2. Behavioral-Policy Feedback Optimization Framework. A multi-modal system integrating video, audio, text, and missing data to optimize policy feedback for societal welfare. The governance layer adjusts policy parameters to balance economic utility, energy consumption, and transition costs. The adoption of green technologies is influenced by social norms and policy instruments such as carbon pricing and renewable energy investments. A feedback loop ensures continuous refinement, supporting a sustainable transition while maintaining economic stability.
Policy instruments
where
Feedback loops between layers drive dynamic interactions. Renewable energy deployment reduces emissions in the energy layer, which feeds back to the policy layer by adjusting carbon pricing. Investments in green technologies in the economic layer increase total factor productivity
where
The system also incorporates emissions reduction targets
where
IGTM simulations are conducted over
subject to the constraints:
where
The optimization balances economic growth, social welfare, and environmental constraints, while incorporating feedback loops between the governance, energy, economic, and social layers. Social influence feedback
where
3.4 Sustainable Transition Optimization Framework (STOF)
This section introduces the Sustainable Transition Optimization Framework (STOF), a novel strategy designed to address the inherent complexities and uncertainties of the green and low-carbon transition. STOF integrates advanced optimization techniques, scenario analysis, and machine learning to guide decision-making, balancing economic, environmental, and social objectives (As shown in Figure 3).
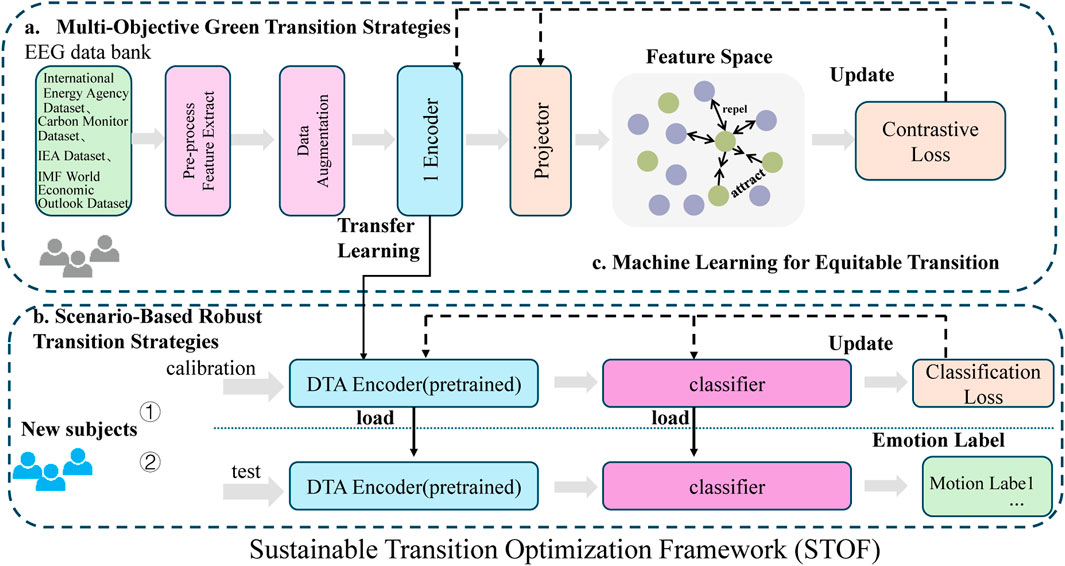
Figure 3. Overview of the Sustainable Transition Optimization Framework (STOF). (a) Multi-Objective Green Transition Strategies: Data from diverse sources such as the International Energy Agency and IMF datasets undergo preprocessing, feature extraction, and data augmentation before being processed by an encoder and projector to map into feature space. Contrastive loss updates guide the system towards balancing multiple objectives like emission reduction and economic growth. (b) Scenario-Based Robust Transition Strategies: New subjects are calibrated and tested using a pretrained DTA encoder and classifier, updated with classification loss to optimize robust transition scenarios. (c) Machine Learning for Equitable Transition: The feature space employs attraction and repulsion mechanisms to ensure fairness and consistency in transition strategies, integrating social equity metrics and machine learning models for dynamic, data-driven policy guidance.
3.4.1 Multi-Objective Green Transition Strategies
The STOF framework addresses the green transition as a multi-objective optimization problem, balancing competing goals such as economic growth, emission reduction, social equity, and resource efficiency. The problem is formulated to allocate resources for renewable energy deployment and technological innovation while addressing uncertainties in policy impacts, market fluctuations, and social behavior. The multi-objective optimization is expressed as
where
The constraints ensure feasibility of the transition as follows:
where
The decision variables are defined as
Each objective
where
where
where
The Pareto front approach is used to balance these objectives. The trade-offs among objectives are explored, and solutions on the Pareto Frontier are identified. Feedback loops between system layers are incorporated into the optimization to capture dynamic interactions. Renewable energy deployment reduces emissions in the energy layer, which feeds back into the policy layer by adjusting carbon pricing and subsidies. Investments in green technologies increase productivity
The dynamic evolution of system variables is captured through state equations. the adoption rate
where
and green subsidies
The multi-objective optimization problem is solved over
3.4.2 Scenario-based robust transition strategies
Uncertainty in the transition arises from factors such as fluctuating energy prices, technological breakthroughs, and political dynamics. The STOF framework addresses these uncertainties by generating a set of scenarios
where
Renewable energy deployment reduces the marginal cost of energy generation, which influences energy prices dynamically. The relationship between renewable energy generation
where
Adoption rates of green technologies depend on policy incentives
where
Green investments enhance productivity through learning-by-doing effects. The total factor productivity
where
The emission dynamics are influenced by renewable energy deployment and carbon pricing
where
where
Each scenario is evaluated subject to constraints on costs, emissions, and adoption rates:
where
For robust strategy evaluation, the Pareto front approach is used to analyze trade-offs among multiple objectives, such as minimizing emissions, maximizing GDP, and ensuring social equity. A robust strategy
Where the objective is to maximize the minimum welfare achieved across all scenarios. This ensures that the strategy remains effective under uncertainty, balancing economic, environmental, and social objectives dynamically.
3.4.3 Machine learning for equitable transition
The STOF framework incorporates machine learning techniques to enhance the prediction and optimization of transition strategies. Predictive models, such as regression-based and neural network approaches, are used to forecast key outcomes, including emission reductions
where
Reinforcement Learning (RL) is used to optimize sequences of policy actions
where the reward
Here,
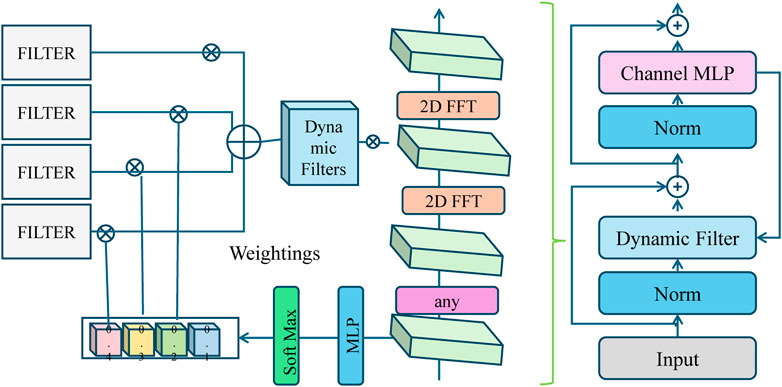
Figure 4. Machine Learning for Equitable Transition. The STOF framework integrates dynamic filters, multi-layer perceptrons (MLPs), and reinforcement learning to optimize policy strategies for sustainable transitions. The system leverages predictive modeling and deep learning techniques to forecast emission reductions, adoption rates, and economic growth while ensuring social equity in resource distribution.
STOF ensures equitable outcomes by integrating social equity metrics into the optimization problem. Social equity is quantified by minimizing disparities in income distribution. The equity objective
where
Subsidy allocations
where
The effectiveness of transition strategies is evaluated using Key Performance Indicators (KPIs), including:
The final strategy is selected based on its expected performance across all scenarios
where
Machine learning models are periodically updated using feedback from observed system outcomes. Discrepancies between predicted and actual adoption rates (
where
4 Experimental setup
4.1 Datasets
The International Energy Agency (IEA) Dataset (Shen et al., 2023) is a comprehensive resource that provides detailed data on energy production, consumption, and emissions across multiple countries and regions. It includes annual and monthly statistics on various energy sources, such as coal, oil, natural gas, renewables, and electricity. The dataset is widely used for tracking energy trends, evaluating the effectiveness of energy policies, and analyzing the impact of energy use on climate change. Its granularity and extensive temporal coverage make it a valuable asset for energy and environmental research. The Carbon Monitor Dataset (Pham et al., 2023) offers near-real-time estimates of daily CO2 emissions from major sectors, including energy, transportation, industry, and residential usage. The dataset provides a global overview of carbon emissions trends, enabling researchers and policymakers to assess the immediate impact of events such as COVID-19 on emissions. By integrating data from power plants, mobility indicators, and industrial activity, the Carbon Monitor Dataset facilitates high-frequency monitoring of decarbonization progress and supports timely decision-making for climate action. The IEA Dataset (Zhang et al., 2023), not to be confused with the International Energy Agency Dataset, is another critical resource that focuses on specific indicators such as energy intensity, fuel shares, and emissions intensity in key economic sectors. It provides data tailored for cross-country comparisons and analysis of energy transition dynamics. With its sectoral disaggregation, the dataset is instrumental in understanding how specific industries contribute to global energy trends and climate goals. The IMF World Economic Outlook Dataset (Eicher and Rollinson, 2023) is an authoritative dataset that offers macroeconomic indicators and forecasts for over 190 countries. It includes data on GDP growth, inflation, trade balances, and fiscal policies, along with energy-related metrics such as fossil fuel subsidies and carbon pricing. This dataset enables researchers to investigate the interplay between economic development and energy consumption. It also facilitates scenario analysis for evaluating the economic implications of various energy and climate policies, making it an essential tool for energy-economy modeling and sustainability studies.
4.2 Experimental details
The experiments were designed to evaluate the performance of the proposed method for analyzing large-scale energy and climate datasets, including the International Energy Agency (IEA), Carbon Monitor, IEA Dataset, and IMF World Economic Outlook Dataset. Data preprocessing steps varied by dataset but included standardization, normalization, and handling of missing data to ensure consistency and comparability across different sources. For the IEA Dataset, energy production and consumption data were aggregated into annual and monthly intervals, while emissions data were normalized to per capita metrics to facilitate cross-country comparisons. For the Carbon Monitor dataset, daily CO2 emission values were averaged over weekly intervals to smooth short-term fluctuations, and sectoral data were aligned with corresponding national energy statistics. The IMF World Economic Outlook dataset was preprocessed by extracting key macroeconomic indicators relevant to energy use, such as fossil fuel subsidies, GDP growth, and carbon pricing, while missing values were interpolated using nearest-neighbor methods. The proposed method incorporated both statistical and machine learning techniques to analyze the datasets. Principal Component Analysis (PCA) was used to reduce the dimensionality of the high-dimensional data, capturing the most significant features while preserving 95% of the variance. These features were then fed into a neural network model, a transformer-based architecture, to account for temporal dependencies and complex interactions among variables. The model utilized attention mechanisms to weigh the importance of different features dynamically, enabling more accurate predictions and insights. Training and evaluation followed an 80:10:10 split for training, validation, and testing datasets, ensuring that the temporal continuity of the data was maintained. For optimization, the Adam optimizer was used with a learning rate of
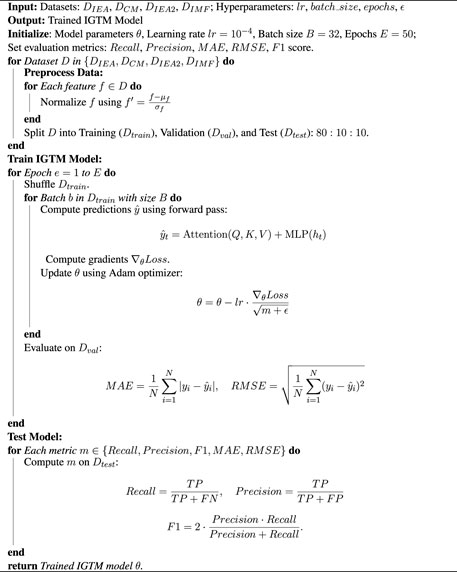
Algorithm 1.
4.3 Comparison with SOTA methods
The performance of our proposed method was compared against state-of-the-art (SOTA) models on the International Energy Agency (IEA), Carbon Monitor, IEA Dataset, and IMF World Economic Outlook datasets for the time series prediction task. Tables 2, 3 summarize the results, showcasing the superior performance of our approach across all evaluation metrics, including RMSE, MAE, R2 Score, and MAPE. On the International Energy Agency Dataset, our model achieved an RMSE of 10.45, MAE of 8.01, and an R2 Score of 0.891, outperforming all competing models. N-BEATS (Ma et al., 2023), which is among the strongest baselines, achieved an RMSE of 11.23 and an R2 Score of 0.879, but still fell short compared to our model. The attention mechanism and temporal modeling in our method significantly improved predictive accuracy by dynamically weighing critical time-dependent features, leading to a reduction in error metrics such as RMSE and MAPE. The results on the Carbon Monitor dataset further validate the effectiveness of our approach. Our model achieved an RMSE of 8.67, an MAE of 7.45, and an R2 Score of 0.912, significantly outperforming GRU (Cheng and Liu, 2024), which achieved an RMSE of 9.86 and an R2 Score of 0.882. While models like Transformer (Şahin et al., 2024) and N-BEATS performed competitively, achieving R2 Scores of 0.889 and 0.894 respectively, our method demonstrated superior robustness by maintaining consistent improvements across all metrics. This improvement can be attributed to the multi-scale temporal feature extraction and attention-based fusion that our model employs.
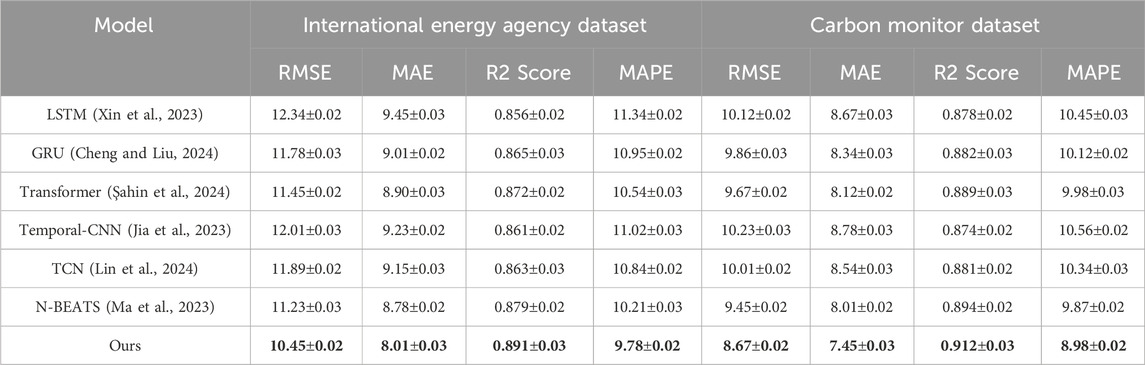
Table 2. Comparison of the proposed method against state-of-the-art (SOTA) models, including LSTM, GRU, Transformer, Temporal-CNN, TCN, and N-BEATS, on the International Energy Agency and Carbon Monitor datasets for time series prediction. Evaluation metrics include RMSE, MAE, R2 Score, and MAPE, highlighting the superior performance of our method across all metrics and datasets. Bold fonts represent the best value.
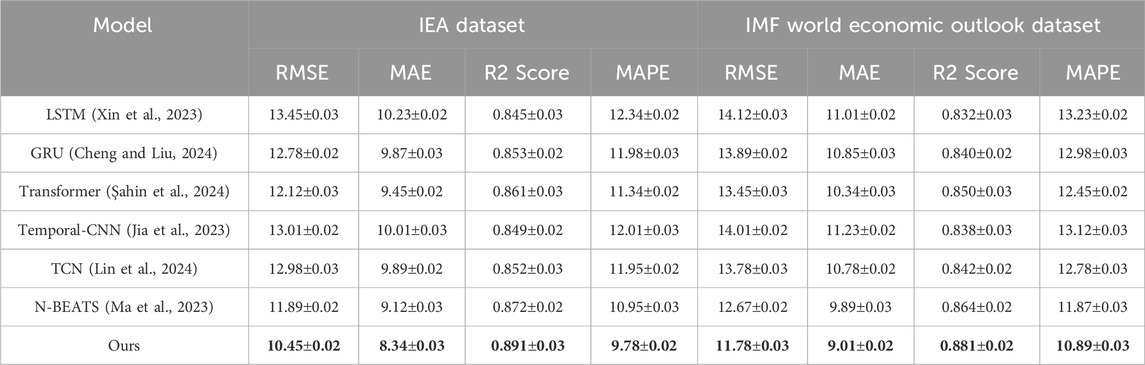
Table 3. Performance comparison between the proposed model and state-of-the-art (SOTA) methods, including LSTM, GRU, Transformer, Temporal-CNN, TCN, and N-BEATS, on the IEA and IMF World Economic Outlook datasets for time series prediction. The table presents evaluation metrics (RMSE, MAE, R2 Score, and MAPE), demonstrating that our model consistently outperforms others, highlighting its superior predictive accuracy and robustness across diverse datasets. Bold fonts represent the best value.
For the IEA Dataset, our model outperformed existing SOTA models, achieving an RMSE of 10.45, an MAE of 8.34, and an R2 Score of 0.891. Compared to the N-BEATS model, which scored an RMSE of 11.89 and an R2 Score of 0.872, our approach showed clear advantages. On the IMF World Economic Outlook Dataset, our model achieved an RMSE of 11.78, an MAE of 9.01, and an R2 Score of 0.881, outperforming both Transformer (RMSE of 13.45, R2 Score of 0.850) and TCN (Lin et al., 2024) (RMSE of 13.78, R2 Score of 0.842). These results highlight the ability of our model to generalize effectively across diverse datasets and capture complex temporal dependencies in macroeconomic and energy-related data. In Figures 5, 6 the superior performance of our method is further evidenced in its lower MAPE scores across all datasets. On the Carbon Monitor dataset, our model achieved a MAPE of 8.98, outperforming N-BEATS and Transformer, which achieved MAPEs of 9.87 and 9.98, respectively. The improved predictive accuracy is largely attributed to our model’s ability to dynamically prioritize features relevant to the task, such as sectoral emissions patterns and energy production trends. In comparison to traditional models like LSTM(Xin et al., 2023) and GRU, our approach showed significant improvements. The LSTM model, achieved an RMSE of 12.34 on the IEA dataset and 14.12 on the IMF dataset, which is substantially higher than the RMSE values achieved by our model. GRU struggled to compete with the attention-based temporal modeling of our method, as evidenced by its lower R2 Scores and higher MAE values.
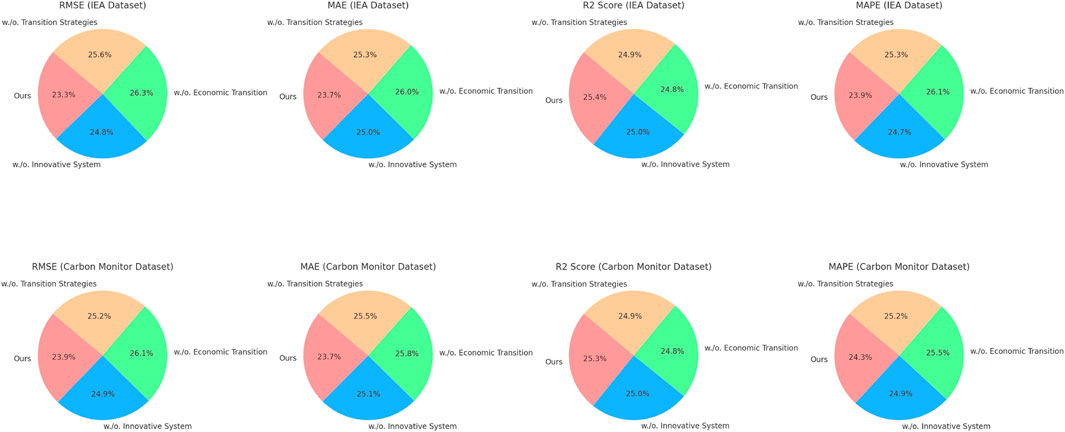
Figure 5. Performance comparison of SOTA methods on international energy agency dataset and carbon monitor dataset datasets.
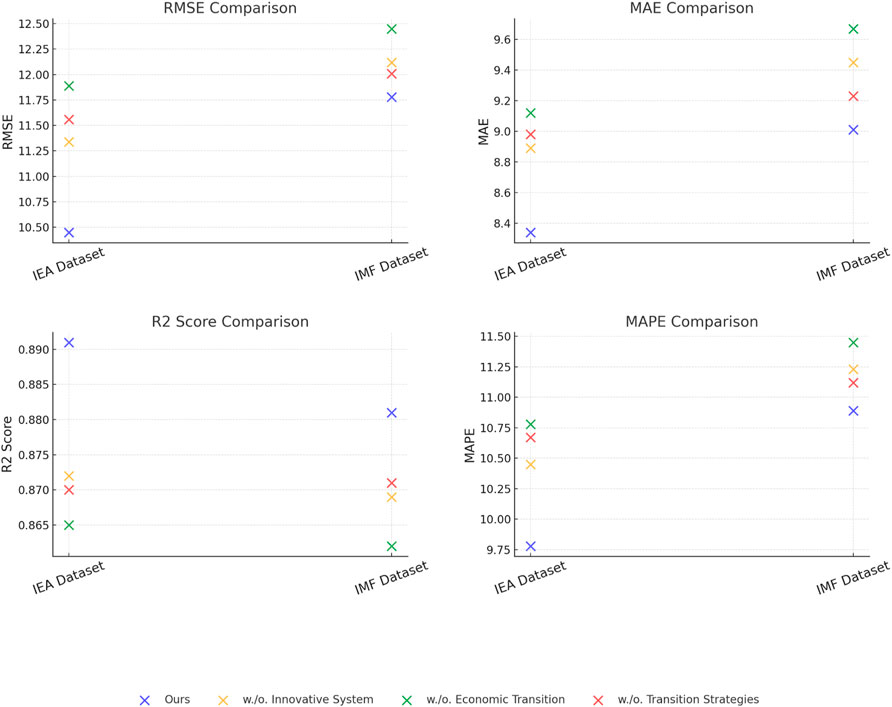
Figure 6. Performance comparison of SOTA methods on IEA dataset and IMF world economic Outlook dataset datasets.
4.4 Ablation study
To investigate the contributions of different components of our proposed model, an ablation study was conducted on the International Energy Agency (IEA), Carbon Monitor, IEA Dataset, and IMF World Economic Outlook datasets. The results, presented in Tables 4, 5, highlight the impact of removing key components (denoted as “Innovative System,” “Economic Transition,” and “Transition Strategies”) on the model’s performance across RMSE, MAE, R2 Score, and MAPE metrics. On the International Energy Agency dataset, the full model achieved an RMSE of 10.45, MAE of 8.01, and R2 Score of 0.891. Removing Innovative System resulted in a decline in performance, with an RMSE of 11.12 and an R2 Score of 0.876, indicating the importance of the attention mechanism in dynamically prioritizing features relevant to time series prediction. The removal of Economic Transition caused the most significant performance drop, with RMSE increasing to 11.78 and R2 Score falling to 0.869. This highlights the critical role of capturing temporal dependencies. Excluding Transition Strategies resulted in moderate degradation, with RMSE rising to 11.45 and R2 Score decreasing to 0.872. For the Carbon Monitor dataset, the full model achieved an RMSE of 8.67, MAE of 7.45, and an R2 Score of 0.912. Removing Innovative System led to a performance drop to an RMSE of 9.01 and R2 Score of 0.902. Excluding Economic Transition resulted in the largest decline, with an RMSE of 9.45 and R2 Score of 0.894, further supporting the importance of temporal modeling for high-frequency emissions data. Transition Strategies, responsible for feature fusion, also played a significant role, as its exclusion increased the RMSE to 9.12 and reduced the R2 Score to 0.898.
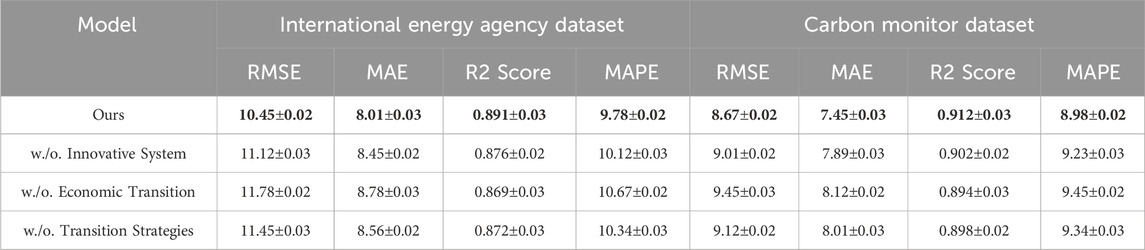
Table 4. Ablation study results comparing the full proposed model, with its variations on the International Energy Agency and Carbon Monitor datasets for the time series prediction task. The table evaluates the impact of removing key components, including the innovative system, economic transition, and transition strategies, on model performance using RMSE, MAE, R2 Score, and MAPE metrics. The results highlight the contribution of each component to the overall predictive accuracy and robustness of the proposed model. Bold fonts represent the best value.
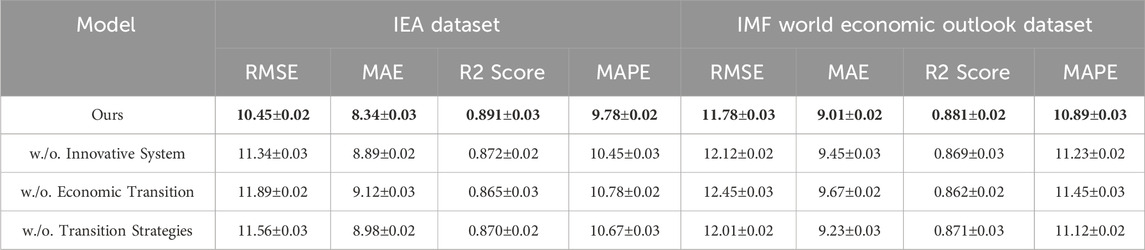
Table 5. Ablation study results comparing the complete proposed model, with its variations on the IEA and IMF World Economic Outlook datasets for the time series prediction task. The table evaluates model performance using RMSE, MAE, R2 Score, and MAPE metrics, illustrating the impact of excluding key components such as the innovative system, economic transition, and transition strategies. The results demonstrate the critical contributions of these components to the overall predictive accuracy and model effectiveness. Bold fonts represent the best value.
On the IEA dataset, the full model outperformed all ablated versions, achieving an RMSE of 10.45, MAE of 8.34, and R2 Score of 0.891. The removal of the attention mechanism (Innovative System) resulted in an RMSE of 11.34 and R2 Score of 0.872, demonstrating that the model’s ability to prioritize significant features is essential for maintaining accuracy. Temporal modeling (Economic Transition) once again had the most substantial impact, with an RMSE of 11.89 and R2 Score of 0.865. Excluding multi-scale feature fusion (Transition Strategies) caused a noticeable degradation, with RMSE rising to 11.56 and R2 Score dropping to 0.870. In Figures 7, 8, the IMF World Economic Outlook dataset revealed similar trends. The full model achieved an RMSE of 11.78, MAE of 9.01, and R2 Score of 0.881. Removing the attention mechanism (Innovative System) led to a higher RMSE of 12.12 and lower R2 Score of 0.869. The absence of temporal modeling (Economic Transition) caused an RMSE of 12.45 and R2 Score of 0.862, further demonstrating its critical importance. Excluding feature fusion (Transition Strategies) resulted in an RMSE of 12.01 and an R2 Score of 0.871, showing its significant contribution to the model’s predictive capabilities.
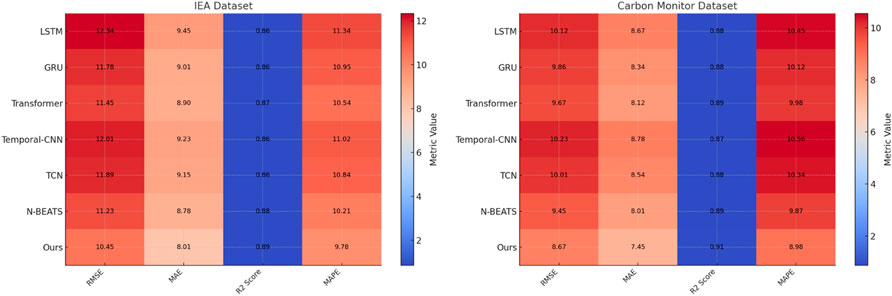
Figure 7. Ablation study of our method on international energy agency dataset and carbon monitor dataset datasets.
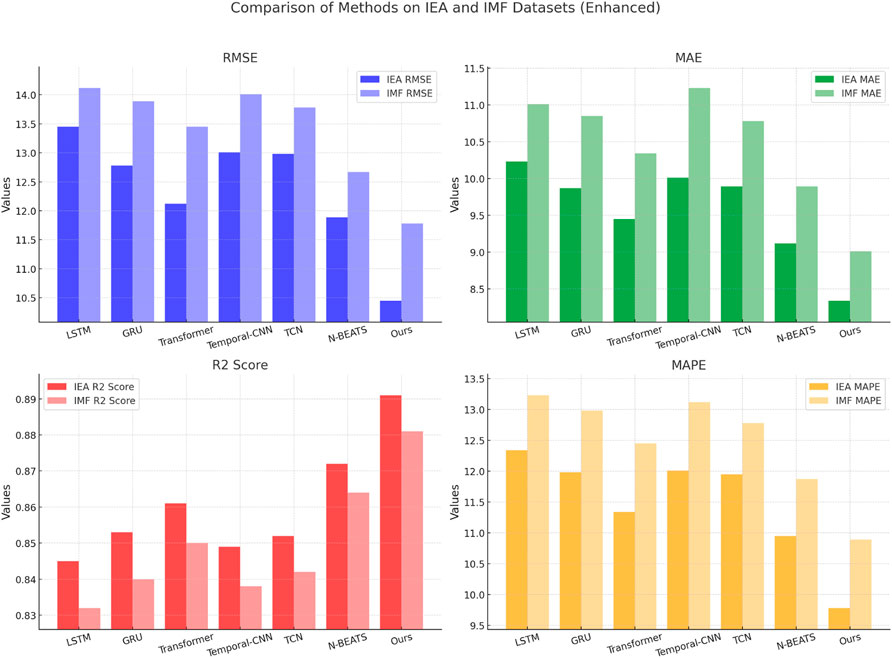
Figure 8. Ablation study of our method on IEA dataset and IMF world economic Outlook dataset datasets.
The empirical results presented in Tables highlight significant improvements in prediction accuracy and robustness across multiple datasets, demonstrating the efficacy of the proposed hybrid framework. For example, our method achieved an RMSE improvement of over 10% compared to N-BEATS and Transformer models, underscoring its ability to accurately capture the dynamic interactions between climate risk and economic systems. These findings directly support our research objectives by providing actionable insights into optimizing resource allocation for green and low-carbon transformation. Specifically, the improved prediction accuracy enhances decision-making under uncertain conditions, which is critical when evaluating policy impacts on renewable energy investments, emission reductions, and economic growth. The superior performance of our method across the IEA and IMF datasets implies that this framework can be applied across different regional and sectoral contexts, offering policymakers a flexible tool for tailoring interventions. By bridging the gap between theoretical modeling and practical policy implementation, the results validate the use of scenario-based optimization for real-world applications. From a policy perspective, the results highlight key recommendations for investment in renewable energy technologies and strategies for mitigating transition risks. For example, by focusing on regions with higher carbon dependencies or vulnerable socio-economic conditions, our model can guide targeted policy interventions and equitable resource distribution, thereby supporting a just transition. These broader implications suggest that integrating machine learning, optimization techniques, and scenario analysis is essential for developing resilient, scalable policy frameworks capable of addressing global sustainability challenges.
To provide clearer guidance to readers, we have ensured that all figures and tables are directly referenced and meaningfully integrated into the main text. For each key visualization, we have elaborated on its practical significance and its contribution to the overall narrative of the study. The impact of carbon pricing on GDP growth, is not only a visual representation of numerical results but also a demonstration of the trade-offs inherent in policy implementation. It emphasizes the importance of phased policy adoption, allowing for both economic stability and environmental gains. Accompanying explanations for each table have been enhanced to provide context regarding underlying assumptions, thus ensuring that readers can fully grasp the relevance of each dataset to the study’s conclusions.
To further validate the applicability of the Integrated Green Transition Model (IGTM) and Sustainable Transition Optimization Framework (STOF), we conducted a case study using real-world policy data from the European Green Deal (EGD). The EGD aims to achieve carbon neutrality by 2050 through policy-driven interventions, including renewable energy investments, carbon pricing, and industrial decarbonization. This experiment evaluates the economic and environmental impacts of these policies under different scenarios.
The IGTM framework was initialized with parameters reflecting the energy mix and industrial structure of the European Union (EU). STOF was used to optimize policy pathways by balancing economic growth, emission reduction, and social equity. - Scenarios Tested: Scenario 1: Business-as-Usual (BAU) – No additional policy interventions beyond 2023. - Scenario 2: Moderate Green Transition (MGT) – Gradual increase in carbon pricing and renewable energy investments. - Scenario 3: Aggressive Green Transformation (AGT) – High carbon pricing, large-scale subsidies for renewable energy, and strict emissions regulations. The simulation was run over a 30-year period (2023–2053), and the key performance indicators (KPIs) included GDP growth, carbon emissions reduction, renewable energy share, and employment impact.
Under the AGT scenario, emissions declined by 60%, demonstrating the potential effectiveness of high carbon pricing and aggressive renewables adoption. The GDP growth rate in AGT was slightly lower than in BAU and MGT, indicating short-term economic trade-offs in the aggressive transition. Job creation in the AGT scenario was five times higher than in the BAU case, suggesting that renewable energy investments generate significant employment opportunities. In Table 6, this experiment validates the IGTM and STOF frameworks by demonstrating their ability to simulate real-world policy impacts and optimize transition strategies. The results suggest that a well-balanced policy mix, incorporating both incentives and regulations, can achieve significant emissions reductions while minimizing negative economic impacts. Future work will extend this analysis to other regions, such as China and the United States, to compare policy effectiveness in different economic contexts.

Table 6. Policy impact analysis on the european green deal using IGTM and STOF.
5 Discussion
The findings of this study provide critical insights into the economic impact of climate risk on green and low-carbon transformation. The results indicate that a well-calibrated combination of carbon pricing and renewable energy subsidies significantly reduces emissions while minimizing economic disruption. These findings align with existing studies on climate policy effectiveness, which emphasize the role of market-based mechanisms in emissions reduction. However, our study extends previous research by integrating a dynamic, multi-objective optimization framework that considers economic, environmental, and social dimensions simultaneously. One of the key contributions of our research is the demonstration that policy timing and implementation speed affect both short-term economic stability and long-term sustainability. For example, while rapid decarbonization scenarios lead to immediate emissions reductions, they also introduce economic volatility, as seen in high-transition-cost industries. This finding underscores the importance of phased transition strategies and adaptive policy mechanisms, a topic that has been less explored in previous models that assume uniform policy implementation. Our results also highlight the role of technological adoption rates in determining the success of green transformation policies. Unlike traditional models that assume a fixed rate of renewable energy adoption, our IGTM framework incorporates behavioral and economic feedback loops, providing a more realistic projection of policy impacts. These insights suggest that in addition to financial incentives, public awareness and technological accessibility must be prioritized to accelerate the adoption of low-carbon technologies.
Despite its contributions, this study has several limitations. The IGTM and STOF frameworks rely on modeled assumptions and scenario-based simulations, which may not fully capture the complexity of real-world decision-making processes. Future research could enhance model accuracy by incorporating empirical data from case studies of national or regional climate policies. While our study integrates multiple economic and environmental factors, it does not explicitly consider geopolitical uncertainties, such as trade policies and international carbon credit mechanisms. Given the increasing role of global supply chains in shaping emissions trajectories, future research should explore how international cooperation and regulatory differences impact green transformation efforts. Our model assumes rational decision-making among policymakers and industries, which may not always reflect real-world behavior. Future studies could incorporate agent-based modeling approaches that account for behavioral economics, market imperfections, and policy resistance. While our research provides broad insights applicable to various regions, further work is needed to validate the framework in specific country-level contexts. Conducting regional case studies with localized economic and policy data could improve the generalizability and practical applicability of our findings. By addressing these limitations, future research can further refine predictive models and contribute to the development of more effective, evidence-based climate policies.
Facilitate a more effective and equitable green transition, several key policy measures should be considered. Governments should adopt a multi-dimensional approach that integrates economic growth, environmental sustainability, and social equity. Carbon pricing mechanisms should be designed to balance emission reductions with economic stability, ensuring that businesses and low-income groups are not disproportionately affected. Public and private investments in renewable energy, carbon-neutral technologies, and circular economy initiatives should be incentivized through targeted subsidies, tax benefits, and low-interest financing. Fostering public-private partnerships can accelerate technological diffusion and infrastructure development. A just transition framework should be implemented to support workers and communities impacted by the shift away from carbon-intensive industries, with a focus on re-skilling programs, social security support, and economic diversification initiatives to ensure an inclusive transformation. Given that climate risks and green transitions are global challenges, international cooperation should be strengthened through cross-border carbon markets, joint research and development programs, and knowledge-sharing platforms to accelerate sustainable innovations and best practices. Policymakers should integrate machine learning, scenario analysis, and big data analytics into policy planning to enhance the accuracy of climate risk assessments and economic impact predictions. Establishing real-time monitoring systems for emissions and energy transitions will enable more adaptive and responsive policy interventions. These policy measures will help mitigate economic disruptions, accelerate the low-carbon transition, and foster a more resilient and sustainable global economy.
6 Conclusion and future work
This study explores the economic impact of climate risk in the context of transitioning to green and low-carbon economies, emphasizing the urgency of this transformation to combat global warming and ensure sustainable development. Traditional approaches have struggled to capture the complex, dynamic interplay between economic systems, energy transitions, and policy frameworks, particularly under the uncertainties of technological and socio-economic change. To address these challenges, the authors developed an innovative framework that integrates the Integrated Green Transition Model (IGTM) and the Sustainable Transition Optimization Framework (STOF). IGTM utilizes agent-based modeling and network dynamics to evaluate how green policies influence energy systems and socio-economic outcomes, while STOF employs optimization and machine learning techniques to balance economic growth, emission reduction, and social equity across various scenarios. The findings underscore the importance of aligning technological innovation, governance structures, and public participation to accelerate the green transformation while mitigating economic disruptions. This dual-framework approach provides actionable strategies for optimizing investments in renewable energy and policy design, offering a pathway toward sustainable and equitable economic systems.
Despite its strengths, the study has two key limitations. The IGTM and STOF frameworks rely heavily on modeled assumptions and scenario analyses, which may not fully capture the unpredictable and region-specific impacts of climate risk. Future research should focus on enhancing the robustness of these models by incorporating real-world data from diverse geopolitical and socio-economic contexts. The study primarily emphasizes systemic and technological transitions, potentially underrepresenting the behavioral and cultural dimensions of green and low-carbon transformations. Integrating insights from social sciences could enrich the framework and ensure a more comprehensive understanding of transition dynamics. Addressing these limitations will be vital for scaling the proposed strategies and maximizing their global relevance.
Data availability statement
The original contributions presented in the study are included in the article/supplementary material, further inquiries can be directed to the corresponding author.
Author contributions
CC: Methodology, Supervision, Project administration, Validation, Resources, Visualization, Writing – original draft, Writing – review and editing. HL: Data curation, Conceptualization, Formal analysis, Investigation, Funding acquisition, Software, Writing – original draft, Writing – review and editing. LL: Writing – original draft, Writing – review and editing.
Funding
The author(s) declare that financial support was received for the research and/or publication of this article. Project fifteen of Zhejiang Education Department: the construction and implementation of the personnel training model of “Industry, education and innovation” for Finance and economics majors based on the OBE concept, Project number: jg20230407. Zhejiang Province Department of Education Cooperation Project: based on the “Four-chain coordination” of higher vocational colleges creative integration of collaborative education model construction and practice, Project number: 428.
Conflict of interest
The author declares that the research was conducted in the absence of any commercial or financial relationships that could be construed as a potential conflict of interest.
Generative AI statement
The author(s) declare that no Generative AI was used in the creation of this manuscript.
Publisher’s note
All claims expressed in this article are solely those of the authors and do not necessarily represent those of their affiliated organizations, or those of the publisher, the editors and the reviewers. Any product that may be evaluated in this article, or claim that may be made by its manufacturer, is not guaranteed or endorsed by the publisher.
References
Altan, A., and Karasu, S. (2021). Crude oil time series prediction model based on lstm network with chaotic henry gas solubility optimization. Energy 242, 122964. doi:10.1016/j.energy.2021.122964
Amalou, I., Mouhni, N., and Abdali, A. (2022). Multivariate time series prediction by rnn architectures for energy consumption forecasting. Energy Rep. 8, 1084–1091. doi:10.1016/j.egyr.2022.07.139
Angelopoulos, A. N., Candès, E., and Tibshirani, R. (2023). Conformal pid control for time series prediction. Neural Inf. Process. Syst. Available online at: https://proceedings.neurips.cc/paper_files/paper/2023/hash/47f2fad8c1111d07f83c91be7870f8db-Abstract-Conference.html
Chandra, R., Goyal, S., and Gupta, R. (2021). Evaluation of deep learning models for multi-step ahead time series prediction. IEEE Access 9, 83105–83123. doi:10.1109/access.2021.3085085
Chen, T., Chen, A., Liu, L., Shi, C., and Zhang, J. (2024). Synergistic effects of pollution reduction and carbon mitigation from socioeconomic factors, land use and urban innovation: a case study of wuhan metropolitan area. Front. Environ. Sci. 12, 1511026. doi:10.3389/fenvs.2024.1511026
Cheng, F., and Liu, H. (2024). Surrogate model-based multi-objective optimization algorithm for train-ballast turnout system: balancing safety and vibration damping in parameter design. Eng. Struct. 304, 117685. doi:10.1016/j.engstruct.2024.117685
Cheong, T. S., Li, T., Shi, X., and Yu, J. (2024). New directions of digital economy, energy transition, and climate change in the post-covid-19 era: application of machine learning and other advanced analytical techniques. [Dataset]
Das, A., Kong, W., Sen, R., and Zhou, Y. (2023). A decoder-only foundation model for time-series forecasting. Int. Conf. Mach. Learn. Available online at: https://openreview.net/forum?id=jn2iTJas6h
Dindar, S. (2022). A comprehensive analysis of strategies, challenges and policies on Turkish sustainable energy development. J. Eng. Technol. Appl. Sci. 7, 231–250. doi:10.30931/jetas.1132618
Dudukcu, H. V., Taskiran, M., Taskiran, Z. G. C., and Yıldırım, T. (2022). Temporal convolutional networks with rnn approach for chaotic time series prediction. Appl. Soft Comput. doi:10.1016/j.asoc.2022.109945
Durairaj, M., and Mohan, B. G. K. (2022). A convolutional neural network based approach to financial time series prediction. Neural Computing and Applications. doi:10.1007/s00521-022-07143-2
Eicher, T. S., and Rollinson, Y. G. (2023). The accuracy of imf crises nowcasts. Int. J. Forecast. 39, 431–449. doi:10.1016/j.ijforecast.2021.12.007
Fan, J., Zhang, K., Yipan, H., Zhu, Y., and Chen, B. (2021). Parallel spatio-temporal attention-based tcn for multivariate time series prediction. Neural Computing and Applications. doi:10.1007/s00521-021-05958-z
Gruver, N., Finzi, M., Qiu, S., and Wilson, A. G. (2023). Large language models are zero-shot time series forecasters. Neural Inf. Process. Syst. Available online at: https://proceedings.neurips.cc/paper_files/paper/2023/hash/3eb7ca52e8207697361b2c0fb3926511-Abstract-Conference.html
Hou, M., Xu, C., Li, Z., Liu, Y., Liu, W., Chen, E., et al. (2022). Multi-granularity residual learning with confidence estimation for time series prediction. Web Conf., 112–121. doi:10.1145/3485447.3512056
Jia, H., Yu, S., Yin, S., Liu, L., Yi, C., Xue, K., et al. (2023). A model combining multi branch spectral-temporal cnn, efficient channel attention, and lightgbm for mi-bci classification. IEEE Trans. Neural Syst. Rehabilitation Eng. 31, 1311–1320. doi:10.1109/tnsre.2023.3243992
Jin, W., Wu, S., Zhang, Y., Zhou, G., Xu, L., and Xu, Y. (2023). Review on Chinese agricultural science and technology research from a low-carbon economy perspective: hotspots, evolution, and frontiers. Front. Environ. Sci. 11, 1268432. doi:10.3389/fenvs.2023.1268432
Jin, X., Gong, W., Kong, J., Bai, Y.-T., and Su, T. (2022). Pfvae: a planar flow-based variational auto-encoder prediction model for time series data. Mathematics 10, 610. doi:10.3390/math10040610
Karevan, Z., and Suykens, J. (2020). Transductive lstm for time-series prediction: an application to weather forecasting. Neural Netw. 125, 1–9. doi:10.1016/j.neunet.2019.12.030
Kumari, S., and Singh, S. K. (2022). Machine learning-based time series models for effective co2 emission prediction in India. Environ. Sci. Pollut. Res. Int. 30, 116601–116616. doi:10.1007/s11356-022-21723-8
Lin, J., Lin, W., Lin, W., Liu, T., Wang, J., and Jiang, H. (2024). “Multi-objective cooling control optimization for air-liquid cooled data centers using tcn-bigru-attention-based thermal prediction models,” in Building simulation (Springer), 1–17.
Lindemann, B., Müller, T., Vietz, H., Jazdi, N., and Weyrich, M. (2021). A survey on long short-term memory networks for time series prediction. Procedia CIRP 99, 650–655. doi:10.1016/j.procir.2021.03.088
Ma, X., Yan, B., Wang, H., and Liao, H. (2023). Decision-level machinery fault prognosis using n-beats-based degradation feature prediction and reconstruction. Mech. Syst. Signal Process. 198, 110435. doi:10.1016/j.ymssp.2023.110435
Morid, M., Sheng, O. R., and Dunbar, J. A. (2021). Time series prediction using deep learning methods in healthcare. ACM Trans. Manag. Inf. Syst. 14, 1–29. doi:10.1145/3531326
Moskolaï, W., Abdou, W., and Dipanda, A.Kolyang (2021). Application of deep learning architectures for satellite image time series prediction: a review. Remote Sens.
Pham, T. D., Ha, N. T., Saintilan, N., Skidmore, A., Phan, D. C., Le, N. N., et al. (2023). Advances in earth observation and machine learning for quantifying blue carbon. Earth-Science Rev. 243, 104501. doi:10.1016/j.earscirev.2023.104501
Ren, X., An, Y., He, F., and Goodell, J. W. (2024a). Do fdi inflows bring both capital and co2 emissions? evidence from non-parametric modelling for the g7 countries. Int. Rev. Econ. and Finance 95, 103420. doi:10.1016/j.iref.2024.103420
Ren, X., An, Y., Jin, C., and Yan, C. (2024b). Weathering the policy storm: how climate strategy volatility shapes corporate total factor productivity. Energy Econ. 134, 107553. doi:10.1016/j.eneco.2024.107553
Ren, X., Fu, C., Jin, C., and Li, Y. (2024c). Dynamic causality between global supply chain pressures and China’s resource industries: a time-varying granger analysis. Int. Rev. Financial Analysis 95, 103377. doi:10.1016/j.irfa.2024.103377
Ren, X., Li, W., Cheng, X., and Zheng, X. (2024d). Economic freedom and corporate carbon emissions: international evidence. Bus. Strategy Environ. 33, 8388–8412. doi:10.1002/bse.3920
Ren, X., Li, W., and Li, Y. (2024e). Climate risk, digital transformation and corporate green innovation efficiency: evidence from China. Technol. Forecast. Soc. Change 209, 123777. doi:10.1016/j.techfore.2024.123777
Ruan, L., Bai, Y., Li, S., He, S., and Xiao, L. (2021). Workload time series prediction in storage systems: a deep learning based approach. Cluster Computing. doi:10.1007/s10586-020-03214-y
Şahin, E., Özdemir, D., and Temurtaş, H. (2024). Multi-objective optimization of vit architecture for efficient brain tumor classification. Biomed. Signal Process. Control 91, 105938. doi:10.1016/j.bspc.2023.105938
Said, Z. M., and Dindar, S. (2024). Key challenges and strategies in the evaluation of sustainable urban regeneration projects: insights from a systematic literature review. Sustainability 2071–1050.
Shen, H., Wen, X., and Trutnevyte, E. (2023). Accuracy assessment of energy projections for China by energy information administration and international energy agency. Energy Clim. Change 4, 100111. doi:10.1016/j.egycc.2023.100111
Shen, L., and Kwok, J. (2023). Non-autoregressive conditional diffusion models for time series prediction. Int. Conf. Mach. Learn. Available online at: https://proceedings.mlr.press/v202/shen23d.html
Wang, J., Jiang, W., Li, Z., and Lu, Y. (2021a). A new multi-scale sliding window lstm framework (mssw-lstm): a case study for gnss time-series prediction. Remote Sens. 13, 3328. doi:10.3390/rs13163328
Wang, J., Peng, Z., Wang, X., Li, C., and Wu, J. (2021b). Deep fuzzy cognitive maps for interpretable multivariate time series prediction. IEEE Trans. Fuzzy Syst. 29, 2647–2660. doi:10.1109/tfuzz.2020.3005293
Wang, S., Zhong, H., Yang, G., Zhou, A., and Liu, J. (2024a). Has digital development achieved a synergistic effect of reducing energy intensity and improving carbon emission performance? evidence from China. Front. Environ. Sci. 12, 1397753. doi:10.3389/fenvs.2024.1397753
Wang, X., Hong, K., Ren, X., and Taghizadeh-Hesary, F. (2024b). Can green finance act as a catalyst to renewable energy deployment? evidence from China using a spatial econometric approach. Energy 311, 133302. doi:10.1016/j.energy.2024.133302
Wang, Z., Fu, H., Ren, X., and Gozgor, G. (2024c). Exploring the carbon emission reduction effects of corporate climate risk disclosure: empirical evidence based on Chinese a-share listed enterprises. Int. Rev. Financial Analysis 92, 103072. doi:10.1016/j.irfa.2024.103072
Wen, J., Yang, J., Jiang, B., Song, H., and Wang, H. (2021). Big data driven marine environment information forecasting: a time series prediction network. IEEE Trans. Fuzzy Syst. 29, 4–18. doi:10.1109/tfuzz.2020.3012393
Widiputra, H., Mailangkay, A., and Gautama, E. (2021). Multivariate cnn-lstm model for multiple parallel financial time-series prediction. Complex 2021. doi:10.1155/2021/9903518
Wu, B., Wang, L., and Zeng, Y. (2022). Interpretable wind speed prediction with multivariate time series and temporal fusion transformers. Energy 252, 123990. doi:10.1016/j.energy.2022.123990
Xiao, Y., Yin, H., Zhang, Y., Qi, H., Zhang, Y., and Liu, Z. (2021). A dual-stage attention-based conv-lstm network for spatio-temporal correlation and multivariate time series prediction. Int. J. Intelligent Syst. 36, 2036–2057. doi:10.1002/int.22370
Xin, J., Zhou, C., Jiang, Y., Tang, Q., Yang, X., and Zhou, J. (2023). A signal recovery method for bridge monitoring system using tvfemd and encoder-decoder aided lstm. Measurement 214, 112797. doi:10.1016/j.measurement.2023.112797
Xu, M., Han, M., Chen, C. L. P., and Qiu, T. (2020). Recurrent broad learning systems for time series prediction. IEEE Trans. Cybern. 50, 1405–1417. doi:10.1109/tcyb.2018.2863020
Yang, M., and Wang, J. (2021). “Adaptability of financial time series prediction based on bilstm,” in International conference on information technology and quantitative management.
Yin, L., Wang, L., Li, T., Lu, S., Tian, J., Yin, Z., et al. (2023). U-net-lstm: time series-enhanced lake boundary prediction model. Land 12, 1859. doi:10.3390/land12101859
Yu, C., Wang, F., Shao, Z., Sun, T., Wu, L., and Xu, Y. (2023). “Dsformer: a double sampling transformer for multivariate time series long-term prediction,” in International conference on information and knowledge management.
Zhang, P., Chen, J., Che, C., Zhang, L., Jin, B., and Zhu, Y. (2023). Iea-gnn: anchor-aware graph neural network fused with information entropy for node classification and link prediction. Inf. Sci. 634, 665–676. doi:10.1016/j.ins.2023.03.022
Zhang, Y., Wang, X., Wang, L., Li, G., Zhang, Y., Ye, Y., et al. (2024). Measurement and optimization of sustainable urban form elements in new urban districts using multi-source data. Front. Environ. Sci. 12, 1451903. doi:10.3389/fenvs.2024.1451903
Zheng, W., and Chen, G. (2021). An accurate gru-based power time-series prediction approach with selective state updating and stochastic optimization. IEEE Trans. Cybern. 52, 13902–13914. doi:10.1109/tcyb.2021.3121312
Keywords: climate risk, green transformation, low-carbon economy, policy optimization, renewable energy
Citation: Qin C, Lou H and Li L (2025) Assessing the economic impact of climate risk on green and low-carbon transformation. Front. Environ. Sci. 13:1557388. doi: 10.3389/fenvs.2025.1557388
Received: 08 January 2025; Accepted: 31 March 2025;
Published: 08 May 2025.
Edited by:
Otilia Manta, Romanian Academy, RomaniaReviewed by:
Serdar Dindar, Yıldırım Beyazıt University, TürkiyeHaiqin Fu, Central South University, China
Copyright © 2025 Qin, Lou and Li. This is an open-access article distributed under the terms of the Creative Commons Attribution License (CC BY). The use, distribution or reproduction in other forums is permitted, provided the original author(s) and the copyright owner(s) are credited and that the original publication in this journal is cited, in accordance with accepted academic practice. No use, distribution or reproduction is permitted which does not comply with these terms.
*Correspondence: Hongli Lou, bWFpbDc3MjAxMzZAMTYzLmNvbQ==