 Yunfan Chu
 Yijing Du
 Yuetao Yang
- 1Business School, Jiangsu University of Science and Technology, Zhangjiagang, China
- 2Yangtze River Delta Social Development Research Center, Jiangsu University of Science and Technology, Zhangjiagang, China
Inclusive green growth, as a form of green and shared growth, is an important way to promote the realization of the common prosperity of all people. As an emerging trade model, digital trade has had a profound impact on sustainable development and has become an important driving force for promoting inclusive green growth. Based on the panel data of 31 provinces in China from 2014 to 2021, this study introduces two research methods, EWM- TOPSIS and panel regression model, and utilizes the analysis of transmission mechanism and heterogeneity to deeply explore the impact of digital trade on inclusive green growth and its intrinsic mechanism under the perspective of spatial correlation. The results show that: (1) Digital trade effectively promotes inclusive green growth, and this conclusion is verified to be robust by excluding extreme values, and adding control variables. (2) Mechanism testing shows that digital trade can promote green and inclusive growth by optimizing the industrial structure. (3) Heterogeneity tests show that the enabling effect of digital trade is more pronounced in the eastern, central and western regions of China and at the 25%, 50% and 75% quintiles of inclusive green growth. Therefore, it is of great significance to use digital trade in the future to coordinate the development of inclusive green growth in various provinces and regions by optimizing the industrial structure, and to enhance the overall level of inclusive green growth and sustainable economic development.
1 Introduction
Inclusive Green Growth (IGG) is a globally recognized issue aimed at achieving a win-win situation between economic growth and environmental sustainability, and ensuring that all social groups can share the fruits of economic development (Fan et al., 2023). The Chinese government has proposed to strive for the highly planned development goal of “promoting green growth and promoting harmonious coexistence between humans and nature” in the future. Because research on green growth helps promote the transformation of China’s economic growth mode, when economic goals change, the traditional extensive economic growth mode is unsustainable, and achieving inclusive green growth has become the due meaning of high-quality economic development (Ibrahim et al., 2024; Yin et al., 2024). Inclusive green growth is a global issue, it requires joint efforts from all countries. Green growth is a global issue that requires As one of the largest developing countries in the world, China adheres to the development concepts of innovation, coordination, green, openness, and sharing, and is committed to achieving the goal of “common prosperity”. Therefore, inclusive green growth, as a sustainable development model that focuses on the dual issues of “non-green” production and “non-inclusive” society while economic growth, is an inevitable choice for China to promote inclusive green development and stimulate economic development (Chen et al., 2023; Zhou, 2022). By strengthening international cooperation and exchanges, China can learn from international advanced experience and technology, and jointly promote the global green growth process, thereby broadening the path of Lucid waters and lush mountains are invaluable assets (Ulucak, 2020). With the accelerated development of digital technology, digital trade has achieved a leapfrog development, which has had a profound impact on the global economy and green growth level (Li et al., 2024).
With the deepening of economic globalization, digital trade has gradually become a new engine to promote economic globalization and inclusive growth, and a new driving force to stimulate green development potential. On the one hand, as a new form of socio-economic and international trade, digital trade plays a crucial role in upgrading the level of innovation and promoting the benefits of development. Specifically, digital trade has accelerated the widespread application of digital technology globally and stimulated its sustained innovation vitality, giving rise to a series of emerging economic formats such as intelligent manufacturing, digital services, and cross-border e-commerce. The vigorous rise of these emerging industries has injected new vitality and growth points into the global economy, further promoting the diversification and sustainable development of the global economy. At the same time, digital trade effectively addresses the issue of market information asymmetry, enhances people’s practice of low-carbon concepts, and promotes the green transformation of enterprise production, thereby promoting the overall level of green and sustainable development in multiple dimensions, and ensuring the widespread sharing and deep utilization of economic development dividends (Yang et al., 2021). On the other hand, digital trade allocates digital economic resources on a global scale, thus reshaping the global digital economy industry chain and supply chain (Gao et al., 2024). The development of digital trade deepens the specialized division of labor within the industrial chain, broadens the diverse channels for commodity sales, and enables countries to seek the most suitable positioning in various links of the industrial chain based on their unique competitive advantages, thereby achieving closer and more efficient international cooperation and coordinated development (Zhang and Zhang, 2024).
The rapid development of digital trade is sparking heated discussions on its promoting effects. However, the existing literature focuses on the impact of digital trade on economic growth, industrial structure upgrading, and other aspects, with less attention paid to its empowering effects on inclusive green growth. So, will digital trade promote inclusive green growth? If the empowerment effect exists, what are the specific transmission mechanisms? Attempting to answer the above questions not only expands the research on the relationship between digital trade and inclusive green growth, but also has significant implications for the transformation of China’s economic growth model and the promotion of sustainable development to a certain extent. Therefore, this study aims to construct an inclusive green growth indicator system based on international comparability and Chinese reality. Entropy-based weighting method and TOPSIS are used to calculate the weights and indices of China’s inclusive green growth and digital trade indicators. Meanwhile, the methods of spatial correlation analysis and quantile analysis are introduced to further analyze the spatial heterogeneity and quantile heterogeneity of China’s inclusive green growth. This study is intended to provide a reference for improving the level of inclusive green growth in China and internationally. Therefore, the study has important theoretical value and practical significance.
Compared with the existing research, the contributions of this paper are as follows: Firstly, a multidimensional systematic examination of the impact of digital trade on inclusive green growth. Although the existing literature has combed the research status of digital trade and inclusive green growth level, most of them focus on one of them or one aspect of the impact of digital trade on inclusive green growth, lacking a systematic examination. This study not only comprehensively reviews the research status of digital trade and inclusive green growth, but also deeply analyzes their actual essence and their impacts on multiple levels such as society, economy, and technology. At the same time, multi-dimensional indicators have been constructed to comprehensively examine how digital trade gradually promotes the transition of inclusive green growth from simple growth to deep upgrading, and from quantitative increase to qualitative improvement. Secondly, the multi-analytical perspective discusses the influence channel. This study adopts various research methods, such as qualitative analysis, quantitative analysis, comparative research, et al., to conduct an in-depth analysis and interpretation of reasonable digital trade and inclusive green growth indicators. Simultaneously emphasizing the applicability and generalizability of the conclusions, making the research results more universal and applicable. Thirdly, there is little direct discussion on the impact of digital trade on inclusive green growth in terms of research content. In addition, the comprehensive effects of digital trade as a determinant of green growth have not received sufficient attention and exploration in previous research. Unlike existing literature, this study adopts a panel two-way fixed effects model to study the impact of digital trade on the level of local inclusive green growth, which not only focuses on the growth of economic aggregates, but also on the quality, sustainability, and broader benefits of growth to the society.
2 Literature review
As there is a close relationship between digital trade, inclusive green growth and industrial structure, this paper will conduct a literature review on these aspects and develop research hypotheses based on them.
As an emerging global trade model, digital trade can promote the free flow and efficient allocation of key elements such as global capital, technology, talent, knowledge and data, expand economies of scale and scope effects, and thus promote the overall growth of the global economy. The impact of digital trade on sustainable development has been recognized by countries all over the world, and the research on related issues has become a hot topic recently, causing unprecedented attention (Wang and Huang, 2025) The relationship between inclusive green growth and the Sustainable Development Goals (SDGs) has also been widely discussed. The SDGs emphasize sustainable development in the three dimensions of economy, society and environment, and inclusive green growth is a concrete embodiment of this concept. Its core idea is to promote the harmonious coexistence and sustainable development of economy, society and environment (Gupta and Vegelin, 2016; Morton et al., 2017). Therefore, in recent years, more and more scholars have studied the relationship between digital trade and inclusive green growth. The relevant research is mainly reflected in three aspects: digital trade, inclusive green growth, and the impact of digital trade on inclusive green growth.
Digital trade shows the close integration of information technology and modern trade, has significantly changed the global trade methods, products, services and regulatory framework, and has led to a complete digital transformation of trade forms (Zhang et al., 2025). Regarding the research on digital trade, the current academic literature on the subject focuses on digital trade measurements and its driving factors, such as digital trade and innovation, supply-side structural reform, economic integration, digital transformation, green development, global value chains, and industrial transformation, Fang et al. (2023); Kan et al. (2022); Yan and Liu (2024). At the macro level, digital trade can contribute to the reconstruction of the global value chain (Liu et al., 2024; Wang and Chu, 2024; Zhao and Gao, 2024), enhance the promotion of digital service exports (Jiang et al., 2023), the level of national digital economy development, and the scale of international trade (Boikova et al., 2021; Zhang and Duan, 2023). At the meso level, digital trade can improve the efficiency of technological innovation (Su et al., 2021), promote low-carbon technological innovation (He and Xie, 2022), and promote national carbon emission reduction (Ji et al., 2023; Shi et al., 2024; Wang et al., 2022). At the micro-level, digital trade can improve production efficiency and resource utilization efficiency (Liu et al., 2023a; Zhu et al., 2023), optimize industrial structure (Staiger, 2021), and reduce production and transaction costs for enterprises (Abeliansky and Hilbert, 2017).
Inclusive green growth in 2012 was first proposed at the Rio+20 Summit (Cao, 2022), with the aim of combining the interests of industrialized countries with green growth and inclusive growth in developing countries. Research on inclusive green growth has been explored by academics mainly at two levels: level measurement and influencing factors. In terms of level measurement, the existing literature mainly adopts the multi-indicator comprehensive evaluation method to measure the level of inclusive green growth in Ethiopia by constructing an indicator system (Albagoury, 2016) from the dimensions of inclusive growth and green development. In terms of influencing factors, policies and regulations are important factors affecting inclusive green growth (Ren et al., 2022). The state guides enterprises and individuals to adopt green and sustainable production and consumption methods by formulating and implementing environmental regulations, industrial policies, and technological innovation policies, Aminata et al. (2022). These policies encourage enterprises to increase investment in green technology research and development, improve resource utilization efficiency, reduce environmental pollution, and thus affect the level of inclusive green growth (Ben Lahouel et al., 2023; Latini et al., 2022). The optimization of energy structure and the strengthening of environmental regulations also have a significant impact on inclusive green growth. The adoption of sustainable energy supply methods can effectively reduce the level of environmental pollution from economic activities and further promote green sustainable development (Chen et al., 2024; Yu and Liu, 2024). At the same time, the development concept, technical level, management ability and other factors of enterprises will also affect the realization of inclusive green growth. Forward-looking enterprises will actively adopt advanced production technologies and management methods to improve resource utilization efficiency and reduce environmental pollution, thus realizing green growth (Suriyankietkaew et al., 2022; Wu et al., 2023; Zhao et al., 2023). Corporate social responsibility also has an impact on inclusive green growth. By actively participating in environmental protection activities, enterprises can promote the transformation and upgrading of production methods and business models, and realize a win-win situation of economic benefits and environmental protection, thus further enhancing the level of inclusive green growth (Ma and Lin, 2023).
As for the impact of Digital trade on inclusive green growth, academia has made preliminary exploration. Digital trade breaks the geographical restrictions of traditional trade, making it easier for small and medium-sized enterprises and enterprises in less developed regions to enter the international market (Afolalu and Tsoeu, 2025), thus promoting the inclusive growth of the global economy. Digital trade takes data as the key factor of production, takes digital services as the core, and uses technologies such as the Internet and big data to promote the digitization and intellectualization of trade processes (Le, 2025), simplify trade processes, reduce transaction costs, improve trade efficiency, stimulate economic development, and provide a solid economic foundation for inclusive green growth (Liang and Qiao, 2024).
In terms of digital trade and industrial structure, academics have proposed that digital trade can effectively promote the optimization and upgrading of industrial structure. Digital industrialization is a new form of development of digital trade. Driven by digital trade, the application of a new generation of digital technologies promotes industrial innovation, and new digital products and services continue to emerge, changing the importance of traditional product production, thus promoting the adjustment of the supply side, and giving rise to new industries and a new value chain (Peng and Zeng, 2024). These emerging products have profoundly changed the allocation pattern of factors in the production of traditional commodities, which has given rise to a new industrial form and value chain. These new products have profoundly changed the factor allocation pattern of traditional commodity production, giving rise to brand-new industrial forms and value chains, this process is accompanied by the continuous improvement of industrial digitization level, which strongly promotes the overall leap of industrial value, thus leading to the transformation and upgrading of the industrial structure (Zhuang et al., 2025). At the same time, current academics believe that industrial structure upgrading can promote inclusive green growth (Wang et al., 2021). The optimization and upgrading of industrial structure is a transformation from inefficient and highly polluting traditional industries to efficient and low-polluting emerging industries, which promotes the ecologization of industrial structure. Upgrading the level of industrial technology and innovation capacity, can improve the quality and efficiency of output, reduce resource consumption and environmental pollution, and thus promote sustainable economic development (Fu and Rasiah, 2024). At the same time, upgrading the industrial structure can create more employment opportunities and promote inclusive social development. The development of emerging industries and the extension of the industrial chain can absorb more labor, especially low-skilled labor, reduce unemployment and poverty, improve the level of social welfare and people’s living standards, and promote inclusive economic growth.
Based on the above analysis, this paper proposes the following hypotheses.
H1. Digital trade can promote green and inclusive growth.
H2. Digital trade can promote industrial structure upgrading, thereby driving inclusive green growth.
In summary, existing research has drawn unprecedented attention to digital trade and inclusive green growth, and has resulted in some valuable findings, which form the basis of this study. However, there are still some shortcomings. First, in terms of research content, there is little direct discussion on the impact of digital trade on inclusive green growth. The existing literature has sorted out the current state of research on the level of digital trade and inclusive green growth, but most of them have only studied one of the two and lacked a systematic examination of the two. Second, the research methodology is relatively simple. Most of the existing studies only use a single method (e.g., AHP or entropy weight method) to measure the inclusive green growth index and analyze it on this basis, while the spatial correlation analysis and quantile regression analysis of inclusive green growth are relatively lacking, so they cannot well describe the spatial heterogeneity of the inclusive green growth and the distribution law of digital trade on inclusive green growth. Thirdly, when selecting indicators, most of them only consider the overall situation in China and seldom take into account the differences between different regions in China, so the conclusions drawn are not applicable within a certain range.
To better address the above issues, this study utilizes a panel regression model to regressively analyze the influencing factors of inclusive green growth from the perspective of digital trade through two-way fixed effects and explores the transmission path of digital trade on inclusive green growth in different provinces of China through mechanism analysis. Meanwhile, based on the panel data of 31 provinces in China from 2014 to 2021, two indicator systems of inclusive green growth and digital trade are constructed, and the entropy weighting method is used to calculate the weights of China’s inclusive green growth and digital trade indicators, and TOPSIS is adopted for the multi-indicator ranking to calculate the comprehensive score index of inclusive green growth and digital trade. In addition, the characteristics of spatial heterogeneity and quantile heterogeneity of China’s inclusive green growth are analyzed, which to a certain extent makes up for the inadequacy of existing studies that only carry out unilateral research.
3 Research methods
3.1 Entropy weight method
The entropy weight method is an objective method of determining the weight of an index by the amount of information provided by information entropy (Hamid et al., 2016). It is used to objectively determine indicator weights based on the information provided by the entropy value of the indicator. The principle is that the smaller the degree of variation of the index, the less information is reflected and the lower the weight value of the index. The comprehensive score of inclusive green growth can be obtained through the following calculation steps.
Due to the different dimensions and magnitudes of various indicators in the inclusive green growth system, it is necessary to standardize the original data first, and then further calculate the weights of the indicators and the comprehensive scores of each system.
Step 1: Data Standardization.
Because the attributes and meanings of different indexes are different, it is impossible to calculate them directly, so dimensionless processing must be carried out first. According to the positive and negative attributes of the indicator, this paper uses the range standardization method to standardize the original data as follows:
If the evaluation indicator is a positive indicator, that is, the larger the better the index, the treatment is:
If the evaluation indicator is a negative indicator, that is, the smaller the better the index, the treatment is:
In Equations 1, 2
Step 2: Calculate the probability matrix.
The calculation equation is as follows:
In Equation 3,
Step 3: Calculate the proportion of the ith sample for the jth index. The calculation equation is as follows:
In Equation 4, information entropy is
Step 4: Calculate the entropy weight of each indicator according to the following formula. The calculation equation is as follows:
In Equation 5,
3.2 TOPSIS method
The TOPSIS method quantifies the distance between the evaluation object and the positive and negative ideal solutions, uses the distance as the basis for evaluation, and ranks the evaluation objects according to their proximity to the ideal solutions, thus realizing the scientific assessment of the relative merits of each object (Herman and Oliver, 2023). With the weight coefficients of the evaluation indicators obtained from the entropy weight method, TOPSIS further identifies the optimal and the worst ideal values of each indicator, and calculates the distance between each indicator and the positive and negative ideal solutions accordingly. This process not only profoundly reveals the affinity of each evaluation index to the ideal solution, but also provides a clear support for quantitatively judging the degree of superiority or inferiority of the target by ranking the assessment results.
Step 1: Normalize the Decision Matrix.
In Equation 6,
Step 2: Calculate positive and negative ideal solutions
In Equations 7, 8,
Step 3: Calculate the separation degree.
For each alternative
In Equation 9,
Step 4: Calculate the distance from the ideal solution
The calculation equation is as follows:
In Equation 10, CI is the combined score index of each alternative j with the ideal solution, varying between 0 and 1. The size of the CI can reflect the strengths and weaknesses of the evaluation object to a certain extent, the larger the CI value, the better the regional inclusive green growth, the smaller the CI value, the worse the regional inclusive green growth.
4 Inclusive green growth evaluation index system
To calculate the comprehensive score index of inclusive green growth, a CI model based on EWM-TOPSIS is established to evaluate the level of inclusive green growth in different regions. The distribution details of EWM and TOPSIS are shown in Figure 1. In this study, 31 provinces in China were selected to demonstrate the model presented in this study. In this CI model, there are eight important quantitative indicators, and the weights of each index are determined by the entropy weight method. TOPSIS is used for multi-indicator ranking to calculate the comprehensive score index of inclusive green growth.
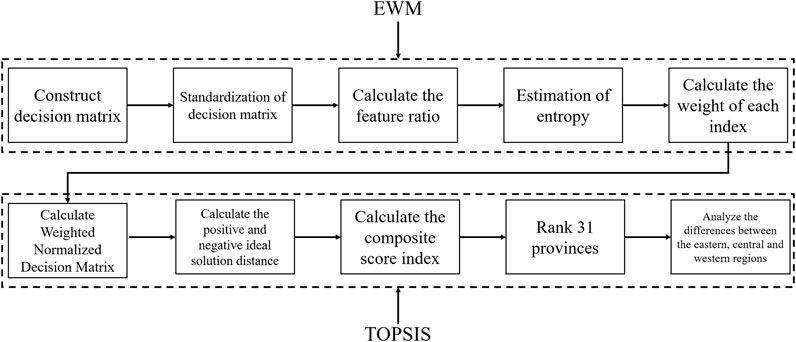
Figure 1. EWM-TOPSIS process Diagram.
4.1 Selection of indicators
Inclusive green growth is a comprehensive concept covering multiple dimensions such as economy, society, production, consumption and environment, which cannot be measured by a single indicator (Jha et al., 2018; Tarp et al., 2012). Therefore, it is necessary to construct an indicator system consisting of multiple dimensions and indicators for measurement, so as to obtain inclusive green growth indicators. This paper refers to the studies of Fu and Rasiah (2024), Sarkodie et al. (2023), and Xu et al. (2024). Based on the full consideration of international comparability, data availability and China’s actuality, we categorize the inclusive green growth indicator system into two dimensions: input indicators and output indicators.
4.1.1 Input indicators
In this paper, it is measured from three aspects: resource input, input in technology and education, and labor input. Among them, resource input is measured by water resources per capita, input in technology and education is measured by local financial expenditure on education, and labor input is measured by the resident population at the end of the year.
Water resources per capita, by quantifying the availability and carrying capacity of natural resources, can indirectly reflect the potential and limitations of resource inputs, which in turn reflects the ability of natural capital to sustainably support green growth. Local fiscal education expenditure is a key factor in promoting green technological innovation. According to the human capital theory, education input provides the impetus for green growth by upgrading the skill level of the labor force and promoting technological innovation and productivity improvement. Therefore, the higher the values of these two indicators, the better the level of inclusive green growth reflected. The year-end resident population is an important indicator of resource pressure. According to the ecological footprint model, population overload will exacerbate resource depletion and ecological deficits, thus constraining green growth. Therefore, the higher the value of this indicator, the lower the level of inclusive green growth reflected.
4.1.2 Output indicators
This paper measures economic benefit, ecological benefit, social benefit and environmental pollution from four aspects. Among them, economic benefit is measured by GDP per capita, ecological benefit is measured by the greening coverage rate of built-up areas, social benefit is measured by the level of medical and health services, and environmental pollution is measured by sulfur dioxide emissions and chemical oxygen demand emissions together.
Gross regional product per capita is an indicator of the quality of economic growth. However, traditional GDP without deducting ecological depletion may overestimate true wellbeing and thus needs to be assessed comprehensively in conjunction with ecological indicators. Higher Gross regional product per capita implies stronger economic strength and better social welfare, which may provide more favorable conditions for inclusive green growth. The greening rate of built-up areas is an important indicator of the effectiveness of habitat improvement. Based on the ecosystem service value assessment framework, this indicator can directly quantify the contribution of green space to the ecosystem and reflect the actual benefits of green growth. As a social infrastructure, the healthcare system has become a key hub for promoting synergistic development of economic growth, social equity and environmental sustainability by improving the quality of human capital, optimizing the efficiency of resource allocation, enhancing system resilience, and promoting green technological innovation. Therefore, the higher the values of these two indicators, the better the level of inclusive green growth reflected. Sulfur dioxide and chemical oxygen demand are typical pollution emission indicators. According to the environmental Kuznets curve (EKC) hypothesis, high pollution emissions reflect the ecological cost of economic growth, which is the core issue to be addressed in green growth.
4.2 Measurement of the weight of inclusive green growth indicators
Based on the above calculation method, Spssau was used to calculate the weights of inclusive green growth indicators for 31 provincial-level administrative regions in China, as shown in Table 1.
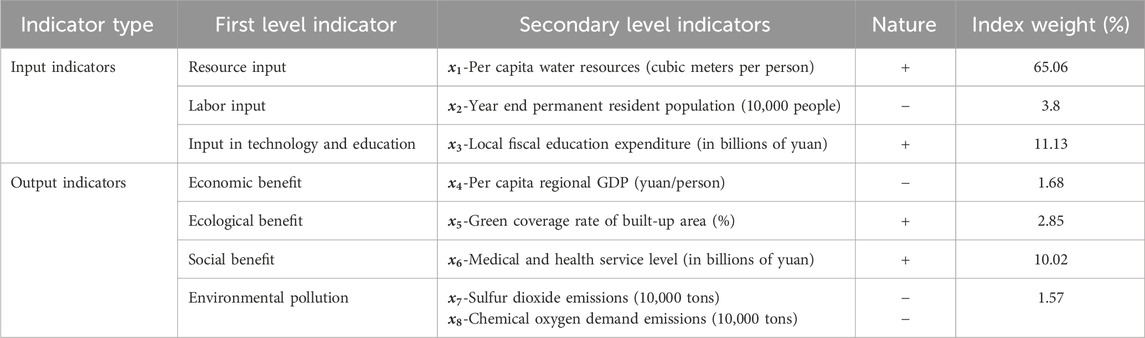
Table 1. Weight index results.
4.3 Measurement of inclusive green growth index
Using the EWM-TOPSIS method, calculate the CI of 31 provinces in China from 2014 to 2021. Table 2 shows the comprehensive score index of these provinces from 2014 to 2021. From a holistic perspective, China’s inclusive green growth efficiency is steadily improving, demonstrating a comprehensive and balanced development trend. However, it cannot be denied that there is still a certain gap in the inclusive green growth situation in various regions of China, and the task of working together for common development and improvement still needs to be taken seriously.
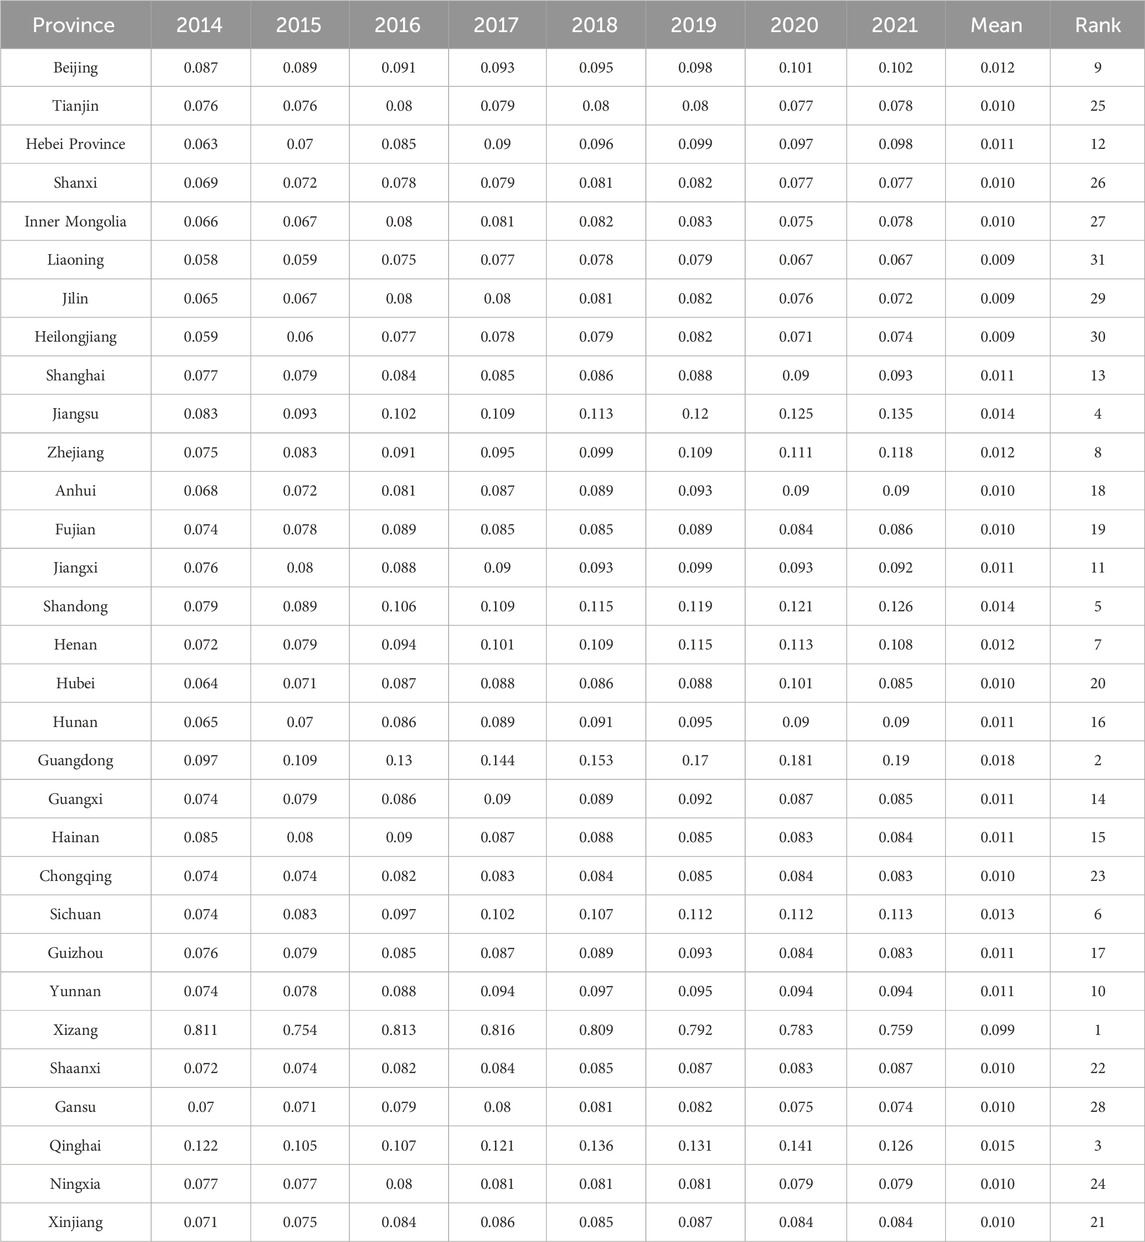
Table 2. Inclusive green growth comprehensive score index of 31 provinces.
5 Digital trade evaluation index system
At present, the measurement of the development level of digital trade is mainly divided into two aspects: The first is to analyze the digital trade statistics, such as reflecting the development level of digital trade from the regional digital trade volume, the types of digital trade products, and the growth trend of digital trade (Hu et al., 2022; Zhou and Li, 2023), but the statistical data are more focused on the national and industry level. The second is to construct indicators of the level of development of digital trade and to propose new indicators or indicator systems for measuring the level of digital trade (Ma et al., 2019). Based on this, this study focuses on constructing a comprehensive evaluation index system for the development level of digital trade, starting from China’s provincial data, following the principles of objective, effective, hierarchical, comprehensive and scientific construction of the index system, and utilizing existing research to construct a comprehensive evaluation system for the development level of digital trade. Drawing on the studies of Yang et al. (2024), Liang and Qiao (2024), Shi et al. (2024) and Ma and Kang (2025). This paper constructs a digital trade evaluation index system containing 16 three-level indicators from the four dimensions of digital infrastructure, digital innovation, digital industrial capacity and digital trade potential (as shown in Table 3). All of the indicators in this metric system are positive indicators because they are all indicators that perform better with larger values.
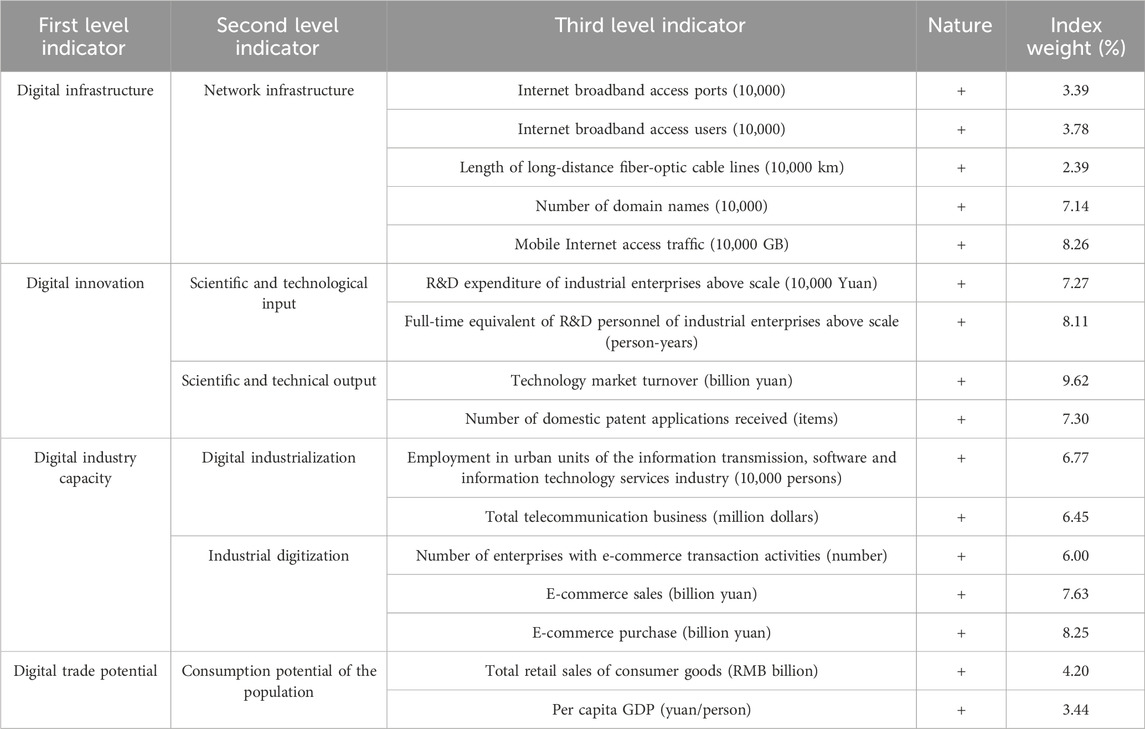
Table 3. Comprehensive evaluation index system of digital trade.
5.1 Selection of indicators
5.1.1 Digital infrastructure
Digital infrastructure as a basis for the development of digital trade and as a determinant of new comparative advantages in digital trade. This paper measures it from one field: network infrastructure. Among them, network infrastructure is measured by six indicators: Internet broadband access ports, Internet broadband access users, the length of long-distance fiber-optic cable lines, the number of domain names, mobile Internet users and mobile Internet access traffic.
5.1.2 Digital innovation
Digital innovation is the key kernel for the development of digital trade, and the rapid iteration of digital technology supports the innovative development of digital trade. This paper measures it from two regions: science and technology input and science and technology output. Among them, science and technology input is measured by two factors: R&D expenditure of industrial enterprises above large scale and the full-time equivalent of R&D personnel of industrial enterprises above scale. Science and technology output is measured by two factors: technology market turnover and number of domestic patent applications received.
5.1.3 Digital industry capacity
Digital industry capacity refer to the use of digital technology to promote the transformation of traditional industries into digital intelligence and the use of digital technology to generate new products and services, which empowers all parties to digitally transform the whole chain of trade and incorporate new products and services into international transactions, and is the capacity basis for the development and growth of digital trade. This paper measures it from two fields: digital industrialization and industrial digitization. Among them, digital industrialization is measured by two factors: Employment in urban units of the information transmission, software and information technology services industry and total telecommunication business. Industrial digitization is measured by three indicators: the number of enterprises with e-commerce transaction activities, E-commerce sales and E-commerce purchase.
5.1.4 Digital trade potential
Digital trade potential refers to the combined capacity of a country or region in terms of the scale of trade, room for growth and competitiveness that it may realize in international trade. It reflects the level of trade that the country or region can achieve in the future with existing resources, market conditions and policy support. This paper measures it from one region: consumption potential. Among other things, Consumption potential of the population is measured by two factors: the total retail sales of consumer goods and per capita GDP.
5.2 Measurement of the weight of digital trade indicators
In the same way as the calculation method of inclusive green growth, Spssau was used to calculate the weights of digital trade indicators for 31 provincial-level administrative regions in China, as shown in Table 3.
5.3 Measurement of digital trade index
With the help of the EWM-TOPSIS method, the comprehensive score index of digital trade of 31 provinces in China is calculated from 2014 to 2021. Table 4 shows the comprehensive score index of these provinces from 2014 to 2021. From a holistic perspective, China’s level of digital trade development is continuing to increase steadily. From a regional perspective, the eastern region is in a dominant position, generally ranked at the top of the composite score, and dominates the 31 digital trades by its better geographic location and economic strength, and plays a leading role in the national digital trade.
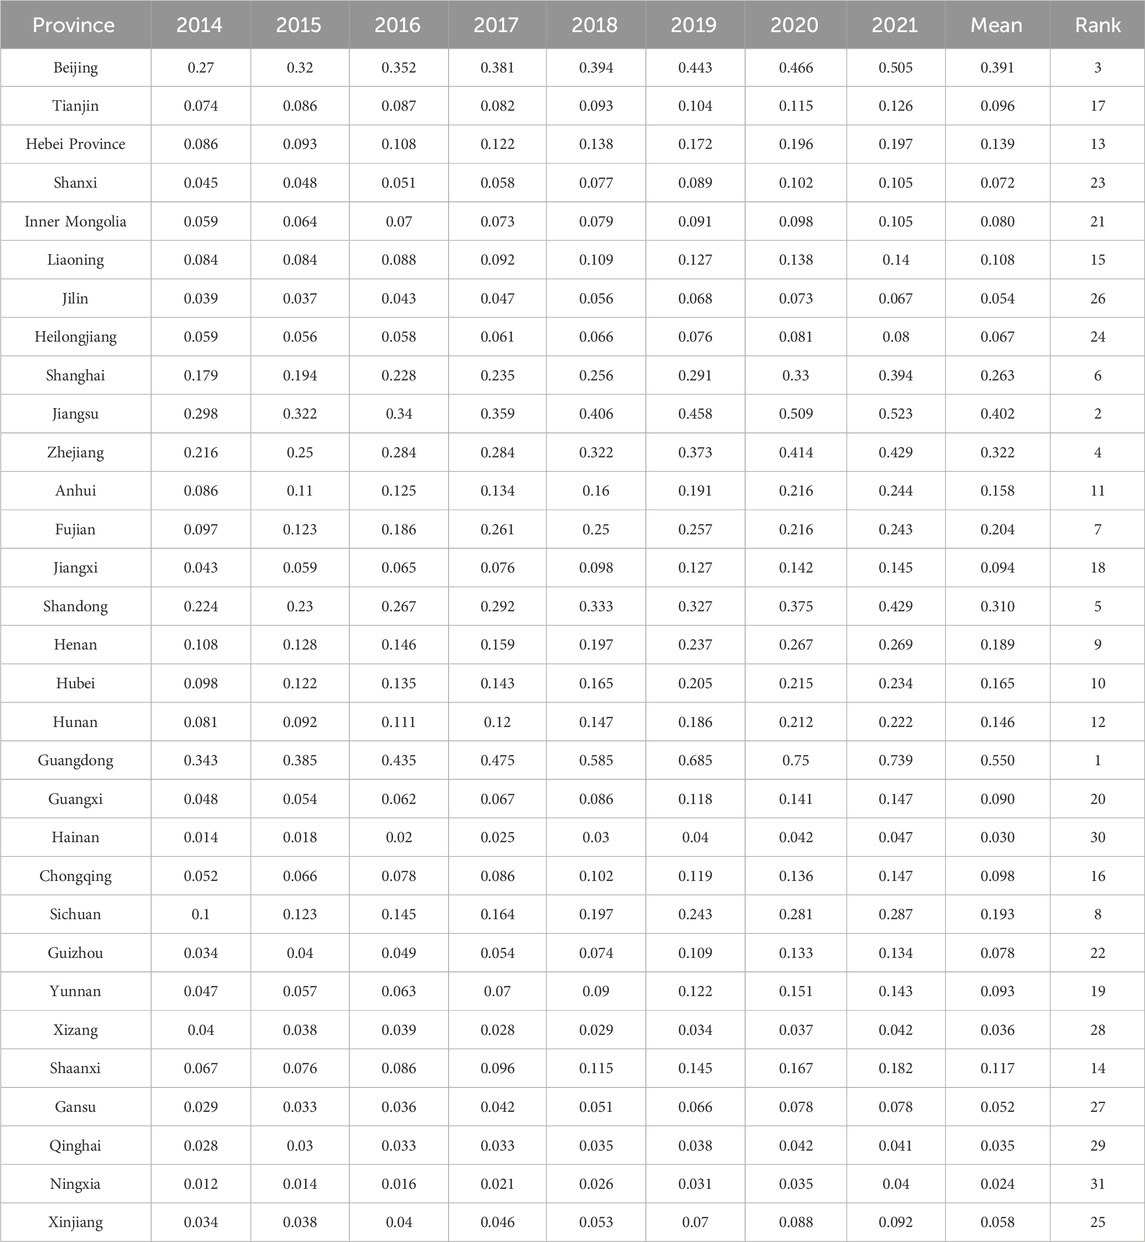
Table 4. Digital trade comprehensive score index of 31 provinces.
6 Fixed effects model
Using a panel regression model, this study conducts a two-way fixed effects regression analysis on the influencing factors of inclusive green growth from the perspective of digital trade and explores the transmission path of digital trade on inclusive green growth in different provinces of China through mechanism analysis. Conduct regional heterogeneity analysis of inclusive green growth from three regions: the eastern, central, and western regions, and perform quantile regression on inclusive green growth.
6.1 Variable selection and statistical description
6.1.1 Dependent variable: C
Using the EWM-TOPSIS method to calculate the comprehensive score of inclusive green growth in China from 2014 to 2021, and using this score as the comprehensive evaluation index of inclusive green growth. Based on this index, a panel regression model was further constructed, where this comprehensive evaluation index was set as the dependent variable of the model.
6.1.2 Core explanatory variable: digital
The EWM-TOPSIS method is used to calculate China’s digital trade development level from 2014 to 2021, and this score is used as a comprehensive evaluation index of digital trade. Based on this index, a panel regression model is further constructed, in which the comprehensive evaluation index is set as the core explanatory variable of the model.
6.1.3 Control variables
To avoid the impact of external factors on inclusive green growth, referring to the study by Wu et al. (2023), the following four core economic indicators are selected as control variables and taken as logarithms: economic development level (Eco) is measured by regional gross domestic product; Education level (Ledu) is measured by the number of students enrolled in ordinary higher education institutions; Population structure (Ps) is measured by urban population density; Government support (Gov) is measured by expenditures on local financial resources, exploration of electricity information, and other related affairs.
6.1.4 Data description
As China is a vast, populous and culturally diverse country, there are significant differences among regions in terms of economy, society, culture and environment. Selecting 31 provinces as the research object can ensure the comprehensiveness and representativeness of the study and avoid the bias of conclusions caused by selecting some regions. At the same time, 2014–2021 is a critical period for the implementation of the 13th Five-Year Plan, during which China has experienced many major policy changes, and the economic structure, industrial development, and environmental protection of China’s regions have undergone significant changes. Choosing this period as the time frame for the study helps to gain a more comprehensive understanding of the development of China’s regions. In addition, the data of this period are relatively complete and easy to obtain, which can meet the demand for timeliness of the study. Therefore, considering the rationality and availability of variable indicator data, panel data from 31 provinces in China from 2014 to 2021 are ultimately selected as the research sample. It mainly comes from the China Urban Statistical Yearbook, CNKI database, and Provincial Statistical Yearbook. In terms of data processing, the following content has been deleted: (1) missing control variables, (2) abnormal control variables, (3) control variables with multicollinearity. In addition, in order to meet the research needs, some variable data are obtained by calculating the raw data. The explanations and descriptive statistics of each major variable are shown in Tables 5 and 6.
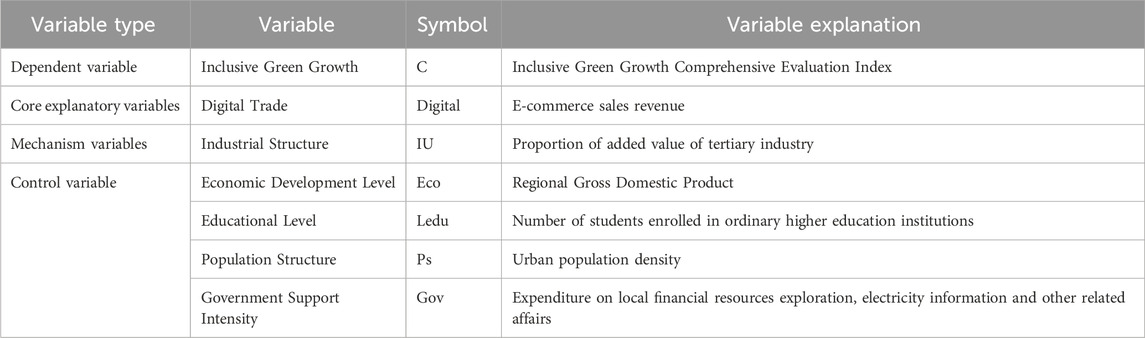
Table 5. Variable explanation.
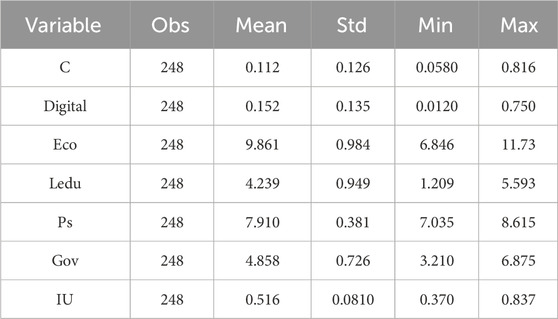
Table 6. Descriptive statistics of variables.
6.2 Model building
To analyze the differences in individual and temporal dimensions of trade policies and address issues of heteroscedasticity and serial correlation, this study employs a bidirectional fixed panel regression model. By selecting panel data from 2014 to 2021, a regression model was constructed with the China inclusive green growth comprehensive evaluation index as the dependent variable, digital trade comprehensive evaluation index as the explanatory variable, and economic development level, education level, population structure, and government support as control variables to study the impact of digital trade on inclusive green growth. The panel regression model is shown below:
In Equation 11,
7 Results
7.1 Benchmark regression results
This study selects economic panel data from 31 provinces in China from 2014 to 2021, mainly to study whether digital trade has promoted inclusive green growth in China. The research is conducted by controlling for time effects, and individual effects, and simultaneously controlling for both time and individual effects. Firstly, only a preliminary regression analysis was conducted on the dependent variable (C) and the core explanatory variable (Digital) to explore the underlying relationship between the two. The results of columns (1)–(3) of Table 7 show that digital trade is significant at the 1% significance level for inclusive green growth. Columns (4)–(6) of Table 7 show that after adding control variables, the positive impact of digital trade remains significant. Through the 1% significance test, the coefficients are slightly adjusted but the explanatory power of the model is enhanced. When controlling for both time and individual effects, it can be found that population structure, education level and government support have a positive impact on inclusive green growth, while economic development shows a negative impact.
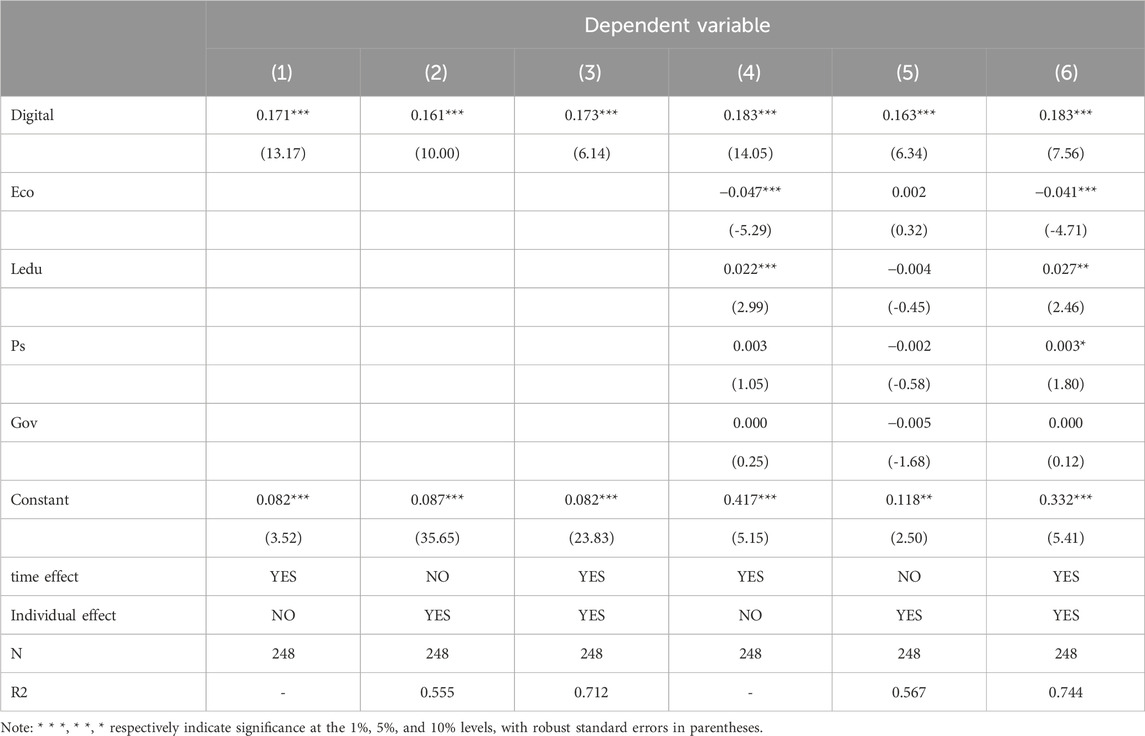
Table 7. Results of fixed effects regression analysis.
After observing the various results of panel regression analysis, a significant conclusion can be drawn: regardless of whether a series of control variables are considered, digital trade, as the core driving force, has always shown a positive and undeniable impact on promoting inclusive green growth in China. This discovery not only reveals the important role of digital trade in the high-quality development of China’s economy but also provides new perspectives and references for future policy-making and economic development strategies.
7.2 Robustness test
7.2.1 Eliminate extreme values
Due to extreme values in the regression sample may lead to biased estimation results, to ensure the robustness of the benchmark regression results, this study shrinks the tail of continuous variables by 1% up and down to re-measure the impact of digital trade on inclusive green growth. As shown in Table 8 (1) and (2), the estimated coefficients of digital trade are still significantly positive, indicating that the benchmark regression results are not affected by extreme values and the model estimation results are robust.
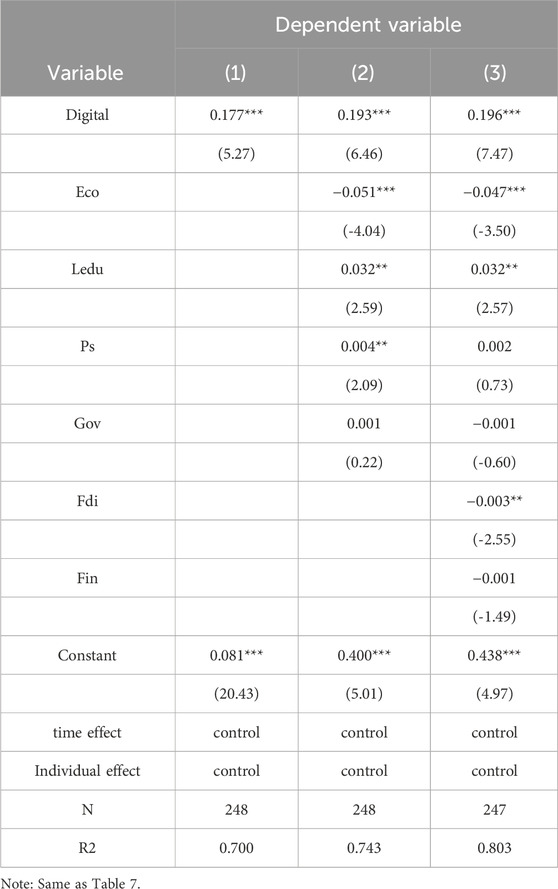
Table 8. Regression results of robustness test.
7.2.2 Increase control variables
To further control the problem of omitted variables, this study adds the total import and export volume of foreign-invested enterprises (Fdi) and local fiscal and financial regulatory expenditure (Fin) as control variables in the model and logarithmically processes them. As shown in Table 8, (3) the regression coefficient of digital trade is significantly positive at the 1% level, indicating that the model has good robustness.
7.3 Transmission mechanism testing
The above empirical results strongly verify that digital trade can significantly promote inclusive green growth, and understanding how digital trade promotes inclusive green growth is also a focus of this study. After analyzing relevant literature, it is found that the impact of digital trade on industrial structure are possible paths to explain inclusive green growth. Therefore, this study is based on previous panel regression analysis and refers to the transmission mechanism of digital trade and inclusive green growth proposed by Wu et al. (2024) (Wu et al., 2024). The specific test results are shown in Table 9. It can be seen that the indirect effects under different mechanism paths are significant and have not changed the conclusion that digital trade positively promotes inclusive green growth.
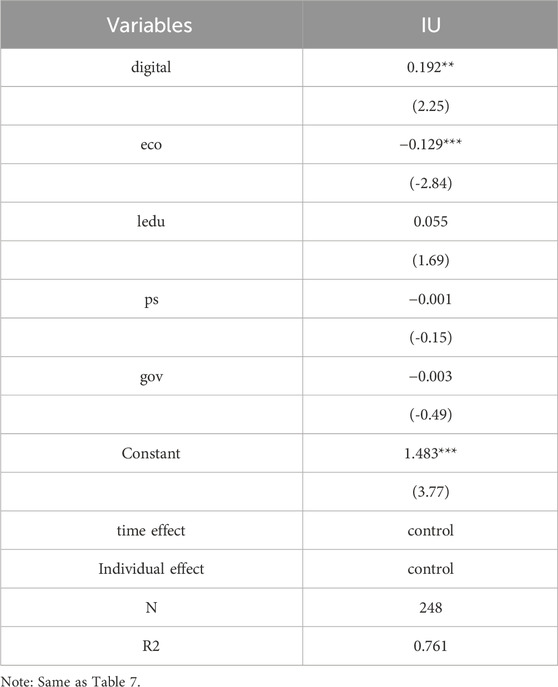
Table 9. Transmission mechanism test.
To test the transmission mechanism that digital trade can influence inclusive green growth by optimizing industrial structure, this study uses the proportion of the added value of the tertiary industry to measure the industrial structure and conducts regression analysis. It can be seen that digital trade is significantly positive for industrial structure at the 1% level, affirming the transmission path of industrial structure, H2 has been validated. The development of digital trade has increased the flow of capital and talent among regions, making the industrial structure more rational. At the same time, digital trade optimizes the allocation of factor resources through characteristics such as openness and connectivity, promoting the progress of industrial technology and upgrading traditional industries. Optimizing the industrial structure can improve China’s traditional extensive economic growth model, alleviate resource consumption, reduce pollutant emissions, and promote economic development towards green, low-carbon and sustainable directions through a reasonable industrial structure.
As a result, the results in this section show that digital trade can contribute to inclusive green growth by optimizing industrial structure (as shown in Table 9). Hypothesis two is verified.
7.4 Heterogeneity analysis
7.4.1 Regional heterogeneity analysis
The core of the logic of economic win-win lies in advocating the concept of inclusive green development, adhering to the principle of common development, and abandoning the zero-sum game mentality of winning and losing; At the same time, fairness and efficiency should be balanced, and the traditional concept of the strong dominating should be abandoned. However, in the current context of rapid economic development, the pace of green development has encountered obstacles. In response to this situation, provinces urgently need to re-examine and attach importance to the development potential of digital trade. Given the differences in government policy orientation, education level foundation, and population structure among provinces, “digital trade” is introduced as the research focus to explore whether it can still play its inherent promoting role while adapting to these regional differences and whether there are significant differences in its effectiveness in regions with different levels of economic development.
From a theoretical perspective, given the significant differences in economic development levels and resource reserves among provinces, the role of digital trade in promoting inclusive green growth in regions is likely to exhibit significant regional differences. In order to further explore this difference and based on the characteristics of the selected sample data as well as the accuracy of heterogeneity analysis, 31 provinces were divided from an economic geography perspective into three regions: the eastern, central, and western regions. Through this division, it is possible to more accurately study whether there are differences in the effects of digital trade on inclusive green growth in regions with different levels of economic development. The results of regional heterogeneity analysis and evaluation are shown in Table 10.
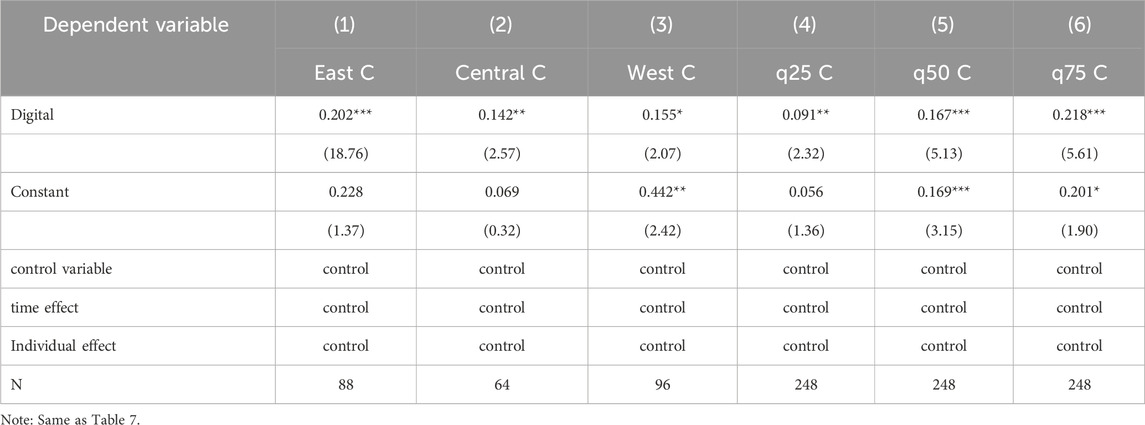
Table 10. Results of regional heterogeneity analysis.
According to the regression results, from column (1) to column (3) of Table 10, it can be seen that the eastern region passed the test at 1% level of significance, the central region passed the test at 5% level of significance, and the western region passed the test at 10% level of significance. The estimated coefficient of digital trade in the eastern region is 0.202, which is greater than the coefficient of digital trade for the central and western regions. The reasons for this result may be as follows: The eastern region has a high level of economic development and a relatively complete digital infrastructure, which lays a solid material foundation for digital trade to enable inclusive green growth; Although the development level of digital trade in the western region is lower than that in the eastern region, it has certain advantages in the field of resource endowment and policy support. Therefore, digital trade also has a certain role in promoting inclusive growth in the western region, but the effect is weaker than that in the eastern region; The western region benefits from the “East and West” project, driving the construction of digital trade carriers. The central region is in the transition zone in the “double cycle” strategy, which cannot enjoy the tax preference of the western development, but also face the siphon effect of the eastern industrial transfer.
7.4.2 Quantile regression
From the bidirectional panel regression results of the impact of digital trade on inclusive green growth, it can be seen that digital trade has a significant impact on inclusive green growth, but the bidirectional panel regression results cannot reflect the distribution pattern of digital trade on inclusive green growth. Therefore, this study conducts quantile regression on inclusive green growth, and columns (4), (5), and (6) in Table 10 present the regression results of inclusive green growth at the 25th, 50th, and 75th percentiles.
From the regression results, digital trade has a significant positive impact on inclusive green growth at the 25%, 50% and 75% quantiles, indicating that digital trade has a significant impact on inclusive green growth. With the increase of the inclusive green growth index, the impact of digital trade on inclusive green growth will increase.
8 Discussion
This study provides important insights into the relationship between digital trade and inclusive green growth, with a particular insight on the mechanism effects of the industrial structure.
This study confirms that digital trade has a significant positive effect on inclusive green growth. This finding is consistent with the growing body of literature that emphasizes the importance of digital trade in economic balanced growth and green ecological transformation. Companies that prioritize digital trade tend to adopt more efficient and innovative technologies and practices, thereby improving the efficiency of resource allocation, broadening effective channels for public participation in green governance, and sharing economic growth fairly and equitably. This study confirms that digital trade has a significant role in promoting inclusive green growth, which is consistent with sustainable development theory, which emphasizes balanced growth, social equity and environmental protection (Fang and Liu, 2025). Focusing on Digital trade is more likely to adopt greener technologies and fair practices to maximize growth for equal opportunities. This method can not only allow the fruits of economic globalization and economic development to reach all countries and populations, but also achieve coordinated economic and social development in sustainable development.
The study also shows that digital trade can indirectly increase the level of inclusive green growth through industrial structure upgrading. Due to the promotion of digital trade, traditional industries have been able to transform into more efficient and environmentally friendly production modes, and emerging digital-intensive industries have also risen, thus optimizing the industrial structure and injecting new vitality into economic growth (Xian, 2025; Yang and Wang, 2023). The optimization of industrial structure can benefit a wider range of groups and help society achieve inclusive development. The rise of emerging industries and the expansion of the industrial chain provide a broad space for absorbing low-skilled labor, which helps alleviate unemployment and poverty, improve social welfare and people’s quality of life, and enhance the inclusiveness of the economy. In addition, the upgrading of industrial structure can optimize the quality and efficiency of output, reduce resource consumption and environmental pollution, thus promoting the effective use of products and the sustainable development of the environment, and improving the overall level of green growth (Qian and Ji, 2022).
Analyzing this study in terms of regional dimensions, it is found that there is an a clear imbalance in the level of inclusive green development among China’s provinces, but the gap between the east, central and west is shrinking. In a vertical comparison, with the steady implementation of the national coordinated regional development strategy, the central and western regions have made positive progress in terms of policy support, capital input, and technology introduction, and the composite scores of inclusive green growth of the central and western cities in 2021 have significantly improved compared with those in 2014 (Li et al., 2023). This finding is consistent with a growing body of literature that emphasizes differences in the level of inclusive green development across time and space (Li et al., 2021). Nevertheless, it must be recognized that in the progress towards inclusive green growth in China, there are still certain gaps between regions, and the task of promoting common development and synergistic improvement in all regions remains arduous, urgently requiring all parties to attach great importance to it and take active action.
According to the results of regional heterogeneity, the role of digital trade on regional inclusive green growth shows regional differences. The results show that the eastern, central and western regions have passed the test and are significant. The estimated coefficient of the impact of digital trade on inclusive green growth in the eastern region is greater than that in the central and western regions. The enabling effect is more pronounced in provinces with a higher degree of digital trade development, which may be because a higher level of economic development and complete digital infrastructure can better unleash the enabling potential of digital trade (Liang and Qiao, 2024). However, compared with the eastern region, the development of digital trade in the central and western regions lags behind. Although these regions still have untapped digital trade potential and may gain growth opportunities under the promotion of relevant policies, the current lack of digital infrastructure, relatively low level of economic development, limited talent pool and education level have hindered the level of inclusive green growth in these regions. The developed economy and better digital infrastructure system in the eastern region means that enterprises here have a more solid material foundation, leading them to invest in industrial structure optimization practices more abundantly (Liu et al., 2023b). Such input could create more favorable conditions for achieving inclusive green growth.
Meanwhile, the quantile regression results show that digital trade has a significant positive effect on inclusive green growth at the 25%, 50% and 75% quantile points, which indicates that the effect of digital trade on inclusive green growth is more significant, and with the increase of the inclusive green growth index, the effect of digital trade on inclusive green growth will be elevated (Yıldırım et al., 2025).
In summary, the results emphasize the importance of formulating more targeted, precise and effective policy measures based on regional conditions and inclusive green growth indices, giving full play to the strengths of digital trade, and making up for the shortcomings of regional development, so as to vigorously promote the realization of inclusive green growth in all regions and help the global sustainable development goals. This will help promote inclusive green growth in all regions and contribute to the achievement of the global sustainable development goals.
9 Conclusion
In summary, the main conclusions of this study are as follows: first, digital trade has a significant positive impact on inclusive green growth. Second, digital trade can promote inclusive green growth by optimizing industrial structure. Finally, in the regional heterogeneity and quantile regression analysis of inclusive green growth, it is found that digital trade can promote inclusive green growth in the eastern, central and western regions, and the effect of digital trade on inclusive green growth will be enhanced as the inclusive green growth quantile increases.
Based on these in-depth research findings and conclusions, the aim is to propose a series of targeted policy recommendations to promote inclusive green growth in various regions and narrow development gaps.
Firstly, the government should formulate and implement policies that are conducive to the development of digital trade. According to the research findings, it is not difficult to find the importance of digital trade for inclusive green growth, so the government should increase input through the establishment of special funds, tax incentives and other policy measures to encourage and support enterprises to conduct research and innovation in key digital technologies such as artificial intelligence, 5G, etc., and to strengthen the construction of digital infrastructure, and provide strong support for the development of digital trade. On the other hand, the government should strengthen cooperation between enterprises, universities, and research institutions to jointly carry out green technology research and application, and accelerate the transformation and promotion of technological achievements.
Secondly, implement differentiated strategic measures to promote inclusive green growth in all regions. Specifically, the eastern region should deepen the application of digital technology, and radiate and drive the digital transformation and open economy construction in the central and western regions; The central and western regions should focus on strengthening the construction of digital infrastructure, continuously stimulating the innovative potential of digital technology, and ensuring that the digital trade continues to inject vitality and momentum into regional development. Regions with low fiscal self-sufficiency and significant urban-rural income gaps should actively seize the opportunity of digital trade development, continuously optimize social and livelihood services, and strive to narrow the urban-rural gap and accelerate the pace of green transformation, to achieve a more balanced and sustainable development goal.
Thirdly, strengthening the optimization and upgrading of industrial structures by the government is of great significance for fully utilizing the potential of digital trade and promoting green and high-quality economic development. On the one hand, the government should focus on promoting high-level opening up to the outside world and further expanding the field of foreign investment access. By reasonably reducing the negative list of foreign investment access, the government can attract more foreign investment to key areas such as high-tech, energy conservation and environmental protection, as well as regions with development potential such as the central and western regions and the northeast. On the other hand, enterprises should actively promote technological innovation and equipment upgrading in traditional industries to enhance their value creation capabilities, thereby winning a higher position and stronger competitiveness for Chinese traditional industries in the global industrial value chain. At the same time, enterprises should also promote the high-end, intelligent and green manufacturing industry, and deeply integrate with the modern service industry and modern agriculture to form a coordinated development pattern.
Last but not least, this study has a positive impact and helps in the field of Digital Trade and inclusive green growth, which not only deepens the understanding of digital trade in theory, but also provides a direction for promoting inclusive green growth in different regions of China. Compared with existing research, its advantages are as follows: first, to explore the impact of digital trade on inclusive green growth in a multi-dimensional manner, and to comprehensively examine how digital trade gradually promotes the transition of inclusive green growth level from simple growth to deep upgrading; second, Multi-perspective analysis of impact channels, using qualitative, quantitative and comparative research to enhance the universality and application value of the results; third, In terms of research content, the two-way fixed effect model of the panel is adopted, and the quality, sustainability and broad benefits of society are emphasized. However there are still some shortcomings in the research, and future studies can be improved from the following two aspects: First, The scope of this study dataset is relatively limited and can be extended to include longer time frames to improve generalization. Second, this study takes China as a whole and divides it into three major regions from an economic geography perspective. It does not specifically explore the differences in the impact of digital trade on inclusive green growth development among different provinces and cities in China. Although there are significant differences in natural resources, economic development levels, cultural backgrounds, and other aspects among different provinces, these characteristics may directly affect the impact of digital trade on inclusive green growth; In the future, further discussions can be conducted on the spatiotemporal evolution of the impact of digital trade on inclusive green growth in different provinces and cities, which can enrich the empirical results and enhance the practical relevance of this research for specific policy guidance.
Data availability statement
The raw data supporting the conclusions of this article will be made available by the authors, without undue reservation.
Author contributions
YC: Conceptualization, Data curation, Formal Analysis, Funding acquisition, Writing – original draft. YD: Investigation, Methodology, Resources, Writing – original draft. YY: Conceptualization, Data curation, Formal Analysis, Funding acquisition, Writing – review and editing.
Funding
The author(s) declare that financial support was received for the research and/or publication of this article. This study is supported by project of Philosophy and Social Science Research in Colleges and Universities in Jiangsu Province (2023SJYB1515).
Conflict of interest
The authors declare that the research was conducted in the absence of any commercial or financial relationships that could be construed as a potential conflict of interest.
Generative AI statement
The author(s) declare that no Generative AI was used in the creation of this manuscript.
Publisher’s note
All claims expressed in this article are solely those of the authors and do not necessarily represent those of their affiliated organizations, or those of the publisher, the editors and the reviewers. Any product that may be evaluated in this article, or claim that may be made by its manufacturer, is not guaranteed or endorsed by the publisher.
Supplementary material
The Supplementary Material for this article can be found online at: https://www.frontiersin.org/articles/10.3389/fenvs.2025.1559586/full#supplementary-material
References
Abeliansky, A. L., and Hilbert, M. (2017). Digital technology and international trade: is it the quantity of subscriptions or the quality of data speed that matters? Telecommun. Policy 41 (1), 35–48. doi:10.1016/j.telpol.2016.11.001
Afolalu, O., and Tsoeu, M. S. (2025). Enterprise networking optimization: a review of challenges, solutions, and technological interventions. Future Internet 17 (4), 133. doi:10.3390/fi17040133
Albagoury, S. (2016). Inclusive green growth in Africa: Ethiopia case study. Germany: University Library of Munich. https://mpra.ub.uni-muenchen.de/id/eprint/74364
Aminata, J., Nusantara, D. I. K., and Susilowati, I. (2022). The analysis of inclusive green growth in Indonesia. Jurnal Ekonomi and Studi Pembangunan 23 (1), 140–156. doi:10.18196/jesp.v23i1.13811
Ben Lahouel, B., Taleb, L., Managi, S., and Abaoub, N. (2023). Inclusive green growth in OECD countries: what are the impacts of stringent environmental and employment regulations? Environ. Econ. Policy Stud., 1–29. doi:10.1007/s10018-023-00362-4
Boikova, T., Zeverte-Rivza, S., Rivza, P., and Rivza, B. (2021). The determinants and effects of competitiveness: the role of digitalization in the European economies. Sustainability 13 (21), 11689. doi:10.3390/su132111689
Cao, J. (2022). The dynamic coupling nexus among inclusive green growth: a case study in Anhui province, China. Environ. Sci. Pollut. Res. 29 (32), 49194–49213. doi:10.1007/s11356-022-19237-4
Chen, L., Wang, Y., Yan, Y., Zhou, Z., Xie, B., and You, X. (2024). Coupling and coordination development, spatiotemporal evolution, and driving factors of China’s digital countryside and inclusive green growth in rural areas. Sustainability 16 (13), 5583. doi:10.3390/su16135583
Chen, M., Zhang, T., Chu, Q., Xie, L., Liu, J., Tansuchat, R., et al. (2023). Convergence analysis of inclusive green growth in China based on the spatial correlation network. Sustainability 15 (16), 12344. doi:10.3390/su151612344
Fan, S., Huang, H., Mbanyele, W., Guo, Z., and Zhang, C. (2023). Inclusive green growth for sustainable development of cities in China: spatiotemporal differences and influencing factors. Environ. Sci. Pollut. Res. Int. 30 (4), 11025–11045. doi:10.1007/s11356-022-22697-3
Fang, H., Huo, Q., and Hatim, K. (2023). Can digital services trade liberalization improve the quality of green innovation of enterprises? Evidence from China. Sustainability 15 (8), 6674. doi:10.3390/su15086674
Fang, Z., and Liu, Z. (2025). Digital innovations driving urban sustainability: key factors in reducing carbon emissions. Sustainability 17 (5), 2186. doi:10.3390/su17052186
Fu, H., and Rasiah, R. (2024). Fostering inclusive green growth in Chinese cities: investigating the role of artificial intelligence. Sustainability 16 (22), 9809. doi:10.3390/su16229809
Gao, J., Wu, Y., and Li, H. (2024). Digital inclusive finance, rural loan availability, and urban–rural income gap: evidence from China. Sustainability 16 (22), 9763. doi:10.3390/su16229763
Gupta, J., and Vegelin, C. (2016). Sustainable development goals and inclusive development. Int. Environ. Agreem. Polit. law Econ. 16, 433–448. doi:10.1007/s10784-016-9323-z
Hamid, T., Al-Jumeily, D., Hussain, A., and Mustafina, J. (2016). “Cyber security risk evaluation research based on entropy weight method”. In 2016 9th International Conference on Developments in eSystems Engineering (DeSE), Liverpool, UK, 31 August 2016–02 September 2016 (IEEE), 2161–1343.
He, Y., and Xie, C. (2022). Measurement, decomposition and emission reduction effects of digital global value chains. J. Clean. Prod. 378, 134307. doi:10.1016/j.jclepro.2022.134307
Herman, P. R., and Oliver, S. (2023). Trade, policy, and economic development in the digital economy. J. Dev. Econ. 164, 103135. doi:10.1016/j.jdeveco.2023.103135
Hu, F., Qiu, L., Xi, X., Zhou, H., Hu, T., Su, N., et al. (2022). Has COVID-19 changed China’s digital trade? implications for health economics. Front. Public Health 10, 831549. doi:10.3389/fpubh.2022.831549
Ibrahim, R. L., Alomair, A., and Al Naim, A. S. (2024). How financial development heterogeneity, macroeconomic volatility, domestic investment, and digital economy are driving sustainable economic growth in africa. Sustainability 16 (21), 9281. doi:10.3390/su16219281
Jha, S., Sandhu, S. C., and Wachirapunyanont, R. (2018). Inclusive green growth index: a new benchmark for quality of growth. Asian Development Bank. doi:10.22617/TCS189570-2
Ji, H., Xiong, B., and Zhou, F. (2023). Impact of digital trade on regional carbon emissions. Environ. Sci. Pollut. Res. 30 (48), 105474–105488. doi:10.1007/s11356-023-29858-y
Jiang, T., Hu, Y., Haleem, F., and Zeng, S. (2023). Do digital trade rules matter? Empirical evidence from TAPED. Sustainability 15 (11), 9074. doi:10.3390/su15119074
Kan, D., Lyu, L., Huang, W., and Yao, W. (2022). Digital economy and the upgrading of the global value chain of China’s service industry. J. Theor. Appl. Electron. Commer. Res. 17 (4), 1279–1296. doi:10.3390/jtaer17040065
Latini, A., Papagni, I., Gatti, L., De Rossi, P., Campiotti, A., Giagnacovo, G., et al. (2022). Echium vulgare and Echium plantagineum: a comparative study to evaluate their inclusion in Mediterranean urban green roofs. Sustainability 14 (15), 9581. doi:10.3390/su14159581
Le, T. A. T. (2025). The impact of digital transformation on economic integration in ASEAN-6: evidence from a generalized least squares (GLS) model. J. Risk Financial Manag. 18 (4), 189. doi:10.3390/jrfm18040189
Li, B., Li, J., Liu, C., Yao, X., Dong, J., and Xia, M. (2023). Provincial inclusive green growth efficiency in China: spatial correlation network investigation and its influence factors. Land 12 (3), 692. doi:10.3390/land12030692
Li, M., Zhang, Y., Fan, Z., and Chen, H. (2021). Evaluation and research on the level of inclusive green growth in Asia-Pacific region. Sustainability 13 (13), 7482. doi:10.3390/su13137482
Li, X., Hu, Y., Ding, L., Huang, Q., and Jiang, Y. (2024). Impact of the digital trade on lowering carbon emissions in 46 countries. Sci. Rep. 14 (1), 25957. doi:10.1038/s41598-024-76586-5
Liang, J., and Qiao, C. (2024). The impact of digital trade development on regional green innovation. Sustainability 16 (22), 10090. doi:10.3390/su162210090
Liu, J., Puah, C.-H., Arip, M. A., and Jong, M.-C. (2023a). Impacts of digital financial inclusion on urban–rural income disparity: a comparative research of the eastern and western regions in China. Economies 11 (11), 282. doi:10.3390/economies11110282
Liu, J., Wang, Q., and Wei, C. (2023b). Unleashing green innovation in enterprises: the transformative power of digital technology application, green human resource, and digital innovation networks. Systems 12 (1), 11. doi:10.3390/systems12010011
Liu, Y., Tang, T., Ah, R., and Luo, L. (2024). Has digital technology promoted the restructuring of global value chains? Evidence from China. Econ. Analysis Policy 81, 269–280. doi:10.1016/j.eap.2023.11.012
Ma, H., and Kang, C. (2025). Research on the impact of the development of China’s digital trade on the international competitiveness of the manufacturing industry. Systems 13 (4), 283. doi:10.3390/systems13040283
Ma, R., and Lin, B. (2023). Digital infrastructure construction drives green economic transformation: evidence from Chinese cities. Humanit. Soc. Sci. Commun. 10 (1), 460–510. doi:10.1057/s41599-023-01839-z
Ma, S., Guo, J., and Zhang, H. (2019). Policy analysis and development evaluation of digital trade: an international comparison. China and World Econ. 27 (3), 49–75. doi:10.1111/cwe.12280
Morton, S., Pencheon, D., and Squires, N. (2017). Sustainable Development Goals (SDGs), and their implementation: a national global framework for health, development and equity needs a systems approach at every level. Br. Med. Bull. 124 (1), 81–90. doi:10.1093/bmb/ldx031
Peng, R., and Zeng, B. (2024). Digital financial inclusion and inclusive green growth: evidence from China’s green growth initiatives. Int. J. Financial Stud. 13 (1), 2. doi:10.3390/ijfs13010002
Qian, J., and Ji, R. (2022). Impact of energy-biased technological progress on inclusive green growth. Sustainability 14 (23), 16151. doi:10.3390/su142316151
Ren, S., Li, L., Han, Y., Hao, Y., and Wu, H. (2022). The emerging driving force of inclusive green growth: does digital economy agglomeration work? Bus. Strategy Environ. 31 (4), 1656–1678. doi:10.1002/bse.2975
Sarkodie, S., Owusu, P., and Taden, J. (2023). Comprehensive green growth indicators across countries and territories, figshare. Sci. Data. 10 (1), 413. doi:10.1038/s41597-023-02319-4
Shi, X., Liu, Y., and Yu, Z. (2024). Unveiling the catalytic role of digital trade in China’s carbon emission reduction under the dual carbon policy. Sustainability 16 (12), 4900. doi:10.3390/su16124900
Staiger, R. W. (2021). Does digital trade change the purpose of a trade agreement? SSRN Electro. J. doi:10.2139/ssrn.3989586
Su, C.-W., Xie, Y., Shahab, S., Faisal, C. M. N., Hafeez, M., and Qamri, G. M. (2021). Towards achieving sustainable development: role of technology innovation, technology adoption and CO2 emission for BRICS. Int. J. Environ. Res. public health 18 (1), 277. doi:10.3390/ijerph18010277
Suriyankietkaew, S., Krittayaruangroj, K., and Iamsawan, N. (2022). Sustainable Leadership practices and competencies of SMEs for sustainability and resilience: a community-based social enterprise study. Sustainability 14 (10), 5762. doi:10.3390/su14105762
Tarp, F., Resnick, D. E., and Thurlow, J. (2012). The political economy of green growth: illustrations from Southern Africa. UNU-WIDER working paper. Available online at: https://hdl.handle.net/10419/80955.
Ulucak, R. (2020). How do environmental technologies affect green growth? Evidence from BRICS economies. Sci. Total Environ. 712, 136504. doi:10.1016/j.scitotenv.2020.136504
Wang, A., Ruan, Q., Zhou, T., and Wang, Y. (2022). Digitizable product trade development and carbon emission: evidence from 94 countries. Sustainability 14 (22), 15245. doi:10.3390/su142215245
Wang, F., Wu, J., Wu, M., Zheng, W., and Huang, D. (2021). Has the economic structure optimization in China’s supply-side structural reform improved the inclusive green total factor productivity? Sustainability 13 (22), 12911. doi:10.3390/su132212911
Wang, J., and Chu, X. (2024). The impact of digital trade rule networks on the advancement of global value chains in the Internet era. Appl. Math. Nonlinear Sci. 9 (1). doi:10.2478/amns-2024-1801
Wang, J., and Huang, Q. (2025). The impact of digital transformation on the export technology complexity of manufacturing enterprises: based on empirical evidence from China. Sustainability 17 (6), 2596. doi:10.3390/su17062596
Wu, B., Ding, Y., Xie, B., and Zhang, Y. (2024). FinTech and inclusive green growth: a causal inference based on double machine learning. Sustainability 16 (22), 9989. doi:10.3390/su16229989
Wu, S., Wang, Z., Su, C., and Zhang, W. (2023). Digital media and green development path in asia: does digital financial inclusion matter? Sustainability 15 (14), 11359. doi:10.3390/su151411359
Xian, M. (2025). Impact of inclusive growth, environmental policy incentives, fintech and globalization on environmental sustainability in G20 countries. Sustainability 17 (1), 50. doi:10.3390/su17010050
Xu, Y., Li, L., and Xiang, S. (2024). Performance evaluation of inclusive green growth in China: dynamic evolution, regional differences, and spatial correlation. PLoS One 19 (7), e0305338. doi:10.1371/journal.pone.0305338
Yan, M., and Liu, H. (2024). The impact of digital trade barriers on technological innovation efficiency and sustainable development. Sustainability 16 (12), 5169. doi:10.3390/su16125169
Yang, L., Yang, W., Nan, L., and Gu, Y. (2024). The impact of digital trade on the export competitiveness of enterprises—an empirical analysis based on listed companies in the yangtze river economic belt. Systems 12 (12), 580. doi:10.3390/systems12120580
Yang, M., Fu, M., and Zhang, Z. (2021). The adoption of digital technologies in supply chains: drivers, process and impact. Technol. Forecast. Soc. Change 169, 120795. doi:10.1016/j.techfore.2021.120795
Yang, T., and Wang, R. (2023). Research on the impact of green finance and the digital economy on the energy consumption structure in the context of carbon neutrality. Sustainability 15 (22), 15874. doi:10.3390/su152215874
Yıldırım, F., Ünlü, U., Kuloğlu, A., and Çıtak, Ö. (2025). Modeling and analysis of the impact of quality growth and financial development on environmental sustainability: evidence from EU countries. Sustainability 17 (2), 774. doi:10.3390/su17020774
Yin, X., Zhang, J., and Zheng, X. (2024). How does digital economy influence green mobility for sustainable development? Moderating effect of policy instruments. Sustainability 16 (21), 9316. doi:10.3390/su16219316
Yu, H., and Liu, H. (2024). Impact of digitization on carbon productivity: an empirical analysis of 136 countries. Sci. Rep. 14 (1), 5094. doi:10.1038/s41598-024-55848-2
Zhang, L., Pham, T. D., Li, R., and Do, T. T. (2025). Enhancing the sustainable development of the ASEAN’s digital trade: the impact mechanism of innovation capability. Sustainability 17 (4), 1766. doi:10.3390/su17041766
Zhang, Q., and Duan, Y. (2023). How digitalization shapes export product quality: evidence from China. Sustainability 15 (8), 6376. doi:10.3390/su15086376
Zhang, X., and Zhang, X. (2024). From shock to adaptation: evaluating the mechanisms of trade friction on firms’ total factor productivity through the lens of digital transformation. Systems 12 (11), 471. doi:10.3390/systems12110471
Zhao, L., Gao, X., Jia, J., and Zhang, Y. (2023). Analyzing inclusive green growth in China: a perspective of relative efficiency. Environ. Sci. Pollut. Res. 30 (6), 16017–16035. doi:10.1007/s11356-022-23155-w
Zhao, Z., and Gao, G. (2024). The impact of digital trade on China’s position in the GVC: an empirical analysis based on sino-Russian cross-border panel data. Sustainability 16 (13), 5493. doi:10.3390/su16135493
Zhou, R. (2022). Measurement and spatial-temporal characteristics of inclusive green growth in China. Land 11 (8), 1131. doi:10.3390/land11081131
Zhou, Z., and Li, Z. (2023). Corporate digital transformation and trade credit financing. J. Bus. Res. 160, 113793. doi:10.1016/j.jbusres.2023.113793
Zhu, L., Li, X., Huang, Y., Liu, F., Yang, C., Li, D., et al. (2023). Digital technology and green development in manufacturing: evidence from China and 20 other Asian countries. Sustainability 15 (17), 12841. doi:10.3390/su151712841
Keywords: EWM-TOPSIS, inclusive green growth, digital trade, two-way fixed effects, spatial spillover effects
Citation: Chu Y, Du Y and Yang Y (2025) The impact of digital trade on inclusive green growth—evidence from China’s experience. Front. Environ. Sci. 13:1559586. doi: 10.3389/fenvs.2025.1559586
Received: 13 January 2025; Accepted: 16 April 2025;
Published: 28 April 2025.
Edited by:
Evgeny Kuzmin, Ural Branch of the Russian Academy of Sciences, RussiaReviewed by:
Grigorios L. Kyriakopoulos, National Technical University of Athens, GreeceVoica Marian Catalin, Oil and Gas University of Ploiești, Romania
Orhan Şanli, Adnan Menderes University, Türkiye
Copyright © 2025 Chu, Du and Yang. This is an open-access article distributed under the terms of the Creative Commons Attribution License (CC BY). The use, distribution or reproduction in other forums is permitted, provided the original author(s) and the copyright owner(s) are credited and that the original publication in this journal is cited, in accordance with accepted academic practice. No use, distribution or reproduction is permitted which does not comply with these terms.
*Correspondence: Yuetao Yang, eWFuZ3l0QGp1c3QuZWR1LmNu