 Justin Nsanzabaganwa1,2,3,4Xi Chen1,2,3,5*Tie Liu1,2,3,5Christophe Mupenzi4
 Egide Hakorimana1,2,3,4Richard Mind'je4Marie Louise Mujawayezu4Aboubakar Gasirabo1,2,3,4Adeline Umugwaneza1,2,3
 Flora Malayika4Schadrack Niyonsenga4
- 1Xinjiang Institute of Ecology and Geography, Chinese Academy of Sciences, Urumqi, China
- 2Xinjiang Key Laboratory of RS & GIS Application, Urumqi, China
- 3University of Lay Adventist of Kigali (UNILAK), Faculty of Environmental Studies, Kigali, Rwanda
- 4Zhejiang University of Technology, Hangzhou, China
- 5University of Chinese Academy of Sciences, Beijing, China
Constructed wetland (CW) is cost-effective, easy to operate, maintain, and offer significant natural potential for application in urban areas compared to conventional treatment systems. Despite their effectiveness in wastewater management, CWs have yet to see widespread adoption in Rwanda. This study aimed to analyze the impact of constructed wetland for wastewater treatment located in Gasabo district, Kigali City of Rwanda for water pollution dipping by testing eight physico-chemical parameters such as: pH, TN, TP, TSS, TDS, COD, BOD, and DO in the samples collected at the influents and effluents of the CW during rainy and dry seasons in twelve months of year 2023, relating their concentrations with standards of the World Health Organization (WHO), determining the CW removal efficiency and finally, to provide summary of measurement by the CCME-WQI. The results revealed that, the most parameters have been exceeding the standards before being treated, then after all effluents responded to standard conditions. The removal efficiencies in both seasons valued between 16-80% which presented a good concert in treatment. Furthermore, the index showed a high pollution on influent which was counted 42.1 and 46.4 in both dry and rain seasons respectively as poor and marginal quality, on the other side of effluent the results indicated 87.7and 89.1 ranked as good quality. These above values demonstrated the effective performance of constructed wetland regarding the production of the effluent that met the specified water quality standard despite elevated influent concentrations in terms of pollutants. Further application of CW in other organizations/institutions (public and private) is greatly suggested to treat their wastewater before reaching water flows in the environment.
1 Introduction
Water quality is limited globally. Owing to global issues with water scarcity, it is critical to consider unconventional water sources to meet the rising demand for freshwater (Tzanakakis et al., 2020). Wastewater is considered a practical substitute to address the scarcity of water supply driven by a number of factors, including population expansion, economic growth, and industrial development (Obaideen et al., 2022). However, due to the wide range of organic and inorganic compounds found in wastewater, its reuse requires regular evaluation to identify potential dangers to the environment (Van Vliet et al., 2021).
Constructed wetlands (CW) are an effective way to treat various kinds of sewage, including industrial, institutional, and agricultural. They can reduce the levels of nutrients, organic matter, heavy metals, and pathogens in the wastewater (Waly et al., 2022). In developing countries like Rwanda, population growth, rising water consumption, and poor waterborne sanitation create serious challenges for wastewater disposal. In many instances, wastewater is dumped on open land and empty spaces, resulting in pools of stinky and stagnant water (Khan et al., 2022). In this regard, CWs should be taken as a natural alternative solution for sewage purification.
In Rwanda, wastewater management is a concept that has recently gained high importance. The country is facing various challenges related to water quality, sanitation, and environmental protection (Szopińska et al., 2024). Therefore, it is essential to develop and implement effective strategies for managing wastewater in a sustainable way. Many areas lack centralized wastewater treatment systems and rely on individual or on-site facilities for some institutions and establishments (Mbateye et al., 2010). Brix (2020) reported that a constructed wetland significantly reduces waste loading into waters, minimizing pollution, mainly in areas where many wastes are generated by industries, commercial activities, and grouped settlements. In the country, wastewater treatment is still at a low pace, and associated consequences are gradually increasing (Onu et al., 2023). These include the pollution of water quality, which in turn affects people’s health. While CWs have been increasingly used for sewage treatment, there remains a gap in understanding their long-term sustainability and impact in treating wastewater in the Rwandan context. Most prior studies have focused on treatment efficiency and technical design, with less attention to the broader ecological and chemical context. A similar study (Nhapi et al., 2013) conducted in Rwanda focused on laboratory tests but exhibited a weakness in the application of appropriate subsequent techniques, such as the removal efficiency (RE) calculation and water quality indices that are significant in assessing the environmental water quality.
Therefore, the authors identified a significant gap in the literature and conducted a comprehensive study analyzing the impact of constructed wetlands on wastewater management in urban areas. This research highlights the innovative and original contributions of the current study, emphasizing its importance in addressing pressing environmental challenges in urban wastewater treatment systems by integration of RE and the Canadian Council of Ministers of the Environment Water Quality Index (CCME WQI) for addressing the potential of CWs in wastewater treatment. The authors firmly believe that this comprehensive study will provide valuable insights and serve as a crucial resource for enhancing efforts to reduce water pollution and promote effective water reuse strategies in Rwanda’s urban areas.
2 Methods and materials
2.1 Study area description
This study considered the constructed wetland (Figure 1) located in the Remera Sector, Gasabo District of Kigali City, with 1523 m of elevation above sea level and 475 m2, as its occupation area. The hydraulic retention is 4 days with a flow rate of 14 m3 per day. This area experiences an average annual temperature of 23.64°C and an average rainfall of 230.93 mm. The area adopts a tropical climatic condition with two seasons (dry and rainy) each year, with the first season known as long rainy (March to May) and the short rainy (September to November), while the remaining time for the dry season (December to February and June to August). This CW helps treat wastewater collected from all divisions and is designed in line with the requirements of the universally constructed horizontal subsurface flow (FWS) wetlands, which is suitable for the above environmental conditions.
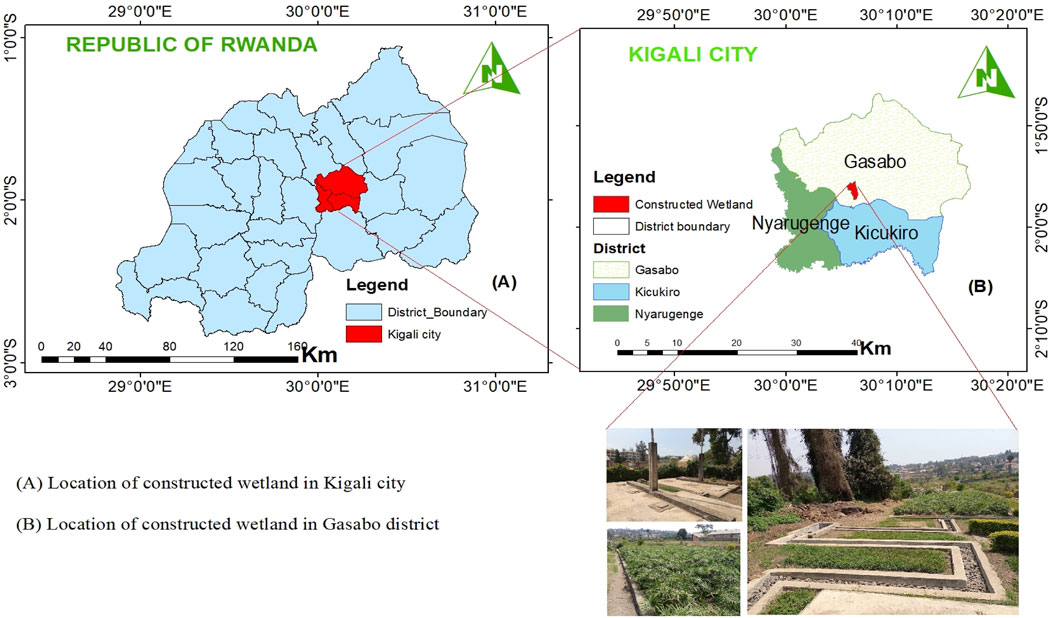
Figure 1. CW map and its geographical location: (A) Kigali city, (B) Gasabo District.
2.2 Materials
The study analyzed different selected parameters in the samples collected on the influent and effluent of the CW in both dry and rainy seasons over 12 months of 2023. These parameters are the potential of hydrogen (pH), chemical oxygen demand (COD), biological oxygen demand (BOD), total suspended solids (TSS), total nitrogen (TN), total phosphorus (TP), and dissolved oxygen (DO), which collectively provide a detailed picture of the organic, inorganic, and physical characteristics of wastewater. These metrics are critical for assessing the health of aquatic ecosystems in terms of how they are affected by wastewater discharge. Their concentrations were compared with the standards of the World Health Organization (WHO-EM/CEH/142/E). Finally, removal efficiency (RE) and CCME WQI were used in the results analysis.
2.3 Methods
2.3.1 Laboratory testing and sampling
To obtain a representative sampling of heterogeneous matrices, composite samples were collected from the same points of influent and effluent of CW five times every 1 month. The composite method was applied in both rainy and dry seasons, and the sampling procedure involved combining portions of multiple samples taken from the same point.
The analysis of the collected samples was performed with reference to the requirements of the Standard ISO/IEC 17025, where the Environmental Protection Agency (EPA) and Housing Authority of the City of Houston (HACH) test methods were used to achieve the objectives as well as to obtain trustable results from the Environmental Research Laboratory at the University of Lay Adventists of Kigali (UNILAK-ERL).
2.3.2 Removal efficiency calculation
Removal efficiency in wastewater treatment refers to the effectiveness of a treatment process in removing contaminants or pollutants from wastewater. It is typically expressed as a percentage and indicates the extent to which a specific pollutant or group of pollutants has been removed from the wastewater stream by the treatment process (de Jesus Gaffney et al., 2017). The removal efficiency (RE) for each parameter was calculated using the obtained concentrations and this was mathematically expressed as follow in Equation 1:
where
2.3.3 The CCME WQI calculation
The CCME WQI model evaluates how water quality deviates from selected objectives (scope, frequency, and amplitude). These deviations are combined to produce a score from 0 to 100 (with 1 indicating the worst and 100 indicating the best water quality) that reflects the overall water quality. From this score, water quality is classified as poor, marginal, fair, good, or excellent. The following steps outline the procedure for performing the calculations: variable selection, choosing guidelines, and index score calculation (Akhtar et al., 2021).
The three main factors are the basis for the index:
F1 (scope) is a metric that quantifies the proportion of variables that deviate from their guideline values at any point during the specified time interval (“failed variables”). It is calculated by dividing the number of failed variables by the total number of variables measured as it shown in Equation 2:
F2 (Frequency) is a metric that indicates the proportion of tests that fail to meet the guideline values in Equation 3:
F3 (amplitude) is a measure of how far the test values deviate from the guideline values when they fail. To calculate F3, these three steps are used:
The times number by which an individual concentration is bigger than (or less than, when the objective is a minimum) the objective is called an “excursion” and is expressed as follows. When the test value must not exceed the objective, the Equation 4 shows its mathematic expression:
The Equation 5 shows the cases in which the test value must not fall below the objective:
This variable, referred to as the normalized sum of excursions, or nse, is calculated in Equation 6 as follow:
F3 is then obtained by an asymptotic function that scales the normalized sum of the excursions from guideline value (nse) to yield a range between 0 and 100 which expresses in Equation 7.
The sum of the squares of each factor is therefore equal to the square of the index. This method gives the index as a three-dimensional space defined by each factor along one axis. Such as in Equation 8:
The divisor 1.732 normalizes the resultant values to a range between 0 and 100, where 0 represents the “worst” water quality and 100 represents the “best” water quality. According to the CCME WQI, water quality is ranked in the five categories shown in Table 1.

Table 1. CCME WQI categorization schema.
The CCME prepared software in Visual Basic and applied it in Microsoft Excel to compute the WQI. The choice of variables, depending on the availability of data, can be easily manipulated. In these regards, CCME WQIs computed eight physical and chemical parameters for both influent and effluent of the CW in dry and rainy seasons based on the World Health Organization wastewater guidelines of environmental suitability limit (Organization, 2006).
3 Results and discussion
The observed analytical ranges of different parameters of wastewater testing are shown in Table 2 and will be discussed as acidity, nutrients, total solids, and organic matter in terms of pollution reduction for a CW.
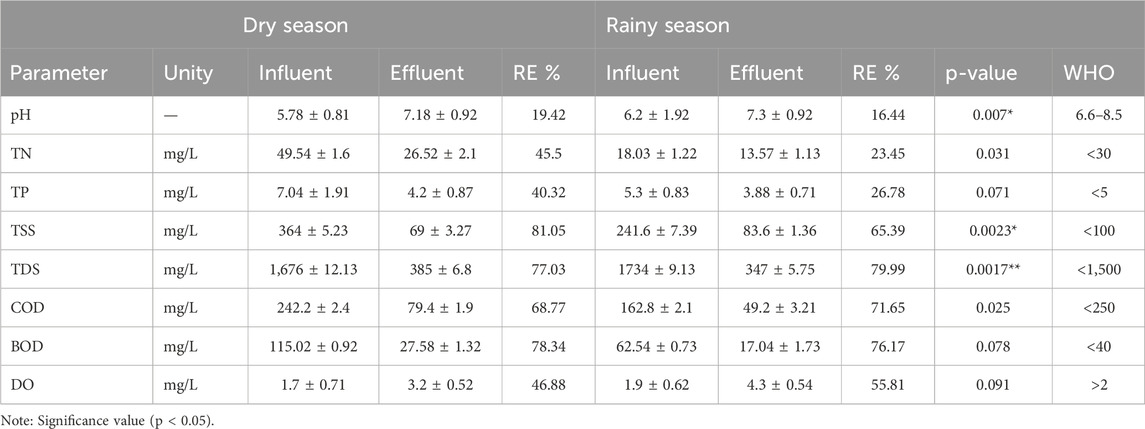
Table 2. Detailed mean results of the sample analyses with RE and standard limits.
3.1 pH
pH is an important parameter for water quality status as it influences the solubility and availability of nutrients that aquatic organisms require for life (Saalidong et al., 2022). The findings indicated the pH varied from 5.78 to 7.18 with an RE of 19.42% and a standard deviation of 0.81 in the dry season. During the rainy season, a variation of 6.20–7.30 with an RE of 16.44% and a standard deviation of 0.92 was found. The latter revealed a significant difference from the mean. The RE showed the potential of the CW to reduce the acidity of the wastewater passing through. The potential of the CW can also be proved by comparing the influent and effluent pH with the WHO standards, where the influent in the dry and rainy seasons was lower than the WHO minimum, at 5.7 > 6.6, while the effluent was above the minimum and below the maximum, at 6.6 < 7.18 < 8.5 (Figures 3, 4). The treatment process appeared to successfully reduce the influent levels to meet the standards in the effluent, as reported by Baharvand and Mansouri Daneshvar (2019). This was a positive outcome, indicating that the treatment system is working as intended.
3.2 Nutrients (TN and TP)
Total nitrogen (TN) and total phosphorus (TP) are important components of wastewater analysis. Monitoring these nutrients is crucial for understanding the overall nutrient load in wastewater and its potential impact on the environment (Ahmad et al., 2021).
The results exhibited a total nitrogen variation ranging from 49.54 mg/L to 26.52 mg/L with an RE of 45.5% (Figure 2). This finding signifies that the treatment process was successful in reducing the total nitrogen content by almost half, from the highest to the lowest observed concentrations, as also obtained by an earlier study (Ahmad et al., 2021), and the standard deviation of 0.80 indicated that the data were closer to the mean. The latter notes a relatively consistent performance in the removal process in the dry season. During the rainy season, the concentration varied from 18.03 mg/L to 13.57 mg/L with an RE of 23.45% (Figure 1) and a standard deviation of 1.13. This finding can be likely attributed to the dilution effect. The RE showed the potential of the CW in reducing the concentration of nitrogen in wastewater passing through. The potential can also be proved by comparing the effluent concentration and the WHO standards, where the influent in the dry season was above the standard (50.54 > 30) and effluent was under the standard (27.54 < 30) in the rainy season (Figures 3, 4).
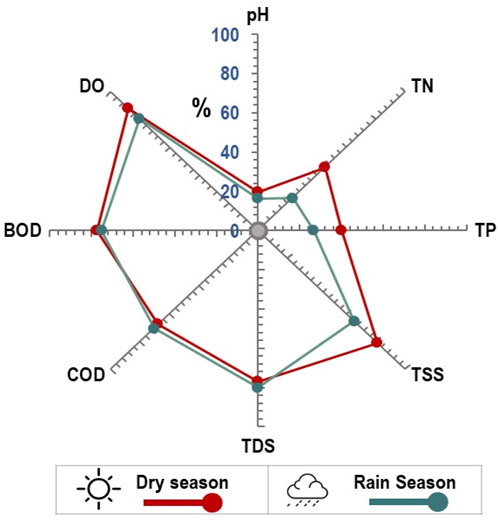
Figure 2. Removal efficiency percentages for both seasons.
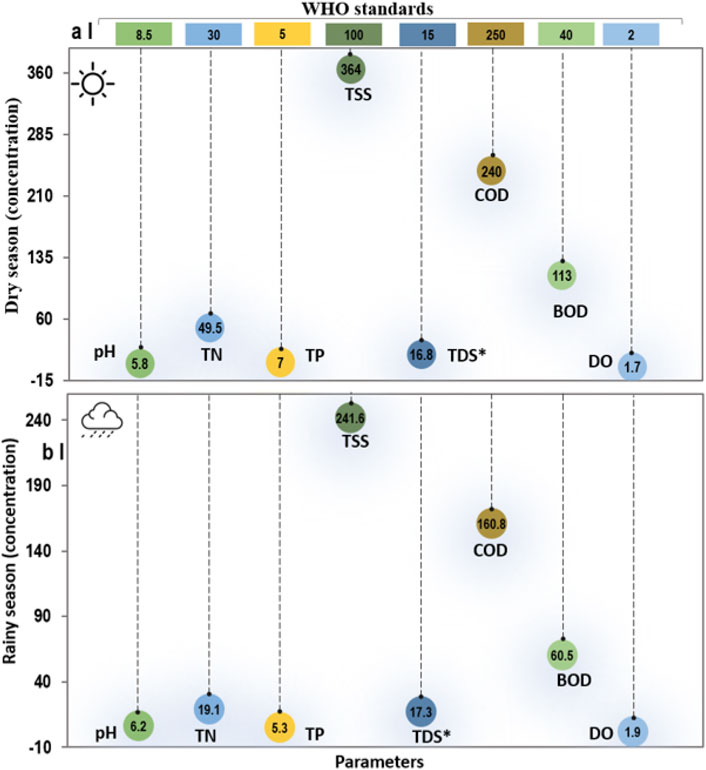
Figure 3. Influents concentration compared to WHO standards in dry (a) and rain (b) seasons, *TDS×100.
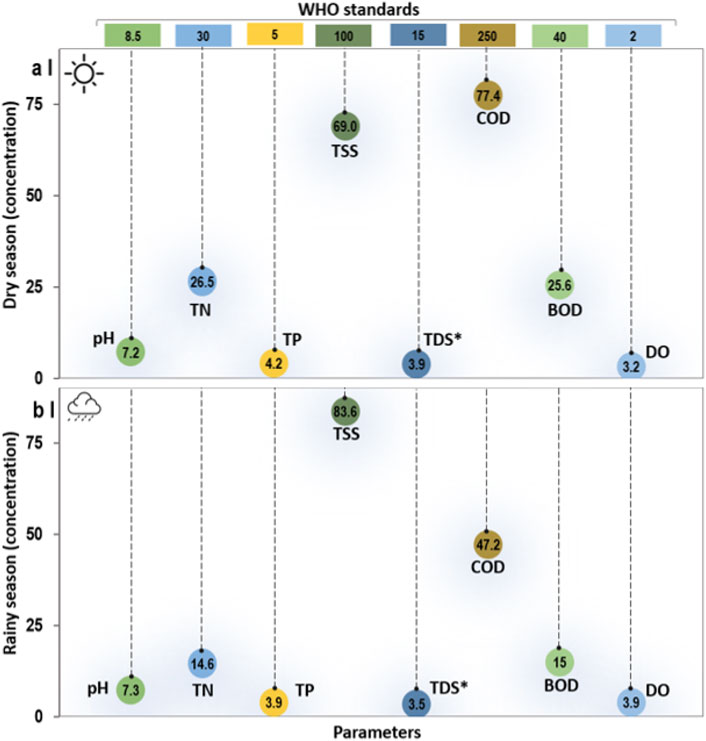
Figure 4. Effluents concentration compared to WHO standards in dry (a) and rain (b) seasons, *TDS×100.
The total phosphorus, which combines all forms of dissolved or particulate phosphorous (Wang et al., 2021), is another factor. The results showed that the total phosphorous decreased from 7.02 mg/L for influent to 4.18 mg/L for effluent in the dry season. In fact, such a situation revealed how the polluted influent concentration, which was higher than the standard, was reduced to less than the limit, with a 40.35% removal efficiency (Figure 2). In addition, a standard deviation of 0.92 indicated that the final concentrations were close to the mean. In the rainy season, the variation was 5.21 mg/L in the influent and 3.76 mg/L for the effluent, with an RE of 26.78% (Figure 3). The above situation revealed the impact of the CW in reducing the total phosphorous level counted as a pollutant in wastewater during both seasons.
3.3 Total solids (TSS and TDS)
Total suspended solids (TSS) and total dissolved solids (TDS) provide information about the quantity and nature of solid particles present in water. These parameters are crucial for assessing water quality, designing effective treatment processes, and ensuring compliance with environmental regulations. TSS is a significant water quality metric that is measured for ecosystem health and wastewater treatment operations (Bakar et al., 2020). Wastewater holds a high amount of suspended organic and inorganic material that must be treated prior to environmental discharge. The results, illustrated in Figures 2, 3, indicated that TSS decreased from 364 mg/L to 69 mg/L with a standard deviation of 0.69 in the dry season and from 241.6 mg/L to 83 mg/L with a 1.36 standard deviation in the rainy season. This situation showed the potential for influent concentrations that were higher than the standard to be reduced to less than the accepted limit. In this regard, several indicators, such as TSS removal efficiency, were used to analyze the variation in wastewater treatment systems (Yotova et al., 2019), where removal efficiencies of 81.05% and 65.39% were obtained in the dry and rainy seasons, respectively (Figure 2).
TDS is the total amount of inorganic and organic substances that are dissolved in water. Its measurement helps quantify contamination and what level of treatment is necessary to eliminate the pollutants. The results of measuring the TDS content of samples showed that the amount of TDS decreased from 1,676 mg/L to 385 mg/L with a standard deviation of 0.91 in the dry season and from 1734 mg/L to 347 mg/L around a mean of 0.78 in the rainy season. Figures 3, 4 indicate how influent concentrations were higher than the standard limit, but after passing through the CW, the effluents were lower than the standards. In addition, the findings showed RE values of 77.3% and 79.99%, demonstrating the positive impact in of reducing TDS. High amounts of total dissolved solids equate to more contaminated water. This excess of TDS can be toxic to aquatic life, such as fish, insects, amphibians, and macro-invertebrates, depending on the composition (Bakar et al., 2020). It can also be used to provide insights into the status of the water over time and as a warning sign of a potential problem.
3.4 Organic matters (COD and BOD)
Organic pollutants, as measured by BOD and COD, are key factors in wastewater analysis. They provide insights into the amount of biodegradable and non-biodegradable organic compounds present in wastewater. COD is the quantity of oxygen required for the chemical oxidation of organic matter in a sample and is used to determine the level of organic matter from sewage and natural waters. This test is one of the most commonly used methods of determining the severity of domestic and industrial sewage pollution (Yotova et al., 2019).
The results revealed that the concentration of COD varied from 242.20 mg/L to 79.40 mg/L with a standard deviation of 1.12 in the dry season, while in the rainy season, it varied from 162.80 mg/L to 49.20 mg/L with a standard deviation of 0.87 (Figures 3, 4). The potential of the CW to decrease COD concentrations was shown by RE values of 68.77% in dry and 71% in rainy seasons. The higher the COD, the higher the amount of pollution in the water sample (Li et al., 2018). This parameter is considered to be one of the most important quality control parameters for effluent in a wastewater treatment facility. Before treated effluent is discharged, the COD is usually measured to prevent contaminating the receiving water system and ecosystem.
BOD is a crucial parameter in environmental science and water quality assessment. It measures the amount of dissolved oxygen required by microorganisms to break down organic matter present in a water sample (Aniyikaiye et al., 2019). This process is indicative of the water contamination level and its ability to support aquatic life. Wastewater often contains a variety of organic pollutants derived from domestic, industrial, and agricultural activities. High levels of BOD indicate an increased demand for oxygen, suggesting a higher concentration of biodegradable organic substances in the water. In this current study, the BOD concentrations varied from 115.02 mg/L to 27.58 mg/L in the dry season and from 62.50 mg/L to 17.04 mg/L in the rainy season, with standard deviations of 1.18 and 0.73, respectively. The value of the CW for wastewater treatment was shown by its BOD removal efficiencies of 78.34% in dry and 75.17% in rainy seasons (Figure 2). Comparing the BOD concentrations of the effluent and influent with the WHO standard showed that influents were greater than 40 mg/L, and they were reduced to less than the standard in the effluent (Figures 3, 4). This expresses the power of a CW in wastewater treatment because the discharge of wastes with high levels of BOD can cause water quality problems, such as severe dissolved oxygen depletion in receiving water bodies. Thus, its measurement is instrumental in safeguarding aquatic ecosystems and ensuring the sustainability of water resources.
3.5 Dissolved oxygen
Dissolved oxygen (DO) is a vital parameter in wastewater analysis that is a key indicator of the water’s capacity to support aquatic life. It represents the amount of molecular oxygen dissolved in water, which is essential for the survival of aerobic organisms and indicative of the overall health of water bodies. Therefore, DO plays a critical role in maintaining the ecological balance of aquatic ecosystems (Mariu et al., 2023; Yan et al., 2024). It directly influences the metabolism and survival of aquatic organisms, and its levels indicate the degree of pollution and the efficiency of natural or engineered treatment processes. In line with Table 2; Figure 5 the content of samples showed an increased DO concentration extending from 1.70 mg/L in the influent to 3.20 mg/L in the effluent with a standard deviation of 0.6 in the dry season and from 1.90 mg/L to 4.30 mg/L in the rainy season with a standard deviation of 0.72. Figures 3, 4 indicate how influent concentration was less than 2 mg/L, the standard limit, but after passing through the CW, the effluent was higher than the standard. Hence, Figure 2 shows the RE values of 46.88% and 55.81% to demonstrate the great positive impact of increased DO. Low levels of DO in wastewater indicate poor water quality and can result in adverse effects on aquatic ecosystems (Yan et al., 2024). The depletion of oxygen can lead to fish kills, the formation of anaerobic conditions, and the release of harmful substances (Mariu et al., 2023). Thus, monitoring DO levels is crucial for assessing the effectiveness of wastewater treatment processes, identifying potential environmental impacts, and conserving aquatic life.
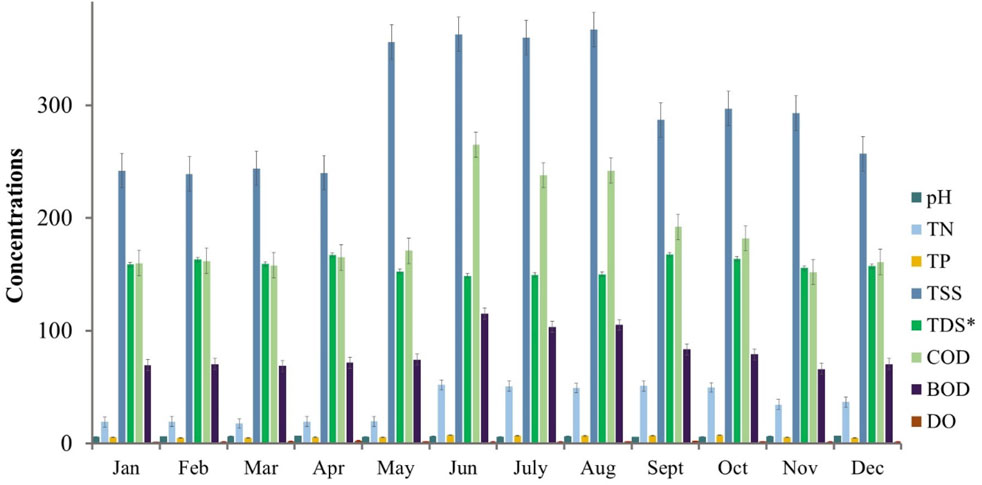
Figure 5. Variation in monthly concentrations during the study time. *TDS × 10.
3.6 CCME WQI analysis
The CCME WQI is a valuable tool that combines various water quality parameters into a single numerical value, providing an overall assessment of water quality (Gikas et al., 2020). In this case, the WQI ranked the influents as poor, with a value of 42.1 for the dry season, and marginal, with a value of 46.4 in the rainy season (Figure 6). The effluent values were 87.7 and 89.1 in the rainy and dry seasons, respectively. These values are categorized as good quality for environmental conditions (Table 1). The substantial improvement from influent to effluent suggested that a CW provides an effective, reliable treatment process. The higher effluent CCME WQI value indicates positive environmental impacts (Bessedik et al., 2021). Treated water with improved quality is less likely to harm ecosystems and can contribute to the overall health of water bodies. In such a way, the success reflected in the effluent CCME WQI value indicated that the constructed wetland was operating efficiently to provide essential, sustainable, and reliable treatment of wastewater over time.
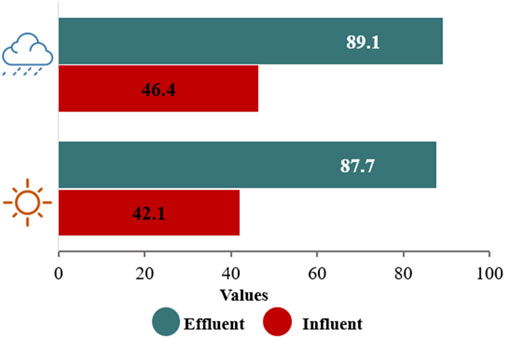
Figure 6. CCME WQI output values in the rainy and dry seasons.
Wastewater management is a substantial burden to the community, especially in developing countries, and this expresses the need for appropriate management policies that enhance the region’s beauty and sustainability as well. Despite recent methodologies developed for the treatment of wastewater, most are cost-effective and/or require complex use and maintenance. The constructed wetland, however, proved to be less expensive in terms of construction and maintenance; it is sustainable and also energy efficient compared to other existing wastewater treatment methods (Liu and Lipták, 2020).
The advantages of a CW are mentioned because they employ natural processes, such as wetland vegetation and associated microbial assemblages, to improve water quality (Bakar et al., 2020). In addition, CWs help to treat industrial or municipal wastewater, stormwater runoff, or greywater. Oliver et al. (2014) report that in poor and developing countries, wastewater is often under-treated. Ethiopia, a country located in the region, used CW to minimize wastewater pollution by 20%–93% in removal efficiency (Engida et al., 2020). Ethiopia is similar to Rwanda, where the lack of wastewater treatment increases water pollution and poor sanitation, whereas the treatment plant at Gacuriro in Kigali City proved to be useful in wastewater treatment (Nikuze et al., 2020). Nevertheless, the limited number of treatment facilities still hinders the treatment of wastewater, which threatens natural resources by increasing water pollution and poor sanitation across the country (Kazora and Mourad, 2018).
The results of the considered physicochemical parameters indicated high pollution before the wastewater enters the constructed wetland during the dry and rainy seasons compared to the WHO standards (Figures 3, 4). Most parameter concentrations were slightly reduced in rainy seasons due to the dilution of wastewater discharge, revealed by statistically significant by ANOVA (p < 0.05), except the DO that showed an increase during the rainy season, resulting in the enhancement of oxygen levels in water. However, the p-value of 0.09 (ANOVA, p > 0.05) means the difference is not statistically significant (Figure 2). In addition, the removal efficiencies during both rainy and dry seasons generated low values of the considered parameters at the effluent points (Figure 2), which shows the potential of CWs in wastewater treatment.
Benvenuti et al. (2018) reported that after wastewater was introduced into the constructed wetland, the organic matter and nutrients within the wastes were reduced to a satisfactory level. Some limitations should be considered in this study: First, due to the small number of CWs in the area, the results obtained from the single CW may limit the generalizability of the findings to other regions within Rwanda. Second, the study did not fully explore the influence of extreme weather conditions, such as heavy rainfall or prolonged dry periods, which can impact performance. Lastly, the time range of the study duration may not adequately capture long-term trends or the potential degradation of the constructed wetland’s efficacy over time. Future studies should aim to include multiple sites, assess seasonal and extreme weather impacts, and incorporate long-term monitoring to address these limitations.
4 Conclusion
This study was conducted with the aim of analyzing the impact associated with constructed wetlands in wastewater treatment, taking one located in the Remera Sector of Kigali in Rwanda as a case study. The researchers analyzed eight physicochemical parameters, namely, pH, TN, TP, TSS, TDS, COD, BOD, and DO, considering the rainy and dry seasons. The results disclosed a higher amount of pollution concentrations before the introduction of wastewater into the constructed wetland than effluent compared to the WHO standards. Mathematically, the latter ranged from removal efficiencies of 16% to 83% and improvements from 42.1 to 89.1 in terms of the CCME WQI ranks during the purification process. These findings underscore the effectiveness of CWs in treating wastewater, reducing pollutants, and promoting ecological balance. Based on these results, the effluent water revealed low pollution. It is suggested that different institutions in Rwanda apply CWs to treat wastewater to improve water quality for reuse and environmental suitability. Finally, the impact analysis presented in this study serves as a foundation for future research and policy development, emphasizing the potential of constructed wetlands as a pivotal component in Rwanda’s sustainable development.
Data availability statement
The original contributions presented in the study are included in the article/Supplementary Material; further inquiries can be directed to the corresponding author.
Author contributions
JN: Writing – original draft and Writing – review and editing. XC: Funding acquisition, Supervision, and Writing – original draft. TL: Conceptualization, Methodology, Supervision, and Writing – review and editing. CM: Supervision, Writing – original draft and Writing – review and editing. EH: Data curation, Visualization, and Writing – review and editing. RM: Writing – review and editing. MM: Writing – review and editing. AG: Formal analysis, Writing – original draft and Writing – review and editing. AU: Writing – review and editing. FM: Resources, Writing – original draft and Writing – review and editing. SN: Writing – review and editing.
Funding
The author(s) declare that financial support was received for the research and/or publication of this article. This research was funded by the Tianshan Talent Project of Xinjiang Uygur Autonomous Region, China (Grant number 2022TSYCLJ0056) and the Joint CAS-MPG Research Project (HZXM20225001MI).
Acknowledgments
The authors express their ample gratitude addressed to the China Scholarship Council (CSC) under the Chinese Academy of Sciences (CAS) for the doctoral scholarship award and the UNILAK-Environmental Research Center.
Conflict of interest
The authors declare that the research was conducted in the absence of any commercial or financial relationships that could be construed as a potential conflict of interest.
Generative AI statement
The author(s) declare that no Generative AI was used in the creation of this manuscript.
Publisher’s note
All claims expressed in this article are solely those of the authors and do not necessarily represent those of their affiliated organizations, or those of the publisher, the editors and the reviewers. Any product that may be evaluated in this article, or claim that may be made by its manufacturer, is not guaranteed or endorsed by the publisher.
References
Ahmad, H. A., Guo, B., Zhuang, X., Zhao, Y., Ahmad, S., Lee, T., et al. (2021). A twilight for the complete nitrogen removal via synergistic partial-denitrification, anammox, and DNRA process. NPJ Clean. Water 4 (1), 31. doi:10.1038/s41545-021-00122-5
Akhtar, N., Ishak, M. I. S., Ahmad, M. I., Umar, K., Md Yusuff, M. S., Anees, M. T., et al. (2021). Modification of the water quality index (WQI) process for simple calculation using the multi-criteria decision-making (MCDM) method: a review. Water 13 (7), 905. doi:10.3390/w13070905
Aniyikaiye, T. E., Oluseyi, T., Odiyo, J. O., and Edokpayi, J. N. (2019). Physico-chemical analysis of wastewater discharge from selected paint industries in Lagos, Nigeria. Int. J. Environ. Res. public health 16 (7), 1235. doi:10.3390/ijerph16071235
Baharvand, S., and Mansouri Daneshvar, M. R. (2019). Impact assessment of treating wastewater on the physiochemical variables of environment: a case of Kermanshah wastewater treatment plant in Iran. Environ. Syst. Res. 8 (1), 18–11. doi:10.1186/s40068-019-0146-0
Bakar, N. A., Othman, N., Yunus, Z., Daud, Z., Norisman, N. S., and Hisham, M. H. (2020). Physico-chemical water quality parameters analysis on textile. Pap. Present. A. T. IOP Conf. Ser. earth Environ. Sci. 498, 012077. doi:10.1088/1755-1315/498/1/012077
Benvenuti, T., Hamerski, F., Giacobbo, A., Bernardes, A. M., Zoppas-Ferreira, J., and Rodrigues, M. A. (2018). Constructed floating wetland for the treatment of domestic sewage: a real-scale study. J. Environ. Chem. Eng. 6 (5), 5706–5711. doi:10.1016/j.jece.2018.08.067
Bessedik, M., Abdelbaki, C., Badr, N., Tiar, S., and Megnounif, A. (2021). Application of water quality indices for assessment of influent and effluent wastewater from wastewater treatment plant of Oran City, Algeria. Desalination Water Treat. 236, 306–317. doi:10.5004/dwt.2021.27682
Brix, H. (2020). Wastewater treatment in constructed wetlands: system design, removal processes, and treatment performance Constructed wetlands for water quality improvement. Boca Raton, Florida: CRC Press, 9–22. doi:10.1201/9781003069997
de Jesus Gaffney, V., Cardoso, V. V., Cardoso, E., Teixeira, A. P., Martins, J., Benoliel, M. J., et al. (2017). Occurrence and behaviour of pharmaceutical compounds in a Portuguese wastewater treatment plant: removal efficiency through conventional treatment processes. Environ. Sci. Pollut. Res. 24, 14717–14734. doi:10.1007/s11356-017-9012-7
Engida, T., Alemu, T., Wu, J., Xu, D., Zhou, Q., and Wu, Z. (2020). Analysis of constructed wetlands technology performance efficiency for the treatment of floriculture industry wastewater, in Ethiopia. J. Water Process Eng. 38, 101586. doi:10.1016/j.jwpe.2020.101586
Gikas, G., Sylaios, G., Tsihrintzis, V., Konstantinou, I., Albanis, T., and Boskidis, I. (2020). Comparative evaluation of river chemical status based on WFD methodology and CCME water quality index. Sci. Total Environ. 745, 140849. doi:10.1016/j.scitotenv.2020.140849
Kazora, A. S., and Mourad, K. A. (2018). Assessing the sustainability of decentralized wastewater treatment systems in Rwanda. Sustainability 10 (12), 4617. doi:10.3390/su10124617
Khan, S. A. R., Ponce, P., Yu, Z., Golpîra, H., and Mathew, M. (2022). Environmental technology and wastewater treatment: strategies to achieve environmental sustainability. Chemosphere 286, 131532. doi:10.1016/j.chemosphere.2021.131532
Li, J., Luo, G., He, L., Xu, J., and Lyu, J. (2018). Analytical approaches for determining chemical oxygen demand in water bodies: a review. Crit. Rev. Anal. Chem. 48 (1), 47–65. doi:10.1080/10408347.2017.1370670
Mariu, A., Chatha, A. M. M., Naz, S., Khan, M. F., Safdar, W., and Ashraf, I. (2023). Effect of temperature, pH, salinity and dissolved oxygen on fishes. J. Zoology Syst. 1 (2), 1–12. doi:10.56946/jzs.v1i2.198
Mbateye, F., Wali, U., and Banadda, N. (2010). Assessment of wastewater management practices in Kigali City, Rwanda. Open Environ. and Biol. Monit. J. 3 (1). doi:10.2174/1875040001003010021
Nhapi, I., Wali, U., Twagirayezu, B., Kimwaga, R., and Banadda, N. (2013). Performance evaluation of a hybrid natural wastewater treatment pond system in Kigali, Rwanda. BIOINFO Environ. Pollut.
Nikuze, M., Niyomukiza, J., Nshimiyimana, A., and Kwizera, J. (2020). Assessment of the efficiency of the wastewater treatment plant: a case of Gacuriro Vision City. Pap. Present. A. T. IOP Conf. Ser. Earth Environ. Sci. 448, 012046. doi:10.1088/1755-1315/448/1/012046
Obaideen, K., Shehata, N., Sayed, E. T., Abdelkareem, M. A., Mahmoud, M. S., and Olabi, A. (2022). The role of wastewater treatment in achieving sustainable development goals (SDGs) and sustainability guideline. Energy Nexus 7, 100112. doi:10.1016/j.nexus.2022.100112
Oliver, C., Radcliffe, D., Risse, L., Habteselassie, M., Mukundan, R., Jeong, J., et al. (2014). Quantifying the contribution of on-site wastewater treatment systems to stream discharge using the SWAT model. J. Environ. Qual. 43 (2), 539–548. doi:10.2134/jeq2013.05.0195
Onu, M. A., Ayeleru, O. O., Oboirien, B., and Olubambi, P. A. (2023). Challenges of wastewater generation and management in sub-Saharan Africa: a Review. Environ. Challenges 11, 100686. doi:10.1016/j.envc.2023.100686
Organization, W. H. (2006). A compendium of standards for wastewater reuse in the Eastern Mediterranean Region.
Saalidong, B. M., Aram, S. A., Otu, S., and Lartey, P. O. (2022). Examining the dynamics of the relationship between water pH and other water quality parameters in ground and surface water systems. PloS one 17 (1), e0262117. doi:10.1371/journal.pone.0262117
Szopińska, M., Artichowicz, W., Szumińska, D., Kasprowicz, D., Polkowska, Ż., Fudala-Ksiazek, S., et al. (2024). Drinking water safety evaluation in the selected sub-saharan African countries: a case study of Madagascar, Uganda and Rwanda. Sci. Total Environ. 947, 174496. doi:10.1016/j.scitotenv.2024.174496
Tzanakakis, V. A., Paranychianakis, N. V., and Angelakis, A. N. (2020). Water supply and water scarcity, 12. Basel, Switzerland: MDPI, 2347. doi:10.3390/w12092347
Van Vliet, M. T., Jones, E. R., Flörke, M., Franssen, W. H., Hanasaki, N., Wada, Y., et al. (2021). Global water scarcity including surface water quality and expansions of clean water technologies. Environ. Res. Lett. 16 (2), 024020. doi:10.1088/1748-9326/abbfc3
Waly, M. M., Ahmed, T., Abunada, Z., Mickovski, S. B., and Thomson, C. (2022). Constructed wetland for sustainable and low-cost wastewater treatment: review article. Land 11 (9), 1388. doi:10.3390/land11091388
Wang, Y., Mou, J., Liu, X., and Chang, J. (2021). Phosphorus recovery from wastewater by struvite in response to initial nutrients concentration and nitrogen/phosphorus molar ratio. Sci. Total Environ. 789, 147970. doi:10.1016/j.scitotenv.2021.147970
Yan, X., Han, H., Li, X., Wen, J., Rong, X., Xia, Y., et al. (2024). Dissolved organic carbon and dissolved oxygen determine the nitrogen removal rate constant in small water bodies of intensive agricultural region. Agric. Ecosyst. and Environ. 361, 108822. doi:10.1016/j.agee.2023.108822
Keywords: constructed wetland, effluent, influent, Rwanda, wastewater treatment
Citation: Nsanzabaganwa J, Chen X, Liu T, Mupenzi C, Hakorimana E, Mind'je R, Mujawayezu ML, Gasirabo A, Umugwaneza A, Malayika F and Niyonsenga S (2025) Impact analysis of constructed wetland for wastewater management in Rwanda. Front. Environ. Sci. 13:1559624. doi: 10.3389/fenvs.2025.1559624
Received: 13 January 2025; Accepted: 27 February 2025;
Published: 28 April 2025.
Edited by:
Christos S. Akratos, Democritus University of Thrace, GreeceCopyright © 2025 Nsanzabaganwa, Chen, Liu, Mupenzi, Hakorimana, Mind'je, Mujawayezu, Gasirabo, Umugwaneza, Malayika and Niyonsenga. This is an open-access article distributed under the terms of the Creative Commons Attribution License (CC BY). The use, distribution or reproduction in other forums is permitted, provided the original author(s) and the copyright owner(s) are credited and that the original publication in this journal is cited, in accordance with accepted academic practice. No use, distribution or reproduction is permitted which does not comply with these terms.
*Correspondence: Xi Chen, Y2hlbnhpQG1zLnhqYi5hYy5jbg==