 Patricia N. Manley
 Liraz Bistritz
 Nicholas A. Povak
 Michelle A. Day3
- 1USDA Forest Service Pacific Southwest Research Station, Placerville, CA, United States
- 2USDA Forest Service Pacific Southwest Research Station, Milwaukee, WI, United States
- 3USDA Forest Service Rocky Mountain Research Station, Corvalis, OR, United States
Introduction: Growing concerns about fire across the western United States, and commensurate emphasis on treating expansive areas over the next 2 decades, have created a need to develop tools for managers to assess management benefits and impacts across spatial scales. We modeled outcomes associated with two common forest management objectives: fire risk reduction (fire), and enhancing multiple resource benefits (ecosystem resilience).
Method: We evaluated the compatibility of these two objectives across ca. 1-million ha in the central Sierra Nevada, California. The fire strategy focused on short-term fire risk reduction, while the ecosystem strategy focused on longer-term resilience. Treatment locations were selected using a spatial optimization model, ForSys, and each scenario was evaluated at two levels of accomplishment: 50% and 75% of each landscape unit in desired condition across the landscape.
Results: At the 50% threshold level, the hectares selected were complementary, with little overlap in treated areas between the fire and ecosystem scenarios. Additional hectares needed to reach the 75% threshold level, however, overlapped substantially between the two scenarios, indicating that tradeoffs are required to reach the 75% level for either objective. We then compared the ability of each scenario to contribute to their respective objectives, including individual socio-ecological outcomes (four pillars) and overall resilience based on the Framework for Resilience. The Fire scenario primarily benefited fire-risk reduction to communities in the wildland urban interface. In contrast, the Ecosystem scenario exhibited the greatest improvements in forest resilience, carbon, and biodiversity, but did not perform as well for reducing fire risk to communities.
Discussion: Short-term fire risk reduction and long-term resilience objectives can be complementary within a landscape, but ecosystem resilience is not a guaranteed co-benefit when fire risk reduction is the primary objective. Rather, improving ecosystem resilience cannot be achieved quickly because many desired forest conditions require both deliberate strategic action to guide the location, character, and timing of management as a disturbance agent, as well as adequate time for landscape conditions to improve and resilience benefits to be realized.
1 Introduction
Prolonged fire suppression and logging practices throughout the 20th century across the Western US, combined with longer and more severe fire seasons, have left large extents of forests vulnerable to fire and drought stress as a result of high tree densities and high fuel levels (Hessburg and Agee, 2003; Hessburg et al., 2005; Calkin et al., 2015). The persistence of these forests is threatened by wildfires that continue increasing in frequency and intensity (Calkin et al., 2015; Haugo et al., 2019). The extent and frequency of high-severity fires are currently higher than historical regimes and are projected to continue to pose a threat to humans and infrastructure, as well as the persistence of forested ecosystems in some places.
Forests have evolved with fire as an essential ecological process across Western North America (Wright and Bailey, 1982). Therefore, continuing to limit the occurrence of fire on these landscapes is not a viable option, yet there is a lack of consensus as to the role of management in assisting the reintroduction of fire and surrogates to fire (e.g., mechanical thinning) into these systems. Large landscape planning efforts directed at reducing fire risk increasingly are using prescribed burning as a mode of reintroducing fire and achieving multiple benefits through these investments (Calkin et al., 2015; Dunn et al., 2017). Fire risk reduction treatments typically have a narrow short-term objective of reducing localized fire risk, commonly targeting stand-scale fire severity and infrastructure exposure. However, localized fire risk reduction objectives may fall short of meeting longer-term resource goals across the landscape, which hold the key to improving ecological conditions and fire behavior outcomes at the landscape level (Finney et al., 2007). In other words, reducing localized fire risk does not necessarily affect fire behavior across larger scales or longer time periods, and could potentially undermine broad-scale multiple resource objectives across landscapes.
Changing climate is expected to have significant impacts on forest ecosystems across the West that will vary substantially within and among ecoregions (Thorne et al., 2018). The central Sierra region in California, USA, for example, is characterized by steep climatic and ecological gradients from dry hardwood-dominated foothills to high-elevation conifer-dominated subalpine areas with persistent winter snowpacks (Jeronimo et al., 2019). This diverse landscape is expected to experience a broad spectrum of climate constraints, with impacts being greater at lower elevations (below 1,000 m) where temperatures are typically higher and precipitation lower compared to the higher elevations (above 2000 m) where current persistent snowpack during the winter appears to buffer these areas from significant near-term climate impacts (Povak and Manley, 2024).
Improving ecosystem resilience is a commonly stated objective of landscape-level management (Thompson et al., 2009; U.S. Forest Service, 2016). Resilience refers to the capacity of systems to cope with and adapt to stress and disturbance while retaining characteristic functions and benefits over time (Walker et al., 2004). Resilient conditions by definition carry a lower risk of ecosystem degradation, including reduced risks to ecosystem function from fire. Ecosystem resilience is often stated as a longer-term objective that considers the cumulative effects of management and climate with the intention of maintaining and sustaining ecosystem services (Bone et al., 2016).
Although improved landscape resilience is a commonly expressed desire in managing fire-prone landscapes, fire risk reduction is the predominant objective in most planning efforts and the concept of resilience often gets reduced to a resilience to fire (Calkin et al., 2011; USDA and USDI, 2014; Meyer et al., 2015; Schultz et al., 2019). As a result, ecosystem resilience is rarely treated as a primary objective, rather it is commonly assumed that some gains in resilience will result from reducing the near-term risk of fire, and that more intentional management toward long-term resilience will follow. Conversely, it is generally assumed, but rarely tested, that treatments with the primary objective of ecosystem resilience will not sufficiently reduce the risk of fire impacts on humans and infrastructure to satisfy societal demands for near-term risk reduction. The measurement and evaluation of management outcomes beyond fire risk reduction are commonly limited to summarizing co-benefits without the context of how these gains measure up to what is desired or required to achieve resilience objectives.
Understandably, it is socially challenging to justify sacrificing near-term fire risk reduction for gains in broader, longer-term restoration and resilience goals. Risk reduction is commonly accompanied by a sense of urgency, evidenced by both land managers and scientists calling for an increase in the ‘pace and scale’ of actions to the reduce risks of wildfire across the western U.S. (e.g., North et al., 2012; Haugo et al., 2015; Cannon et al., 2020). In turn, the additional funding required to support increased activities comes with the expectation of economic efficiency. In response, planning and assessment efforts commonly consider a measure of return on investment (benefit or avoided loss per dollar invested) to help inform and guide the type and location of management activities (North, 2012; Kreitler et al., 2020). Addressing return on investment then invokes the technical challenge of measuring and interpreting cost and benefits across complex landscapes.
Here, we provide a case study that evaluates the relative efficacy (pace and effectiveness) of treatments designed to reduce the local risk of high-severity fire with those designed to improve ecological resilience. We showcase an application of a new methodology for strategically locating treatments where they are most likely to be effective in improving conditions relevant to ecological resilience in a changing climate (Povak et al., 2024) and thereby enhance long-term resilience. We also use a new framework for socio-ecological resilience (Manley et al., 2023) to structure and evaluate the performance of each scenario in improving conditions and enhancing overall resilience. Specifically, we compare two different treatment scenarios: 1) a fire risk reduction-driven scenario designed to reduce the risk of high-severity fire at the stand-scale (Scott et al., 2013); and 2) an ecosystem resilience-driven scenario designed to maximize the diversity of benefits across multiple ecological sectors (aka pillars, as per Manley et al., 2023) toward enhanced longer-term resilience across the landscape. In comparing the performance of these two scenarios, we addressed the following questions:
1) To what degree can a fire risk reduction-driven objective accomplish multiple resource benefits toward greater resilience?
2) To what degree can a multiple resource benefit-driven objective accomplish fire risk reduction?
3) What unintended outcomes result from management objectives that are narrowly versus broadly defined?
2 Materials and methods
2.1 Study area
The study area was the 978,000 ha (2.4 million acres) Tahoe Central Sierra Initiative (TCSI) landscape located in the central Sierra Nevada of California and Nevada, United States (Figure 1). This landscape is an illustrative case study because it spans a diversity of socio-ecological environments and is representative of the complexity that managers face in accounting for future climate when planning treatments. It encompasses various landownerships, including federal, state, nonprofit, and private entities. Public lands are a primary focus for reducing fire risk, but there is also an expectation that they will continue to provide a broad array of essential ecosystem services (Kline et al., 2013). The TCSI landscape is dominated by forests (approximately 840,000 ha or 86% of the landscape) and by federal lands (approximately 80%), consisting of four National Forests: Tahoe (44%), Eldorado (23%), Lake Tahoe Basin Management Unit (9%), and Plumas (3%). This landscape spans an elevational gradient ranging from 900 m to over 3,300 m and includes an array of different climate classes, from dry foothills to cool mesic high montane.
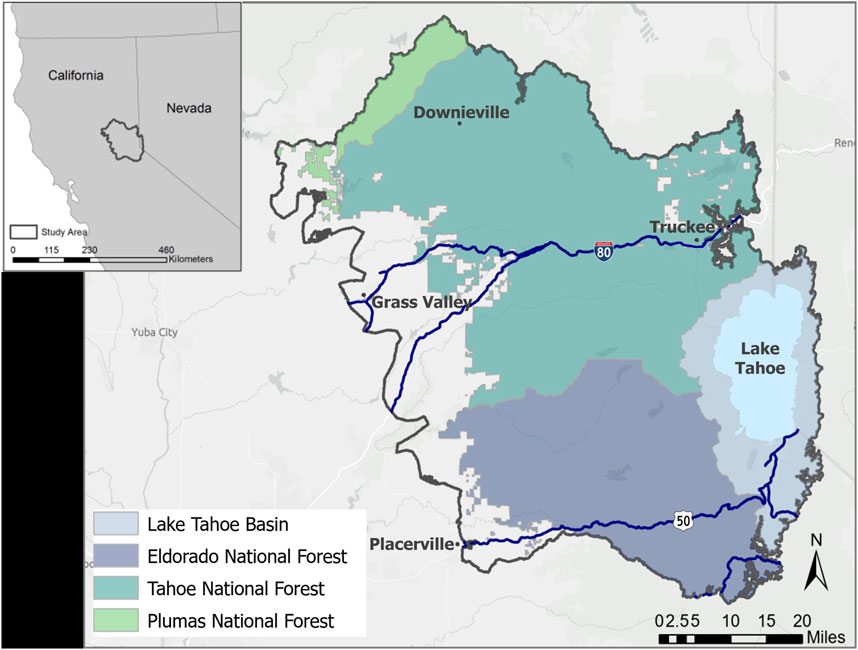
Figure 1. Tahoe Central Sierra Initiative study area in the Sierra Nevada, California and Nevada, United States. The area consists primarily of National Forest System lands, with the remaining area occupied by state lands and private lands.
In the central Sierra Nevada, the potential risk of degradation and loss to infrastructure and forest ecosystems from high-intensity fire is great (Williams et al., 2023). Forests in this region are particularly fire-prone given extreme drought conditions from 2016 to 2019 (Belmecheri et al., 2016), prolonged fire seasons due to higher temperatures during summer and fall seasons (Petrie et al., 2022), and high fuel loading in unburned forests resulting from fire suppression and tree mortality (Steel et al., 2015). Natural resource agencies across the state of California are putting substantial effort toward strategic planning and expedited management implementation to reduce the risk of negative impacts from high-intensity fire as quickly as possible (California Natural Resources Agency, 2021).
2.2 Framework for socio-ecological resilience
We used the Ten Pillars of Socio-ecological Resilience Framework (Framework; Manley et al., 2023) as the foundation for evaluating the performance of each scenario. The Framework consists of 10 pillars representing the primary facets of socio-ecological systems. These pillars span a broad spectrum of the interdependent ecological and social components of wildland-dominated landscapes and portray landscape-scale outcomes that, in aggregate, reflect ecosystem resilience. Each pillar consists of one to three elements that reflect the primary features of that pillar, and each element is represented by one or more metrics, which are measurable characteristics relevant to the resilience of individual elements and their associated pillar. The information hierarchy provided by the Framework enabled us to readily compare scenario performance for individual metrics, individual pillars, and across multiple pillars to make inferences about overall ecosystem conditions and anticipated resilience to future disturbances, including climate change. In this case study, we restricted the analysis to five pillars based on available data: Forest Resilience, Fire Dynamics, Fire-adapted Communities, Carbon Sequestration, and Biodiversity Conservation (Table 1).
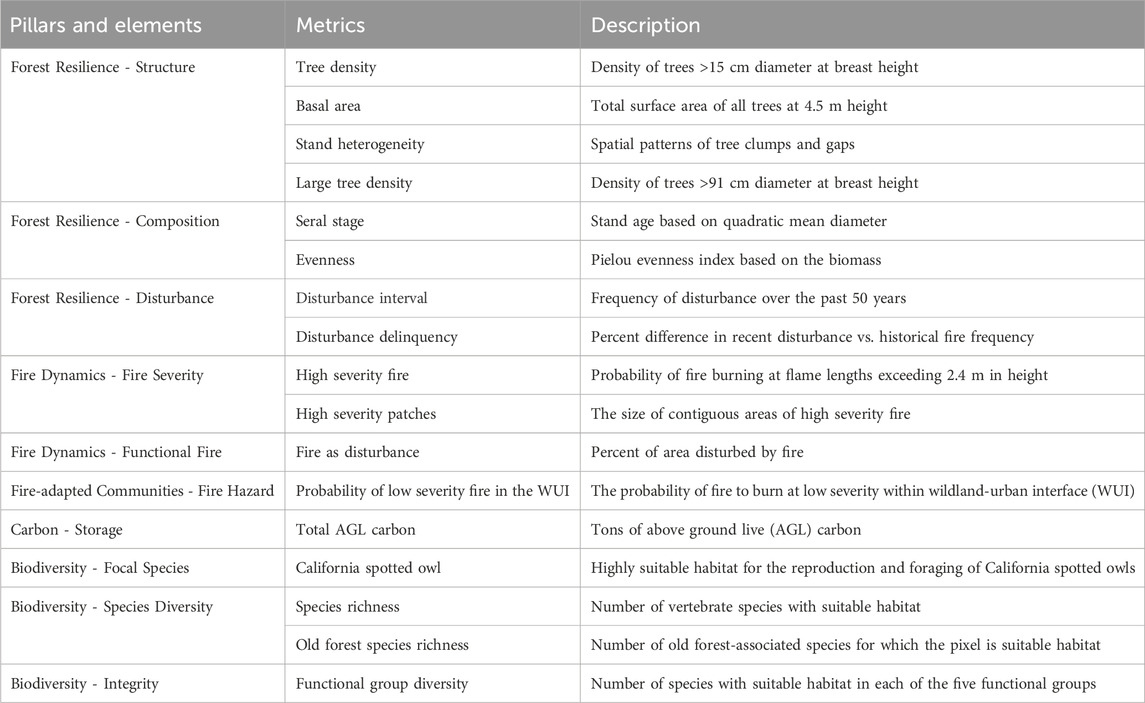
Table 1. Pillars, elements and metrics used to represent ecosystem conditions and evaluate Fire and Ecosystem scenario performance. Pillar and elements are adopted from the Framework for Socio-ecological Resilience (Manley et al., 2023).
The ultimate goal of the analyses was to derive optimal treatment locations to satisfy the objectives of the two scenarios 1) fire risk reduction and 2) ecosystem resilience, and evaluate improvements across the five pillars resulting from management (Supplementary Figure S1). The workflow starts with representations of individual metrics based on raw data, to interpretations of conditions at metric to pillar levels (condition scores), to the evaluation of future potential to achieve and maintain favorable conditions (PROMOTE scores). These data interpretations were then used as the basis for prioritizing the selection of areas for treatment and measures of achieving desired outcomes. Each step of the analysis is described below.
2.3 Current and future conditions and scores
The five pillars were represented by a total of 21 metrics (Table 1 and 1S). Each metric was represented by individual data layers (30 × 30-m cell resolution) that were obtained from publicly available sources (Table 1S; Manley et al., 2023). Current conditions reflected the 2020 base year. Current condition for each metric was translated into a continuous condition score ranging from +1, favorable conditions, to −1, unfavorable conditions (Povak et al., 2024). The determination of favorable and unfavorable was based on published literature on climate resilient conditions for the ecosystems in the landscape. For some metrics, higher values are more favorable (e.g., biodiversity, stable carbon, large tree density), and we rescaled the existing range of values across the landscape based on a positive linear relationship to range from −1 (lowest values) to +1 (highest values). For other metrics (e.g., probability of high intensity fire), lower values are more favorable, and we rescaled the existing range of values across the landscape based on a negative linear relationship to range from −1 (highest values) to +1 (lowest values) (see Manley et al., 2023 for details).
Future conditions for each metric were estimated to evaluate the potential to achieve favorable metric conditions by mid-21st century, and they were then similarly scored from +1 to −1 based on a combination of the central tendency and variability of conditions over 4 decades into the future (to 2060). The 40-year, mid-century guidepost was selected to encompass typical 10–30-year time-horizons for land management planning. We endeavored to generate a “worst case” representation of climate pressures on landscape conditions, accomplished by restricting management to private timber lands and to public lands within the wildland urban interface (<0.4 km of buildings and powerlines; Stein et al., 2013). Future conditions were modeled using a dynamic landscape simulation model LANDIS-II (Scheller et al., 2007). LANDIS-II simulates forest ecosystems processes over time and can be used to simulate changes in forest conditions in response to future climate and management. The model was run over a 40-year period (2020–2060) under the MIROC5 climate model, RCP 8.5 (the most extreme but still plausible future climate; Bedsworth et al., 2018). For each metric, LANDIS-II modeling provided a range of potential future outcomes, based on decadal values over the 40-year period and five replicate model runs, for a total of 20 values for each metric. The average and variation of these 20 values for each unit of analysis were used to represent the potential to achieve favorable conditions for each metric as representations of future climate constraints (see Manley et al., 2023 for details).
2.4 Management strategy and resilience scores
The PROMOTE modeling system (Povak et al., 2024) was used to determine the management strategy that most closely aligned with future climate constraints based on the combination of current and future conditions. The bivariate juxtaposition of current and future condition scores are used to generate Cartesian coordinates and assign associated management strategy scores that represented the strength of association with each of the four PROMOTE management strategies: monitor, protect, adapt, and transform (Manley et al., 2023; Povak et al., 2024). The PROMOTE strategy scores and designations generated by the model align well with other prevailing 3-parted climate strategies, specifically the RAD (resist, adapt, direct) approach (Schuurman et al., 2022; Williams, 2022), with the addition of no-management (monitor strategy) and the added ability to quantify and map the strength of support for each management strategy as well as the dominant strategy affiliation.
A strategy score (ranging from −1 to +1) was generated for each of the four PROMOTE strategies for each pixel in the TCSI landscape. ‘Monitor’ areas are currently in favorable condition and are expected to persist in the future without management intervention. This ‘wait and watch’ strategy is a unique addition to the 3-parted RAD system and serves to complete the suite of potential management options in the planning process. ‘Protect’ areas are currently in favorable condition but are vulnerable to climate impacts in the future. In these areas, management intervention may help to maintain favorable conditions into the future, and it aligns well with the RAD ‘resist’ climate strategy. ‘Adapt’ areas are currently in unfavorable condition but are expected to achieve and maintain favorable conditions even with changing climate. In these areas, management can improve resilience, and it aligns well with the RAD ‘adapt’ climate strategy. ‘Transform’ areas are currently in unfavorable condition and fundamental changes in form and function are likely to occur with changing climate. Management investments toward retaining and improving current conditions are less likely to be successful, and it aligns well with the RAD ‘direct’ climate strategy. Strategy scores can be used to prioritize management in areas with a greater potential to achieve and maintain favorable conditions. Based on the PROMOTE scores derived for each cell, we generated a composite ecosystem condition score to evaluate overall resilience across the landscape. The Ecosystem resilience score represents the average condition across metrics, elements, and pillars for a given cell. For elements represented by more than one metric, the current condition scores were averaged separately for the current and future conditions. These element-level scores were then averaged together following the same averaging method as for the metrics to calculate the pillar-level score. Finally, the five pillar-level scores were averaged to calculate the overall Ecosystem resilience score.
2.5 Treatment scenarios
We used the current condition scores and management scenario scores at the metric and pillar levels as the basis for selecting areas for treatment and evaluating their efficacy for two different objectives: fire risk reduction and overall ecosystem resilience. The Fire Risk Reduction (Fire) and Ecosystem Resilience (Ecosystem) scenarios differed substantially in their objectives and design. The Fire scenario was intended to move the landscape toward the ability to use fire as a primary management tool as quickly as possible. Toward that end, the objective of the treatments was to reduce fuel levels such that they were most likely to burn at low severity if a fire were to occur, and to achieve that condition across 50% and then 75% of each landscape unit. Alternatively, the Ecosystem scenario was intended to move the landscape toward improved conditions across as many resource areas (pillars) as possible. The objective of the treatments, therefore, was to prioritize locations where the largest number of resources could be moved toward favorable conditions and avoid selecting areas that would have minimal benefit. As with the Fire scenario, treatments were modeled such that 50% and then 75% of the landscape met the established threshold for resilience (as described below).
As a secondary objective for the scenarios, we identified areas that met criteria for protecting high value resource conditions while taking future climate constraints (PROMOTE scores) into consideration, for a total of seven resource classes (Table 2). The following resources included in the high value resource class: old growth forests (35.4%), high biodiversity areas (9.7%), and high stable carbon areas (8.8%). Old forests were forests with an average diameter >61 cm. High biodiversity areas were locations with biodiversity pillar values (Manley et al., 2023) in the top 10% of the range of values across the landscape. Similarly, high carbon areas were locations with carbon pillar values in the highest 10% across the landscape. High value resources were considered in moderate condition if they are currently in unfavorable condition, but they are expected to achieve and maintain favorable conditions in the future (i.e., ‘Adapt’ strategy). High value resources considered to be at risk from climate were areas that are currently in favorable condition but are vulnerable to climate impacts in the future (i.e., “Protect” strategy).
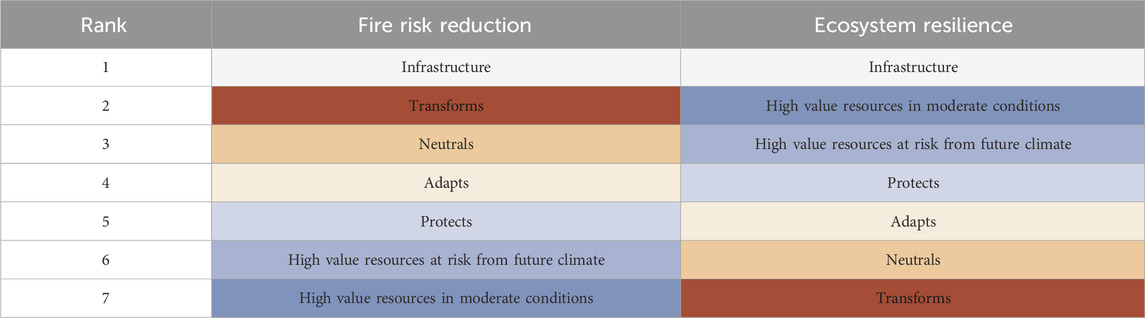
Table 2. Rank order of resource classes used to prioritize selection for treatment by the ForSys optimization model. Rank order differed between the two management scenarios evaluated: Fire risk reduction and Ecosystem resilience. Color ramp across classes represents the degree to which they meet target conditions considered resilient to future disturbances, with blue indicating more favorable and orange indicating less favorable conditions.
The seven resource classes were given different rank priorities for treatment between the two scenarios based on the assumption that fuel reduction treatments would change stand structure more substantially than ecosystem treatments. Both scenarios placed the highest priority on reducing fuels within the wildland-urban interface toward protecting public safety and valuable infrastructure, but priorities among the two scenarios diverged after that. The Fire scenario prioritized locations that exhibited the poorest condition and were most vulnerable to future climate, whereas these conditions were of lowest priority in the Ecosystem scenario (Table 2). Monitors were not included as a resource class because we gave them a zero probability of selection.
2.5.1 Fire Scenario
For the Fire scenario, the objective of management was for the landscape to be dominated by favorable fire conditions (condition score of +1) defined by areas that were most likely (>75% probability) to burn at low intensity (Table 1). Locations that did not meet that probability threshold were the target for treatment. The probability of low severity fire for 2020 was estimated by Pyrologix LLC (Volger et al., 2021) as part of a spatial wildfire hazard assessment across all land ownerships for the state of California. Volger et al. (2021) used the Wildfire Exposure Simulation Tool (WildEST), a deterministic wildfire modeling tool generally following methods outlined in Scott et al. (2013), to calculate fire severity probabilities. WildEST integrates variable weather input variables and weights them based on how likely they will be realized on the landscape.
The landscape was divided into subunits to distribute treatments across the landscape. For the Fire scenario, we used Potential Operational Delineations (PODs; Dunn et al., 2020) as the landscape units used to achieve the 50% and 75% threshold levels. PODs are fire management polygons developed by the U.S. Forest Service that reflect effective fuel breaks for managing fire (wildfire or prescribed) within each unit. Their boundaries are commonly defined by roads, natural barriers (e.g., rock outcrops, water bodies), ridges, and other potential fire control features. There were 382 PODs in the study area.
Treatment locations were selected such that the percentage area targets were achieved for each POD, thereby distributing treatments across the landscape and readying each POD for fire. In the Fire scenario, areas already in favorable condition were low priority for treatment, to reduce the potential of impacts from management. The seven resource classes had the following order of priority (high to low) in the placement of treatments in the Fire scenario, reflecting decreasing socio-ecological value: wildland-urban interface around infrastructure, transforms, neutrals, adapts, protects, high-value resources in moderate condition, and high-value resources at risk from future climate (Table 2).
2.5.2 Ecosystem scenario
For the Ecosystem scenario, the primary objective was to move as many metrics and pillars toward favorable conditions across the landscape as possible to enhance landscape dynamics and overall ecosystem resilience. Favorable condition (condition score of +1) was defined as an Ecosystem resilience score above 0.25. We first identified metrics that management could move toward favorable conditions within the 40-year management period reflected by future conditions. Fourteen of the 21 metrics (one to three per pillar) across the five pillars of the Framework were identified as potentially affected by management (Table 3). For example, high forest density is a primary focus of management, however large tree density is not readily improved through management and therefore is not considered a metric capable of improvement via management intervention. For each cell, we quantified the number of pillars with conditions that management could improve, and the tally of the number of “improvable” pillars was the primary driver of treatment selection locations; the more improvable pillars, the higher the priority for treatment (Supplementary Table 2S).
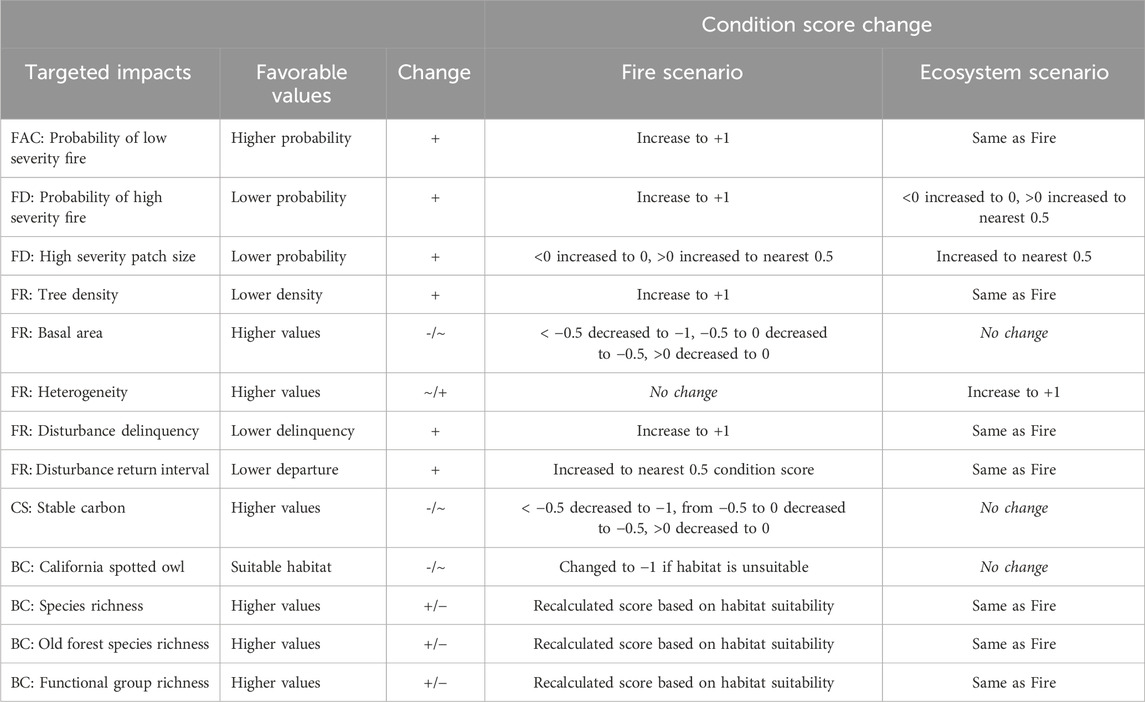
Table 3. Metrics affected by treatments and the expected changes associated with each of two management scenarios: Fire risk reduction (Fire) and Ecosystem resilience (Ecosystem). FAC = Fire adapted communities; FD = Fire dynamics; FR = Forest resilience; CS = Carbon sequestration; and BC = Biodiversity conservation.
As with the Fire scenario, the Ecosystem scenario had two target outcomes: 50% and 75% of the landscape meeting the threshold of >0.25 for the ecosystem resilience score. In contrast to PODS used in the Fire scenario, the Ecosystem scenario was based on HUC-12 (Hydrologic Unit Code) watersheds as the landscape units used to achieve the 50% and 75% threshold levels for achieving the objective of improved ecosystem resilience. HUCs are hydrological units delineated by the US Geological Survey (USGS) (Seaber et al., 1987), and HUC-12 watersheds generally range from 4,000 to 12,000 ha in size. They provide a consistent, well-established basis for landscape units that have ecological relevance to resource objectives. They are often used as planning units in forest management applications (Keane et al., 2010). There were 119 HUC-12 watersheds in the study area.
Treatments were directed at protecting and supporting areas with higher ecological value and enhancing areas with the greatest potential to achieve and retain favorable ecological conditions (Table 2), since these were areas that were likely to make the greatest contribution to improving ecosystem conditions and resilience in the near- and long-term. As such, the seven resource classes had the following order of priority (high to low) in the placement of treatments for the Ecosystem scenario: wildland-urban interface around infrastructure, high-value resources at high risk from future climate, high-value resources in moderate condition, Protects, Adapts, Neutrals, and Transforms (Table 2).
2.6 Treatment optimization
The ForSys Scenario Planning model was used to optimize the location of for treatment based on the priorities identified for each scenario. ForSys was developed specifically for multi-objective forest restoration and fuel management planning (Ager et al., 2013). The seven resource classes (Table 2) were assigned a rank value unique to each scenario representing their priority for selection (lower priorities assigned higher rank values), and the model then selected cells based on priority resource classes (Table 2) combined with the priority condition metric scores for each scenario (fire severity for Fire, pillar tally for Ecosystem). The rank order for the combination of resource classes and the pillar tally reflected the high priority for infrastructure risk reduction, and then a balance between the two objectives (Table 3S). The landbase included all non-urban areas, and all vegetated areas were available for selection for treatment.
The scenarios were run to build 40-ha treatment units (representing a minimum area that is economically viable to treat) until the treatment constraint was met, which resulted in the model also optimizing the selection of up to 40-ha cell clusters with the highest total priority. Both the Fire and Ecosystem scenarios ranked protecting infrastructures and their surroundings as the highest priority. Therefore, cells in the 100-m buffer around infrastructure were the first to be selected for treatment by the model in both scenarios; however, the constitution of the 40-ha treatment areas resulted in different units selected among the Fire and Ecosystem scenarios given the difference in priority rankings.
For treatments to effectively change landscape dynamics, a minimum proportion of the landscape needs to achieve the treatment objective (Finney et al., 2007). We set two thresholds for desired conditions for each landscape unit across the landscape that functioned as treatment constraints for ForSys. First, the highest priority cell clusters were selected in each landscape unit (POD or HUC) until 50% of each landscape unit met priority conditions. Importantly, hectares that were already in favorable condition counted toward the 50% target. The 50% level is based on empirical evidence that it is a general threshold for affecting landscape disturbance dynamics (e.g., Finney et al., 2007). In the second model run, additional pixels were selected to bring the proportion of the POD or HUC in favorable condition up to 75%. The 75% target level was selected as mid-point representation for the majority of the landscape unit being in desired conditions and improved landscape disturbance dynamics.
2.7 Scenario performance
2.7.1 Treatment effects
For each scenario, we assumed that all cells selected by ForSys were treated and that the treatments accomplished the intended objective. Specifically, a ruleset was established whereby the condition of a subset of metrics that are directly affected by treatments were improved by the treatment (Table 3). The effects of treatment on metrics were determined based on primary objectives of the scenario and observed correlations of raw values between target and non-target metrics (Supplementary Table 2S). Of the 21 metrics representing the five resource pillars, 14 were determined to be predictably affected (direction and magnitude) by standard treatment approaches (Table 3). That is, in lieu of directly modeling effects on each metric, we were able to confidently model the indirect impacts of fuel-reduction treatments by using simple rulesets based on the correlation matrix of the 21 metrics. Correlations greater than 0.25 and the direction (positive or negative) were considered linked and adjustments in conditions were made accordingly (Supplementary Table 3S). Of the 156 pair-wise combinations of the 14 metrics, 20 pairs of metrics (13%) were considered sufficiently correlated to be considered as linked responses.
Although we used a fairly simplistic approach to determining treatment outcomes, the alternative of modeled outcomes would require multiple assumptions about the type and intensity of treatments and time since treatment, which would have limited the applicability of the results. As such, our approach is easily repeatable and broadly applicable across different forest ecosystems. We made modest assumptions about management treatment effects, limiting them to expectations of standard forest practices (e.g., mechanical thinning and prescribed fire) and outcomes associated with standard silvicultural prescriptions applied to conifer forests in our study area (e.g., thin from below to reduce tree density, canopy contagion, and canopy fuels). Although we assumed that treatments were effective, this assumption is at the foundation of all management plans – that treatments as prescribed will be successful in achieving desired outcomes.
In the Fire scenario, all areas selected for treatment were assumed to fully achieve favorable conditions (condition score of +1) for four metrics: probability of low severity fire, probability of high severity fire, tree density and disturbance delinquency (Table 3). Fire scenario treatments were also assumed to directly affect canopy cover and thereby their habitat suitability for wildlife (based on the California Wildlife Habitat Relationships database; CWHR, 2014). Treated areas that had moderate to high canopy cover (>40% canopy cover) were assumed to be reduced to low canopy cover (25%–40%) post-treatment, corresponding with the objective of reducing canopy density and understory fuels required to achieve low severity fire effects (Volger et al., 2021). Changes in canopy affected all eight metrics in the Biodiversity Conservation pillar. Four additional metrics were identified as likely to be altered by fuel reduction treatments based on correlations observed among raw values of metrics across the analysis area (Supplementary Table 3S): basal area, stable carbon, probability of high severity patch size and disturbance return interval departure. We assumed that fire-focused treatments would not improve spatial heterogeneity in clumps and gaps, given that its lower priority for fuel reduction treatments. We considered impacts to basal area and carbon to be intermediate because they are highly dependent upon the character of the treatment (e.g., changes in tree density can result in small or large changes in basal area and carbon, depending on the trees removed), and impacts can be variable (neutral to negative) while still achieving low fire severity objectives.
In the Ecosystem scenario, all areas selected for treatment were assumed to fully achieve favorable conditions (condition score of +1) for four metrics: probability of low severity fire (infrastructure class only), tree density, heterogeneity, and disturbance delinquency (Table 3). Unlike the Fire scenario, we assumed that ecosystem restoration treatments would improve spatial heterogeneity, which is consistent with the objectives of the Ecosystem treatments. We also assumed that condition scores for tree density, the probability of high severity fire, and high severity patch size would be improved, but given that they were not a direct target of the scenario, they would be less impacted by treatments compared with the Fire scenario. Retention of large trees is a main objective within the Ecosystem scenario, so the effects on basal area and carbon are more ambiguous, and accordingly their condition scores were not affected by management. The disturbance return interval departure was adjusted the same as for the Fire scenario. Also, as with the Fire scenario, treatments were assumed to directly affect canopy cover and their habitat suitability for wildlife, but for the Ecosystem scenario we assumed a more moderate reduction in canopy cover and only for areas with initially high canopy cover (>60%), consistent with the objective of supporting multiple ecosystem services. Biodiversity Conservation pillar scores were recalculated based on the updated post-treatment habitat suitability ratings (CWHR, 2014).
Only the current condition scores were altered by treatment (improved or degraded or constant); future conditions were held constant in the evaluation of changes in PROMOTE strategy scores and treatment effects. Future conditions could potentially improve through management, but in our modeling we chose to represent future climate constraints as a “worst case scenario” to minimize assumptions associated with treatment responses over time.
2.7.2 Performance evaluation
Scenario performance was based on the comparison of pre- and post-condition for each of the two scenario objectives (probability of low severity fire and overall ecosystem resilience), in addition to the condition scores for each of the five pillars (Forest Resilience, Fire Dynamics, Fire-adapted Communities, Carbon Sequestration, and Biodiversity Conservation) used to derive the ecosystem resilience score. Scenario performance was evaluated for both target threshold levels: 50% and 75% of every landscape unit in favorable condition. We evaluated changes in the absolute values of scores for each outcome measure (metric, pillar, and ecosystem), as well as the relative changes in primary objectives of each scenario (fire risk reduction and ecosystem resilience) based on gains or losses per unit effort (hectare treated). Gains or losses per unit effort were calculated as changes in the score (potential range of −1 to +1) for each outcome per hectare treated. Relative gains were calculated as the ratio of the change per unit effort for the Fire and Ecosystem scenario.
3 Results
The Fire scenario improved multiple metrics, but improvement in overall ecosystem resilience was minor and lower than the Ecosystem scenario. Similarly, we found that the Ecosystem scenario had fire risk reduction benefits, but not to the degree observed with the Fire scenario. There were unanticipated efficiencies in the Ecosystem scenario, even given the larger area that needed to be treated compared to the Fire scenario.
3.1 Pre-treatment conditions
The extent of the landscape in each resource class varied substantially. The highest priority resource class for both scenarios was wildland-urban interface around infrastructure, which occupied just 3.9% of the forested landscape (Figure 2). Most of the forested landscape was occupied by high value resources in moderate condition (43.1%) and areas that were neutral in their affiliation with any given climate-informed management strategy (37.1%). The remaining five classes occupied the remaining 20% of the landscape. There were no areas that met the criteria for the ‘Protect’ management strategy.
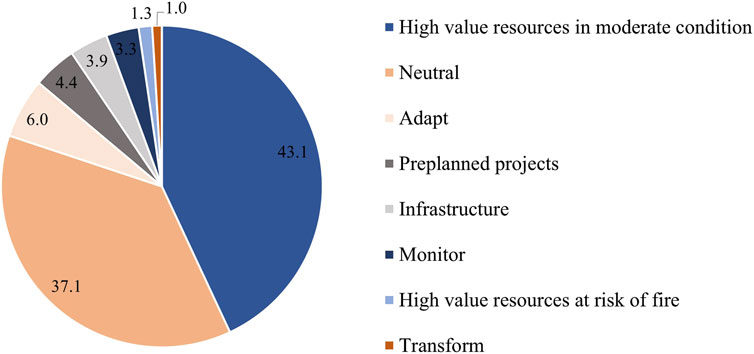
Figure 2. Proportion of the forested area in the landscape (840,000 ha) occupied by each of seven resource classes used to prioritize treatments for each of two management scenarios.
For the Fire scenario, prior to treatment over one-quarter (28.6%) of the forested landscape (236,443 ha) qualified as in favorable condition. However, the distribution of these areas was such that only 5.5% (n = 21) of the 382 PODs met the 50% threshold, and <1% (n = 3) met the 75% threshold of being in favorable condition, indicating that favorable conditions were not evenly distributed across the landscape. Many of the cells that qualified as favorable prior to treatment (11.9% of the landscape) had burned within the previous 10 years (e.g., 2014 King Fire; Figure 5). Additional areas in the landscape that met favorable fire conditions prior to treatment were water (6.3%), and rock (0.5%).
For the Ecosystem scenario, a small amount of the forested landscape, only 4.7% (39,968 ha), qualified as in favorable condition (Ecosystem Resilience score >0.25) prior to treatment. Initially, a total of 7.6% (n = 9) of the 119 HUC-12 landscape units met the 50% threshold and none met the 75% threshold. Cells that qualified as in favorable condition prior to treatment primarily consisted of pixels with old growth forest and high biodiversity scores. The number of pillars in any given cell that could be improved through treatment ranged from 0 to 4, with 75.9% of the forested landscape (637,560 ha) having one or more pillars that could be improved. Thus, in this landscape, the goal of reaching 75% of the landscape in more resilient conditions is close to the maximum possible benefit that management could achieve in the near term.
3.2 Treatment location selections
3.2.1 Fire scenario
The 50% threshold level for the Fire scenario resulted in 150,407 ha (18% of the forested area) selected for treatment across all PODs. The percent of the area selected for treatment in each resource class generally followed the rank order of priority (listed in order of priority for the Fire scenario): 46% of the at-risk infrastructure, 52% of transforms, 40% of neutrals, 34% of adapts, 14% of high value resources in moderate condition, and 4% of high value resources at risk from climate (Figure 3). However, the low percentages treated in the highest priority classes indicates a relatively low efficiency in accomplishing treatments in the top priority classes, given that these two classes combined occupied less than 40,000 ha. The size of the landscape units appeared to affect the ability of treatment selections to meet multiple objectives of reducing fire risk and treating high priority resource classes (see results for the Ecosystem scenario below).
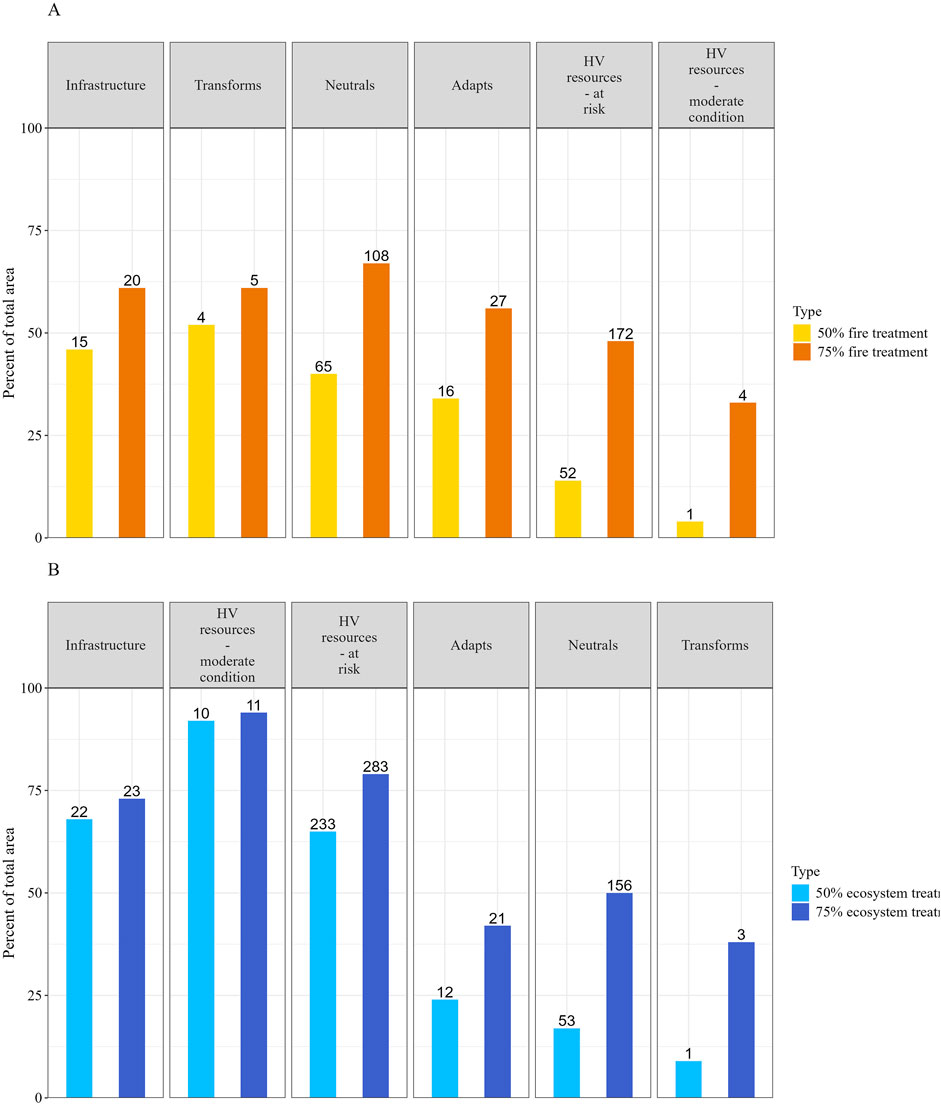
Figure 3. Percent of hectares selected by ForSys for each of two scenarios, Fire scenario (A) and Ecosystem scenario (B), in each of seven resource classes shown in order of priority from left to right for each scenario. The number of hectares (thousands) selected in each resource class is shown above each bar. The ‘infrastructure’ class includes buildings and power lines. ‘HV Resource’ class represents all high value resources, predominantly old forests, either in moderate condition that could be improved by management, or in good condition but at risk of loss from high severity fire. Adapt, Transform, and Neutral classes reflect a combination of current conditions (poor for adapt and transform, intermediate for neutral) and the potential to improve conditions with changing climate (high, low, and intermediate, respectively).
The 75% threshold level for the Fire Scenario resulted in an additional 180,450 ha (21% more of the forested area) being selected, for a total of 330,857 ha (39% of the forested area). The percent of the area selected for treatment in high priority resource classes increased slightly, but the greatest increases in selection were in the lower priority high value resource areas: 61% of infrastructure, 61% of transforms, 67% of neutrals, 56% of adapts, 48% of high value resources in moderate condition, and 33% of high value resources at risk from climate were selected to meet fire risk reduction objectives for the Fire scenario (Figure 3).
3.2.2 Ecosystem scenario
The 50% threshold level for the Ecosystem scenario resulted in 327,157 ha (38% of the forested area) being selected for treatment across all HUC-12 watersheds, over twice the area needed to reach the equivalent threshold for the Fire scenario. The percent of the area selected for treatment by resource class, in order of priority for the Ecosystem scenario was the following: 68% of infrastructure, 92% of high value resources in moderately favorable condition, 65% of high value resources at risk from climate, 24% of adapts, 17% of neutrals, and 9% of transforms (Figure 3).
The 75% threshold level for the Ecosystem scenario resulted in an additional 164,292 ha (20% more of the forested area, but fewer hectares than the Fire scenario) being selected, for a total of 491,449 ha (58% of the forested area, compared to the 39% treated in the Fire scenario). The percent of the area selected for treatment in each resource class increased for all classes, reaching high proportions for high priority classes: 73% of infrastructure, 94% of high value resources in moderate condition, 79% of high value resources at risk from climate, 42% of adapts, 50% of neutrals, and 38% of transforms (Figure 3). The Ecosystem scenario had greater efficiency in treating priority resource classes compared to the Fire scenario at both threshold levels, likely the result of partitioning the landscape into one-third as many landscape units (119 HUC-12 watersheds averaging 8,218 ha) compared to the Fire scenario (382 PODs averaging 2,560 ha).
3.2.3 Scenario treatment overlap
We then compared the spatial overlap in the locations selected for management in both treatment scenarios to understand the degree to which these two objectives were compatible in this landscape (i.e., selected the same management areas). At the 50% threshold level, from the total of 477,564 ha selected for the two scenarios combined, only 63,838 ha (15.4%) were selected in both, indicating high differentiation between areas selected for treatment to accomplish their respective objectives (Figure 4). The areas selected in both scenarios consisted primarily of infrastructure and high value resources, which was by design in the scenario development. By scenario, approximately 43% of the hectares selected in the Fire scenario were also selected in the Ecosystem scenario, while only 20% of the hectares selected in the Ecosystem scenario were also selected in the Fire scenario.
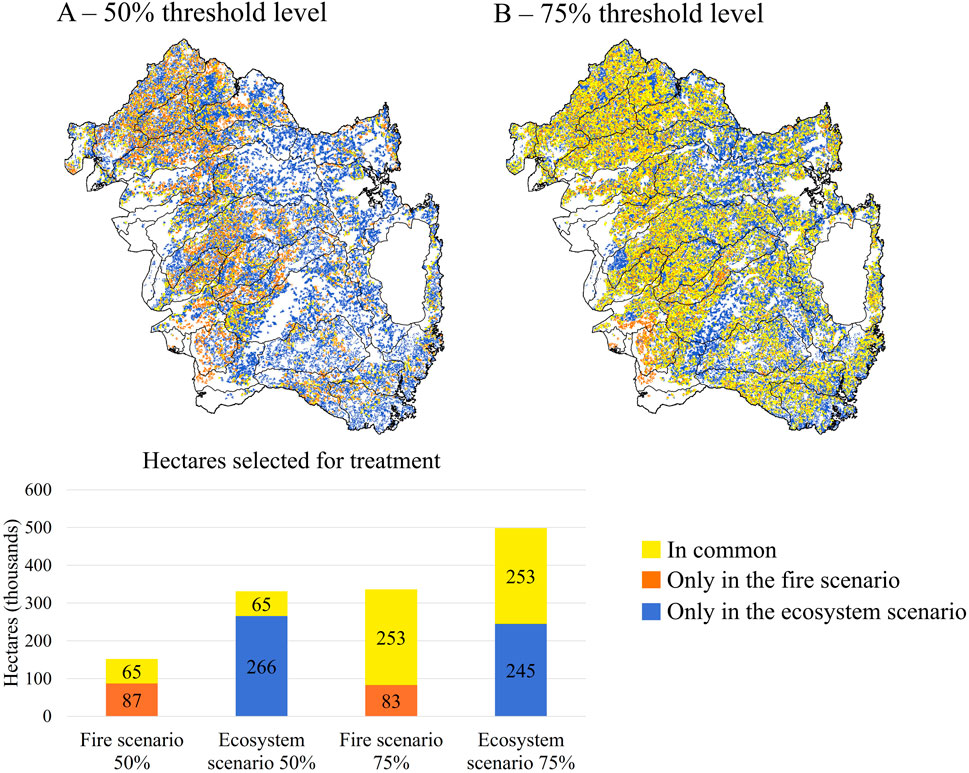
Figure 4. Treatment locations selected by ForSys for each of the two scenarios, Fire scenario (A) and Ecosystem scenario (B), in the Tahoe Central Sierra Initiative landscape (California and Nevada, USA). Two levels of treatment were modeled, targeting 50% and 75% of each landscape unit in favorable condition across the landscape for each scenario. Selected areas unique and common to each scenario are indicated.
Overlap in the areas selected for each scenario at the 75% threshold level increased substantially to 252,326 ha (30.8% of the 822,306 ha sum of all areas selected). Overlap was greater for the Fire scenario, with 75% of treated area also being selected in the Ecosystem scenario, with over half (114,690 ha) of the additional hectares selected overlapping areas selected in the 50% threshold level for the Ecosystem scenario (Figure 4). In comparison, only 51% of the Ecosystem scenario treatments were also selected in the Fire scenario, and only one-quarter (42,543 ha) of the additional hectares selected overlapped areas to achieve the 50% threshold in the Fire scenario (Figure 4). These results indicate substantially greater conflict between these two scenarios as the threshold for favorable conditions increases from 50% to 75% of the landscape.
3.3 Post-treatment conditions
3.3.1 Treatment effects
In the Fire scenario, eight metrics were positively affected by treatment (in declining order of landscape affected): disturbance delinquency, disturbance return interval, low severity fire, high severity fire, high severity patch size, and tree density. These metric scores improved across 7%–18% of the landscape at the 50% threshold level, and across 16%–40% of the landscape at the 75% threshold level (Supplementary Table 4S). Conversely, two metrics were negatively affected by treatment; basal area and carbon scores declined across 17% of the landscape in the 50% threshold level, and across 37% and 38% of the landscape in the 75% threshold levels, respectively.
In the Ecosystem scenario, six metrics were positively affected by treatment (in declining order of landscape affected): disturbance delinquency, disturbance return interval, low severity fire, high severity fire, heterogeneity, and tree density. These metric scores improved across 16%–40% of the landscape in the 50% threshold level, and across 23%–60% of the landscape in the 75% threshold level (Supplementary Table 4S). No metrics were negatively affected by treatment in the Ecosystem scenario.
3.3.2 Scenario performance
The performance of each scenario was evaluated in terms of progress toward the target objective for each of the two scenarios (probability of low severity fire and overall ecosystem resilience) and for each of the five pillars (Forest Resilience, Fire Dynamics, Fire-adapted Communities, Carbon Sequestration, and Biodiversity Conservation). Scores for each objective were assigned to each cell and then summarized across the landscape (Figure 6).
The primary objective of the Fire Scenario, the probability of low severity fire, was improved by both scenarios, but the Fire scenario achieved greater improvements with less area treated (i.e., higher efficiency; Figure 5). The Ecosystem scenario improved the condition score for the probability of low severity fire metric at the 50% threshold levels and showed even greater improvement at the 75% threshold levels (Figure 6). The average pre-treatment condition score across the landscape was −0.35 (moderately unfavorable). Following the Fire scenario treatments, the score increased to −0.01 (neutral) at the 50% threshold, and then increased again to +0.34 (moderately favorable) at the 75% threshold level (Figure 6). Following the Ecosystem scenario treatments, the condition score for low severity fire showed a similar degree of improvement to +0.07 (neutral) at the 50% threshold, but only a minor additional improvement to +0.21 (weakly favorable) at the 75% threshold level (Figure 6). Relative efficiency of each scenario, based on improvement in the fire risk condition score per hectare treated, indicated that the Fire scenario was 83% more efficient than the Ecosystem scenario at meeting the objective of reducing the risk of fire (i.e., per hectare treated, the Fire scenario resulted in a 83% greater increase in the fire risk score compared to the Ecosystem scenario).
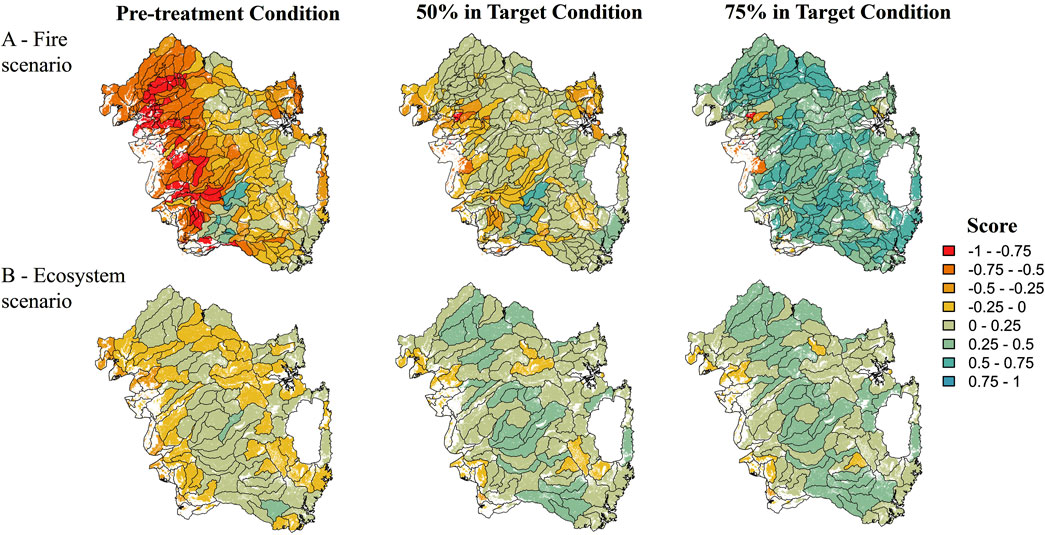
Figure 5. Changes in condition in areas selected for treatment by the ForSys optimization model for each of two scenarios, Fire scenario (A) and Ecosystem scenario (B), in the Tahoe Central Sierra Initiative landscape (California and Nevada, United States). Two levels of treatment were modeled, targeting 50% and 75% of each landscape unit in favorable conditions for each scenario. Landscape units differed between the two scenarios, the Fire scenario was based on Potential Operational Delineations (PODs), and the Ecosystem scenario was based on HUC-12 watersheds.
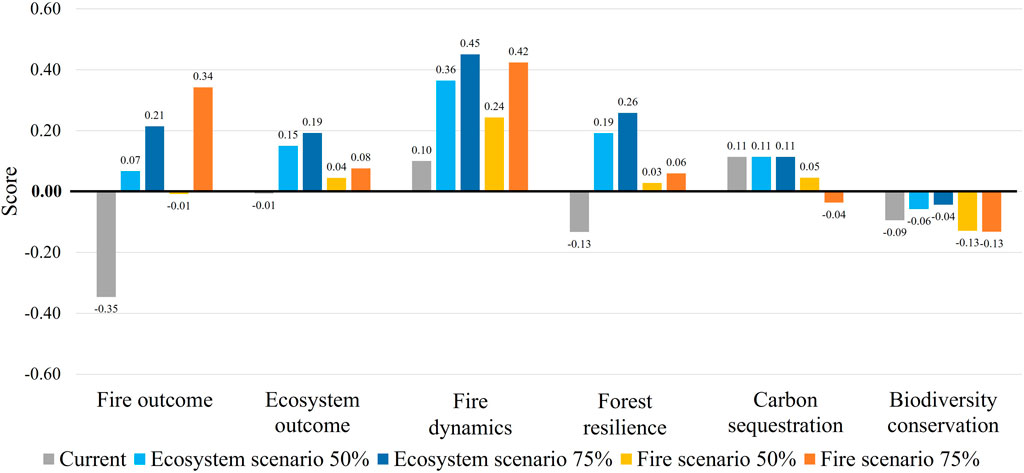
Figure 6. Resource benefits by management scenario (Fire and Ecosystem) and threshold (50% and 75% of each landscape unit in favorable condition) for six outcomes: fire risk, four individual resource pillars, and overall ecosystem resilience. Gray bars represent current condition scores, blue bars indicate condition scores resulting from treatments selected by ForSys for the Ecosystem scenario, and orange bars indicate condition scores resulting from treatments selected by ForSys for the Fire scenario. The extent of area treated varied among scenarios and threshold. Condition scores ranged from +1 (favorable) to −1 (unfavorable) and resource scores reflect average values across all 30-m cells in the landscape for each outcome.
The primary objective of the Ecosystem scenario, the Ecosystem Resilience score, was improved by both scenarios, though only incrementally. The average pre-treatment resilience score across the landscape was −0.01 (neutral). Following the Ecosystem scenario treatments, the resilience scores increased to 0.15 and then 0.19 (weakly favorable) in response to the 50% and 75% threshold levels, respectively (Figure 6). Following the Fire scenario treatments, the resilience scores improved but remained neutral at both threshold levels (score of 0.04 and 0.08 at 50% and 75% threshold levels, respectively) (Figure 6). Despite incremental rates of improvement, the relative efficiency of each scenario, based on improvement in the ecosystem resilience condition score per hectare treated, indicated that the Ecosystem scenario was 50% more efficient than the Fire scenario at meeting the objective of improving ecosystem resilience (i.e., per hectare treated, the Ecosystem scenario resulted in a 50% greater increase in the ecosystem resilience score compared to the Fire scenario).
Changes in resilience scores for the five individual pillars provided additional insights into the different outcomes of the two treatment scenarios, with the Ecosystem scenario generally outperforming the Fire scenario (Figures 5, 6). The Fire pillar showed greater improvement under the Ecosystem scenario compared to the Fire scenario; it moved from a neutral score to a strong positive score at the 50% threshold level (0.36) and even stronger at 75% threshold level (0.45). In contrast, the Fire scenario lagged in performance at both thresholds, which probably reflect the greater proportion of the landscape treated in the Ecosystem scenario. Relative efficiency of each scenario, based on improvement in the Fire pillar condition score per hectare treated, indicated that the Fire scenario was greater, but dropped to 36% more efficient than the Ecosystem scenario at meeting the objective of improving overall fire dynamics, compared to only evaluating impacts on low-severity fire outcomes. The Forest Resilience pillar also showed greater improvement under the Ecosystem scenario, with the condition score moving from negative neutral (−0.13) to positive (0.26) at the 75% threshold level, whereas under the Fire scenario it improved but even at the 75% threshold level for the scenario, the pillar remained in neutral condition (0.06). The Ecosystem scenario was 38% more efficient per hectare treated than the Fire scenario at meeting the objective of improving forest resilience.
Differences in the impacts and efficiencies were less marked for the Carbon Sequestration and Biodiversity Conservation compared to the Forest Resilience and the two Fire pillars. The Carbon Sequestration pillar started at a positive neutral condition (0.11), and remained unchanged under the Ecosystem scenario; however, it declined to 0.05 and then −0.04 with the Fire scenario (50% and 75% thresholds, respectively). The Biodiversity Conservation pillar started with a negative neutral score (−0.09), showed a slight improvement under the Ecosystem scenario (−0.06 and −0.04 at 50% and 75% threshold levels), while it showed slight declines in condition under the Fire scenario (−0.13 for both threshold levels). The Ecosystem scenario was over 300% more efficient per hectare treated than the Fire scenario at meeting the objective of improving biodiversity; however, this reflects the difference between small gains (<1 percentage point gain per 10% of the landscape treated) in the Ecosystem scenario compared to small losses (<1 percentage point loss) in the Fire scenario.
4 Discussion
Our study demonstrated the value in using a hierarchical framework for addressing socio-ecological systems to facilitate measuring and evaluating status and change across multiple metrics and benefits across a landscape. The Framework enabled us to compare the relative benefits of two potentially opposing objectives at multiple levels of information granularity (an individual metric, individual pillars represented by multiple metrics, and overall ecosystem resilience represented by multiple pillars). We were able to evaluate the degree to which the common objective of fire risk reduction can potentially yield multiple other socio-ecological benefits, and how different management outcomes could be if the driving objective were ecosystem resilience.
The results presented here were intended to be indicative and instructive, not prescriptive or predictive. We set differing priorities for treatment across the suite of existing resource classes, so it is not surprising that the scenarios selected treatment locations in a different order across the landscape. Furthermore, our scenario performance was based on assigned (not modeled or measured) responses, which reflected informed assumptions about treatment intensity and metric responses to those treatments. As such, the scenarios represented management archetypes that were then quantitatively evaluated for their relative performance in near-term and longer-term desired outcomes in the form of fire risk, forest resilience, carbon storage, constructive fire processes, and biodiversity conservation.
4.1 The hare that is fire risk reduction
We found that achieving favorable conditions across this landscape was easier to accomplish for a single metric than it was for overall ecosystem resilience. We observed that the fire risk condition scores were initially very high across much of the study landscape, particularly at lower elevations, and after treating less than 40% of the landscape they were greatly improved across the entire landscape (Figure 5). This marked shift in condition scores for fire risk was in stark contrast to the ecosystem resilience condition scores, which were moderately poor and shifted toward moderately good but lagged behind the progress observed for the Fire scenario towards desired conditions. In fact, both scenarios were more efficient (changes in condition score per hectare treated) at reducing fire risk than either were at improving pillar-based resource objectives and overall ecosystem resilience (Figure 6). This differential pace of response does not reflect the efficacy of treatments, rather it reflects the complexity of the targeted outcomes. Forest fuels, a primary driver of fire intensity, is a fast-variable that is readily altered in short periods of time (Rinaldi and Scheffer, 2000), whereas ecosystem resilience is a slow-variable, an outcome shaped by a complex of numerous fast and slow variables (e.g., tree growth) and associated processes, including fire dynamics (Carpenter and Turner, 2000).
It is understandably motivating and satisfying to pursue a singular, measurable, and compelling objective and to demonstrate efficiencies in management. Increasing temperatures and longer periods of dry and hot conditions are resulting in a lengthening of what was commonly considered the “fire season” from mid-summer to early fall to what is now considered a year-round risk of fire that varies seasonally in the degree of risk (Li and Banerjee, 2021). Substantial research investments have been made by land management agencies to investigate how best to locate treatments in landscapes to maximize their effectiveness in reducing the risk of fire per hectare treated (Finney, 2004; Finney et al., 2007; Finney, 2007; Jain et al., 2021). Treating in proximity to houses and other human infrastructure can be effective at reducing the risk of fire (Stevens et al., 2016), while minimizing conflicts with landscape-scale ecosystem resilience objectives, and in fact in the context of the socio-ecological system would be considered progress toward resilience. However, given the narrow range of conditions being targeted by this approach, it is unlikely that ecosystem resilience would improve substantially. Further, extensive landscape-scale changes in fast variables over short periods of time, such as significant reductions in landscape fuels, can precipitate complex system-level responses that may be beneficial (restored fire regime; Finney et al., 2007) or detrimental (decreased snow accumulation and retention; Krogh et al., 2020; Lewis et al., 2023) to ecosystem resilience.
The Fire pillar benefits gained under the Ecosystem scenario were not negligible, being competitive with the Fire scenario at the 50% threshold level (57% and 85% as effective in meeting fire risk and fire dynamics objectives, respectively, per hectare treated). But unsurprisingly, the Ecosystem scenario fell far behind the Fire scenario in reducing fire risk. The Ecosystem scenario treatments were considered lower intensity than the Fire scenario, leading to a compromise in the objective of reducing flame lengths, as has been demonstrated in empirically based studies (e.g., Collins et al., 2011; Loudermilk et al., 2014). Our results are consistent with the findings of others that ecosystem-focused management can reduce short-term fire risks and fire-focused management can have some longer-term ecosystem co-benefits, but it is also apparent that the pursuit of one objective will result in short-falls in the other.
4.2 No free ride for ecosystem resilience
Forest management that singularly targets fuel reduction across large extents of landscapes is likely to have inherent conflicts with other ecosystem objectives (Lehmkuhl et al., 2007; Kalies and Kent, 2016). Although fire risk reduction gains by the Fire scenario were substantial at both increments of management investment (50% and 75% of each landscape unit), management conflicts within areas also identified as most valuable for ecosystem resilience were observed even at the 50% threshold level, and were much more substantial as treatments expanded to the 75% threshold level. In this study, over 80% of high value resource conditions were old forests, and other studies of fuel treatment effects on old forests concluded that mechanical treatments directed at reducing the risk of fire had negative short- and long-term impacts on old forest characteristics (e.g., Tempel et al., 2015).
The Fire scenario did have positive effects on non-fire related pillars but was consistently outperformed by the Ecosystem scenario. For example, the Ecosystem scenario contributed roughly twice as much positive benefit to the Forest Resilience pillar score compared to the Fire scenario (maximum gain of 0.39 vs. 0.19, respectively; Figure 6). The Forest Resilience pillar was represented by tree density, structural heterogeneity, and seral stage, which are crucial for a resilient forest ecosystem and not necessarily improved by fire-driven treatments. Previous studies in similar landscapes found that treatments designed to reduce fire risk do not necessarily have overall forest ecological benefits, such as reduced snag and downed wood densities (negative; Low et al., 2021), and reduced impact of drought or insect outbreaks (Scheller et al., 2018; Maxwell C. J. et al., 2022). Yet climate change is expected to increase insect outbreaks (Fettig, 2019), which are likely to be a leading source of forest mortality in Central Sierra Nevada (Maxwell et al., 2022a). Thus, extensive treatments directed specifically at reducing fire behavior have the potential to negatively impact certain aspects of overall ecosystem resilience.
The Fire scenario had negative effects on Carbon Sequestration and Biodiversity Conservation, unlike the Ecosystem scenario that had neutral or positive impacts on these two pillars. Empirical studies of the effects of more intensive fuel treatments have documented more negative impacts on carbon and wildlife habitat (Lehmkuhl et al., 2007; Hurteau and North, 2010) compared to less intensive treatments. Furthermore, the Fire scenario made nominal progress on overall ecosystem resilience, despite treating up to 40% of the forests within the landscape (as per the 75% threshold level), whereas the Ecosystem scenario made positive gains for overall ecosystem resilience at both the 50% and 75% threshold levels. Similar evaluations of landscape management strategies that targeted singular versus multiple ecosystem service benefits also found that single-outcome approaches not only lagged behind multi-objective approaches (e.g., Benra et al., 2022), but in some cases can be detrimental to achieving desired co-benefits. Our results suggest that a fire-focused singular objective management approach would not fully realize ecosystem resilience.
4.3 The tortoise that is ecosystem resilience - broad, slow, steady
Overall, we found that ecosystem resilience is like a tortoise - it cannot be rushed - it is hard won through a combination of strategic placement of treatments where they will make the greatest positive impact for multiple benefits (i.e., priority resource classes), and treating large extents of landscapes but with less intensive treatments. The Ecosystem scenario more effectively and efficiently achieved multiple benefits compared to the Fire scenario. Even though the Ecosystem scenario required treating nearly 20% more of the landscape to reach the 75% threshold compared to the Fire scenario (58.5% compared to 39%, respectively), it was more efficient per hectare of treatment at achieving ecosystem benefits. Conversely, treating large extents of landscapes with more intensive treatments targeting areas with higher fire risk could have the opposite effect - limited ecosystem resilience gains for some and potential setbacks for others that could persist for multiple decades (e.g., Tempel et al., 2015).
Ecosystem resilience did not change rapidly under either scenario. Even without considering real world constraints on implementation (e.g., funding, logistics), there were limits on how quickly conditions could be improved. The ecosystem resilience score reflected 21 different metrics combined into four pillars. Deconstructing the ecosystem outcome into its four constituent pillar scores revealed a diverse range of responses across the pillars, from strongly positive to no response (Figure 6). For most pillars, reducing the amount of some feature (e.g., tree density, species abundance, carbon) is achievable in a short period of time; however improvement in some conditions (e.g., growing larger trees), takes time. For example, unlike the Fire scenario, the Ecosystem scenario could only bring 75% of the forested landscape into favorable conditions, with deficits on the other 25% requiring time (or in some cases a type of management investment other than fuel reduction).
The inability of ecosystems to adapt to increasing rates of change precipitated by human pressures and climate (Vanderwel and Purves, 2014) is symptomatic of this temporal asymmetry in potential rates of loss versus gain or recovery. Interestingly, in the case of forest fuels, losses are desirable, and management can quickly and effectively reduce them; it is the time since disturbance that works against fire risk reduction objectives. Conversely, in the case of ecosystem resilience, many desirable conditions (e.g., increased carbon storage) can only be achieved with time since a major disturbance, and as such time since disturbance can be considered a form of treatment that builds towards greater ecosystem resilience (e.g., Williams et al., 2012; Dobor et al., 2018).
4.4 Landscape strategies and limitations for competing objectives
Fuel reduction treatments are effective at changing fire behavior within treated areas embedded within forested landscapes and more intensive treatments that remove more forest fuels from a stand are less likely to burn at high intensity (Safford et al., 2012). Furthermore, we know that forest treatments can have effects on the overall fire regime (how fires burn across landscapes) when they have altered forest conditions across a sufficient extent of the landscape (Maxwell et al., 2022a; Maxwell et al., 2022b). The greater the extent of the landscape that is treated, the greater the potential for improved fire behavior and reduced risks to forests and infrastructure (Stevens et al., 2016), particularly when treatments are strategically placed in a manner that enhances their impact on fire behavior (Finney et al., 2007).
Our optimization modeling was designed to minimize potential impacts of fire-driven treatments to ecosystem resilience objectives by setting opposing priority landscape categories for treatment, thereby reducing conflicts between the two desired outcomes. Another mechanism that is likely to be effective is an ensemble approach, intentionally balancing treatments between two objectives. At the 50% threshold level, treatment locations were largely distinct between the scenarios and both objectives were furthered but overlap in areas selected for treatment, along with the potential for conflicts, increased as the extent of treatments exceeded 50% of each landscape unit. Overlap in treatment locations between competing objectives does not necessarily represent an absolute conflict, but assuming that some degree of compromise will be required in one or both objectives may be most realistic and productive (Howe et al., 2014). Certainly, intensive fuel reduction treatments applied within high-value old forests (as occurred extensively in the 75% threshold level for the Fire scenario) would degrade their ecological value by one or more measures and, therefore, represent a conflict between these two objectives. Similarly, treatment prescriptions could be adjusted to be less intensive, but that is likely to reduce their effectiveness in changing fire behavior (Safford et al., 2012).
Alternative approaches to reducing the risk of fire that do not entail extensive treatments consist of creating strategically located linear areas with very low fuels - namely, fuel breaks (Green, 1977; Agee et al., 2000) and POD boundaries (Thompson et al., 2016; Dunn et al., 2020). They improve the ability to control fires when they occur, as opposed to changing how fires burn. These approaches directly impact fewer hectares of forest, but they can also fragment forested landscapes and potentially impact biodiversity and climate adaptation processes (Lehmkuhl and Ruggiero, 1991; Fahrig, 2002; Slauson et al., 2017; Corlett, 2022). For example, sparse forest cover can restrict animal movement for species that are highly dependent on trees for aspects of their life history, such as flying squirrels (Lehmkuhl et al., 2006; Smith, 2012). Larger openings can pose a risk of predation, particularly for smaller-bodied animals such as ground squirrels. Areas with persistent winter snow can create conditions (penetration depths) that limit movement of quadrupedal animals, such as the fisher (Martes pennanti; Lyon et al., 1994). Finally, linear features that intentionally break up the extent of closed forest conditions serve to fragment remaining forests, impacting interior forest microclimatic conditions and other habitat features, as well as increasing their potential to serve as unwanted corridors for invasive species (With, 2002; Latimer and Zuckerberg, 2017).
Another valuable finding of our study was the degree to which landscape units affected treatment efficiencies when planning treatments across large landscapes. It is well established that optimization functions generally perform better when they are applied to fewer, larger units, resulting in greater gains per hectare treated and greater benefits overall (Ager et al., 2016). We observed a marked change in efficiency as the result of unit size differences between the two scenarios. Thus, when strategically placing treatments across the landscape, using more, larger units can enhance treatment effectiveness.
4.5 Recalibrating objectives for return on investment
The desire to strategically place treatments where they will yield the greatest gains in management objectives is, on the surface, logical and laudable. Factoring in financial cost is also an understandable motivation, commonly referred to as getting “the biggest bang for the buck” (e.g., Munson et al., 2020). Measures of near-term gains and cost efficiencies in landscape planning are increasingly used to calculate the return on investment (ROI; Margoulis and Salafsky, 1998) associated with different management scenarios, and used to inform and guide management investments. ROI-based analysis maximizes a measure of one or more benefits for a given level of expenditure or minimizes the costs of achieving a predetermined management goal. ROI is a long-standing investment strategy in the business sector, but it is increasingly being used in conservation and restoration planning and investments (e.g., Donlan et al., 2014), High ROI values are desired over lower values, and it is most commonly measured in monetary terms (re: dollars invested vs. the market value of benefits) but can also be measured in non-monetary terms as a reflection of relative gain (re: dollars invested and benefits gained in one scenario vs. another) (Murdoch et al., 2007; Boyd et al., 2015). Optimization modeling approaches advocate for optimizing on only a few metrics because solutions based on many metrics, particularly when they are incompatible (i.e., negatively correlated), compromises progress toward all metric outcomes (Ager et al., 2013). In other words, the ROI for optimized solutions with many competing metrics will not be competitive with ROIs for solutions that focus on just one or very few metrics that are highly compatible.
The results of our study suggest caution in the use of ROI as a guidepost of efficiency in large landscape planning efforts. Our study indicates that optimizing ROI based on a narrow set of objectives could be counterproductive to longer-term ecosystem resilience objectives, particularly if they include a measure of economic efficiency. For example, ROI is likely to be greater for forested areas that are easy to access (e.g., near roads, near processing facilities, flat ground) and offer greater gains in desired outcomes (e.g., reduced fire risk, marketable trees) per unit effort. The short-term benefits of maximizing ROI are undeniable, but what about the longer term costs? Maximizing ROI with each bout of treatments will result in a steady decline in the ROIs for successive investments in the landscape, eventually making it potentially economically and/or politically unviable to operate on the remaining portions of the landscape. Unless some form of even flow of ROI is used, the use of short-term optimized ROI could result in a form of landscape-scale “high grading” (Curtze et al., 2022), where only the most economically valuable elements (i.e., trees or stands) are removed without consideration for the future constitution of the stand or landscape (respectively) and the associated management challenges. Ecosystem resilience is a long-game, and an ROI that is compatible with resilience objectives would meet multiple objectives over multiple treatment cycles, and value stability in ROI over time such that the costs and benefits are in balance through time.
5 Conclusion
Our study demonstrates the significance of directly addressing the full suite of desired outcomes in planning treatments for landscape management. We highlight that achieving multiple benefits cannot be assumed, and treatments narrowly focused on near-term risk reduction may miss or even undermine longer-term ecosystem resilience outcomes. Single or narrow objectives associated with fast variables (hares) are more likely achieved in a shorter period of time (high ROI) than more complex, multi-metric and slow-variable based resilience objectives (tortoises; lower ROI). Resilience objectives take time, and in fact time is an essential ingredient for resilience, and they ultimately provide the greatest ROI in terms of ecosystem services. Our results suggest that with a deliberate and strategic approach, it is possible to achieve and balance multiple short-term and long-term objectives across large landscapes with nominal conflict. This was evident in our study, particularly at the intermediate accomplishment levels, where a dual investment strategy across competing objectives can minimize conflicts and maximize benefits. Additionally, our results emphasize the importance of setting specific and measurable resilience goals and measuring progress across larger landscape units and over time to effectively achieve desired outcomes when using quantitative optimization tools. User-friendly, one-stop multi-function management tools (e.g., Planscape.org) are becoming more widely available, and they enable users to access maps, select criteria of importance, specify and prioritize outcomes as desired, and run optimization models to generate treatment plans without the need for any computer modeling skills. Concomitantly, a diversity of relevant and useful remotely sensed and modeled data are freely available, making it possible to access high-resolution, up-to-date information on a wide array of metrics. The remaining limitations reside largely in how we think about ecosystems and our preconceived notions about what is possible and desirable.
This study serves as a practical application while also establishing the foundation for future efforts that will incorporate landscape simulations. Moreover, it demonstrates how climate-informed, quantitative representations of diverse socio-ecological objectives can be incorporated into a tractable decision-support framework, by focusing treatments on enhancing ecosystem resilience.
Data availability statement
The datasets presented in this study can be found in online repositories. The names of the repository/repositories and accession number(s) can be found below: https://osf.io/6rqpb/?view_only=84bbdcfa8f954449905c659ca23c45d0.
Author contributions
PM: Conceptualization, Funding acquisition, Investigation, Methodology, Project administration, Supervision, Validation, Writing – original draft, Writing – review and editing. LB: Conceptualization, Data curation, Formal Analysis, Investigation, Methodology, Visualization, Writing – original draft, Writing – review and editing. NP: Conceptualization, Data curation, Formal Analysis, Investigation, Methodology, Resources, Supervision, Visualization, Writing – review and editing. MD: Data curation, Formal Analysis, Methodology, Software, Validation, Writing – review and editing.
Funding
The author(s) declare that financial support was received for the research and/or publication of this article. This research was supported by a grant from CalFire Forest Health Grant (16-GGRF-FH-0011-NEU) administered by the Sierra Nevada Conservancy, in partnership with The California Tahoe Conservancy. The Nature Conservancy and the U.S. Forest Service Pacific Southwest and Rocky Mountain Research Stations. Provided staff and administrative support. This work was supported by the Tahoe Central Sierra Initiative, a coalition of State, Federal, and private entities to promote resilience and innovation in the central Sierra Nevada and throughout the range.
Acknowledgments
Special thanks to the members of the TCSI Science Coordination Group and the Blueprint User Group for the many hours they contributed to discussion and review – they greatly improved the end product. Special thanks to Robert Scheller (North Carolina State University) and Charles Maxwell (Oregon State University) for the LANDIS-II modeling. Jennifer House, Scot Rogers, Jeff Marsolais, and Alan Ager were also instrumental in accomplishing this project.
Conflict of interest
The authors declare that the research was conducted in the absence of any commercial or financial relationships that could be construed as a potential conflict of interest.
Generative AI statement
The author(s) declare that no Generative AI was used in the creation of this manuscript.
Publisher’s note
All claims expressed in this article are solely those of the authors and do not necessarily represent those of their affiliated organizations, or those of the publisher, the editors and the reviewers. Any product that may be evaluated in this article, or claim that may be made by its manufacturer, is not guaranteed or endorsed by the publisher.
Supplementary material
The Supplementary Material for this article can be found online at: https://www.frontiersin.org/articles/10.3389/fenvs.2025.1560125/full#supplementary-material
References
Agee, J. K., Bahro, B., Finney, M. A., Omi, P. N., Sapsis, D. B., Skinner, C. N., et al. (2000). The use of shaded fuelbreaks in landscape fire management. For. Ecol. Manag. 127 (1-3), 55–66. doi:10.1016/s0378-1127(99)00116-4
Ager, A. A., Day, M. A., and Vogler, K. (2016). Production possibility frontiers and socioecological tradeoffs for restoration of fire adapted forests. J. Environ. Manag. 176, 157–168. doi:10.1016/j.jenvman.2016.01.033
Ager, A. A., Vaillant, N. M., and McMahan, A. (2013). Restoration of fire in managed forests: a model to prioritize landscapes and analyze tradeoffs. Ecosphere 4 (2), 1–19. doi:10.1890/es13-00007.1
Bedsworth, L., Cayan, D., Franco, G., Fisher, L., and Ziaja, S. (2018). California’s fourth climate change assessment. Statewide summary report SUMCCCA4-2018-013. Sacramento, CA: California Governor’s Office of Planning and Research.
Belmecheri, S., Babst, F., Wahl, E. R., Stahle, D. W., and Trouet, V. (2016). Multi-century evaluation of Sierra Nevada snowpack. Nat. Clim. Change 6, 2–3. doi:10.1038/nclimate2809
Benra, F., Nahuelhual, L., Felipe-Lucia, M., Jaramillo, A., Jullian, C., and Bonn, A. (2022). Balancing ecological and social goals in PES design - single objective strategies are not sufficient. Ecosyst. Serv. 53, 101385. doi:10.1016/j.ecoser.2021.101385
Bone, C., Moseley, C., Vinyeta, K., and Bixter, R. P. (2016). Employing resilience in the United States forest service. Land Use Policy 52, 430–438. doi:10.1016/j.landusepol.2016.01.003
Boyd, J., Epanchin-Niell, R., and Siikamäki, J. (2015). Conservation planning: a review of return on investment analysis. Rev. Environ. Econ. Policy 9 (1), 23–42. doi:10.1093/reep/reu014
California Department of Fish and Wildlife (CWHR) (2014). California interagency wildlife task Group CWHR version 9.0. Personal computer program. Sacramento, CA. Available online at: https://wildlife.ca.gov/Data/CWHR.
California Natural Resources Agency (2021). “California’s wildfire and forest resilience action plan,”. Sacramento, CA. Available online at: http://wildfiretaskforce.org/wp-content/uploads/2022/12/californiawildfireandforestresilienceactionplan.pdf.
Calkin, D. C., Finney, M. A., Ager, A. A., Thompson, M. P., and Gebert, K. M. (2011). Progress towards and barriers to implementation of a risk framework for US federal wildland fire policy and decision making. For. Policy Econ. 13 (5), 378–389. doi:10.1016/j.forpol.2011.02.007
Calkin, D. E., Thompson, M. P., and Finney, M. A. (2015). Negative consequences of positive feedbacks in US wildfire management. For. Ecosyst. 2, 9–10. doi:10.1186/s40663-015-0033-8
Cannon, J. B., Gannon, B. M., Feinstein, J. A., Padley, E. A., and Metz, L. J. (2020). Simulating spatial complexity in dry conifer forest restoration: implications for conservation prioritization and scenario evaluation. Landsc. Ecol. 35 (10), 2301–2319. doi:10.1007/s10980-020-01111-8
Carpenter, S. R., and Turner, M. G. (2000). Hares and tortoises: interactions of fast and slow variables in ecosystems. Ecosystems 3 (6), 495–497. doi:10.1007/s100210000043
Collins, B. M., and Stephens, S. L. (2010). Stand-replacing patches within a ‘mixed severity’fire regime: quantitative characterization using recent fires in a long-established natural fire area. Landsc. Ecol. 25, 927–939. doi:10.1007/s10980-010-9470-5
Collins, B. M., Stephens, S. L., Roller, G. B., and Battles, J. J. (2011). Simulating fire and forest dynamics for a landscape fuel treatment project in the Sierra Nevada. For. Sci. 57 (2), 77–88. doi:10.1093/forestscience/57.2.77
Corlett, R. T. (2022). “Forest fragmentation and climate change,” in Global forest fragmentation. Editors C. J. Kettle, and L. P. Koh (Wallingford, UK: CABi Digital library), 69–78.
Curtze, A. C., Muth, A. B., Larkin, J. L., and Leites, L. P. (2022). Seeing past the green: structure, composition, and biomass differences in high graded and silviculture-managed forests of similar stand density. For. Ecol. Manag. 526, 120598. doi:10.1016/j.foreco.2022.120598
Dobor, L., Hlásny, T., Rammer, W., Barka, I., Trombik, J., Pavlenda, P., et al. (2018). Post-disturbance recovery of forest carbon in a temperate forest landscape under climate change. Agric. For. Meteorology 263, 308–322. doi:10.1016/j.agrformet.2018.08.028
Donlan, C. J., Luque, G. M., and Wilcox, C. (2014). Maximizing return on investment for island restoration and species conservation. Conserv. Lett. 8 (3), 171–179. doi:10.1111/conl.12126
Dunn, C. J., Calkin, D. E., and Thompson, M. P. (2017). Towards enhanced risk management: planning, decision making and monitoring of US wildfire response. Int. J. Wildland Fire 26 (7), 551–556. doi:10.1071/wf17089
Dunn, C. J., O’Connor, C. D., Abrams, J., Thompson, M. P., Calkin, D. E., Johnston, J. D., et al. (2020). Wildfire risk science facilitates adaptation of fire-prone social-ecological systems to the new fire reality. Environ. Res. Lett. 15, e025001. doi:10.1088/1748-9326/ab6498
Fahrig, L. (2002). Effect of habitat fragmentation on the extinction threshold: a synthesis. Ecol. Appl. 12 (2), 346–353. doi:10.2307/3060946
Fettig, C. J. (2019). Socioecological impacts of the western pine beetle outbreak in southern California: lessons for the future. J. For. 117 (2), 138–143. doi:10.1093/jofore/fvy029
Finney, M. A. (2004). “Landscape fire simulation and fuel treatment optimization,” in Methods for integrating modeling of landscape change: interior northwest landscape analysis system. Editors J. L. Hayes, A. Ager, and R. J. Barbour (Portland, OR: U.S. Department of Agriculture, Forest Service, Pacific Northwest Research Station), 117–131. General Technical Report PNW-GTR-610.
Finney, M. A. (2007). A computational method for optimising fuel treatment locations. Int. J. Wildland Fire 16 (6), 702–711. doi:10.1071/wf06063
Finney, M. A., Seli, R. C., McHugh, C. W., Ager, A. A., Bahro, B., and Agee, J. K. (2007). Simulation of long-term landscape-level fuel treatment effects on large wildfires. Int. J. Wildland Fire 16 (6), 712–727. doi:10.1071/wf06064
Green, L. R. (1977). Fuelbreaks and other fuel modification for wildland fire control. Vallejo, CA: U.S. Department of Agriculture, Forest Service, Pacific Southwest Research Station, USDA Agriculture Handbook.
Gutiérrez, R. J., Manley, P. N., and Stine, P. A. (2017). in The California spotted owl: current state of knowledge (Vallejo, CA: U.S. Department of Agriculture, Forest Service). Report PSW-GTR-254.
Hansen, M. C., Potapov, P. V., Moore, R., Hancher, M., Turubanova, S. A., Tyukavina, A., et al. (2013). High-resolution global maps of 21st-century forest cover change. Science 342 (6160), 850–853. doi:10.1126/science.1244693
Haugo, R., Zanger, C., DeMeo, T., Ringo, C., Shlisky, A., Blankenship, K., et al. (2015). A new approach to evaluate forest structure restoration needs across Oregon and Washington, USA. For. Ecol. Manag. 335, 37–50. doi:10.1016/j.foreco.2014.09.014
Haugo, R. D., Kellogg, B. S., Cansler, C. A., Kolden, C. A., Kemp, K. B., Robertson, J. C., et al. (2019). The missing fire: quantifying human exclusion of wildfire in Pacific Northwest forests, USA. Ecosphere 10 (4), e02702. doi:10.1002/ecs2.2702
Hessburg, P. F., and Agee, J. K. (2003). An environmental narrative of inland northwest United States forests, 1800–2000. For. Ecol. Manag. 178 (1-2), 23–59. doi:10.1016/s0378-1127(03)00052-5
Hessburg, P. F., Agee, J. K., and Franklin, J. F. (2005). Dry forests and wildland fires of the inland Northwest USA: contrasting the landscape ecology of the pre-settlement and modern eras. For. Ecol. Manag. 211 (1-2), 117–139. doi:10.1016/j.foreco.2005.02.016
Howe, C., Suich, H., Vira, B., and Mace, G. M. (2014). Creating win-wins from trade-offs? Ecosystem services for human well-being: a meta-analysis of ecosystem service trade-offs and synergies in the real world. Glob. Environ. Change 28, 263–275. doi:10.1016/j.gloenvcha.2014.07.005
Hurteau, M. D., and North, M. (2010). Carbon recovery rates following different wildfire risk mitigation treatments. For. Ecol. Manag. 260 (5), 930–937. doi:10.1016/j.foreco.2010.06.015
Jain, T. B., Abrahamson, I., Anderson, N., Hood, S., Hanberry, B., Kilkenny, F., et al. (2021). “Effectiveness of fuel treatments at the landscape scale: state of understanding and key research gaps,” in Joint fire science program unpublished report (JFSP PROJECT ID: 19-S-01-2. Boise, ID: U.S. Department of Agriculture Forest Service, Rocky Mountain Research Station).
Jeronimo, S. M., Kane, V. R., Churchill, D. J., Lutz, J. A., North, M. P., Asner, G. P., et al. (2019). Forest structure and pattern vary by climate and landform across active-fire landscapes in the montane Sierra Nevada. For. Ecol. Manag. 437, 70–86. doi:10.1016/j.foreco.2019.01.033
Kalies, E. L., and Kent, L. L. Y. (2016). Tamm Review: are fuel treatments effective at achieving ecological and social objectives? A systematic review. For. Ecol. Manag. 375, 84–95. doi:10.1016/j.foreco.2016.05.021
Keane, R. E., Drury, S. A., Karau, E. C., Hessburg, P. F., and Reynolds, K. M. (2010). A method for mapping fire hazard and risk across multiple scales and its application in fire management. Ecol. Model. 221 (1), 2–18. doi:10.1016/j.ecolmodel.2008.10.022
Kline, J. D., Mazzotta, M. J., Spies, T. A., and Harmon, M. E. (2013). Applying the ecosystem services concept to public land management. Agric. Resour. Econ. Rev. 42 (1), 139–158. doi:10.1017/s1068280500007668
Koltunov, A., Ramirez, C. M., Ustin, S. L., Slaton, M., and Haunreiter, E. (2020). eDaRT: the Ecosystem Disturbance and Recovery Tracker system for monitoring landscape disturbances and their cumulative effects. Remote Sens. Environ. 238, 111482. doi:10.1016/j.rse.2019.111482
Kreitler, J., Thompson, M. P., Vaillant, N. M., and Hawbaker, T. J. (2020). Cost-effective fuel treatment planning: a theoretical justification and case study. Int. J. Wildland Fire 29 (1), 42. doi:10.1071/WF18187
Krogh, S. A., Broxton, P. D., Manley, P. N., and Harpold, A. A. (2020). Using process based snow modeling and lidar to predict the effects of forest thinning on the northern Sierra Nevada snowpack. Front. For. Glob. Change 3, e21. doi:10.3389/ffgc.2020.00021
Latimer, C. E., and Zuckerberg, B. (2017). Forest fragmentation alters winter microclimates and microrefugia in human-modified landscapes. Ecography 40 (1), 158–170. doi:10.1111/ecog.02551
Laureto, L. M. O., Cianciaruso, M. V., and Samia, D. S. M. (2015). Functional diversity: an overview of its history and applicability. Natureza and Conservação 13 (2), 112–116. doi:10.1016/j.ncon.2015.11.001
Lehmkuhl, J. F., Kennedy, M., Ford, E. D., Singleton, P. H., Gaines, W. L., and Lind, R. L. (2007). Seeing the forest for the fuel: integrating ecological values and fuels management. For. Ecol. Manag. 246 (1), 73–80. doi:10.1016/j.foreco.2007.03.071
Lehmkuhl, J. F., Kistler, K. D., Begley, J. S., and Boulanger, J. (2006). Demography of northern flying squirrels informs ecosystem management of western interior forests. Ecol. Appl. 16 (2), 584–600. doi:10.1890/1051-0761(2006)016[0584:DONFSI]2.0.CO;2
Lehmkuhl, J. F., and Ruggiero, L. F. (1991). “Forest fragmentation in the Pacific Northwest and its potential effects on wildlife,” in Technical coordinators. Wildlife and vegetation of unmanaged Douglas-fir forests. Editors L. F. Ruggiero, K. B. Aubry, A. B. Carey, and M. H. Huff (Portland, OR: U.S. Department of Agriculture, Forest Service, Pacific Northwest Research Station), 34–36. General Technical Report PNW–GTR–285.
Lewis, G., Harpold, A., Krogh, S. A., Broxton, P., and Manley, P. N. (2023). The prediction of uneven snowpack response to forest thinning informs forest restoration in the central Sierra Nevada. Ecohydrology 16, e2580. doi:10.1002/eco.2580
Li, S., and Banerjee, T. (2021). Spatial and temporal pattern of wildfires in California from 2000 to 2019. Sci. Rep. 11 (1), 8779. doi:10.1038/s41598-021-88131-9
Loudermilk, E. L., Stanton, A., Scheller, R. M., Dilts, T. E., Weisberg, P. J., Skinner, C., et al. (2014). Effectiveness of fuel treatments for mitigating wildfire risk and sequestering forest carbon: a case study in the Lake Tahoe Basin. For. Ecol. Manag. 323, 114–125. doi:10.1016/j.foreco.2014.03.011
Low, K. E., Collins, B. M., Bernal, A., Sanders, J. E., Pastor, D., Manley, P., et al. (2021). Longer-term impacts of fuel reduction treatments on forest structure, fuels, and drought resistance in the Lake Tahoe Basin. For. Ecol. Manag. 479, e118609. doi:10.1016/j.foreco.2020.118609
Lyon, L. J., Aubry, K. B., Zielinski, W. J., Buskirk, S. W., and Ruggiero, L. F. (1994). “Chapter 6: the scientific basis for conserving forest carnivores: considerations for management,” in The scientific basis for conserving forest carnivores: American marten, Fisher, lynx, and wolverine in the western United States. Editors L. F. Ruggiero, K. B. Aubry, S. W. Buskirk, L. J. Lyon, and W. J. Zielinski (Fort Collins, CO: U.S. Department of Agriculture, Forest Service, Rocky Mountain Research Station), 128–137. General Technical Report RMRS-GTR-254.
Manley, P. N., Povak, N. A., Wilson, K., Fairweather, M. L., and Griffey, V. (2023). Blueprint for resilience: tahoe-central Sierra initiative. Vallejo, CA: U.S. Department of Agriculture, Forest Service. Pacific Southwest Research Station, General Technical Report PSW-GTR-277.
Margoluis, R. A., and Salafsky, N. (1998). Measures of success: designing, managing, and monitoring conservation and development projects. Covelo, CA: Island Press, 384.
Maxwell, C., Scheller, R. M., Long, J. W., and Manley, P. (2022b). Frequency of disturbance mitigates high-severity fire in the Lake Tahoe Basin, California and Nevada. Ecol. Soc. 27 (1), e21. doi:10.5751/ES-12954-270121
Maxwell, C. J., Scheller, R. M., Wilson, K. N., and Manley, P. N. (2022a). Assessing the effectiveness of landscape-scale forest adaptation actions to improve resilience under projected climate change. Front. For. Glob. Change 5, e740869. doi:10.3389/ffgc.2022.740869
Mayer, K. E., and Laudenslayer, W. F. (1988). A guide to wildlife habitats of California. Sacramento, CA: California Department of Fish and Wildlife.
Meyer, M. D., Roberts, S. L., Wills, R., Brooks, M., and Winford, E. M. (2015). Principles of effective USA federal fire management plans. Fire Ecol. 11, 59–83. doi:10.4996/fireecology.1102059
Miller, J. D., Collins, B. M., Lutz, J. A., Stephens, S. L., Van Wagtendonk, J. W., and Yasuda, D. A. (2012). Differences in wildfires among ecoregions and land management agencies in the Sierra Nevada region, California, USA. Ecosphere 3 (9), 1–20. doi:10.1890/es12-00158.1
Munson, S. M., Yackulic, E. O., Bair, L. S., Copeland, S. M., and Gunnell, K. L. (2020). The biggest bang for the buck: cost-effective vegetation treatment outcomes across drylands of the western United States. Ecol. Appl. 30 (7), e02151. doi:10.1002/eap.2151
Murdoch, W., Polasky, S., Wilson, K. A., Possingham, H. P., Kareiva, P., and Shaw, R. (2007). Maximizing return on investment in conservation. Biol. Conserv. 139 (3-4), 375–388. doi:10.1016/j.biocon.2007.07.011
North, M. (2012). Managing Sierra Nevada forests. Vallejo, CA: U.S. Department of Agriculture, Forest Service. Pacific Southwest Research Station, General Technical Report PSW-GTR-237.
North, M., Collins, B. M., and Stephens, S. (2012). Using fire to increase the scale, benefits, and future maintenance of fuels treatments. J. For. 110 (7), 392–401. doi:10.5849/jof.12-021
Petrie, M. D., Savage, N. P., and Stephen, H. (2022). High and low air temperatures and natural wildfire ignitions in the Sierra Nevada region. Environments 9 (8), e96. doi:10.3390/environments9080096
Pielou, E. C. (1966). The measurement of diversity in different types of biological collections. J. Theor. Biol. 13, 131–144. doi:10.1016/0022-5193(66)90013-0
Povak, N. A., and Manley, P. N. (2024). Evaluating climate change impacts on ecosystem resources through the lens of climate analogs. Front. For. Glob. Change 6, e1286980. doi:10.3389/ffgc.2023.1286980
Povak, N. A., Manley, P. N., and Wilson, K. N. (2024). Quantitative methods for integrating climate adaptation strategies into spatial decision support models. Front. For. Glob. Change 7, e772. doi:10.3389/ffgc.2024.1286937
Rinaldi, S., and Scheffer, M. (2000). Geometric analysis of ecological models with slow and fast processes. Ecosystems 3, 507–521. doi:10.1007/s100210000045
Safford, H. D., and Stevens, J. T. (2017). Natural range of variation for yellow pine and mixed-conifer forests in the Sierra Nevada, southern Cascades, and Modoc and Inyo National Forests. California, USA, Vallejo, CA: U.S. Department of Agriculture, Forest Service. Pacific Southwest Research Station, General Technical Report PSW-GTR-256.
Safford, H. D., Stevens, J. T., Merriam, K., Meyer, M. D., and Latimer, A. M. (2012). Fuel treatment effectiveness in California yellow pine and mixed conifer forests. For. Ecol. Manag. 274, 17–28. doi:10.1016/j.foreco.2012.02.013
Safford, H. D., and Van de Water, K. M. (2014). Using fire return interval departure (FRID) analysis to map spatial and temporal changes in fire frequency on national forest lands in California. Vallejo, CA: U.S. Department of Agriculture, Forest Service. Pacific Southwest Research Station, Research Paper PSW-RP-266.
Scheller, R. M., Domingo, J. B., Sturtevant, B. R., Williams, J. S., Rudy, A., Gustafson, E. J., et al. (2007). Design, development, and application of LANDIS-II, a spatial landscape simulation model with flexible temporal and spatial resolution. Ecol. Model. 201 (3-4), 409–419. doi:10.1016/j.ecolmodel.2006.10.009
Scheller, R. M., Kretchun, A. M., Loudermilk, E. L., Hurteau, M. D., Weisberg, P. J., and Skinner, C. (2018). Interactions among fuel management, species composition, bark beetles, and climate change and the potential effects on forests of the Lake Tahoe Basin. Ecosystems 21, 643–656. doi:10.1007/s10021-017-0175-3
Schultz, C. A., Thompson, M. P., and McCaffrey, S. M. (2019). Forest Service fire management and the elusiveness of change. Fire Ecol. 15, 13–15. doi:10.1186/s42408-019-0028-x
Schuurman, G. W., Cole, D. N., Cravens, A. E., Covington, S., Crausbay, S. D., Hoffman, C. H., et al. (2022). Navigating ecological transformation: resist–accept–direct as a path to a new resource management paradigm. BioScience 72 (1), 16–29. doi:10.1093/biosci/biab067
Scott, J. H. (2020). “A deterministic method for generating flame-length probabilities,” in Proceedings of the fire continuum - preparing for the future of wildland fire. Editors S. M. Hood, S. Drury, T. Steelman, and R. Steffens (Fort Collins, CO: U.S. Department of Agriculture, Forest Service, Rocky Mountain Research Station). Proceedings RMRS-P-78.
Scott, J. H., Thompson, M. P., and Calkin, D. E. (2013). A wildfire risk assessment framework for land and resource management. U.S. Department of Agriculture, Forest Service, Rocky Mountain Research Station. doi:10.2737/rmrs-gtr-315
Seaber, P. R., Kapinos, F. P., and Knapp, G. L. (1987). Hydrologic unit maps. Washington, DC, USA: US Government Printing Office, 1987.
Shannon, C. E. (1948). A mathematical theory of communication. Bell Syst. Tech. J. 27 (3), 3–55. doi:10.1145/584091.584093
Simon, B., Crowley, C., and Franco, F. (2022). The costs and costs avoided from wildfire fire management—a conceptual framework for a value of information analysis. Front. Environ. Sci. 10, 804958. doi:10.3389/fenvs.2022.804958
Slauson, K. M., Zielinski, W. J., and Schwartz, M. K. (2017). Ski areas affect Pacific marten movement, habitat use, and density. J. Wildl. Manag. 81 (5), 892–904. doi:10.1002/jwmg.21243
Smith, W. P. (2012). Sentinels of ecological processes: the case of the northern flying squirrel. BioScience 62 (11), 950–961. doi:10.1525/bio.2012.62.11.4
Steel, Z. L., Safford, H. D., and Viers, J. H. (2015). The Fire frequency-severity relationship and the legacy of fire suppression in California forests. Ecosphere 6 (1), 1–23. doi:10.1890/ES14-00224.1
Stein, S. M., Menakis, J., Carr, M. A., Comas, S. J., Stewart, S. I., Cleveland, H., et al. (2013). Wildfire, wildlands, and people: understanding and preparing for wildfire in the wildland-urban interface - a Forests on the Edge report. Fort Collins, CO: U.S. Department of Agriculture, Forest Service, Rocky Mountain Research Station, 36. General Technical Report RMRS-GTR-299.
Stephens, S. L., Lydersen, J. M., Collins, B. M., Fry, D. L., and Meyer, M. D. (2015). Historical and current landscape-scale ponderosa pine and mixed conifer forest structure in the Southern Sierra Nevada. Ecosphere 6 (5), 1–63. doi:10.1890/es14-00379.1
Stevens, J. T., Collins, B. M., Long, J. W., North, M. P., Prichard, S. J., Tarnay, L. W., et al. (2016). Evaluating potential trade-offs among fuel treatment strategies in mixed-conifer forests of the Sierra Nevada. Ecosphere 7 (9), e01445. doi:10.1002/ecs2.1445
Tempel, D. J., Gutiérrez, R. J., Battles, J. J., Fry, D. L., Su, Y., Guo, Q., et al. (2015). Evaluating short-and long-term impacts of fuels treatments and simulated wildfire on an old-forest species. Ecosphere 6 (12), 1–18. doi:10.1890/es15-00234.1
Thompson, I., Mackey, B., McNulty, S., and Mosseler, A. (2009). Forest resilience, biodiversity, and climate change: a synthesis of the biodiversity/resilience/stability relationship in forest ecosystems. Montreal: Secretariat of the Convention on Biological Diversity, 67. Technical Series.
Thompson, M. P., Bowden, P., Brough, A., Scott, J. H., Gilbertson-Day, J., Taylor, A., et al. (2016). Application of wildfire risk assessment results to wildfire response planning in the southern Sierra Nevada, California, USA. Forests 7 (3), 64. doi:10.3390/f7030064
Thorne, J. H., Choe, H., Stine, P. A., Chambers, J. C., Holguin, A., Kerr, A. C., et al. (2018). Climate change vulnerability assessment of forests in the Southwest USA. Clim. Change 148, 387–402. doi:10.1007/s10584-017-2010-4
USDA and USDI [U.S. Department of Agriculture and U.S. Department of the Interior] (2014). National cohesive wildland fire management strategy. Washington, D.C., USA: USDA and USDI.
U.S. Forest Service (2016). Chapter 2020, ecosystem restoration 2000-2016-1. U.S. Forest service manual. Washington, D.C: National Forest Resource Management.
Vanderwel, M. C., and Purves, D. W. (2014). How do disturbances and environmental heterogeneity affect the pace of forest distribution shifts under climate change? Ecography 37 (1), 10–20. doi:10.1111/j.1600-0587.2013.00345.x
Volger, K. C., Brough, A., Moran, C. J., Scott, J. H., and Gilbertson-Day, J. W. (2021). Contemporary wildfire hazard across California. Vallejo, CA: U.S. Department of Agriculture, Pacific Southwest Region. Available online at: http://pyrologix.com/reports/Contemporary-Wildfire-Hazard-Across-California.pdf.
Walker, B., Holling, C. S., Carpenter, S. R., and Kinzig, A. (2004). Resilience, adaptability and transformability in social–ecological systems. Ecol. Soc. 9 (2), e5. doi:10.5751/es-00650-090205
Williams, C. A., Collatz, G. J., Masek, J., and Goward, S. N. (2012). Carbon consequences of forest disturbance and recovery across the conterminous United States. Glob. Biogeochem. Cycles 26 (1). doi:10.1029/2010GB003947
Williams, J. N., Safford, H. D., Enstice, N., Steel, Z. L., and Paulson, A. K. (2023). High-severity burned area and proportion exceed historic conditions in Sierra Nevada, California, and adjacent ranges. Ecosphere 14 (1), 4397. doi:10.1002/ecs2.4397
Williams, J. W. (2022). RAD: a paradigm, shifting. Bioscience 72 (1), 13–15. doi:10.1093/biosci/biab123
Wilson, B. T., Woodall, C. W., and Griffith, D. M. (2013). Imputing forest carbon stock estimates from inventory plots to a nationally continuous coverage. Carbon Balance Manag. 8, 1–15. doi:10.1186/1750-0680-8-1
With, K. A. (2002). The landscape ecology of invasive spread. Conserv. Biol. 16 (5), 1192–1203. doi:10.1046/j.1523-1739.2002.01064.x
Keywords: biodiversity conservation, carbon, ecosystem resilience, forest management, wildfire risk
Citation: Manley PN, Bistritz L, Povak NA and Day MA (2025) Going slow to go fast: landscape designs to achieve multiple benefits . Front. Environ. Sci. 13:1560125. doi: 10.3389/fenvs.2025.1560125
Received: 13 January 2025; Accepted: 08 April 2025;
Published: 28 April 2025.
Edited by:
Vinicius Londe, University of Georgia, United StatesReviewed by:
Carl A. Norlen, United States Department of the Interior, United StatesDeborah Nemens, University of Washington, United States
Copyright © 2025 Manley, Bistritz, Povak and Day. This is an open-access article distributed under the terms of the Creative Commons Attribution License (CC BY). The use, distribution or reproduction in other forums is permitted, provided the original author(s) and the copyright owner(s) are credited and that the original publication in this journal is cited, in accordance with accepted academic practice. No use, distribution or reproduction is permitted which does not comply with these terms.
*Correspondence: Patricia N. Manley, cGF0cmljaWEubWFubGV5QHVzZGEuZ292