 Yuan Li
 Xiao Hui Wang1
- 1Research Institute of Forestry Policy and Information, Chinese Academy of Forestry, Beijing, China
- 2Division of International Cooperation, Chinese Academy of Forestry, Beijing, China
The Yellow River Basin is one of the basins characterized by China’s most complex geomorphological features. Investigating how the spatial pattern evolution of land types affects ecosystem service value (ESV) provides critical guidance for enhancing land resource management and ecological conservation in the Yellow River Basin. This study employs grid-based analysis, the modified equivalent factor method, the geographical detector model, and the grey correlation model to examine spatiotemporal variations in land-use patterns and ESV across the basin. Findings reveal: (1) From 1980 to 2020, construction land and ecological land demonstrated positive single dynamic degrees, with the construction land exhibiting the most pronounced expansion, increasing by 8.43. Cultivated land, wetlands, and wasted land showed negative dynamic degrees, and the wasted land showed the most significant decrease by 1.56. The comprehensive dynamic degree indicated overall expansion, peaking at 0.23 during 2010–2020. (2) The ESV of provisioning, regulating, supporting, and cultural services in the Yellow River Basin displayed U-shaped trends, ultimately increasing by 29.856, 2.103, 0.624, and 0.355 billion yuan, respectively, by 2020. (3) Spatial analysis identifies stepwise ESV distribution patterns in the Yellow River Basin, with significant value accumulation and clustering observed in upper reaches and the delta region. The Taihang and Qinling Mountains emerged as critical demarcation lines for ESV spatial gradients. (4) In the analysis of impact factors, spatial drivers, including rainfall, habitat quality, population density, GDP, and DEM, have substantial effects on ESV. In contrast, temporal features, including soil type, slope, population density, GDP, and nighttime light intensity, correlate highly with ESV. Notably, GDP and nighttime light intensity exhibited growing influence on ESV as socioeconomic activities intensified. Ecological governance achieved remarkable progress, particularly in upper and delta regions, though accompanied by increased ESV spatial fragmentation across basin sections. This study would provide scientific support for integrated land management, spatial economic planning, and ecological policy formulation in the Yellow River Basin by conducting the basin-scale analysis.
1 Introduction
Natural ecosystems constitute the foundation for human survival and development, providing essential material resources for human existence and progress (Costanza et al., 1997). Land use/cover change (LUCC) is critical in global physical, chemical, and ecological environmental transformations. Consequently, LUCC impacts the capacity and quality of natural ecosystems to supply material resources for humanity (El-Hamid et al., 2020). Land use change significantly influences the spatiotemporal characteristics of ecosystem service value (ESV) (Yee et al., 2021). As a pivotal metric for ecosystem services, ESV quantifies material benefits and non-material well-being derived from provisioning, regulating, cultural, and supporting services (Schirpke et al., 2020; Yang et al., 2020; Liang et al., 2021; Peng et al., 2021). The quantification of ESV directly indicates ecological environmental quality (Zhai et al., 2020). It effectively mirrors the operational capacity of diverse ecosystem service functions (Su et al., 2020). Simultaneously, LUCC represents fundamental socioeconomic practices driven by economic development and human activities, emerging as a critical determinant of ESV variations, which governs the spatiotemporal evolution patterns of ESV (Zhao et al., 2020; Zheng et al., 2023). Therefore, a comprehensive investigation of LUCC-induced spatiotemporal variations in ESV patterns, driven by geospatial characteristics, economic development, and human activity intensity, holds practical significance for optimizing regional land resource management and enhancing ecosystem service functionality. This approach provides policymakers with crucial theoretical frameworks and evidence-based decision-making support.
Ecosystem services form the cornerstone of human survival and development, and ESV estimation facilitates a robust understanding of ecosystem functions (Xie et al., 2020). In exploring methods to quantify ESV contributions to economic development and societal activities, Professor Daily’s seminal work Nature’s Services: Societal Dependence on Natural Ecosystems (Pharo and Daily, 1997) first established a systematic definition of ecosystem services in 1997. In the same year, Costanza et al. (1997) revolutionized ESV quantification through equivalent factor methodology, establishing a global assessment framework, which catalyzed growing academic interest in ESV evaluation methodologies. In 1999, Chinese scholars Ouyang et al. (1999) conducted the first ESV assessment of China’s terrestrial ecosystems. Xie et al. (2008), Xie et al., (2015) developed China-specific ESV equivalence tables by adapting Costanza’s framework to local ecological contexts through coefficient calibration. This methodology has been widely applied in ESV accounting across diverse ecosystems, including forests (Wang et al., 2020), wetlands (Nie et al., 2023), grasslands (Qian et al., 2021), farmlands (Sun et al., 2021), deserts (Shao et al., 2022), watersheds (Zheng et al., 2020), and urban agglomerations (Xiao et al., 2020). However, this approach overlooks vegetation growth dynamics in ESV accuracy, as highlighted by Zelený et al. (2021). Consequently, scholars (Xi et al., 2021; Feng et al., 2024) have integrated the Normalized Difference Vegetation Index (NDVI) to refine ESV assessments, enhancing scientific precision.
Research on ESV impact factors identifies natural environment, economic development, and human activities as primary determinants (Shi et al., 2022; Zhang et al., 2023). Most studies construct ESV influence factor frameworks across these three dimensions, employing methods such as regression analysis (Hu et al., 2020), geographically weighted regression (Yu et al., 2022), ordinary least squares (Xing et al., 2021), correlation analysis (Gu et al., 2023), geographical detector (Han et al., 2021), and grey correlation analysis (Rehman and Rehman, 2022) to empirically support findings and policy recommendations. However, standalone application of these models exhibits limitations: correlation and grey correlation analyses fail to clarify causal directions between ESV variables, merely indicating association strength; regression analysis cannot prioritize factor importance; and all three approaches neglect spatial heterogeneity and complex interactions among drivers. To address these gaps, this study introduces the geographical detector (Liao et al., 2021; Wang X. et al., 2022) to explore spatiotemporal differentiation of influencing factors and reveal their coupling effects on ESV. Combined with grey correlation analysis for temporal correlation assessment, this integrated approach offers novel perspectives for analyzing long-term ESV spatial evolution and driving mechanisms.
Building on this foundation, the study employs a multidisciplinary methodology—including the revised equivalent factor method, GIS spatial grid analysis, LUCC spatiotemporal evolution analysis, grey correlation analysis, and geographical detector modeling—to investigate ESV spatial pattern dynamics from the perspectives of LUCC evolution and factor-driven spatiotemporal interactions. It identifies constraining factors affecting ESV spatial pattern evolution in the Yellow River Basin during 1980–2020, providing theoretical and decision-making support for land-use management and ecological governance. The objectives and key contributions include: (1) Evaluating ESV spatial pattern evolution in the Yellow River Basin from 1980 to 2020, particularly before and after the 2000 ecological restoration policy implementation. (2) Revealing spatiotemporal gradient variation characteristics of ESV spatial patterns in the basin. (3) Analyzing temporal and spatial impacts of diverse factors on ESV across historical periods. (4) Providing theoretical and practical guidance for ecological conservation and high-quality development in the Yellow River Basin.
2 Research site and data sources
2.1 Research site
As shown in Figure 1, the Yellow River Basin spans nine provinces in China, including Sichuan, Qinghai, Gansu, Inner Mongolia, Ningxia, Shaanxi, Shanxi, Henan, and Shandong, covering a total area of 795,000 km2 (8.28% of China’s land area). The basin features diverse geomorphology and complex habitats, with elevations ranging from −34 m to 6,190 m and a topography descending from west to east. Climatically, the basin transitions from arid in the northwest to semi-arid and semi-humid in the southeast. The Yellow River is divided into upper, middle, and lower reaches based on two key landmarks: Hekou Town in Tuoketuo County (Inner Mongolia) and Taohuayu in Xingyang City (Henan Province). The upper reaches, characterized by high-altitude plateaus (average elevation >4,000 m), consist of mountain ranges and valleys. Loess landforms with severe soil erosion dominate the middle reaches (1,000–2,000 m elevation). The lower reaches comprise alluvial plains with high urbanization levels.
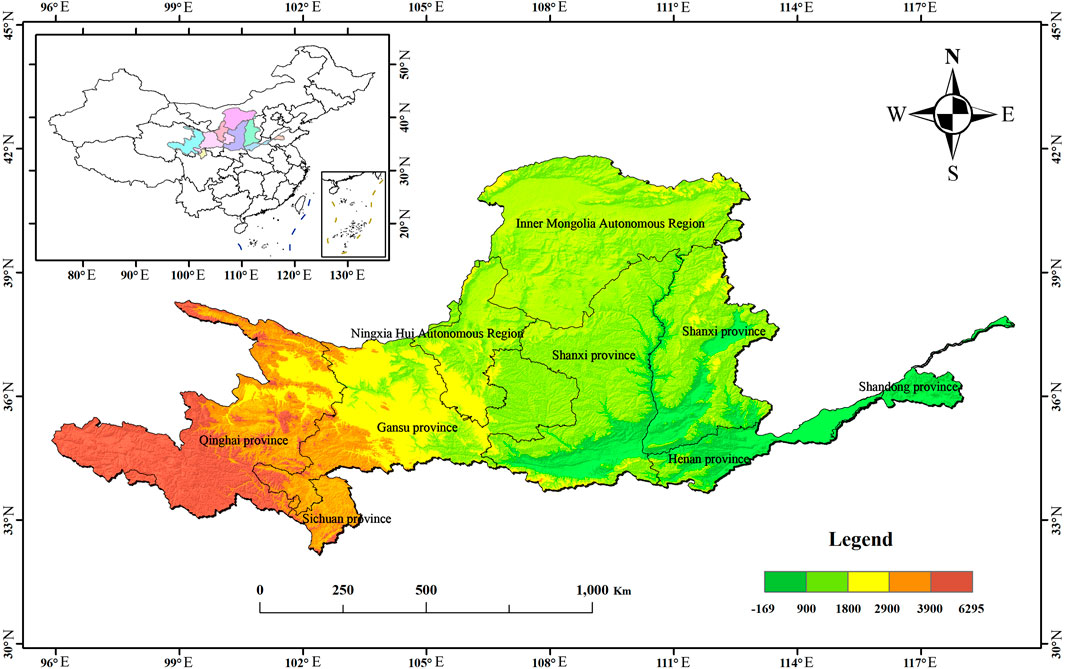
Figure 1. The Yellow River Basin’s location map.
2.2 Data collection
Normalized Difference Vegetation Index (NDVI), Digital Elevation Model (DEM), and slope data were obtained from the Geospatial Data Cloud (https://www.gscloud.cn). Temperature, nighttime light, GDP, population density, DEM, and 30 m-resolution land use data (1980–2020) were sourced from the China Meteorological Data Service Network (http://data.cma.cn/) and the Resources and Environment Science and Data Center, Chinese Academy of Sciences (https://www.resdc.cn). Soil data were acquired from the National Cryosphere Desert Data Center (https://www.ncdc.ac.cn). Figure 2 illustrates the spatial distribution of influencing factors.
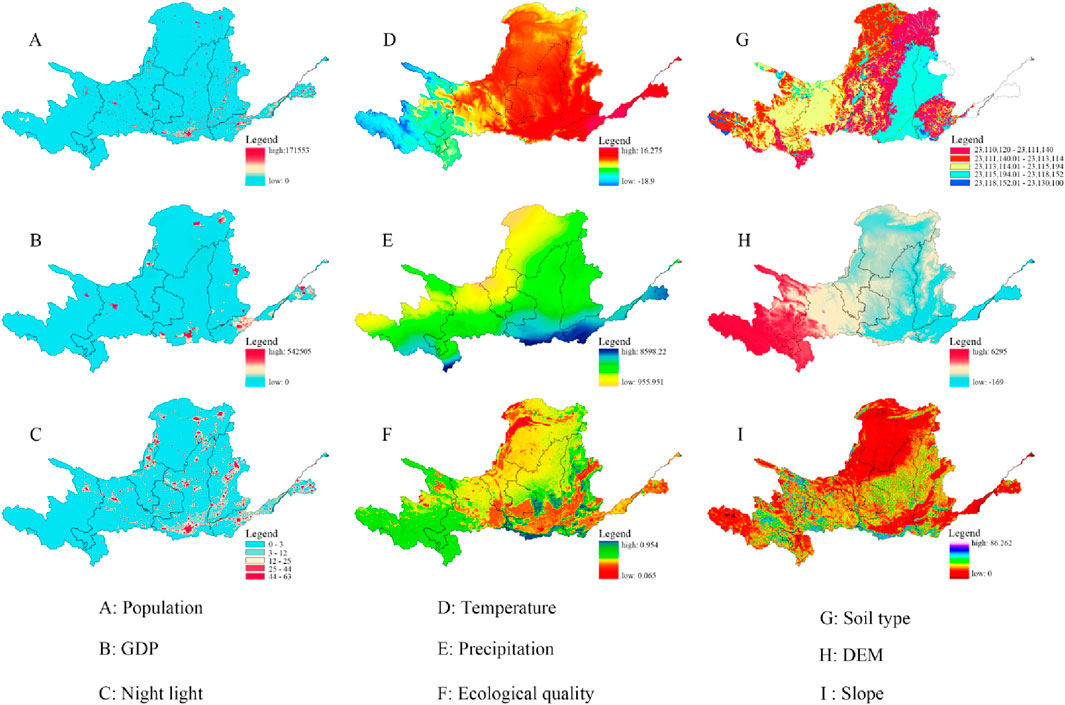
Figure 2. Impact factors. (A) Population, (B) GDP, (C) Night light, (D) Temperature, (E) Precipitation, (F) Ecological quality, (G) Soil type, (H) DEM, (I) Slope.
3 Methodology
3.1 Land use change dynamics
The single land use dynamic degree reflects the spatiotemporal variations and change intensity of land use type, enabling precise capture of the specific land category transformations. The Equation is:
Where
The comprehensive land use dynamic degree measures the overall land use change rate, reflecting the intensity of land use change affected by economic development and the rate of economic development at different times. The Equation is:
Where
3.2 Land use transition matrix
The land use transition matrix quantifies the status of inter-category conversions during the study period, providing a quantitative description of land transformation processes. The Equation is:
Where
3.3 Ecosystem service value (ESV)
Based on China’s ecosystem service equivalent table (Xie et al., 2015), the economic value of grain production per unit area of the study area was revised to quantify the total change and spatial distribution characteristics of ESV in the Yellow River Basin. The Equation is:
Where
3.4 ESV contribution rate
The ESV contribution rate reflects the contribution rate of various land uses to ESV change in a specific period. This method was adopted to analyze the contribution rate of ecosystem service values of different land types in the Yellow River Basin during the research period. The Equation is:
Where
3.5 Geographical detector
The geographical detector (Wang and Xu, 2017) statistically identifies spatial heterogeneity and driver-response relationships. This model was used to explore the relationship between ESV and potential influencing factors, identifying the dominant and ineffective factors. The Equation is:
Let
Interaction detection evaluates whether the combined explanatory power of multiple driving factors on the dependent variable increases or decreases compared to that of individual factors. The interaction between two factors X1 and X2 can manifest in five types: nonlinear weakening, bifactorial enhancement, single-factor nonlinear weakening, nonlinear enhancement, and mutual independence.
3.6 Grey correlation analysis
The grey correlation analysis was employed to quantify the inter-factor associations and identify critical drivers within the system. The relational coefficient is calculated as:
Let
Where
4 Results and analysis
4.1 Dynamics of land use changes in the Yellow River basin
Table 1 shows the single dynamic degree of land use changes; construction land exhibited continuous growth, with the largest increase from 1980 to 2020 in the Yellow River Basin. Agricultural lands such as cultivated land and grassland fluctuated across periods but showed an overall declining trend, particularly with accelerated cultivated land loss in later stages. Natural ecosystems, including wetlands and water area, experienced widespread reductions, especially during the initial and middle phases. Wasteland displayed variable trends across phases but faced intensified loss in recent years. Forests land, however, achieved positive growth across multiple periods, contributing to regional ecological restoration.
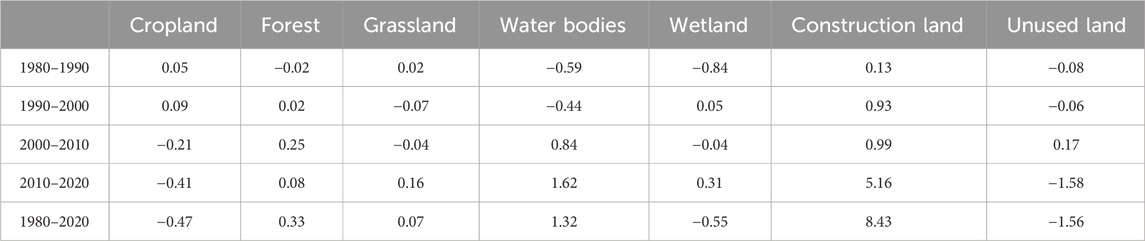
Table 1. Single-movement attitudes to land-use change.
The comprehensive dynamic degree of land use changes in the Yellow River Basin (Table 2) reached 0.25 during 1980–2020, indicating significant transformation. Phased analysis revealed lower values of 0.03 and 0.04 in 1980–1990 and 1990–2000, respectively, reflecting gradual changes. The dynamic degree increased to 0.08 during 2000–2010 and peaked at 0.23 in 2010–2020, marking the most rapid land use shifts. The transition from slow to rapid growth in land use dynamics over the study period, particularly in the last 2 decades, highlights intensified anthropogenic impacts.

Table 2. Integrated dynamic attitudes to land-use change.
4.2 Land use changes over time and space
4.2.1 Land use area changes
As shown in Table 3 and Figure 3, cultivated land, wasted land, and wetlands decreased by 1.23%, 1.22%, and 0.10%, respectively, from 1980 to 2020 in the Yellow River Basin. Construction land, forests land, and grassland increased by 1.65%, 0.44%, and 0.33%, respectively. Specifically, cultivated land decreased by 9,781 km2, wasteland by 9,869 km2, and wetlands by 821 km2, while forests land, grassland, water area, and construction land increased by 3,466 km2, 2,668 km2, 1,089 km2, and 13,115 km2, respectively. According to Table 3, the year 2000 marked a critical turning point. Post-2000 phase, the cultivated land, wetlands, and wasteland declined sharply, which decreased by 2.84%, 2.33%, and 0.28%, respectively, while forest land, grassland, water area, and construction land increased by 0.88%, 0.88%, 0.38%, and 3.09%, respectively. These shifts align with China’s Grain for Green Program initiated in 2000, reflecting a strategic balance between economic development and ecological conservation.
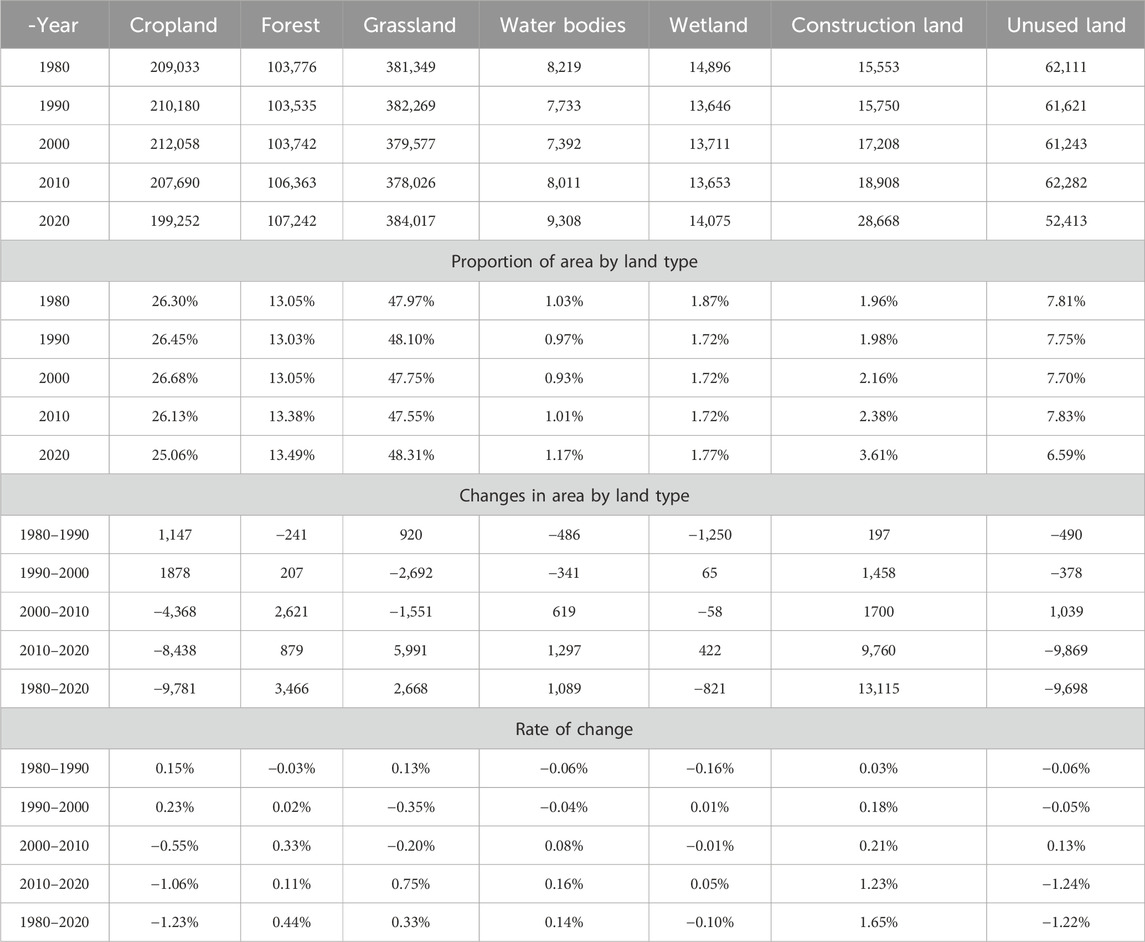
Table 3. Spatial and temporal shifts in land use within YRB.
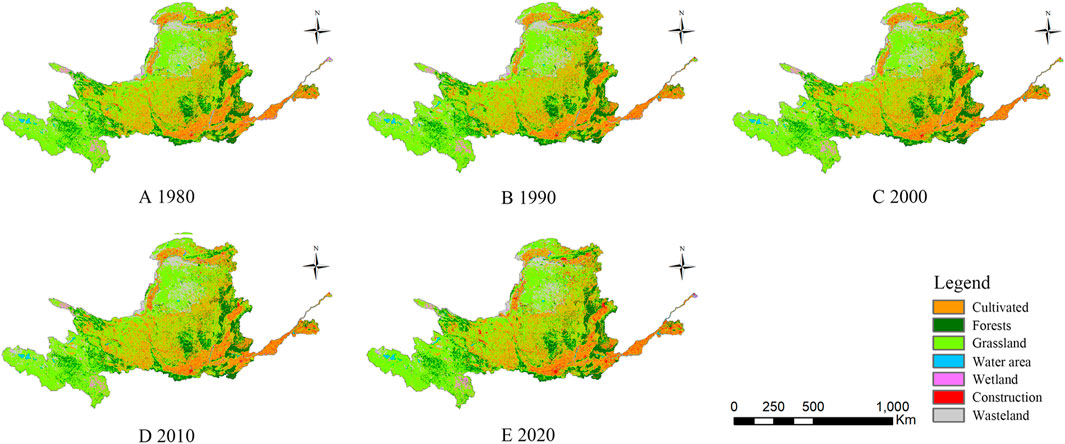
Figure 3. Spatial distribution of land use changes.
4.2.2 Land use transfers
Figure 4 delineates land use change in Yellow River Basin. During the early phase (1980–1990), grassland, construction land, and wasteland increased by 5,224.24 km2, 19,755.08 km2, and 1,309.90 km2, respectively, while cultivated land, forests land, wetlands, and water area decreased by 17,473.90 km2, 3,987.46 km2, 3,751.74 km2, and 710.00 km2, respectively. Land conversions primarily involved compensatory exchanges between cultivated land and grassland, as well as grassland-to-forests land and grassland-to-wasted land transitions. Construction land expansion sourced 73.3% of its growth from cultivated land (78,32.93 km2) and grassland (25,375.49 km2), reflecting the “land-for-development” fiscal strategy of that era. In the early-middle phase (1990–2000), grassland and construction land increased by 3,200.40 km2 and 21,086.00 km2, respectively, while cultivated land, forests land, wetlands, water area, and wasteland decreased by 8,539.00 km2, 1,878.20 km2, 4,508.00 km2, 450.00 km2, and 1,200.00 km2, respectively. Notable area change rates included construction land (+138%), wetlands (−33.3%), water area (−12.0%), and cultivated land (−4.06%). Construction land expansion primarily derived from 8,706.05 km2 (41.3%) of cultivated land and 2,302.13 km2 (10.9%) of grassland. Cultivated land transfer involved 53,672.45 km2 (54.8%) to grassland, while grassland transfer involved 56,182.79 km2 (72.3%) to cultivated land, maintaining a compensatory balance. Grassland growth mainly originated from wasteland conversion, accounting for 18,411.71 km2 (31.2%). This period intensified conflicts among cultivated land, grassland, wetlands, and construction land.
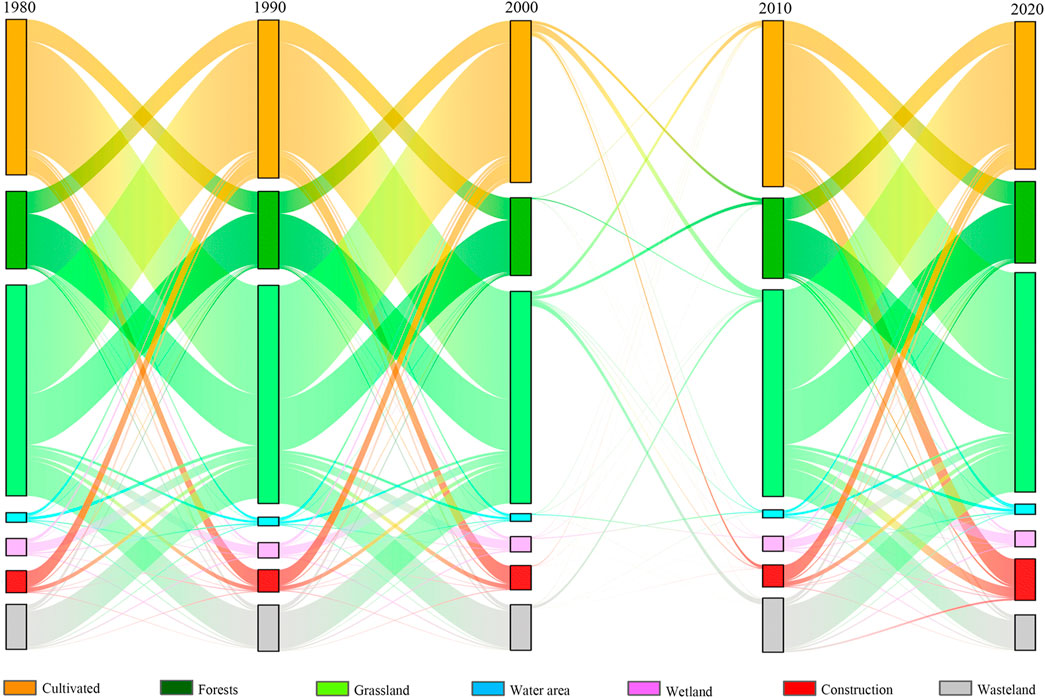
Figure 4. Land use transfer change.
During the middle phase (2000–2010), construction land, forests land, wetlands, and water area increased by 6,675.94 km2 (18.36%), 897.33 km2 (0.88%), 863.28 km2 (6.86%), and 454.38 km2 (6.47%), respectively, while grassland, cultivated land, and wasteland decreased by 806.73 km2 (0.21%), 567.05 km2 (0.27%), and 163.63 km2 (0.28%), respectively. Construction land continued expanding, but cultivated land conversion decreased by 89.3%, reflecting initial ecological protection success. In the recent phase (2010–2020), construction land surged by 36,323.85 km2, while forests land, wetlands, and water area increased steadily by 3,942.40 km2, 762.97 km2, and 278.71 km2, respectively. However, cultivated land, grassland, and wasted land declined sharply by 10,533.69 km2, 9,681.92 km2, and 8,732.74 km2, respectively. Construction land expansion encroached on 12,992.12 km2 (35.8%) of cultivated land and 5,067.39 km2 (14.0%) of grassland. Cultivated land primarily converted to 53,214.90 km2 (59.1%) grassland and 12,992.12 km2 (14.4%) construction land, while grassland transitioned to 27,014.21 km2 (29.7%) forests land and 3,900.86 km2 (15.3%)wasteland. These rapid shifts risk systemic cultivated land degradation and grassland ecological crises.
4.3 Value shifts for ecological services
Figure 5 illustrates ESV changes in the Yellow River Basin, with total value increasing from 2.356734 trillion CNY in 1980 to 2.389673 trillion CNY in 2020, a net gain of 32.939 billion CNY. ESV decreased by 20.461 billion CNY during 1980–1990 and 15.069 billion CNY during 1990–2000, accumulating a 35.53 billion CNY reduction during 1980–2000. 2000–2010 and 2010–2020 are recovery phases, the ESV increases of 16.451 billion CNY and 52.018 billion CNY, respectively, cumulating to 68.469 billion CNY. The ESV of regulating services, supporting services, cultural services, and provisioning services in the Yellow River Basin has increased by 29.856 billion CNY, 2.103 billion CNY, 0.624 billion CNY, and 0.355 billion CNY, respectively, among which the supply services saw the least growth. Negative growth emerged in food production, raw material supply, and nutrient cycling, contrasting with positive trends in other ESV components. Section 3.2 analysis reveals cultivated land loss coupled with ecological/construction land expansion as primary drivers of negative ESV trends in these categories.
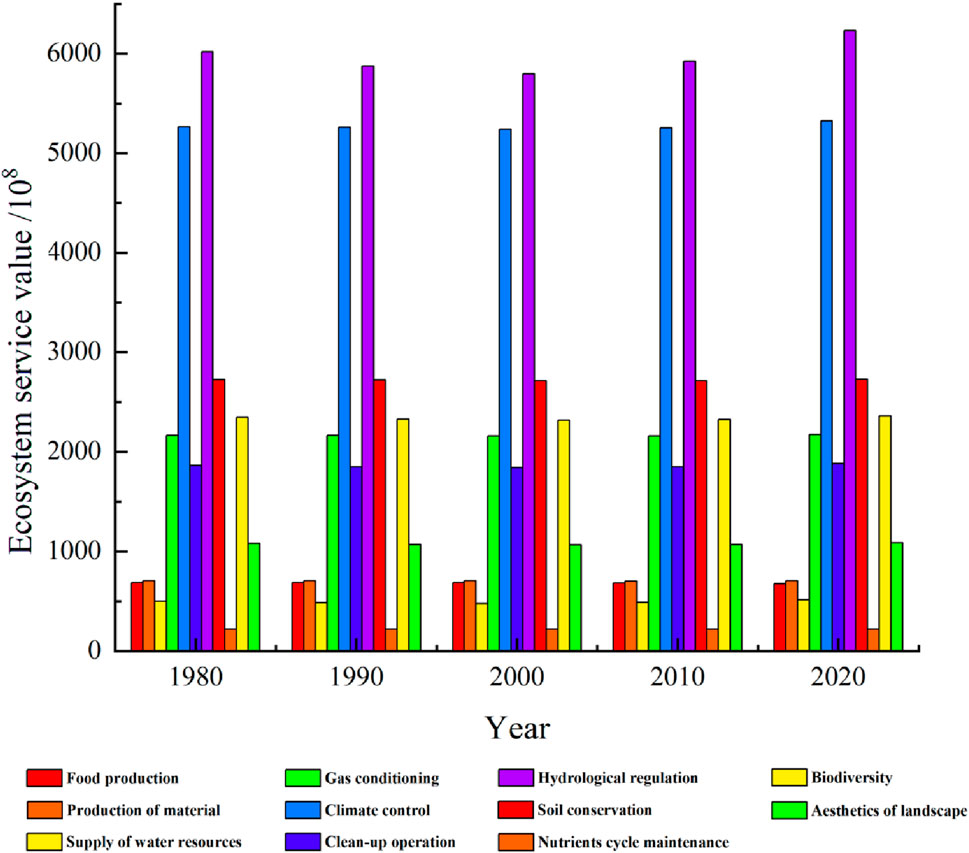
Figure 5. Ecological service value.
From 1980 to 2000, the ESV of water supply, gas regulation, climate regulation, environmental purification, soil retention, hydrological regulation, biodiversity, and landscape aesthetics all declined. Post-2000, most services rebounded except soil retention, which began recovering only after 2010, reflecting the delayed impact of the Grain for Green Program, Three-River Source Ecological Protection Project, and Loess Plateau soil conservation initiatives. The ESV of hydrological regulation, climate regulation, environmental purification, water resource supply, and biodiversity in the Yellow River Basin all exceed 1 billion CNY, amounting to 21.2 billion CNY, 5.885 billion CNY, 1.941 billion CNY, 1.574 billion CNY, and 1.505 billion CNY, respectively. Food production suffered the steepest decline, about 1.11 billion CNY, directly correlated with cultivated land depletion.
4.4 Spatial distribution of ESV
4.4.1 Spatial distribution of provisioning services
Figure 6 demonstrates distinct spatial polarization of provisioning services, with low-value zones clustered in southern Inner Mongolia and the Shandong section, while high-value zones cluster in northern Sichuan and northern Qinghai, the water source areas of the Yellow River. Spatial patterns remained stable from 1980 to 2010; however, in 2010, marked supply service value and spatial distribution growth occurred at the Yellow River source area in the northern Sichuan and northern Qinghai and the Yellow River Delta area in Shandong. These enhanced areas spatially correspond with key ecological constructions in the Yellow River Basin.
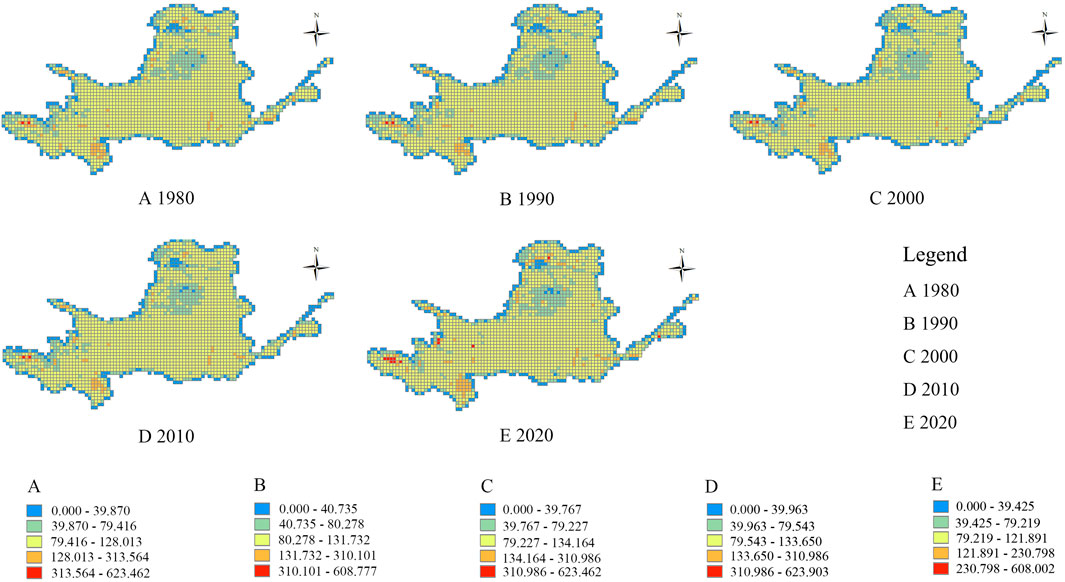
Figure 6. Geographical distribution of supply services.
The spatial distribution of food production, raw material production, and water supply services in the Yellow River Basin is shown in Figure 7. From 1980 to 2000, the high-value food production zones in the Yellow River Basin were distributed in western Gansu, southern Henan, southern Shanxi, northern Shaanxi, the middle and upper reaches of the Shandong section, and northern/southern Shaanxi. The spatial distribution of food production gradually showed a spatial aggregation and contraction trend. From 1980 to 2020, the high-value zones of raw material production were mainly distributed in the middle and upper reaches. Meanwhile, the spatial fragmentation level of the middle reaches was higher than that of the upper reaches. In 2020, the spatial agglomeration and raw material production area in the upper reaches significantly increased, with enhanced spatial agglomeration in eastern Shaanxi, western Shanxi, and the “几”-shaped Bend. The high-value zones of water resource supply were mainly located in the basin’s upper reaches, including Qinghai and Sichuan, with no significant changes throughout 1980–2020. Mid-reaches water supply capacity improved by 2010, and low-value zones experienced intensified fragmentation during 1980–2010. In 2020, both the low-value and mid- and high-value water supply zones showed enhanced spatial agglomeration.
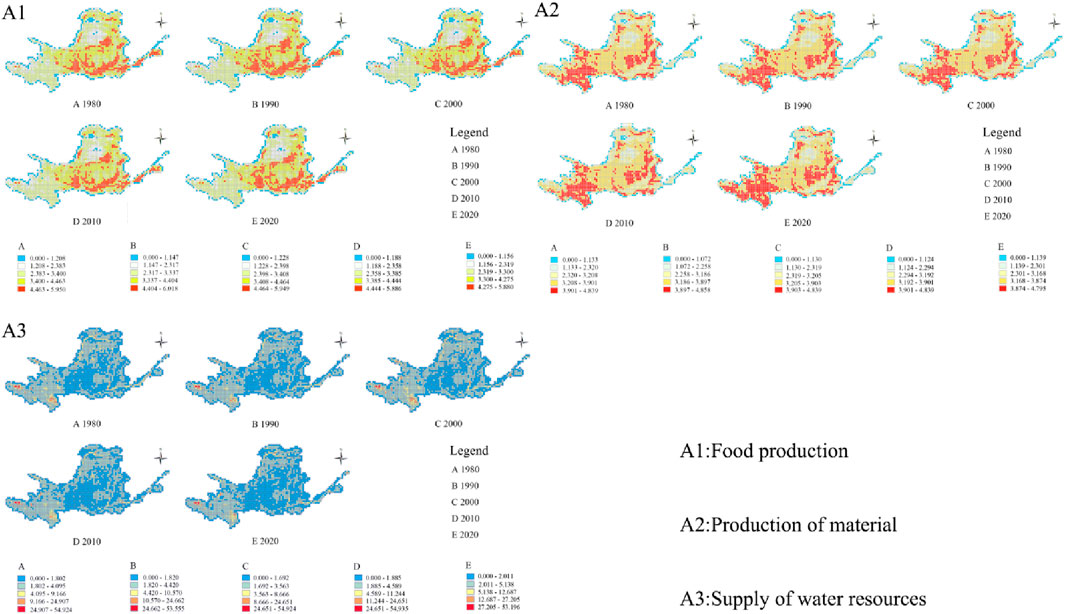
Figure 7. Geographical distribution of supply service subsets.
4.4.2 Regulatory services
Figure 8 reveals regulating service low-value zones concentrated along the Taihang Mountains, the Qinling Mountains, and the Shandong section. The Shandong section exhibited service capacity improvements during 2010–2020 with expanded mid-high value areas. Mid- and high-value clusters predominated in Qinghai, Sichuan, central-western Inner Mongolia, and southeastern Shaanxi. Low-value zone clustering intensified during 2000–2010, while the spatial agglomeration of high-value zones in the upper reaches intensified in 2020. Due to physical geographic conditions, Taihang Mountains, Qinling Mountains, northern Inner Mongolia, and Shandong are persistently low-value zones for regulating services.
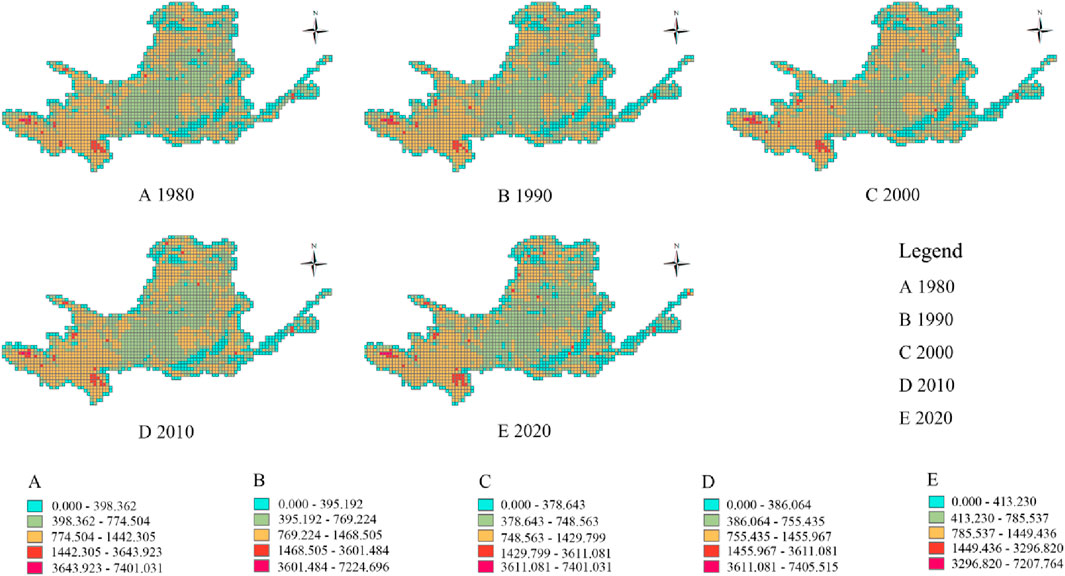
Figure 8. Spatial distribution of mediation services.
Figure 9 details the service value of gas conditioning, climate control, clean-up operation, and hydrological regulation. Gas conditioning hotspots in Qinghai, Sichuan, Shaanxi, and northern Inner Mongolia. From 1980 to 2020, the high-value zones at upper reaches transitioned from dispersed to aggregated configurations, while low values occurred in Taihang Mountains, Qinling Mountains, northern Inner Mongolia, and Shandong. The spatial distribution of climate control is similar to that of gas conditioning, with upper reaches expansions from 1980 to 2020. The clean-up operation changed significantly from 1980 to 2020, with the areas of high-value zones in upper and middle reaches expanding, and areas of mid- and high-value zones in the Qinling Mountains also increasing. Hydrological regulation maintained stable patterns, with low values in Gansu, southwestern Shaanxi, Taihang Mountains, and Qinling Mountains at the middle reaches. However, the Yellow River Delta demonstrated mid-high value growth in 2020. The Taihang Mountains, Qinling Mountains, northern Inner Mongolia, and the Shandong section critically influence all regulating services.
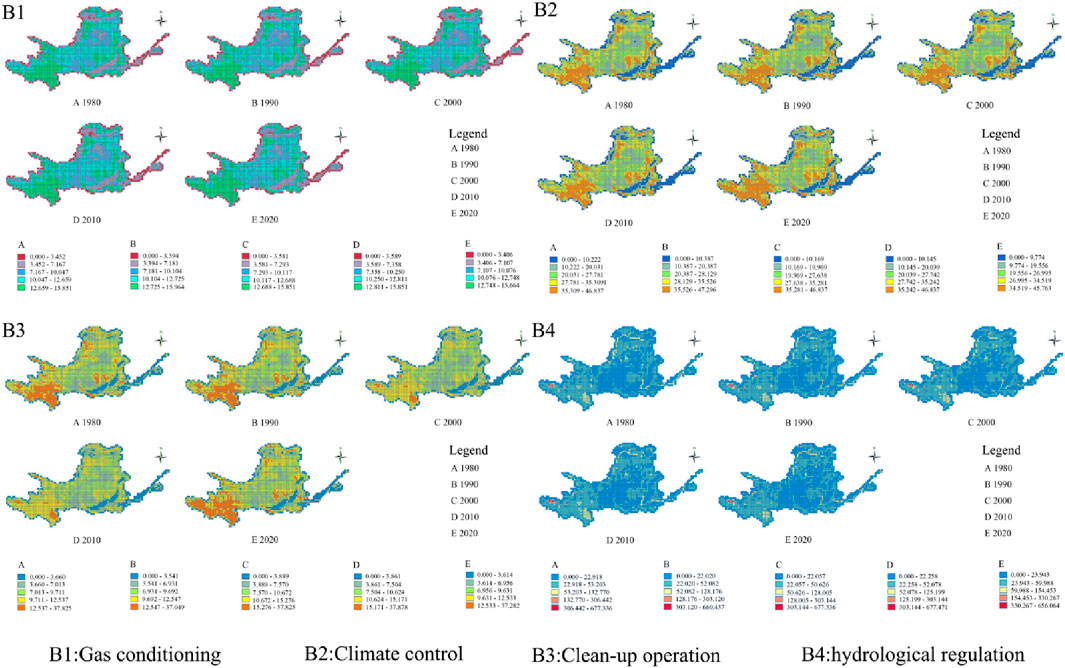
Figure 9. Spatial distribution of mediation service subsets.
4.4.3 Spatial distribution of supporting services
Figure 10 identifies supporting service low-value zones along the Taihang Mountains, the Qinling Mountains, northern Inner Mongolia, and the Shandong section. From 2010 to 2020, Shandong section showed enhanced supporting capacity with expanded mid- and high-value areas. Mid- and high-value clusters are concentrated in Qinghai, Sichuan, northwestern Inner Mongolia, southeastern Shaanxi, and central Shanxi. High-value areas remained stable during 1980–2010. Nevertheless, by 2020, the area of high-value zones grew rapidly, and spatial fragmentation decreased, especially significant in upper reaches. Throughout 1980–2020, the supporting services in Qinghai, Sichuan, and Shandong section improved notably.
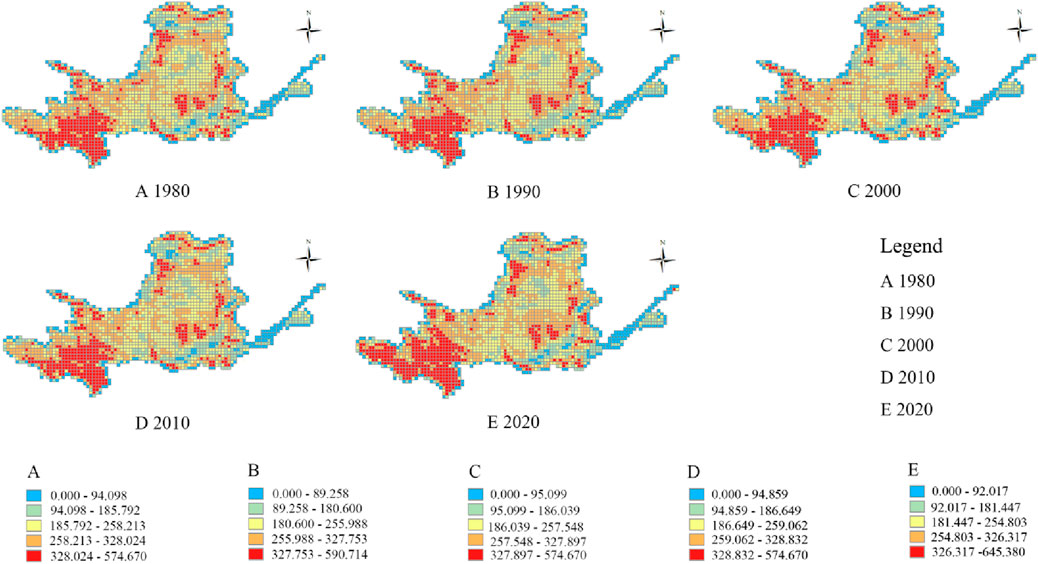
Figure 10. Geographical distribution of support services.
Figure 11 displays spatial distribution of supporting services regarding soil conservation, nutrients cycle maintenance and biodiversity. Soil conservation values increased substantially in high-value zones at upper reaches, especially in 2020. High-value zone of nutrients cycle maintenance persisted in upper reaches and peri-mountainous areas. In 2020, however, the nutrient cycling in the upper reaches saw a concentrated growth, while the spatial fragmentation in the middle reaches intensified. Biodiversity hotspots concentrated in the upper reaches and delta regions of the lower reaches throughout 1980–2020, and the high-value re-increased in 2020. Low-value zones exhibited spatial congruence across soil conservation, nutrient cycle maintenance, and biodiversity, which were consistently low in Taihang Mountains, Qinling Mountains, northern Inner Mongolia, and the Shandong section.
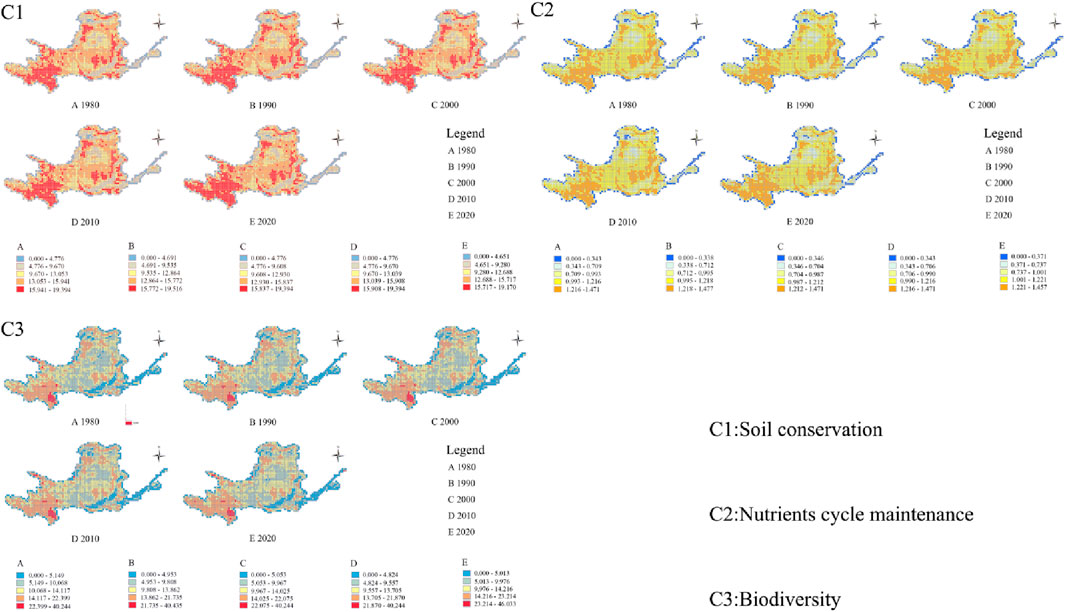
Figure 11. Distribution of support service subsets in space.
4.4.4 Cultural services
As shown in Figure 12, cultural service low-value zones along the Taihang Mountains, Qinling Mountains, northern Inner Mongolia, and the Shandong section during 1980–2020. The Delta region exhibited cultural service growth, while other low-value zones remained stable. Mid- and low-value zones experienced intensified fragmentation in Gansu, Inner Mongolia, and northwestern Shaanxi at the middle reaches. Mid- and high-value clusters dominated Qinghai, Sichuan, northwestern Inner Mongolia, Taihang Mountains, and western Qinling Mountains at upper reaches. From 1980 to 2010, mid- and high-value areas remained stable. In 2020, the area of high-value zones in the upper reaches increased rapidly, and the degree of fragmentation decreased. Upper reaches demonstrated pronounced cultural service enhancements.
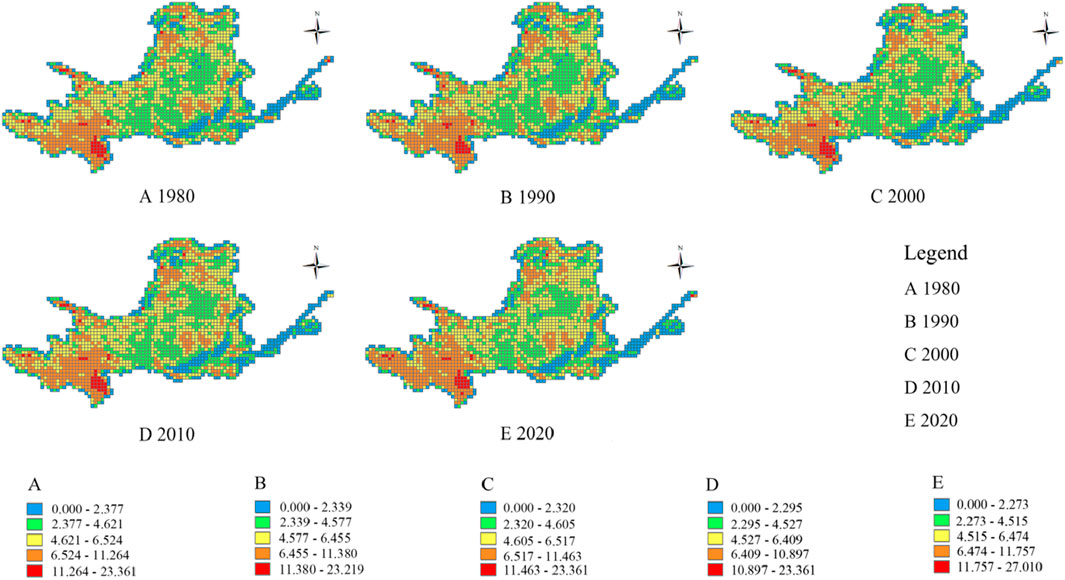
Figure 12. Distribution of cultural services in space.
4.5 Spatiotemporal change in ESV contribution rates
Table 4 demonstrates that the grassland, forests land, and water area dominated ESV contributions during 1980–2020, among which grassland had the most significant contribution rate to the ESV. Cultivated land and wasteland exhibited progressive decline to −0.09 and −1.86, respectively. After the Yellow River ecological construction started in 1999, the contribution of forests land, grassland, water areas, and wetlands gradually increase, on the contrary, the contribution rate of other land categories decline, The increase in the contribution rate of ecological land ESV fully reflects the efficacy of ecological construction in the Yellow River Basin.
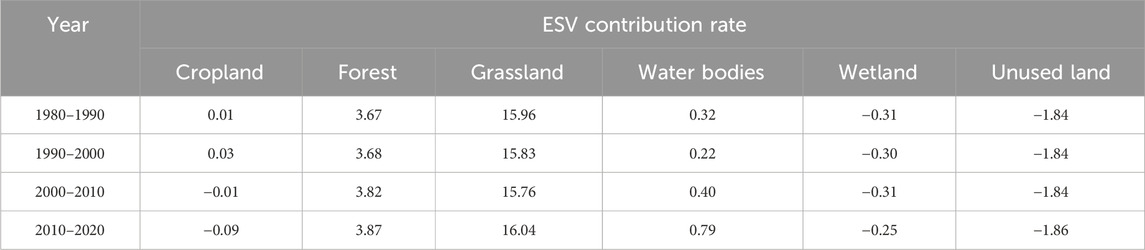
Table 4. Fluctuations in ESV contribution rate in the YRB.
4.6 Driving factor analysis of ESV
Calculating the q values of each driving factor (Table 5) identifies population density, habitat quality, and rainfall as top determinants through geographical detector analysis; thus, these 3 are the main driving factors of ESV in the Yellow River Basin. The elevation, temperature, and GDP score all exceed 0.5, and that of slope, nighttime light, and soil type all exceed 0.4. Temporal analysis revealed strengthening impacts of GDP, nighttime lights, and temperature over study periods.
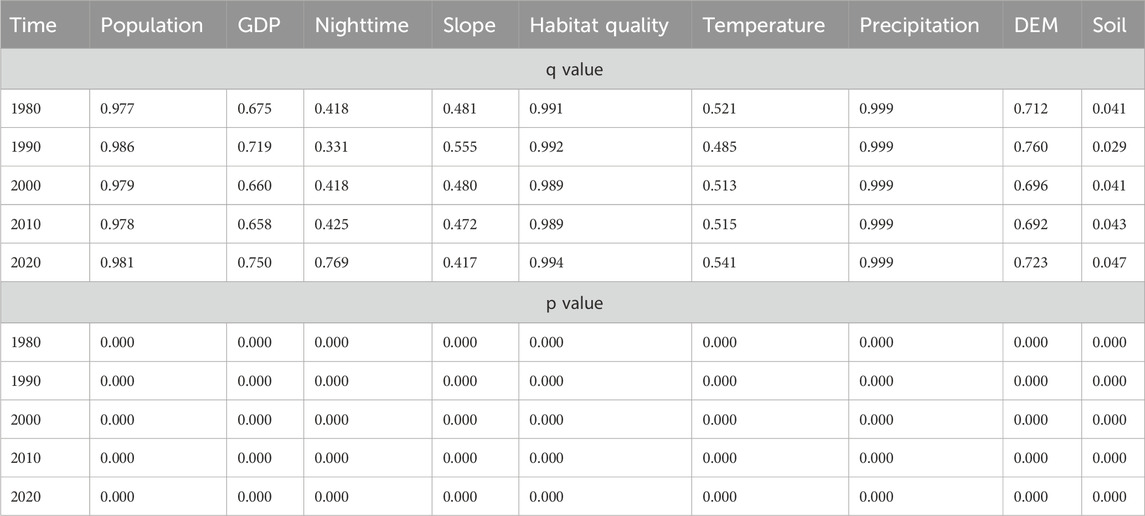
Table 5. Determinants of ESV (q-values).
Figure 13 illustrates that, from 1980 to 2020, the GDP∩soil type, slope∩soil type, temperature∩soil type, and elevation∩soil type showed nonlinear enhancement interactions. Additionally, nighttime lights∩soil type interactions also revealed nonlinear enhancement during 1980–2010. Nighttime lights∩temperature showed a nonlinear enhancement in 1990, while slope∩temperature exhibited a nonlinear trend from 2000 to 2020. Double-factor enhancement characterized remaining interactions throughout the study period. Soil type demonstrated weak synergistic effects across multiple factor combinations. Slope, temperature, and nighttime lights combinations exhibited limited explanatory capacity for ESV variations. These findings corroborate the conclusion drawn from the factor detection analysis that growing impacts of GDP and nighttime lights alongside persistent dominance of population density, habitat quality, and rainfall.

Figure 13. Interaction effects of driving factors.
4.7 Impact factor correlation analysis
As shown in Table 6, the Yellow River Basin is a vast territory, with diverse soil types and a wide distribution range. During the research period, it indicated a robust correlation with ESV’s temporal and spatial changes in the Yellow River Basin. Slope and elevation emerged as secondary natural determinants. Prolonged research time length, the correlation of economic development and human activity influencing factors such as population density, GDP, and nighttime lights becomes significantly stronger. In 1990, large-scale economic construction and grain production were conducted in the Yellow River Basin, and soil type, slope, population density, GDP, and nighttime had the most significant impact. Concurrently, natural and anthropogenic factors established compound correlations affecting ESV patterns. After 2000, various ecological protection and restoration projects were implemented in the Yellow River Basin, and the correlation between ESV’s temporal and spatial changes and natural geographical factors gradually weakened.
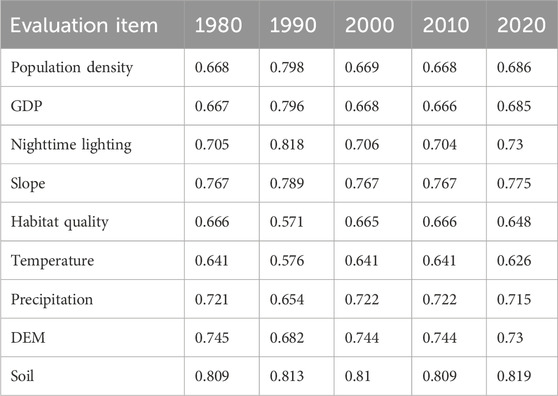
Table 6. Correlation degrees of ESV impact factors in the yellow river basin.
5 Discussion
5.1 Impacts of LUCC and ecological construction on ESV
Land use change is one of the main driving forces behind altering ecosystem service functions (Gomes et al., 2021). Land use transitions represent essential processes for reconciling conflicting land-use interests and mitigating human-land conflicts, with engineered spatial optimization strategies enhancing the structural stability of ecological-productive-living spaces (Liu et al., 2020; Fang et al., 2022). Over the past 4 decades, the implementation of ecological construction such as the Grain for Green Program (Yang et al., 2022), the Three-North Shelter Forest Program (Zhang D. et al., 2021), the Natural Forest Conservation Program (Yu et al., 2023), the Wetland Conservation and Restoration Project (Xiang et al., 2020), the Ecological Protection and Construction Project of the Sanjiangyuan Nature Reserve (Jiang et al., 2022), and the Integrated Ecological Protection and Restoration Project of Mountains, Rivers, Forests, Farmlands, Lakes and Grasslands (Yao et al., 2023) has significantly improved the ecological environment quality, ESV and ecological function recovery in the Yellow River Basin. The construction land in the Yellow River Basin expanded sharply, from 5,224.24 km2 in 1980 to 36,323.85 km2 in 2020, primarily through conversions of cultivated land, grassland, and wetlands. Since the ecological construction after 2000, the area of forests land, wetlands and water area in the Yellow River Basin has grown rapidly, significantly increasing the total ESV. However, the ecological projects also led to a reduction in cultivated land shrinkage, as well as a decrease in the value of supply services (Wei et al., 2023). Large-scale afforestation and construction land expansion have reduced grassland areas, diminishing associated provisioning, regulating, supporting, and cultural services (Yang et al., 2021; Yang et al., 2023). Meanwhile, accelerated construction land growth has intensified spatial fragmentation among land-use categories (Wang J. et al., 2022). Therefore, it is urgent and necessary to implement zonal governance for different functional zones in the Yellow River Basin (Han et al., 2021; Luo and Peji, 2022), especially in the water conservation area in the upper reaches, the Sanjiangyuan National Park, the Loess Plateau, the sand prevention and control area, and the seven major urban agglomerations in the Yellow River Basin.
Ecological construction has driven ESV growth in forests land, wetlands, and water areas, yielding total ESV increase in the Yellow River Basin (Lou et al., 2022). Basin-scale analyses identify rainfall, habitat quality, DEM, GDP, and nighttime lights as primary ESV drivers, corroborating findings by Zhang X. et al. (2021), Fang et al. (2021) and Hasan et al. (2020). Regional-scale assessments reveal climate variables, land-use intensity, economic density, and terrain conditions dominate ESV dynamics in urban clusters (Guo et al., 2022). Urbanization-ESV coupling coordination shows the strongest associations with economic growth, environmental regulation, technological innovation, and NDVI (Zhang K. et al., 2021). Vegetation restoration in the Loess Plateau has significantly improved the quality of ecosystem services, but ecosystem services are mainly affected by factors such as vegetation pathogenic area, precipitation, land use change, urban expansion and population growth (Tang et al., 2022).
The study found that driving factors of ESV in the Yellow River Basin vary at both the basin scale and the regional scale. On the one hand, the spatial evolution characteristics of various land types are closely related to elevation gradients; on the other hand, they are also constrained by the Qinling and Taihang Mountains, creating critical challenges for reconciling land management with ecological restoration (Grêt-Regamey and Bettina, 2020; Peng et al., 2020; Ma et al., 2021). This necessitates adaptive zonal governance integrating population dynamics, LUCC intensity, economic density, and natural capital stocks to formulate spatially-explicit development strategies.
5.2 Implications of LUCC and ecological policies for future ESV change
This study demonstrates that ESV fluctuations in the Yellow River Basin are co-driven by ecological policies, LUCC, natural capital stocks, economic development, and human activities, resulting in regional aggregation and gradient change characteristics of the spatial distribution of ESV in the upper, middle, and lower reaches. In the future, these may constrain high-quality development of ESV in the Yellow River Basin. When promoting economic development and ecological protection in a coordinated manner, policy formulation requires scientifically coordinated coupling of land-use optimization and ecological conservation based upon local conditions. Also, it should ensure the sustainability of high-value zones of ESV in the upper, middle, and lower reaches, as well as spatially balanced economic development and ecological protection.
5.3 Research prospects
1) Based on the data of LUCC, this paper estimated the spatio-temporal changes of ESV in the Yellow River Basin by combining the factor equivalent table. The ESV estimation framework requires enhanced objectivity in per-unit ESV coefficients and improved spatial-scale adaptability. Discrepancies in remote sensing data measurement, transmission, and acquisition introduce errors in ESV calculations.
2) Although this study reveals LUCC-ESV response mechanisms, the Yellow River Basin has a complex ecosystem structure, and the influencing factors show significant differences at the basin scale. Thus, the selected influencing factors in this article cannot comprehensively and precisely reflect the changes in the ESV of the Yellow River Basin, and the assessment of each ESV of the ecosystem is relatively conservative.
3) The results show that the Gansu Province, Taihang Mountains, and Qinling Mountains serve as the demarcation lines for the spatial variations of various ESVs, which has been particularly evident since 2000. Future investigation should decode the reasons for this trend.
6 Conclusion
This study investigates the spatial pattern changes of ESV in the Yellow River Basin from 1980 to 2020, as well as their correlations with LUCC and driving factors across both spatial and temporal dimensions. It analyzes four-decade evolutionary trends in the spatial pattern changes of ESV. It evaluates the driving factors of each ESV in terms of time, space, and socio-economic and natural factors. A comprehensive assessment was conducted on the spatial pattern changes of ESV in the Yellow River Basin, with a specific analysis of the spatial pattern changes of ESV before and after the implementation of ecological policies in 2000. Based on these analyses, the following conclusions were drawn.
1) Forests land, water areas, and wetlands exhibited positive single dynamic degrees during 1980–2020, contrasting with negative trends in cultivated land, grassland, and wasteland. The comprehensive dynamic degree demonstrated exponential growth, the most intense during 2010–2020.
2) Total ESV followed a U-shaped trajectory, first declining and then rising. Similarly, the values of supply services, regulation services, support services and cultural services all demonstrated a trend of initial decline followed by an increase. The recovery of supply services and cultural services was relatively slow. By 2020, the spatial area of regulation services and support services had significantly expanded.
3) From 1980 to 2020, the spatial distribution of various ESVs in the Yellow River Basin exhibited a stepwise change, with significant value accumulation in upper reaches and delta regions. The change of the middle reaches is indistinctive. Notably, Gansu Province, Taihang Mountains, and Qinling Mountains emerged as critical demarcations for ESV spatial stratification within the basin.
4) Soil type, DEM, rainfall, habitat quality, population density, GDP, and nighttime lights significantly impact the spatial distribution and spatio-temporal correlation of ESV. Natural factors demonstrate relatively stable effects on ESVs in the Yellow River Basin, whereas the influence of economic development and human activities on ESV in this region is gradually intensifying.
7 Policy recommendation
In summary, this study synthesizes the research findings, conclusions drawn from prior studies, and the outcomes of this investigation to propose policy recommendations aimed at enhancing ESV, optimizing land resource management, resolving the coupling contradictions within the “ecological-economic” system, and establishing dynamic monitoring mechanisms for ESV in the Yellow River Basin.
1) Implement zonal management and differentiated ecological restoration strategies to enhance the effectiveness of spatial governance. Considering the distinct ecological functions in the Yellow River Basin’s upper, middle, and lower reaches, it is recommended to divide the basin into primary functional zones such as water conservation zones, soil-water retention zones, and urban agglomeration development zones, and establish differentiated management objectives. In the upper reaches, particularly in key water conservation areas such as the Sanjiangyuan region and Qilian Mountains, human activities should be strictly restricted, and efforts should be made to promote the return of grazing land to wetlands programs and glacier protection projects. On the middle Loess Plateau, priority should be given to conducting soil erosion control strategies, including gully dam construction and vegetation restoration. Establishing the mechanisms for wetland ecological compensation in the lower delta area should curb ecological space fragmentation. Urban agglomerations should adopt an integrated regulatory framework combining “ecological redlines” and “development boundaries,” employing measures such as land exchange to mitigate the fragmentation effects caused by the expansion of construction land on ecological spaces.
2) Establish a full-lifecycle management system for land use in the Yellow River Basin to integrate ecological conservation with food security. Develop a dual-effect mechanism, integrating compensation balance and quality enhancement for cultivated land management, and enforce strict protection of high-quality farmland while implementing the grain for green program on slope croplands exceeding 25°. Implement a “grass-determined afforestation” vegetation configuration scheme in arid/semi-arid regions, utilizing drought-tolerant species such as Caragana korshinskii, Hippophae rhamnoides for shrub-grass mixed planting, to address grassland degradation caused by afforestation. Refine the ecological project evaluation framework by incorporating ESV increments and biodiversity indices into acceptance criteria, preventing extensive ecological management models prioritizing spatial coverage over quality.
3) Establish a multi-factor coordinated regulation mechanism to address the coupling contradictions within the ecological-economic system. Pilot a “water-soil-atmosphere-biology” integrated regulation mechanism in key areas such as the 几-shape Bend of the Yellow River Basin, consolidating data platforms for ecological flow monitoring, soil erosion modulus calculation, and carbon trading. Explore establishing a fiscal transfer payment system based on “ecological contribution degree”, with enhanced compensation coefficients for ecological product supply regions, including Gannan and Ruoergai. Promote saline-alkali land remediation models in major grain-producing areas, such as Fenwei Plain, Hetao Irrigation District, to improve cropland quality and enhance carbon sequestration capacity.
4) Enhance the intelligent monitoring and dynamic evaluation system to improve the scientific basis of decision-making. Construct an integrated monitoring network for the Yellow River Basin by combining multi-source remote sensing data with ground observation stations, enabling real-time tracking of ESV changes. Establish a “Digital Twin Basin” for the Loess Plateau, develop predictive and early warning models for ESV, and quantify the dynamic interplay among GDP growth rate, population density thresholds, and ecological carrying capacity. Strengthen the monitoring of biological corridors within key ecological barriers, such as the Qinling and Taihang Mountains, establish a mechanism for tracing policy effectiveness, and provide a robust scientific foundation for dynamically adjusting governance strategies.
Data availability statement
The original contributions presented in the study are included in the article/supplementary material, further inquiries can be directed to the corresponding author.
Author contributions
YL: Data curation, Formal Analysis, Methodology, Software, Writing – original draft, Writing – review and editing. XW: Methodology, Software, Writing – original draft. YW: Conceptualization, Visualization, Writing – original draft, Writing – review and editing. BX: Methodology, Resources, Supervision, Validation, Writing – original draft, Writing – review and editing.
Funding
The author(s) declare that financial support was received for the research and/or publication of this article. This research was funded by the central-level public welfare basic scientific research business funds (No.: CAFYBB2021ZB003).
Conflict of interest
The authors declare that the research was conducted in the absence of any commercial or financial relationships that could be construed as a potential conflict of interest.
Generative AI statement
The authors declare that no Generative AI was used in the creation of this manuscript.
Publisher’s note
All claims expressed in this article are solely those of the authors and do not necessarily represent those of their affiliated organizations, or those of the publisher, the editors and the reviewers. Any product that may be evaluated in this article, or claim that may be made by its manufacturer, is not guaranteed or endorsed by the publisher.
References
Costanza, R., d’Arge, R., De Groot, R., Farber, S., Grasso, M., Hannon, B., et al. (1997). The value of the world’s ecosystem services and natural capital. nature 387, 253–260. doi:10.1038/387253a0
El-Hamid, A. H. T., Mustafa, E. K., Caiyong, W., Hafiz, A. M., and Mustafa, E. K. (2020). Effects of land use/land cover and climatic change on the ecosystem of North Ningxia, China. Arabian J. Geosciences 13, 1099. doi:10.1007/s12517-020-06047-6
Fang, L., Wang, L., Chen, W., Sun, J., Cao, Q., Wang, S., et al. (2021). Identifying the impacts of natural and human factors on ecosystem service in the Yangtze and Yellow River Basins. J. Clean. Prod. 314, 127995. doi:10.1016/j.jclepro.2021.127995
Fang, Z., Ding, T., Chen, J., Xue, S., Zhou, Q., Wang, Y., et al. (2022). Impacts of land use/land cover changes on ecosystem services in ecologically fragile regions. Sci. Total Environ. 831, 154967. doi:10.1016/j.scitotenv.2022.154967
Feng, X., Huang, H., Wang, Y., Tian, Y., and Li, L. (2024). Identification of ecological sources using ecosystem service value and vegetation productivity indicators: a case study of the Three-River Headwaters Region, Qinghai–Tibetan Plateau, China. Remote Sens. 16, 1258. doi:10.3390/rs16071258
Gomes, E., Inácio, M., Bogdzevič, K., Kalinauskas, M., Karnauskaitė, D., and Pereira, P. (2021). Future land-use changes and its impacts on terrestrial ecosystem services: a review. Sci. Total Environ. 781 (2021), 146716. doi:10.1016/j.scitotenv.2021.146716
Grêt-Regamey, A., and Bettina, W. (2020). Global assessment of mountain ecosystem services using earth observation data. Ecosyst. Serv. 46, 101213. doi:10.1016/j.ecoser.2020.101213
Gu, L., Yan, J., Li, Y., and Gong, Z. (2023). Spatial–temporal evolution and correlation analysis between habitat quality and landscape patterns based on land use change in Shaanxi Province, China. Ecol. Evol. 13, e10657. doi:10.1002/ece3.10657
Guo, S., Wu, C., Wang, Y., Qiu, G., Zhu, D., Niu, Q., et al. (2022). Threshold effect of ecosystem services in response to climate change, human activity and landscape pattern in the upper and middle Yellow River of China. Ecol. Indic. 136, 108603. doi:10.1016/j.ecolind.2022.108603
Han, X., Yu, J., Shi, L., Zhao, X., and Wang, J. (2021). Spatiotemporal evolution of ecosystem service values in an area dominated by vegetation restoration: quantification and mechanisms. Ecol. Indic. 131, 108191. doi:10.1016/j.ecolind.2021.108191
Hasan, S. S., Zhen, L., Miah, Md. G., Ahamed, T., and Samie, A. (2020). Impact of land use change on ecosystem services: a review. Environ. Dev. 34, 100527. doi:10.1016/j.envdev.2020.100527
Hu, S., Chen, L., Li, L., Zhang, T., Yuan, L., Cheng, L., et al. (2020). Simulation of land use change and ecosystem service value dynamics under ecological constraints in Anhui Province, China. Int. J. Environ. Res. Public Health 17, 4228. doi:10.3390/ijerph17124228
Jiang, F., Zhang, J., Song, P., Qin, W., Wang, H., Cai, Z., et al. (2022). Identifying priority reserves favors the sustainable development of wild ungulates and the construction of Sanjiangyuan National Park. Ecol. Evol. 12, e9464. doi:10.1002/ece3.9464
Liang, Y., Hashimoto, S., and Liu, L. (2021). Integrated assessment of land-use/land-cover dynamics on carbon storage services in the Loess Plateau of China from 1995 to 2050. Ecol. Indic. 120, 106939. doi:10.1016/j.ecolind.2020.106939
Liao, J., Yu, C., Feng, Z., Zhao, H., Wu, K., and Ma, X. (2021). Spatial differentiation characteristics and driving factors of agricultural eco-efficiency in Chinese provinces from the perspective of ecosystem services. J. Clean. Prod. 288, 125466. doi:10.1016/j.jclepro.2020.125466
Liu, Y., Hou, X., Li, X., Song, B., and Wang, C. (2020). Assessing and predicting changes in ecosystem service values based on land use/cover change in the Bohai Rim coastal zone. Ecol. Indic. 111, 106004. doi:10.1016/j.ecolind.2019.106004
Lou, Y., Yang, D., Zhang, P., Zhang, Y., Song, M., Huang, Y., et al. (2022). Multi-scenario simulation of land use changes with ecosystem service value in the Yellow River Basin. Land 11, 992. doi:10.3390/land11070992
Luo, J., Zhang, X., and Peiji, S. (2022). Land use multi-functionality and zoning governance strategy of densely populated areas in the upper reaches of the Yellow River: a case study of the Lanzhou–Xining region, China. Land 11, 897. doi:10.3390/land11060897
Ma, S., Qiao, Y.-P., Wang, L.-J., and Zhang, J. C. (2021). Terrain gradient variations in ecosystem services of different vegetation types in mountainous regions: vegetation resource conservation and sustainable development. For. Ecol. Manag. 482, 118856. doi:10.1016/j.foreco.2020.118856
Nie, X., Jin, X., Wu, J., Li, W., Wang, H., and Yao, Y. (2023). Evaluation of coastal wetland ecosystem services based on modified choice experimental model: a case study of mangrove wetland in Beibu Gulf, Guangxi. Habitat Int. 131, 102735. doi:10.1016/j.habitatint.2022.102735
Ouyang, Z. Y., Wang, X. K., and Miao, H. (1999). Preliminary study on ecosystem service functions and their ecological-economic values in China’s terrestrial ecosystems. Acta Ecol. Sin. 19 (5), 19–25.
Peng, J., Tian, L., Zhang, Z., Zhao, Y., Green, S. M., Quine, T. A., et al. (2020). Distinguishing the impacts of land use and climate change on ecosystem services in a karst landscape in China. Ecosyst. Serv. 46, 101199. doi:10.1016/j.ecoser.2020.101199
Peng, K., Jiang, W., Ling, Z., Hou, P., and Deng, Y. (2021). Evaluating the potential impacts of land use changes on ecosystem service value under multiple scenarios in support of SDG reporting: a case study of the Wuhan urban agglomeration. J. Clean. Prod. 307, 127321. doi:10.1016/j.jclepro.2021.127321
Pharo, E., and Daily, G. C. (1997). Nature’s services: societal dependence on natural ecosystems. JSTOR 101, 475. doi:10.2307/3244191
Qian, D., Du, Y., Li, Q., Guo, X., and Cao, G. (2021). Alpine grassland management based on ecosystem service relationships on the southern slopes of the Qilian Mountains, China. J. Environ. Manag. 288, 112447. doi:10.1016/j.jenvman.2021.112447
Rehman, E., and Rehman, S. (2022). Modeling the nexus between carbon emissions, urbanization, population growth, energy consumption, and economic development in Asia: evidence from grey relational analysis. Energy Rep. 8, 5430–5442. doi:10.1016/j.egyr.2022.03.179
Schirpke, U., Tscholl, S., and Tasser, E. (2020). Spatio-temporal changes in ecosystem service values: effects of land-use changes from past to future (1860–2100). J. Environ. Manag. 272, 111068. doi:10.1016/j.jenvman.2020.111068
Shao, M., Ma, L., Wang, X., Che, X., Wang, F., Luo, W., et al. (2022). The valuation of ecosystem service value of desertification grassland from 2004 to 2014 in Hexi Corridor, China. J. Desert Res. 42, 63–73. doi:10.7522/j.issn.1000-694X.2021.00172
Shi, J., Li, S., Song, Y., Zhou, N., Guo, K., and Bai, J. (2022). How socioeconomic factors affect ecosystem service value: evidence from China. Ecol. Indic. 145, 109589. doi:10.1016/j.ecolind.2022.109589
Su, K., Wei, D.-Z., and Lin, W.-X. (2020). Evaluation of ecosystem services value and its implications for policy making in China–A case study of Fujian province. Ecol. Indic. 108, 105752. doi:10.1016/j.ecolind.2019.105752
Sun, Q., Qi, W., and Yu, X. (2021). Impacts of land use change on ecosystem services in the intensive agricultural area of North China based on Multi-scenario analysis. Alexandria Eng. J. 60, 1703–1716. doi:10.1016/j.aej.2020.11.020
Tang, Z., Zhou, Z., Wang, D., Luo, F., Bai, J., and Fu, Y. (2022). Impact of vegetation restoration on ecosystem services in the Loess plateau, a case study in the Jinghe Watershed, China. Ecol. Indic. 142, 109183. doi:10.1016/j.ecolind.2022.109183
Wang, B., Niu, X., and Song, Q. F. (2020). Assessment of forest ecosystem services in China and design of value realization pathways. Environ. Prot. 48 (14), 28–36. doi:10.14026/j.cnki.0253-9705.2020.14.006
Wang, J., Li, L., Li, Q., Hu, S., and Wang, S. (2022a). Monitoring spatio-temporal dynamics and causes of habitat quality in Yellow River Basin from the perspective of major function-oriented zone planning. Contemp. Problems Ecol. 15, 418–431. doi:10.1134/s1995425522040126
Wang, J. F., and Xu, C. D. (2017). Geographical detector: principle and prospect. Acta Geogr. Sin. 72 (1), 116–134. doi:10.11821/dlxb201701010
Wang, X., Wu, J., Liu, Y., Hai, X., Shanguan, Z., and Deng, L. (2022b). Driving factors of ecosystem services and their spatiotemporal change assessment based on land use types in the Loess Plateau. J. Environ. Manag. 311, 114835. doi:10.1016/j.jenvman.2022.114835
Wang, Y. Q. (2023). Spatiotemporal evolution and influencing factors of ecosystem service value in the Yellow River Basin. Environ. Sci. 44 (5), 2767–2779. doi:10.13227/j.hjkx.202306163
Wei, H., Wang, Y., Liu, J., Zhang, J., and Cao, Y. (2023). Coordinated development of cultivated land use and ecological protection in cities along the main stream of the Yellow River in Henan Province, China. Ecol. Indic. 156, 111143. doi:10.1016/j.ecolind.2023.111143
Xi, H., Cui, W., Cai, L., Chen, M., and Xu, C. (2021). Spatiotemporal evolution characteristics of ecosystem service values based on NDVI changes in island cities. IEEE Access 9, 12922–12931. doi:10.1109/access.2021.3051244
Xiang, H., Wang, Z., Mao, D., Zhang, J., Xi, Y., Du, B., et al. (2020). What did China’s National Wetland Conservation Program Achieve? Observations of changes in land cover and ecosystem services in the Sanjiang Plain. J. Environ. Manag. 267, 110623. doi:10.1016/j.jenvman.2020.110623
Xiao, R., Lin, M., Fei, X., Li, Y., Zhang, Z., and Meng, Q. (2020). Exploring the interactive coercing relationship between urbanization and ecosystem service value in the Shanghai–Hangzhou Bay Metropolitan Region. J. Clean. Prod. 253, 119803. doi:10.1016/j.jclepro.2019.119803
Xie, G. D., Zhang, C. X., Zhang, L. M., Chen, W. H., and Li, S. M. (2015). Improvement of ecosystem service valuation method based on unit area value equivalent factors. J. Nat. Resour. 30 (8), 1243–1254.
Xie, G. D., Zhen, L., Lu, C. X., Xiao, Y., and Chen, C. (2008). An expert knowledge-based method for ecosystem service valuation. J. Nat. Resour. 23 (5), 911–919. doi:10.1360/ZRZX200805019
Xie, H., Zhang, Y., Choi, Y., and Li, F. (2020). A scientometrics review on land ecosystem service research. Sustainability 12, 2959. doi:10.3390/su12072959
Xing, L., Zhu, Y., and Wang, J. (2021). Spatial spillover effects of urbanization on ecosystem services value in Chinese cities. Ecol. Indic. 121, 107028. doi:10.1016/j.ecolind.2020.107028
Yang, J., Xie, B., and Zhang, D. (2021). The trade-offs and synergistic relationships between grassland ecosystem functions in the yellow river basin. Diversity 13, 505. doi:10.3390/d13100505
Yang, M., Gao, X., Siddique, H. M. K., Wu, P., and Zhao, X. (2023). Spatiotemporal exploration of ecosystem service, urbanization, and their interactive coercing relationship in the Yellow River Basin over the past 40 years. Sci. Total Environ. 858, 159757. doi:10.1016/j.scitotenv.2022.159757
Yang, R., Chen, H., Chen, S., and Ye, Y. (2022). Spatiotemporal evolution and prediction of land use/land cover changes and ecosystem service variation in the Yellow River Basin, China. Ecol. Indic. 145, 109579. doi:10.1016/j.ecolind.2022.109579
Yang, Y., Wang, K., Liu, D., Zhao, X., and Fan, J. (2020). Effects of land-use conversions on the ecosystem services in the agro-pastoral ecotone of northern China. J. Clean. Prod. 249, 119360. doi:10.1016/j.jclepro.2019.119360
Yao, W., Maosheng, Z., Huajun, C., Xin, W., and Chihui, G. (2023). Ecological protection–restoration practice of mountains Rivers forests farmlands Lakes grasslands sands in the Jialu River Basin. Northwest. Geol. 56, 121–128. doi:10.12401/j.nwg.2023095
Yee, H. S., Paulukonis, E., Simmons, C., Russell, M., Fulford, R., Harwell, L., et al. (2021). Projecting effects of land use change on human well-being through changes in ecosystem services. Ecol. Model. 440, 109358. doi:10.1016/j.ecolmodel.2020.109358
Yu, H., Yang, J., Sun, D., Li, T., and Liu, Y. (2022). Spatial responses of ecosystem service value during the development of urban agglomerations. Land 11, 165. doi:10.3390/land11020165
Yu, T., Pang, Y., Meng, S. L., Jia, W., Li, H. K., and Sun, B. (2023). Remote sensing estimation and change analysis of vegetation coverage in the Natural Forest Resources Protection Project area. J. Beijing For. Univ. 45, 1–13. doi:10.12171/j.1000–1522.20220324
Zelený, J., Mercado-Bettín, D., and Müller, F. (2021). Towards the evaluation of regional ecosystem integrity using NDVI, brightness temperature and surface heterogeneity. Sci. Total Environ. 796, 148994. doi:10.1016/j.scitotenv.2021.148994
Zhai, T., Wang, J., Jin, Z., Qi, Y., Fang, Y., and Liu, J. (2020). Did improvements of ecosystem services supply-demand imbalance change environmental spatial injustices? Ecol. Indic. 111, 106068. doi:10.1016/j.ecolind.2020.106068
Zhang, D., Zuo, X., and Zang, C. (2021a). Assessment of future potential carbon sequestration and water consumption in the construction area of the Three-North Shelterbelt Programme in China. Agric. For. Meteorology 303, 108377. doi:10.1016/j.agrformet.2021.108377
Zhang, K., Liu, T., Feng, R., Zhang, Z., and Liu, K. (2021b). Coupling coordination relationship and driving mechanism between urbanization and ecosystem service value in large regions: a case study of urban agglomeration in Yellow river basin, China. Int. J. Environ. Res. Public Health 18, 7836. doi:10.3390/ijerph18157836
Zhang, X., Zhang, G., Long, X., Zhang, Q., Liu, D., Wu, H., et al. (2021c). Identifying the drivers of water yield ecosystem service: a case study in the Yangtze River Basin, China. Ecol. Indic. 132, 108304. doi:10.1016/j.ecolind.2021.108304
Zhang, X., Zheng, Z., Sun, S., Wen, Y., and Chen, H. (2023). Study on the driving factors of ecosystem service value under the dual influence of natural environment and human activities. J. Clean. Prod. 420, 138408. doi:10.1016/j.jclepro.2023.138408
Zhao, Y., Liu, Z., and Wu, J. (2020). Grassland ecosystem services: a systematic review of research advances and future directions. Landsc. Ecol. 35, 793–814. doi:10.1007/s10980-020-00980-3
Zheng, L., Liu, H., Huang, Y., Yin, S., and Jin, G. (2020). Assessment and analysis of ecosystem services value along the Yangtze River under the background of the Yangtze River protection strategy. J. Geogr. Sci. 30, 553–568. doi:10.1007/s11442-020-1742-7
Keywords: yellow river basin, land use change, grid method, ecosystem service value, grey correlation degree, geographical detector
Citation: Li Y, Wang XH, Wan YX and Xu B (2025) Spatial pattern evolution and driving forces of ecosystem service value in the Yellow River Basin. Front. Environ. Sci. 13:1562274. doi: 10.3389/fenvs.2025.1562274
Received: 20 January 2025; Accepted: 18 April 2025;
Published: 14 May 2025.
Edited by:
Yaohui Liu, Shandong Jianzhu University, ChinaReviewed by:
Weifeng Gong, Qufu Normal University, ChinaYanbin Chen, Shandong Normal University, China
Chenhui Zhu, Xinjiang University, China
Copyright © 2025 Li, Wang, Wan and Xu. This is an open-access article distributed under the terms of the Creative Commons Attribution License (CC BY). The use, distribution or reproduction in other forums is permitted, provided the original author(s) and the copyright owner(s) are credited and that the original publication in this journal is cited, in accordance with accepted academic practice. No use, distribution or reproduction is permitted which does not comply with these terms.
*Correspondence: Bin Xu, YmlueHVAdmlwLnNpbmEuY29t